Five Eyes Gov’t Awards R&D Contract to Counterdrone Co.

Source: Streetwise Reports (4/2/24)

DroneShield Ltd. announced it has been awarded an AU$900,000 research and development contract by a Five Eyes government. Find out why one research firm names it one of the most important military AI companies. 

DroneShield Ltd. (DRO:ASX; DRSHF:OTC) announced it has been awarded an AU$900,000 research and development contract by a Five Eyes government.

The Five Eyes intelligence alliance was born out of the World War II era and includes Australia, Canada, New Zealand, the United Kingdom, and the United States.

DroneShield said the contract specifically aims to leverage the potential of the company’s DroneSentry-X Mk2 and provide a set of software tools to enhance end-user capabilities in the counter-unmanned aerial systems (C-UAS) domain.

“DroneShield’s radio frequency jamming capability has been recognized globally as highly effective in defeating nefarious drones,” DroneShield Chief Technical Officer Angus Bean said. “This new contract highlights that the DroneSentry-X Mk2 is a step-function in smart- jamming capabilities. We are looking forward to delivering on the capabilities the Defense users are looking for.”

The company said the contract “aligns closely” with its current technology roadmap. “Software controlled multi-channel wideband disruption allows for not only optimized channel management, frequency management, power usage, and optimization, but the addition of custom waveforms targeted at various threats,” DroneShield noted in a release.

One of the Most Important Military AI Companies

DroneShield provides C-UAS protection with a focus on radio frequency sensing, artificial intelligence (AI) machine learning, sensor fusion, electronic warfare, rapid prototyping, and MIL-SPEC manufacturing, the company’s website said.

Its technology uses “a multi-layered artificial intelligence-based solution for both detection and defeat, with smart, non-kinetic defeat.”

The company offers “protection against a wide range of improvised threats” through UAV (unmanned aerial vehicles), UGV (unmanned ground vehicles), USV (unmanned surface vehicles), and UUV (unmanned underwater vehicles).

Bell Potter analyst Daniel Laing gave the stock a Buy rating and an AU$0.90 per share price target.

DroneShield showed record results with its first profitable year in 2023, “with AU$9.3 million profit after tax.”

“DroneShield has had an outstanding last 12 months, which has been reflected in the share price performance YTD,” Bell Potter analyst Daniel Laing wrote in a research note on March 4. Laing gave the stock a Buy rating and an AU$0.90 per share price target.

McAlinden Research Partners has rated DroneShield as one of the most important military AI companies as defense orders outpace equipment losses in Ukraine.

The Catalyst: A ‘New Generation of Disruption Capabilities’

The new contract represents “the start of an entirely new generation of disruption capabilities,” DroneShield Chief Executive Officer Oleg Vornik said.

“DroneShield products are considered to be market leading by many governments around the world,” he continued. “We pride ourselves on setting the global benchmark.”

As drone protocols are designed to move away from RF interference and work in high-noise, high-clutter environments means that traditional disruption methods may become less effective. A software approach to stay one step ahead has become important to successful disruption systems, the company noted.

Technical Analyst Clive Maund wrote in 2023 that DroneShield looked “set to succeed.” In February, he wrote: “After starting higher again in November, it has advanced in a classic bullish staircase pattern, but over the past week or two the advance has accelerated dramatically with the price at last breaking out to new all-time highs, an impressive move given the number of shares in issue.”

Laing commented on DroneShield’s current sales pipeline of AU$510 million, with AU$388 million of potential orders this year.

“DRO’s confidence in the sales pipeline is reflected in its recent investment (committed supply chain payments of AU$30m) in its inventory balance, which we view as a leading indicator of near-term sales announcements,” Laing noted.

Darren Odell of Peloton Capital also predicted good things for DroneShield, writing in July 2023 that the company had “already exceeded 2023 revenue estimates.”

Streetwise Ownership Overview*

DroneShield Ltd. (DRO:ASX; DRSHF:OTC)

Retail: 75.01%
Institutions: 13.99%
Management and Insiders: 11%
75.0%
14.0%
11.0%
*Share Structure as of 1/24/2024


Ownership and Share Structure

Management and insiders own 11% of the company. CEO Oleg Vornik owns 2.23% of the company with 15 million options, on a fully diluted basis. Non-Executive Chairman Peter James owns 0.58% of the company with 920k shares and 3 million options, on a fully diluted basis, and Non-Executive Director Jethro Marks owns 0.22%, with 1.5 million options, on a fully diluted basis, according to DroneShield.

The company reports that the largest independent investor, Charles Goode, owns 4.41% of the company with 21.5 million shares, while strategic investors own a total of 13.99% of the company.

Eprius Inc. is the second largest shareholder, with 3.16% of the company with 18.5 million shares.

In its February 2023 placement, Droneshield said that it brought ten new institutional investors on board, but it has not yet released more details.

The company reports that there are about 616 million shares outstanding, and about 526 million free-float traded shares. Its market cap is about AU$499.37 million, and it trades in a 52-week range of AU$0.93 and AU$0.21.


Important Disclosures:

  1. As of the date of this article, officers and/or employees of Streetwise Reports LLC (including members of their household) own securities of DroneShield Ltd.
  2. Steve Sobek wrote this article for Streetwise Reports LLC and provides services to Streetwise Reports as an employee.
  3.  This article does not constitute investment advice and is not a solicitation for any investment. Streetwise Reports does not render general or specific investment advice and the information on Streetwise Reports should not be considered a recommendation to buy or sell any security. Each reader is encouraged to consult with his or her personal financial adviser and perform their own comprehensive investment research. By opening this page, each reader accepts and agrees to Streetwise Reports’ terms of use and full legal disclaimer. Streetwise Reports does not endorse or recommend the business, products, services or securities of any company.

For additional disclosures, please click here.

Inflationary pressures in Europe continue to decline. OPEC+ countries continued their voluntary production cuts

By JustMarkets

Stock indices traded mixed on Wednesday, with the Dow Jones Industrials (US30) falling to a two-week low. Stocks rebounded late in the day after bond yields retreated from early highs following an unexpected decline in the ISM Services Business Activity Index for March in the US. At yesterday’s close, the Dow Jones (US30) index was down 0.11%, while the S&P 500 (US500) Index was up 0.11%. The NASDAQ Technology Index (US100) closed positive 0.23%.

The March US employment change from ADP rose by 184,000, which was stronger than expectations of 150,000. Additionally, the February ADP figure was revised upward to 155,000 from the previously reported 140,000. The data points to a robust US labor market.

Atlanta Fed President Bostic said yesterday that due to the uneven nature of inflation progress, it will likely be appropriate for the Fed to cut interest rates later this year, in the fourth quarter.

Ford Motor (F) shares closed higher by more than 2% after the company reported a 7% increase in US auto sales in the first quarter due to strong demand for gas-electric hybrid vehicles. Intel (INTC) is down more than 8% and topped the list of losers on the Dow Jones (US30) and NASDAQ (US100) markets after the company said losses in its fab business have gotten worse, and the division may not reach its break-even point for several years.

Equity markets in Europe were mostly up on Wednesday. Germany’s DAX (DE40) rose by 0.46%, France’s CAC 40 (FR40) closed up 0.29%, Spain’s IBEX 35 (ES35) added 0.52%, and the UK’s FTSE 100 (UK100) closed positive 0.03%.

The Eurozone Consumer Price Index for March declined to 2.4% y/y from 2.6% y/y in February, better than expectations of 2.5% y/y. The core CPI declined to 2.9% y/y in March from 3.1% y/y in February, better than expectations of 3.0% y/y and the slowest growth rate in 2 years. The Eurozone unemployment rate for February was unchanged at a record low of 6.5%, beating expectations of a decline to 6.4%. The disinflation trend coincided with recent remarks by ECB policy director Robert Holzmann, who said that a slowdown in price growth could make a June rate cut appropriate.

Financial stocks led the gains on the corporate front, with BNP Paribas, Intesa Sanpaolo, and Santander adding more than 1.5%. German auto giants also rose significantly, with Volkswagen adding 2.5% and BMW jumping more than 5%. Finally, Siemens closed in the green after clarifying that it has no plans to make an offer to buy British engineering company Renishaw.

WTI crude oil prices fell slightly and are trading just below $86 per barrel after the latest EIA data showed an unexpected rise in US inventories. US crude inventories rose by 3.21 million barrels instead of the expected decline of 1.511 million barrels. Nevertheless, prices remained near 5-month levels as traders were concerned that the Middle East’s geopolitical tensions could disrupt oil supplies. In addition, OPEC+ countries decided to extend a voluntary production cut of 2.2 million barrels per day until June to stabilize the market.

Copper prices rose to $4.2 a pound, the highest since April last year, amid a weaker dollar after evidence of falling inflation strengthened the case for lower interest rates. Data compiled by ISM showed that prices in the service sector rose by the least in four years. Copper prices were also boosted by good economic data from China, which refuted fears of weaker demand in the country.

Asian markets were mostly down yesterday. Japan’s Nikkei 225 (JP225) fell by 0.97%, China’s FTSE China A50 (CHA50) decreased by 0.31%, Hong Kong’s Hang Seng (HK50) was down 1.22% by Wednesday’s close and Australia’s ASX 200 (AU200) was negative 1.34%.

Judo Bank Australia’s composite business activity index rose to 53.3 in March 2024 from 52.1 in the previous month. Australia’s private sector output growth accelerated sharply at the end of the first quarter, reaching the fastest pace in almost two years. This was mainly due to strong service sector growth, although output continued to contract.

S&P 500 (US500) 5,211.49 +5.68 (+0.11%)

Dow Jones (US30) 39,127.14 −43.10 (−0.11%)

DAX (DE40) 18,367.72 +84.59 (+0.46%)

FTSE 100 (UK100) 7,937.44 +2.35 (+0.03%)

USD Index 104.26 −0.55 (−0.53%)

Important events today:
  • – Australia Services PMI (m/m) at 01:00 (GMT+3);
  • – Australia Retail Sales (m/m) at 03:30 (GMT+3);
  • – Switzerland Consumer Price Index (m/m) at 09:30 (GMT+3);
  • – German Services (m/m) PMI at 10:55 (GMT+3);
  • – Eurozone Services (m/m) PMI at 11:00 (GMT+3);
  • – UK Services PMI (m/m) at 11:30 (GMT+3);
  • – Eurozone Producer Price Index (m/m) at 12:00 (GMT+3);
  • – Eurozone ECB Monetary Policy Meeting Accounts at 14:30 (GMT+3);
  • – Canada Trade Balance (m/m) at 15:30 (GMT+3);
  • – US Trade Balance (m/m) at 15:30 (GMT+3);
  • – US Initial Jobless Claims (w/w) at 15:30 (GMT+3);
  • – US Natural Gas Storage (w/w) at 17:30 (GMT+3).

By JustMarkets


This article reflects a personal opinion and should not be interpreted as an investment advice, and/or offer, and/or a persistent request for carrying out financial transactions, and/or a guarantee, and/or a forecast of future events.

Expert Shares the Best Silver Stocks for the Breakout

Source: Ron Struthers (4/3/24) 

Ron Struthers of Struthers Resource Stock Report compares six silver stocks to the SLV ETF, shares Pan American, a gold producer with many silver lines, and touches on Mag Silver, which he believes is not well known enough. 

This chart compares the silver ETD ‘SLV’ to 5 well-known silver producers, Hecla, Coeur Mining, Majestic Silver, Mag Silver, and Pan American Silver. Also, non-producer Discovery Silver.

Like gold stocks, silver stocks are beaten up. SLV shows a 40% gain since the September/October 2022 bottom, while only Coeur Mining has outperformed, but that is because it is really a gold producer now. Hecla has almost caught SLV, and Pan American shows a small gain during the comparison period.

Coeur Mining Inc. (CDE:NYSE) might be remembered as a silver stock, but in 2023, 70% of its revenue came from gold. They do have about an equal value of reserves in silver compared to gold, so there is still leverage to silver. Couer stock has moved up lately, and that is related to the gold price increase.

First Majestic Silver Corp. (FR:TSX; AG:NYSE; FMV:FSE) used to be one of my favorites, but I am not too happy with their performance of late. In 2023, production was 26.9 million silver equivalent (AgEq) ounces, consisting of 10.3 million silver ounces and 198,921 gold ounces. It gets about 60% of its revenue from silver.

Hecla Mining Co. (HL:NYSE) is an old well, well-known silver stock, and currently about 60% of revenues are from silver production. It should do well with rising silver prices.

Two silver stocks lagging on the chart that should do more than catch up are Pan American Silver and Mag Silver, so I am adding these two to our Selection list along with Discovery Silver as huge leverage to silver and a take-over target and also lagging silver on the chart.

Pan American Silver

Recent Price – $15.80

Dividend yield – 2.5%

Shares Outstanding – 364.7

Pan American Silver Corp. (PAAS:TSX; PAAS:NASDAQ) trades like and is valued like a silver company, but it is really a gold company when it comes to production, so it is one of the gold stocks that has lagged recently.

However, Pan American has huge silver resources, over 1 billion ounces Measured and Indicated, so it is like a gold stock with several silver linings.

  • For 2023, silver production was 4 million ounces, and gold production was 882,900 ounces.
  • For silver, they realized a price of $22.94, so gross revenue was about $468 million.
  • For gold, they realized a price of $1,951/oz, so gross revenue was $1.72 billion.

You can see that gold is over 70% of revenues, but the stock has not responded to the rising gold price, as well as many other gold stocks.

They have 1,033,800,000 M&I ounces of silver at $6/oz in the ground is about $6 billion value, and 16,083,600 M&I ozs gold at $150/oz in the ground is about $2.4 billion.

PAAS has a market cap of US$7.76 billion, less cash plus debt, for a value of $6.12 billion. You can look at the stock as either the silver is valued cheaply or the gold is valued cheaply. The current dividend gives about a 2.5% yield, and I expect this to rise as gold and silver go higher.

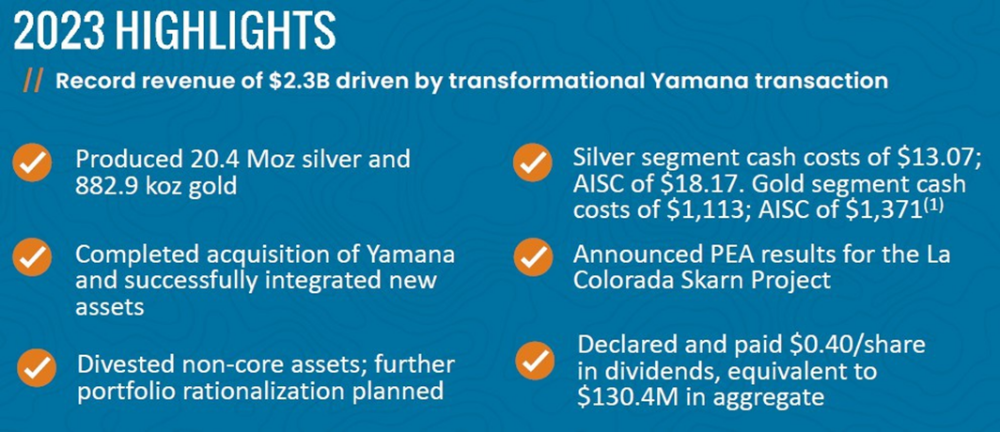
Pan American enters 2024 in a solid financial position with cash and short-term investments totaling $440.9 million and the full $750.0 million available under our undrawn credit facility. Total debt of $801.6 million was related to construction and other loans, leases, and two senior notes Pan American assumed through the acquisition of Yamana.

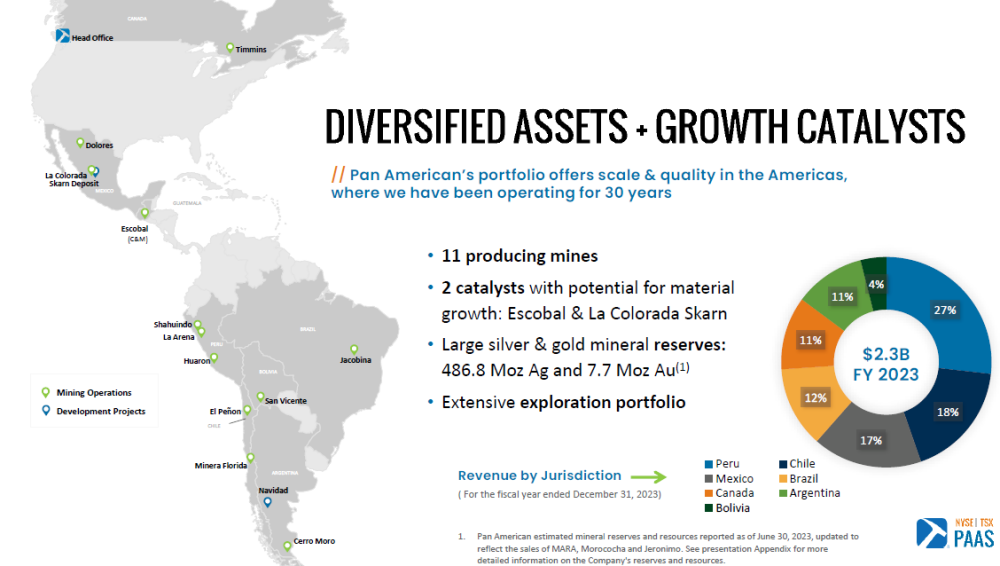
Pan American acquired Yamana Gold this year, which will drive growth in 2024. The company is very diversified, with 11 producing mines, so rather than get into each mine, this graphic from their presentation gives you a good idea of the diversity.

Conclusion

The company is well diversified and in strong financial shape. Their gold and silver ounces are valued cheaply like most miners now, but I don’t believe the stock has responded as well to the rising gold price as others. I see it catching up.

The company believes its stock is undervalued as well because it announced a normal course issuer bid to buy back up to 5% of the stock. They will have rising revenues and cash flow for 2024.

Its guidance for 2024 is 21 to 23 million ounces of silver at AISC of $16 to $18.50 per ounce. For gold, it is projecting 880,000 to 1 million ounces of production at AISC of $1,475 to $1,575. PAAS will have very good margins for 2024, and the higher gold and silver prices will add significantly to this.

Of note, and because New Pacific Metals -NUAG is on our list, Pan American owns an ~11.6% undiluted interest in New Pacific, which is advancing the Silver Sands exploration project in Bolivia.

Don’t be surprised if Pan American buys out New Pacific. The stock is way down from 2020/2021 highs, so it has lots of legroom to the upside. We need to see a close above $17 for a higher high and confirm the turnaround. I see that soon.

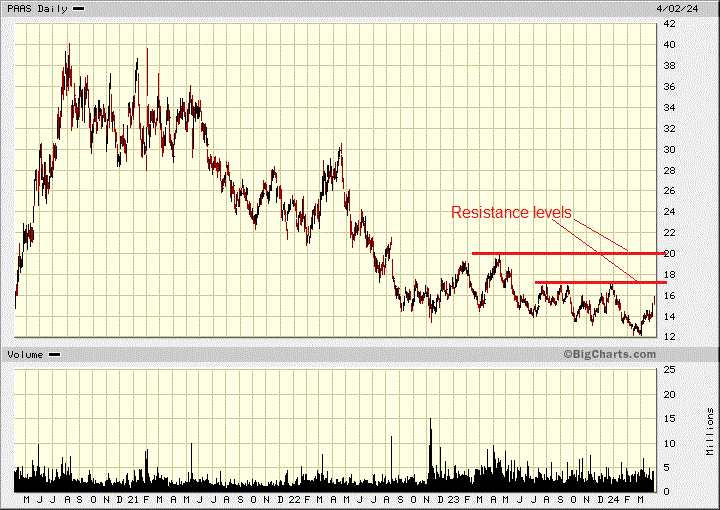
I believe the stock could easily break the $20 resistance and get back close to $30 or better this year.

That makes the Call Options attractive as well. I like the January 2025 $20 Call option for US$2.50.

Mag Silver 

Recent Price – US$11.45

Share Outstanding – 103 Million

Mostly Institutional held –  owning 70%

No debt and US$68.7 million cash on Dec 31, 2023

I have followed MAG Silver Corp. (MAG:TSX; MAG:NYSE American) for many years.

It is a relatively new producer because its mine just started production in 2023, so it is probably not known so much as a major silver producer. This principal asset is a 44% interest in the Juanicipio Mine located in Zacatecas, Mexico, which achieved commercial production at its 4,000 tonnes per day (“tpd”) processing facility on June 1, 2023.

MAG’s partner is Fresnillo Plc., a London-based company that debuted on the London Stock Exchange in 2008 following a successful, profitable, and decades-long track record as a Mexican mining company.

Due to its history as part of the Peñoles Group, Fresnillo can trace its origins back to the commencement of Peñoles’ mining operations in 1887 and smelting and refining operations at Torreon in 1901. The Juanicipio mine is high grade at 472 g/t silver and low cost at $9.18/oz AISC, so it will be a real cash cow for Mag Silver now that it is in production. A mine does not get much better than this one, and I don’t think the stock reflects this fact.

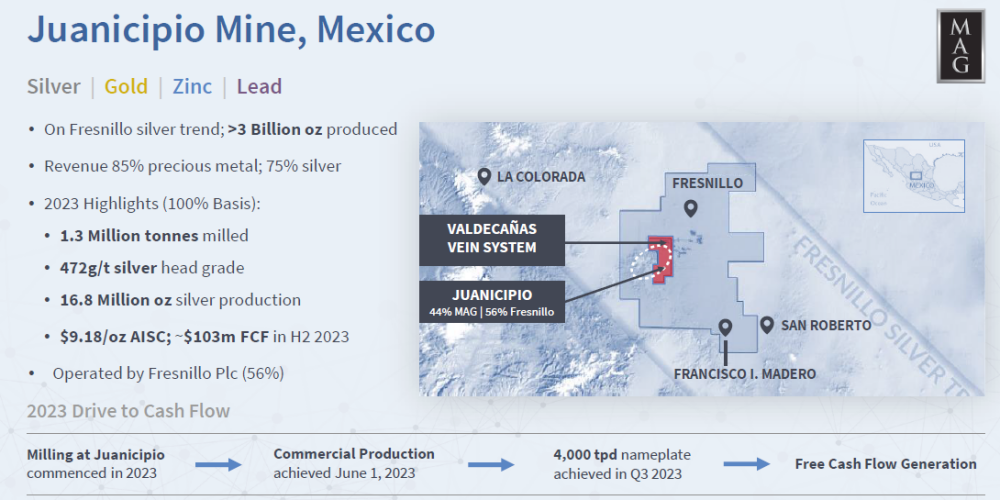
The silver recoveries are good at 88%, and in the last half of 2024, the mine generated a free cash flow of about $103 million, of which $33.4 million went to Mag Silver.

This is a great slide from their presentation that shows free cash flow at very conservative base case pricing and at spot prices.

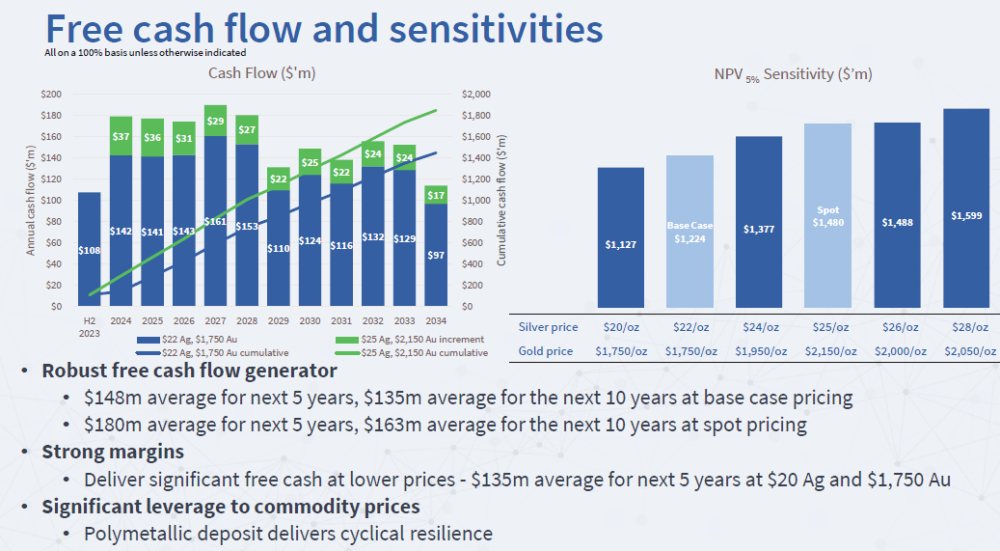
Free cash flow of $180 M/year at current spot prices. If we get the prices I expect, hang on tight.

The mine has M&I resources of 406,277,000 AgEq ounces — Mag Silver 44% would be 178,740 ounces. The current valuation for MAG is about $6/oz silver, which is about the average of other companies, but this is an above-average mine.

There is tons of upside exploration potential here, so it will be a very long mine life, and the potential the mill rate could be expanded in a few years to increase production.

Conclusion

About 75% of revenue is from silver, so this is a pretty pure play on silver. Cash flow for the fourth quarter was around US$36 million, and with higher silver prices, we could easily see cash flow in 2024 for MAG around $160 million.

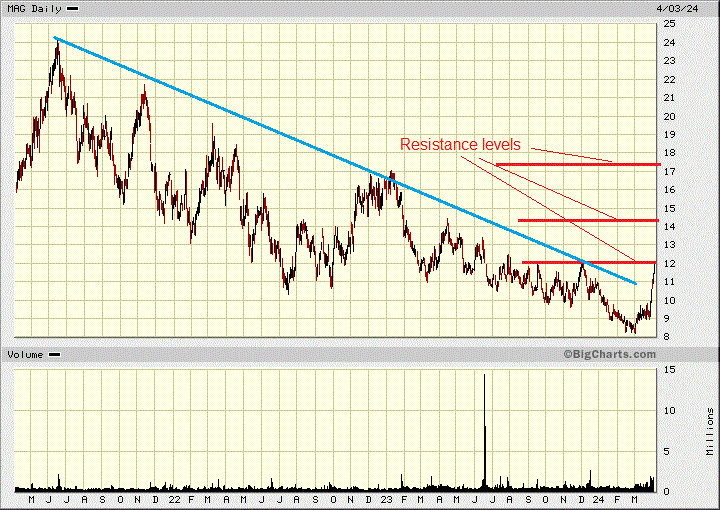
The stock is trading at around 11.5 times cash flow, according to MarketWatch. If it simply maintains that multiple, the stock should move to about $18.00 in 2024. On the chart, the long-term downtrend has been broken, and the stock is about to break out to a higher high and above the first resistance, around $12.00.

Discovery Silver

Recent Price – CA$0.85

Shares Outstanding – 395 million.

Eric Sprott owns 23% and Institutions 37%

Many of you will remember Discovery Silver Corp. (OTCMKTS:DSVSF) as it was on the Selection List for quite a while, but we got stopped out in 2022 at $1.55.

We can buy back much cheaper now. Discovery’s flagship project is its 100%-owned Cordero project, the world’s largest undeveloped silver deposit. The feasibility study completed in February 2024 demonstrates that Cordero has the potential to be developed into a large-scale, long-life project with low unit costs and attractive economic returns that offers the combination of margin, size, and scalability.

Cordero is located close to infrastructure in a prolific mining belt in Chihuahua state, Mexico. In the chart below, Mag Silver would fit between Ays and Hecla.

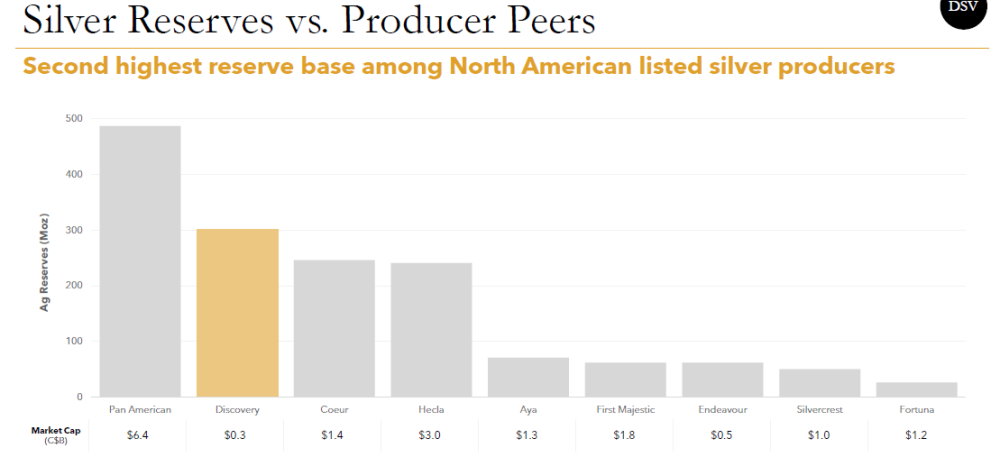
Summary of Cordero feasibility study results:

  • Large-scale, long-life production: 19-year mine life with an average annual production of 37 million ounces silver equivalent in concentrate in year 1 to year 12 and 33 Moz AgEq in concentrate over the life of the mine;
  • Highly profitable: low unit costs with all-in sustaining costs per AgEq ounce of under $12.50 (U.S.) in year one to year eight and under $13.50 (U.S.) over the LOM, placing Cordero in the bottom half of the cost curve;
  • Tier 1 reserve base: reserves of silver: 302 Moz, gold: 840,000 oz, lead: 3.0 billion pounds, and zinc: 5.2 billion pounds, positioning Cordero as the largest undeveloped silver deposit globally;
  • Clear upside potential: 240 million tonnes of measured and indicated resource sit outside of the feasibility study pit, highlighting the potential to materially extend the mine life at modestly higher silver prices;
  • Low capital intensity: initial development capital expenditures of $606 million resulting in an attractive after-tax net present value to capital expenditure ratio of 2.0;
  • Attractive economics: base-case after-tax net present value discounted at 5% of $1.2 billion (U.S.), growing to $2.2 billion (U.S.) in year 4, when the project reaches final completion to 51,000 tonnes per day.

Conclusion

On December 31, Discovery had a strong cash position of almost CA$59 million, so they have plenty enough to move this through permitting to the construction phase. DSV submitted an Environmental Impact Assessment (MIA) in August 2023; the review process is ongoing.

The deposit is massive. With the Feasibility and more drilling, the Measured & Indicated Resource grew by 70 Moz AgEq to 1,202 Moz AgEq within the pit outline.

Discovery has a market cap of US$255 million less cash, a value of about US$210 million. This puts a value per ounce of a measly US$0.17 cents. I expect a lower valuation with a lower grade deposit, but the average grade in the first few years of mine life is around 100 g/t silver, which is pretty decent for an open pit.

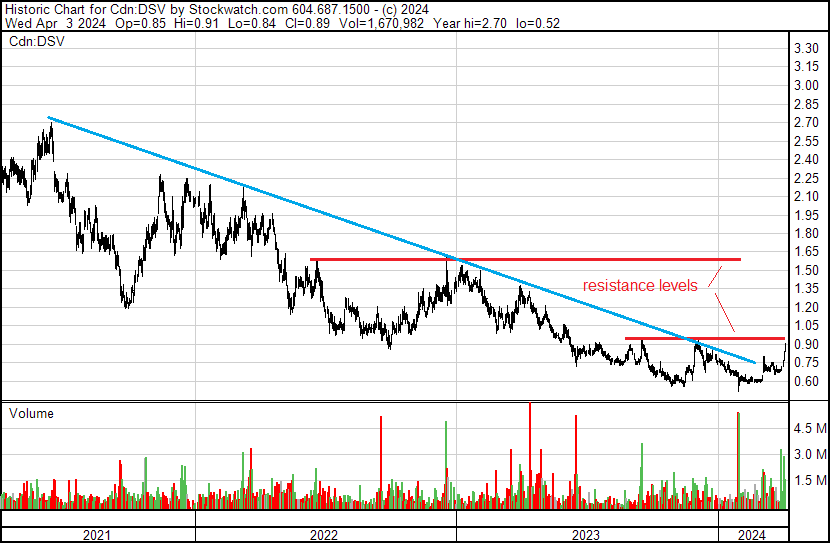
As you can see on the chart, this had a much higher valuation with fewer ounces and about the same silver price, but it is beaten down like every miner. The downtrend is broken, and the stock is close to breaking out to a higher high and resistance around $0.95. From here, it could soon get back to the $1.50 area.

As you have probably noticed from yesterday’s report, silver broke out today, currently at $26.77 on Comex.

I bought silver coins from my dealer yesterday, Colonial Acres. It is the most silver coin I have seen in stock there for years. I would not wait long; I expect this will soon get bought up.


Important Disclosures:

  1. Mag Silver Corp. is a billboard sponsor of Streetwise Reports and pays SWR a monthly sponsorship fee between US$4,000 and US$5,000.
  2. As of the date of this article, officers and/or employees of Streetwise Reports LLC (including members of their household) own securities of Pan American Silver Corp.
  3. Ron Struthers: I, or members of my immediate household or family, own securities of: Pan American Silver Corp. and Discovery Silver. I determined which companies would be included in this article based on my research and understanding of the sector.
  4. Statements and opinions expressed are the opinions of the author and not of Streetwise Reports, Street Smart, or their officers. The author is wholly responsible for the accuracy of the statements. Streetwise Reports was not paid by the author to publish or syndicate this article. Streetwise Reports requires contributing authors to disclose any shareholdings in, or economic relationships with, companies that they write about. Any disclosures from the author can be found  below. Streetwise Reports relies upon the authors to accurately provide this information and Streetwise Reports has no means of verifying its accuracy.
  5.  This article does not constitute investment advice and is not a solicitation for any investment. Streetwise Reports does not render general or specific investment advice and the information on Streetwise Reports should not be considered a recommendation to buy or sell any security. Each reader is encouraged to consult with his or her personal financial adviser and perform their own comprehensive investment research. By opening this page, each reader accepts and agrees to Streetwise Reports’ terms of use and full legal disclaimer. Streetwise Reports does not endorse or recommend the business, products, services or securities of any company.

For additional disclosures, please click here.

Struthers Resource Stock Report Disclosures

All forecasts and recommendations are based on opinion. Markets change direction with consensus beliefs, which may change at any time and without notice. The author/publisher of this publication has taken every precaution to provide the most accurate information possible. The information & data were obtained from sources believed to be reliable, but because the information & data source are beyond the author’s control, no representation or guarantee is made that it is complete or accurate. The reader accepts information on the condition that errors or omissions shall not be made the basis for any claim, demand or cause for action. Because of the ever-changing nature of information & statistics the author/publisher strongly encourages the reader to communicate directly with the company and/or with their personal investment adviser to obtain up to date information. Past results are not necessarily indicative of future results. Any statements non-factual in nature constitute only current opinions, which are subject to change. The author/publisher may or may not have a position in the securities and/or options relating thereto, & may make purchases and/or sales of these securities relating thereto from time to time in the open market or otherwise. Neither the information, nor opinions expressed, shall be construed as a solicitation to buy or sell any stock, futures or options contract mentioned herein. The author/publisher of this letter is not a qualified financial adviser & is not acting as such in this publication.

Target Thursdays: EURJPY, USDCHF & XAUUSD reach targets!

By ForexTime 

Check out these potential profits that you may have missed from our Daily Market Analysis.

  • EURJPY bulls take home 84 pips
  • USDCHF secures all bullish targets
  • XAUUSD hits 2nd profit level

​​​​​​​

    1) EURJPY up over 200 pips this week

  • Where and when was Target Price (TP) published?

As discussed in our mid-week technical outlook on Wednesday, April 3rd:

“Focusing on the technical picture, a possible near-term level where EURJPY bulls may expect some resistance before reaching the 165.335 price target is 164.208.


  • What happened since TP was published?

The EURJPY rallied over 100 pips on Wednesday, as the Japanese Yen weakened across the G10 space.


  • How much in potential profits?

Traders who took advantage of the breakout above the 161.8 Fibonacci level at 163.368 and exited at 164.208 would have been rewarded with 84 pips!


    2) USDCHF blasts past all bullish targets

  • Where and when was Target Price (TP) published?

This technical scenario (USDCHF) is based on the FXTM Signals that are posted twice a day (before the London and New York sessions) for all FXTM clients to follow.

It can be found in the MyFXTM profile under Trading Services… FXTM Trading Signals.


  • What happened since TP was published?

The USDCHF jumped this morning after Switzerland’s inflation report surprised to the downside in March.

This report has reinforced expectations around the Swiss National Bank (SNB) cutting interest rates once again in June, weakening the Swiss franc as a result.  


  • How much in potential profits?

USDCHF has hit all its profit targets.

Traders who entered at 0.90356 and exited at the final target level of 0.90516 would have gained 16 pips.


    3) XAUUSD hits second bearish level    

  • Where and when was Target Price (TP) published?

This technical scenario (XAUUSD) is based on the FXTM Signals that are posted twice a day (before the London and New York sessions) for all FXTM clients to follow.

It can be found in the MyFXTM profile under Trading Services… FXTM Trading Signals.


  • What happened since TP was published?

After kissing a fresh all-time high during the early sessions of Thursday, gold seems to be experiencing a technical throwback on the M30 timeframe as bulls take a breather.

Note: The precious extended gains on Wednesday thanks to dovish comments from Fed Chair Jerome Powell. More volatility could be on the cards for gold due to Fed speeches and the highly anticipated US jobs report on Friday.


  • How much in potential profits?

Gold has hit the second take-profit level.

This is equivalent to a 523-point move from the entry price of $2296.25.


Forex-Time-LogoArticle by ForexTime

ForexTime Ltd (FXTM) is an award winning international online forex broker regulated by CySEC 185/12 www.forextime.com

Oil prices continue to rise steadily. There is an outflow of funds from Bitcoin ETFs

By JustMarkets

At the end of yesterday, the Dow Jones Index (US30) was down 1.00%, while the S&P 500 Index (US500) decreased by 0.72%. The NASDAQ Technology Index (US100) closed negative 0.95%. Stocks declined as 10-year T-note yields rose to a 4-month high on Tuesday amid strong economic data. The US ISM manufacturing index rose the most in 1.5 years, dampening prospects for a Fed rate cut.

San Francisco Fed President Daley said yesterday that three 25 bps rate cuts in 2024 are a “reasonable baseline projection”. However, there is no need to cut rates now, given the economy’s strength. She added that if inflation is more resilient, the Fed could cut rates less, and if inflation falls faster, a rate cut may be warranted.

The February JOLTS survey unexpectedly increased US job openings by 8,000 to 8.756 million, indicating a stronger labor market than expectations of a decline to 8.730 million.

Tesla (TSLA) is down more than 5% and topped the NASDAQ (US100) losers list after reporting first-quarter vehicle deliveries of 386,810 units, well below the consensus forecast of 449,080 units.

Bitcoin (BTC/USD) fell more than 5% to a one-week low on Tuesday, dragged down by falling demand for bitcoin ETFs and stronger-than-expected US economic news that pushed back the prospect of a Federal Reserve interest rate cut. According to Bloomberg, investors withdrew $86 million from 10 spot bitcoin ETF funds on Monday.

Equity markets in Europe were mostly down on Tuesday. Germany’s DAX (DE40) fell by 1.13%, France’s CAC 40 (FR40) closed down 0.92% yesterday, Spain’s IBEX 35 (ES35) declined 0.89%, and the UK’s FTSE 100 (UK100) closed negative 0.22%.

S&P’s Eurozone Manufacturing PMI for March was revised upward by 0.4 to 46.1 from a previously reported reading of 45.7. The ECB’s 1-year inflation expectations for February fell to 3.1% from 3.3% in January, the lowest in 2 years. The Eurozone will release March inflation data today, which will be closely watched amid speculation that the European Central Bank is preparing to cut rates in June. Eurozone inflation has remained high since the start of the year and needs to fall further for the ECB to go for a summer rate cut, so the next three inflation reports are key for markets. If inflation delivers an upward surprise, bets for a rate cut will be pushed back.

WTI crude prices rose above $85 a barrel on Tuesday, hitting their highest level since October. Oil supplies faced fresh threats from attacks on Russian energy facilities by Ukraine and escalating conflict in the Middle East. Iran vowed to retaliate against Israel for an airstrike that killed two of its top generals and five other military advisers at the Iranian embassy compound in Damascus. In addition, Mexico’s state-owned oil company Pemex is set to cut crude exports in the coming months, adding to fears of an existing supply shortage. OPEC will hold a joint ministerial meeting today to assess market conditions and members’ compliance with production targets, with current production policies expected to remain unchanged.

Asian markets were predominantly up yesterday. Japan’s Nikkei 225 (JP225) rose by 0.09%, China’s FTSE China A50 (CHA50) was down 0.21%, Hong Kong’s Hang Seng (HK50) jumped by 2.36% on Tuesday, and Australia’s ASX 200 (AU200) was negative 0.11%. The Hang Seng Index (HK50) today pulled back from a near 3-week peak reached in the previous session as fears intensified after a powerful earthquake struck Taiwan this morning, collapsing at least 26 buildings and injuring 56 people. In China, some railroad tracks were reportedly closed.

Core inflation in Japan’s capital slowed in March, and factory output unexpectedly fell in the previous month, adding uncertainty over how soon the Bank of Japan could raise interest rates again after emerging from negative interest rates. Several weak signs in the economy may encourage the central bank to hold off on another rate hike and give investors a reason to keep selling the yen, putting pressure on the Japanese authorities to intervene in the market to support the currency.

S&P 500 (US500) 5,205.81 −37.96 (−0.72%)

Dow Jones (US30) 39,170.24 −396.61 (−1.00%)

DAX (DE40) 18,283.13 −209.36 (−1.13%)

FTSE 100 (UK100) 7,935.09 −17.53 (−0.22%)

USD Index 104.97 +0.43 (+0.41%)

Important events today:
  • – Japan Services PMI (m/m) at 03:30 (GMT+3);
  • – China Caixin Services PMI (m/m) at 04:45 (GMT+3);
  • – Eurozone Consumer Price Index (m/m) PMI at 12:00 (GMT+3);
  • – OPEC Meeting (m/m) at 12:15 (GMT+3);
  • – US ADP Nonfarm Employment Change (m/m) at 15:15 (GMT+3);
  • – US ISM Services PMI (m/m) at 17:00 (GMT+3);
  • – US Crude Oil Reserves (w/w) at 17:30 (GMT+3);
  • – US Fed Chair Powell Speaks at 19:10 (GMT+3).

By JustMarkets


This article reflects a personal opinion and should not be interpreted as an investment advice, and/or offer, and/or a persistent request for carrying out financial transactions, and/or a guarantee, and/or a forecast of future events.

A century after the EEG was discovered, it remains a crucial tool for understanding the brain

By Giridhar Kalamangalam, University of Florida 

Jena, Germany, 1924: Working in near-isolation and with painstaking tediousness, the psychiatrist Hans Berger observes rhythmic electrical activity from the scalp of human subjects. He is convinced the activity arises from within the brain and coins the term “electroencephalogram.”

It is 10 years before the scientific community accepts Berger’s work, birthing the field of electroencephalography, or EEG for short.

Today, the electroencephalogram – also abbreviated as EEG – is widely known as a medical test measuring brain electrical activity that’s used on patients who have, or are suspected to have, neurological disorders. The EEG provides a window into the living brain, with a continuous electrical readout of what is happening inside our heads. The procedure may be short, often just a 30-minute recording. But for patients monitored for diagnosis or treatment of brain disease, it can be continued for much longer – days or even weeks.

As a neurologist specializing in epilepsy, I use EEG on a daily basis. Our team at the University of Florida interprets thousands of EEGs a year in neurological patients. I also run a research lab where our goal is to understand the basic structure of the EEG in health and disease.

A history of unexpected twists

The story of EEG is colorful and littered with fables. Berger’s interest in brain electricity was not to combat disease, though that was his day job as a physician, but to find a biological basis for his belief in telepathy. He wondered whether the brain waves of EEG could convey thoughts through space, allowing people to read each other’s minds. He was unsuccessful in his mission, but the field he founded nonetheless took off.

By the mid-1930s, researchers had observed the striking differences between the awake and asleep EEG. The EEGs of patients with brain disease turned up a variety of unprecedented observations.

And then came a defining moment for modern medicine. In December 1934, a group of Boston physicians observed the rhythmic EEG spike-wave appearance of seizures in patients with “petit mal” epilepsy. Petit mal is an anachronistic term for a type of epilepsy where a patient’s flow of thought, speech or action momentarily freezes during seizures. For the first time, the symptoms and behavior of patients during seizures were correlated to a brain signal occurring in lockstep.

EEG quickly evolved from a scientific curiosity to a mainstream clinical tool. The first clinical EEG laboratory was set up at Massachusetts General Hospital in 1937. The practice grew in the ensuing decades into the specialized services that institutions like ours have offered since the 1970s.

The EEG explained

So what, exactly, is the EEG?

Imagine taking two small metallic discs connected by a conducting wire. Place one disc on the scalp and connect the other to a neutral reference, such as the ear. Watch a tiny alternating current flow in the wire, proportional to the electrical activity sensed by the conducting contact. This activity is the EEG, the electrical milieu that bathes brain tissue.

In turn, the EEG arises from the excitable nature of nerve cells, or neurons. When neurons fire, action potentials – brief, high-voltage spikes traveling outward from their cell bodies – set up local electrical activity in other neurons, causing current to flow within and outside them.

These local current flows may cause the targeted neurons to fire in turn and set up yet more current flows. Thus, the system sustains itself. The average overall activity is a mix of many different frequencies, with the five main ones called delta, theta, alpha, beta and gamma waves.

If the EEG were just random up-and-down drift – “the bloodless dance of action potentials,” commented a skeptical early 20th century neurologist – it would be much less interesting. The remarkable fact is that EEG tends to spontaneously organize into patterns in time and space.

The spike-wave pattern of petit mal, referenced earlier, is a classic example, but scores of others are now known. Clinical EEG practice is just recognizing characteristic EEG patterns and correlating them to specific disease states.

Fluctuating neurons

Beyond the clinic, an unsettling scientific question emerges. Simply put, how do electrical patterns arise in the brain? How do the billions of neurons and their trillions of local current flows fluctuate in just the right ways to create globally ordered structure?

Our research group has been interested in the fundamental question of pattern formation in EEG. It turns out that activity in the brain is naturally repetitive – that is, oscillatory. This is due to the way neurons are connected and the fact that they interact by excitation and inhibition to produce push-pull effects.

Considering local oscillations as fundamental building blocks, we showed that the EEG over the entire brain could be built up from such elementary blocks. More interestingly, the differing frequencies could be made to coalesce, or synchronize, into a common rhythm. We recognized that synchronization of this type underlies some seizurelike patterns observed in patients.

EEG is but one way to study the brain.

EEG, AI and the mind

Pattern formation in nature is deeply fascinating. How does a leopard get its spots? How does the audience at a concert spontaneously settle into a rhythmic applause? Many such questions trace their origin to a classic paper on biological pattern published in 1952. Its author was Alan Turing, better known as the father of computer science and early advocate of artificial intelligence, or AI.

The hardware underlying the majority of today’s AI systems are neural networks. Neural networks were introduced in 1943 by Warren McCulloch, a physician and electroencephalographer. Like Berger, McCulloch’s interest in EEG extended beyond brain disease. He wondered where in the brain’s neurons and EEG lay the capacity to think. He conceived the idea of grouping artificial neuronlike computing units into networks, analogous to how real neurons in the brain interconnected.

Together with Walter Pitts, he proved that such neural networks could function as a general-purpose computer. The seminal McCulloch-Pitts ideas were refined over the ensuing decades and reside in the “deep learning” neural networks of today’s AI.

Deep learning AI has infiltrated all areas of biomedicine, including neurology. For example, AI systems can successfully interpret brain scans. AI methods have also been used to analyze EEG.

Can AI systems be trained to deduce thoughts from the EEG? Can AI approach Berger’s quest for telepathy? Incredibly, recent deep-learning AI research has shown that some aspects of mental activity may be decoded from EEG.

In 2024, EEG turns 100. What windows will it open into the brain and mind in the future? Doubtless, clinical applications will grow. Surely, brain pattern generation will be better understood. Perhaps EEG will glimpse the content of the mind. And for neurologists like me surveying the AI revolution, there’s the quiet pride that EEG was really at the start of it all.The Conversation

About the Author:

Giridhar Kalamangalam, Professor of Neurology, University of Florida

This article is republished from The Conversation under a Creative Commons license. Read the original article.

EURJPY: Bulls breach falling wedge pattern

By ForexTime 

  • EURJPY breaks pattern resistance
  • Bullish signal triggered above 161.8 level
  • Watch out for Eurozone PMI’s & PPI
  • Potential price target at 164.208
  • Bloomberg Model: 80% chance EURJPY – (161.56 – 165.06)

The EURJPY triggered a bullish signal on Wednesday after prices breached the falling wedge pattern.

Over the past few days, the minor currency pair has been trending lower with yesterday’s rebound creating a foundation for bulls to re-enter the scene.

According to Thomas Bulkowski, in his book “The Encyclopedia of Chart Patterns”, upward breakouts from falling wedges;

  • are expected to meet their price target 62% of the time.

  • Have a breakeven failure rate of 26%.

The highest high in the wedge -165.335- is used as the measured move objective (target).

At the time of writing EURJPY is testing the golden Fibonacci level of 161.8 at 163.368.

Interestingly, prices remained steady despite inflation figures from Europe slowing more than expected and reinforcing bets around the ECB cutting rates in June. This could be based on the Yen weakening against most G10 currencies including the euro this morning.

Note: Traders have fully priced in a 25 basis point ECB rate cut by June 2024.

Investors may direct their attention toward the incoming Eurozone S&P Global Services PMI and PPI figures on Thursday for more insight into the health of the Eurozone economy.

Focusing on the technical picture, a possible near-term level where EURJPY bulls may expect some resistance before reaching the price target is 164.208.

In the event of a failed falling wedge pattern, EURJPY bears may look forward to the following key levels for support.

  • 163.022

  • 162.668

  • 162.163 – 100% Fibonacci level

The Fibonacci level is taken from March 8th 2024 high at 162.163 to March 11th 2024 low at160.209.

Bloomberg’s FX model forecasts an 80% chance that EURJPY will trade within the 161.56 – 165.06 range over the next one week.


Forex-Time-LogoArticle by ForexTime

ForexTime Ltd (FXTM) is an award winning international online forex broker regulated by CySEC 185/12 www.forextime.com

Gold hits record high; silver peaks on Fed rate cut speculation

By RoboForex Analytical Department

Gold prices have soared to an all-time high of 2288.00 USD per troy ounce, while silver reached its highest in two years, driven by speculation surrounding the US Federal Reserve’s monetary policy. This surge followed comments from two Fed officials, Mary Daly of the FRB San Francisco and Loretta J. Mester of Cleveland. Both anticipate three rate cuts by the Fed in 2024, although they emphasised there is no immediate need for these adjustments.

The anticipation of a more accommodative monetary policy has been the primary driver behind gold’s significant 11% price increase this year, demonstrating substantial gains for what is typically considered a conservative investment. However, this optimism is somewhat tempered by the current US economic data, which presents a complex backdrop for the timing of these expected rate cuts.

Investors and market watchers are now eagerly awaiting remarks from the US Fed Chair Jerome Powell, who is expected to provide further insights into the Federal Reserve’s monetary policy outlook soon.

Precious metals traditionally benefit in low-interest-rate environments since they do not offer yields like interest-bearing assets. This dynamic underscores the current rally in gold and silver prices.

Technical analysis of XAU/USD

H4 chart analysis: the XAU/USD pair has corrected to 2230.00 USD and initiated a new upward wave targeting 2379.80 USD. Following this target, a correction towards 2270.00 USD is anticipated before the price potentially moves towards 2430.00 USD. The MACD indicator, with its signal line well above zero and trending upward, supports this bullish scenario.

H1 chart analysis: on the H1 chart, XAU/USD has experienced a growth wave, reaching 2266.80 USD, with the market updating this peak today. A consolidation phase around this level is expected, with a breakout potentially leading to a further rise to 2310.73 USD and possibly extending towards 2379.80 USD. The Stochastic oscillator, currently below 80 and poised to drop to 50 before rising again, aligns with this forecast.


Disclaimer

Any forecasts contained herein are based on the author’s particular opinion. This analysis may not be treated as trading advice. RoboForex bears no responsibility for trading results based on trading recommendations and reviews contained herein.

Turkey’s economy is paying the price for years of policy mistakes

By Gulcin Ozkan, King’s College London 

For many years, it wasn’t the economy that determined voting behaviour in Turkey. The country’s president, Recep Tayyip Erdoğan, won almost every election he contested despite a deteriorating economic outlook.

This is commonly explained by the importance of identity politics in a country that has been polarised by the policies of Erdoğan’s ruling Justice and Development (AK) Party over its 22 years in power.

However, Erdoğan’s streak came to a screeching halt on Sunday March 31 following Turkey’s local elections. His AK Party lost the popular vote for the first time since 2002 and the main opposition group claimed victory in key cities including Istanbul and Ankara.

The reason why this time was different lies in the huge accumulated costs from years of policy mistakes that are now beginning to bite in a serious way.

So, what was the economic outlook as the country went to the polls?

On March 21, Turkey’s central bank raised interest rates unexpectedly to 50%. The move was the latest in a succession of rate rises that have followed Erdoğan’s re-election as president in May 2023. It was viewed as evidence of the central bank’s determination to fight runaway inflation that is hovering close to 70%.

The rising interest rates have been widely applauded as a much-needed reversal from the unorthodox monetary policy that had gone on far too long. Erdoğan’s unconventional policy stance arose from his deep-held conviction that raising interest rates would increase inflation rather than reduce it.

The pandemic and Russia’s invasion of Ukraine caused inflation to soar worldwide. While almost every central bank raised interest rates in response, Turkey went on an interest rate cutting spree. Keeping rates artificially low contributed to the rise in domestic inflation, and has made Turkey an inflation champion on a par with Argentina and Venezuela.

Decoupling from other emerging economies

Emerging markets have been surprisingly resilient in the face of the global financial squeeze. Unlike in the past, many emerging economies have avoided huge fluctuations in their exchange rates, have not been subject to debt distress and have managed to keep inflation under control.

One reason for this is the success of emerging economies in improving their policy frameworks, particularly by enhancing the independence of their central banks. More specifically, central banks in these countries have significantly improved their communication and transparency, and have become much better at forecasting inflation. As such, countries including Chile, Czech Republic and South Africa have outperformed their counterparts in advanced economies.

Sadly, Turkey was an outlier in this sphere. The country has completely ditched the independence of its monetary policy to such an extent that its central bank has had six different governors in the last five years.

Politics has also played a disproportionate role in the making of economic policy. Changes to the Turkish constitution, which were put in place in 2018, gave Erdoğan significant executive powers to push for very generous spending ahead of the 2023 presidential elections.

Minimum wage rose substantially and costly pension schemes and subsidised housing projects were put in place. This expansion in public spending naturally contributed to the inflationary pressures that were already brewing.

Turkey’s outlier position in loose monetary policy, cutting rates between 2021 and 2023 while everyone else had been tightening, is the very reason why its central bank is now having to push rates up while others are just starting the easing cycle.

Why does this matter?

Getting monetary policy wrong matters for most countries. But it matters particularly for countries like Turkey that are highly open to trade and financial flows, and for whom exchange rate movements are a crucial source of fluctuation in the domestic economy.

One of the biggest losers of Erdoğan’s unorthodox monetary policy has been the Turkish lira. Over the past six years, the value of the lira has fallen dramatically against the US dollar. In January 2018, you would have needed to part with 3.76 liras to purchase one US dollar. Today, this figure stands at 31.9 liras.

Large fluctuations in the value of the lira matter for the Turkish economy for several reasons.

First, a significant part of Turkey’s imports are inputs used in the production process, particularly of vehicles, machinery and mechanical appliances that make up nearly half of the country’s exports. Any fall in the value of the lira will push up input costs and hence prices, reducing the competitiveness of the country’s exports.

Second, Turkey imports a substantial part of its energy from abroad. In much the same way, any depreciation of the lira will make it more expensive to import energy.

Third, Turkey is sitting on substantial external liabilities in foreign currency terms. This makes the depreciation of the lira even more costly. Any loss in its value magnifies the amount of resources required to repay a given level of foreign currency liabilities.

Moving forward

Turkey’s return to more orthodox economic policy is good news. But it is so overdue that even the sharp reversals in policy have not been sufficient to turn the tide on its economy, especially in the fight against inflation. Persistent inflationary pressures have forced citizens to increase their holdings of foreign currency, which has put further pressure on the lira.

Facing a slowdown in foreign capital inflows, the authorities have had to burn significant amounts of foreign currency reserves to prevent the lira from depreciating further. The sharp rise in interest rates on March 21 should be seen in a similar vein and as the price the country is having to pay for its past policy mistakes.

More importantly, it has been nearly a year since Turkey returned to more conventional economic policy and there is no plan for a restructuring of the economy with proper institutional reform at its core. If proof is needed as to whether robust and independent policy institutions benefit economic performance, you need look no further than the recent resilience of other emerging economies.

Brazil, for example, hasn’t only rebounded strongly from the pandemic. It has managed to control inflation and boasts one of the best performing currencies in the world.The Conversation

About the Author:

Gulcin Ozkan, Professor of Finance, King’s College London

This article is republished from The Conversation under a Creative Commons license. Read the original article.


Natural gas prices rise amid production cuts. US stock indices under pressure from rising government bond yields

By JustMarkets

At the end of the day yesterday, the Dow Jones (US30) index decreased by 0.60%, while the S&P 500 (US500) Index fell 0.20%. The NASDAQ Technology Index (US100) closed positive 0.11%. Stocks on Monday initially found support on the dovish PCE price deflator report for February released last Friday. But the broader market gave up early gains after bond yields jumped on the back of a stronger-than-expected US ISM manufacturing index. The report was hawkish for Fed policy and could delay an expected Fed rate cut. Meanwhile, strong chip maker stocks raised tech stocks on Monday and kept the NASDAQ Index (US100) in positive territory.

Alphabet (GOOGL) closed at a record high (+3%) after agreeing to delete web browsing data collected from users of its Chrome browser to settle a class action lawsuit that alleged the company tracked people without their knowledge.

In Canada, the S&P manufacturing PMI remained relatively stable in March, marking the eleventh consecutive month of contraction in activity in the sector. However, crude oil prices supported the loonie, helped by the prospect of foreign exchange inflows from Canada’s top exports.

Equity markets in Europe did not trade yesterday due to the Easter holiday.

WTI crude oil prices are trading near 5-month highs at 83 dollars per barrel as investors await the joint OPEC+ ministerial meeting this week. OPEC+ has pledged to extend production cuts through June, which could lead to supply cuts during the summer months in the Northern Hemisphere.

US natural gas prices rose more than 4% on Monday to above $1.8/mmbtu amid continued production declines and forecasts that demand next week will be higher than previously expected. Gas production declined to an average of 100.8 billion cubic feet per day (bcfd) in March, down from 104.8 bcfd in February, as several energy companies, including EQT and Chesapeake Energy, postponed well completions and curtailed other drilling activity.

Asian markets were mostly up yesterday. Japan’s Nikkei 225 (JP225) was down 1.40%, China’s FTSE China A50 (CHA50) was up 1.54%, Hong Kong’s Hang Seng (HK50) was up 0.91% by Monday’s close, and Australia’s ASX 200 (AU200) was positive 0.99%. Optimism about the Chinese economy is supporting equities after the Caixin Mar China Manufacturing PMI rose by 0.2 to 51.1, the highest level in 13 months, and surpassed the 50.0 mark, which indicates the economy is expanding for the fifth month, the longest streak in more than two years.

Australia’s stock market fell by 0.11% on Tuesday after briefly hitting another record high in the morning session. This was led by a drop in US futures as sentiment on US interest rates may shift to a hawkish path amid a resilient economy. In Australia’s domestic market, job advertisements fell for the second straight month in March, while minutes from the central bank’s meeting last month showed policymakers can neither rule in nor rule out future monetary rate changes as uncertainty in the domestic economy persists. In addition, the politicians noted that concerns about the outlook for steel demand have impacted iron ore prices, reducing the earnings of Australian exporters.

S&P 500 (US500) 5,243.77 −10.58 (−0.20%)

Dow Jones (US30) 39,566.85 −240.52 (−0.60%)

DAX (DE40) 18,492.49 0 (0%)

FTSE 100 (UK100) 7,952.62 0 (0%)

USD Index 104.97 +0.43 (+0.41%)

Important events today:
  • – Australia RBA Monetary Policy Meeting Minutes at 03:30 (GMT+3);
  • – Switzerland Retail Sales (m/m) at 09:30 (GMT+3);
  • – Switzerland Manufacturing PMI (m/m) at 10:30 (GMT+3);
  • – German Manufacturing PMI (m/m) at 10:55 (GMT+3);
  • – Eurozone Manufacturing PMI (m/m) at 11:00 (GMT+3);
  • – UK Manufacturing PMI (m/m) at 11:30 (GMT+3);
  • – German Consumer Price Index (m/m) at 15:00 (GMT+3);
  • – US JOLTs Job Openings (m/m) at 17:00 (GMT+3).

By JustMarkets


This article reflects a personal opinion and should not be interpreted as an investment advice, and/or offer, and/or a persistent request for carrying out financial transactions, and/or a guarantee, and/or a forecast of future events.