
By RoboForex Analytical Department
Gold trading reached a significant milestone on Thursday, with prices hitting an all-time high of $2150.00 per Troy ounce. This remarkable surge was propelled by a confluence of factors. These include the decline in US government bond yields, the weakening US dollar, and speculation about a potential interest rate cut by the US Federal Reserve in response to emerging economic challenges.
The expectation of monetary policy easing stems from the Federal Reserve’s ongoing evaluation of the economy’s condition, highlighted by Federal Reserve Chair Jerome Powell’s hint at potential policy adjustments in 2024. The timing of such interventions is critical to achieving a balanced approach without precipitating or lagging behind the economy’s actual needs.
Recent labour market data, including ADP’s February employment growth figures, fell short of expectations, shifting focus to forthcoming reports on unemployment rates, Non-Farm Payroll (NFP) statistics, and average earnings. These reports are critical for assessing the employment market’s condition and will significantly influence the Fed’s decision-making process.
Gold’s rally is further supported by its inverse relationship with the US dollar, gaining momentum from the currency’s current weakness. Moreover, the surge in physical demand for gold from global central banks in January, which saw purchases double compared to December, underscores the metal’s appeal as a hedge against geopolitical risks and potential economic downturns.
Technical analysis of gold (XAU/USD)
Free Reports:
 Download Our Metatrader 4 Indicators – Put Our Free MetaTrader 4 Custom Indicators on your charts when you join our Weekly Newsletter
 Get our Weekly Commitment of Traders Reports - See where the biggest traders (Hedge Funds and Commercial Hedgers) are positioned in the futures markets on a weekly basis.
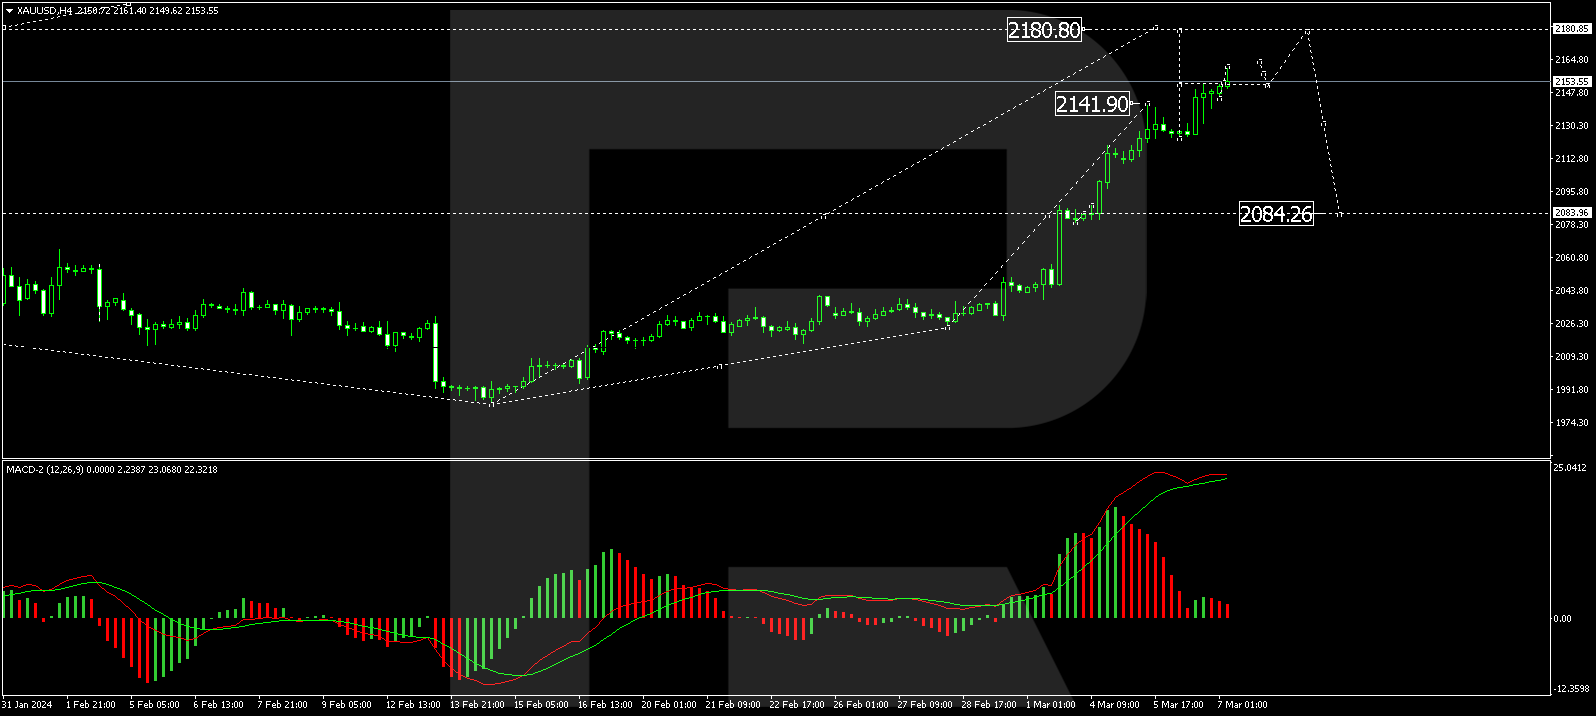
The H4 chart analysis of XAU/USD reveals the progression of the fifth growth wave, with a pivotal correction to 2124.00 following the achievement of a local target at 2141.90. Today’s trading has seen the market surpassing the peak of this wave, establishing a consolidation range above the 2153.00 level. A breakout above this consolidation could signal further growth towards 2180.80, which was identified as the initial target. This bullish scenario is supported by the MACD indicator, which remains above zero, indicating sustained upward momentum.
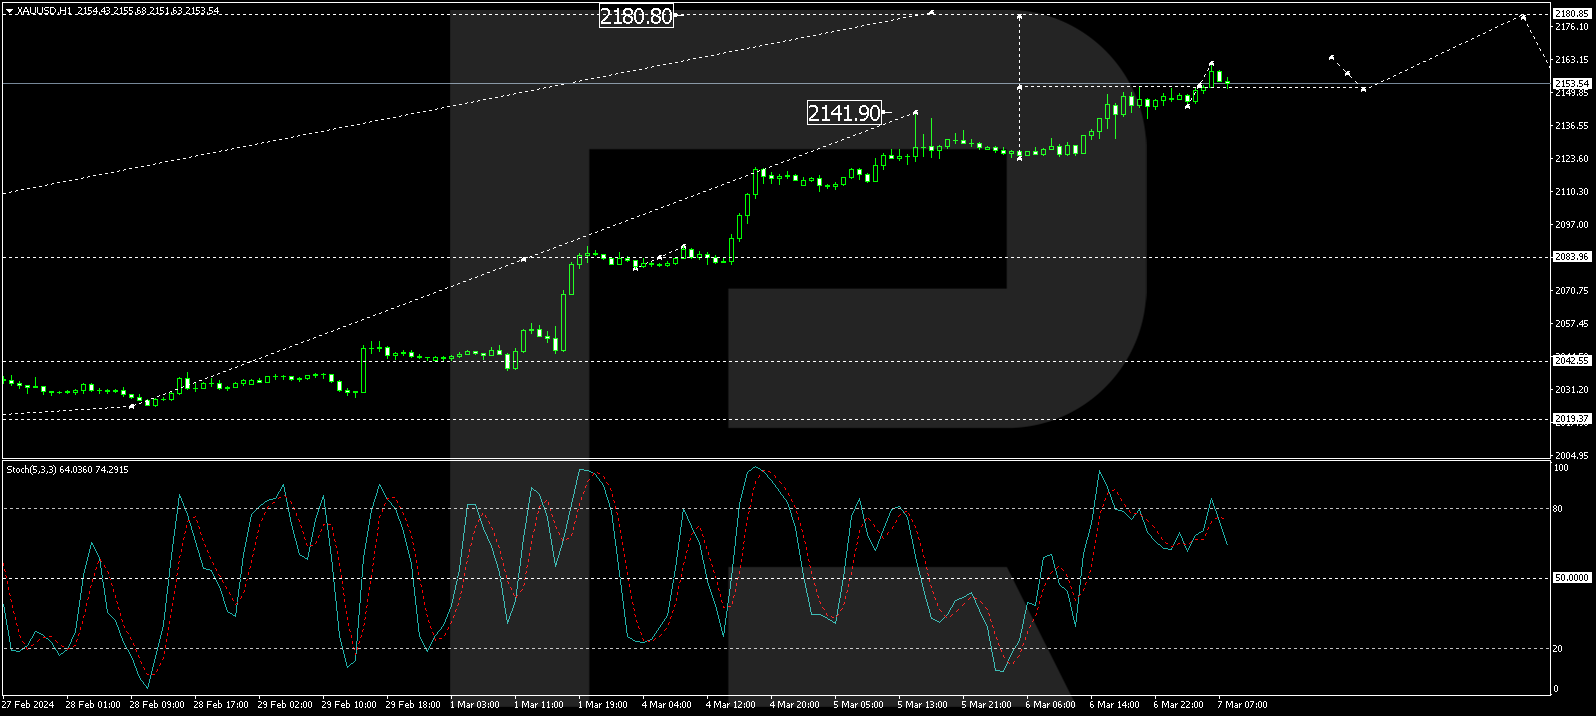
On the H1 chart, gold prices have consolidated around the 2152.00 mark. An upward move from this consolidation phase is expected to initiate a growth wave towards 2160.60. Subsequent correction to 2152.00 and a potential rise to 2180.00 are anticipated. The Stochastic oscillator supports this outlook, suggesting a brief retreat to 50 before rallying back to 80, reflecting continued bullish sentiment in the market.
Disclaimer
Any forecasts contained herein are based on the author’s particular opinion. This analysis may not be treated as trading advice. RoboForex bears no responsibility for trading results based on trading recommendations and reviews contained herein.

- Geopolitical and macroeconomic conditions continue to pressure market sentiment Jul 20, 2026
- USD/JPY Poised to Continue Gains as Expensive Oil and Lack of Support Weigh on Yen Jul 20, 2026
- COT Metals Charts: Weekly Speculator Bets led by Copper & Steel Jul 18, 2026
- COT Bonds Charts: Weekly Speculator Bets led by 2-Year, SOFR 3M & 5-Year Bonds Jul 18, 2026
- COT Energy Charts: Weekly Speculator Bets led by Brent Oil & Heating Oil Jul 18, 2026
- COT Soft Commodities Charts: Weekly Speculator Bets led by Wheat, Corn & Soybean Meal Jul 18, 2026
- The Bank of Canada kept its interest rate unchanged. Platinum prices reached a three‑week high Jul 16, 2026
- Stock indices rose after the release of US inflation data. China’s GDP slowed sharply Jul 15, 2026
- GBP/USD Awaits Political News: What Will Happen Next Jul 15, 2026
- USD/JPY Holds at Highs: Pressure Lingers on Yen Jul 14, 2026