
By InvestMacro
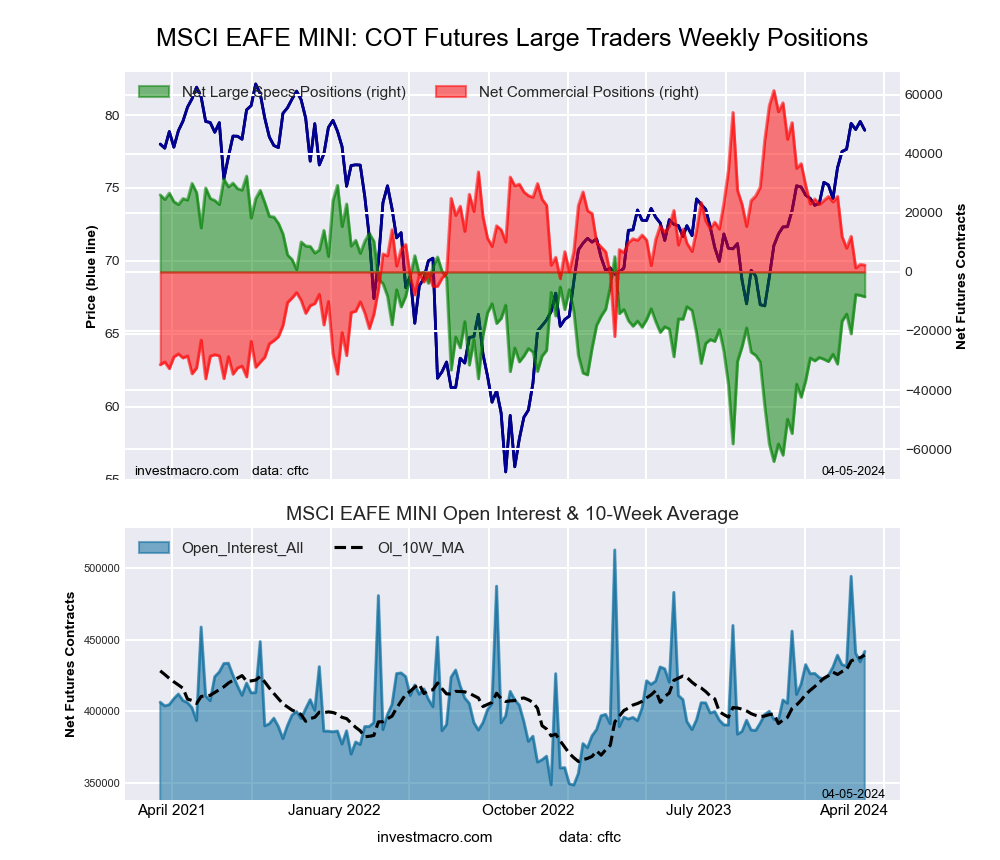
Here are the latest charts and statistics for the Commitment of Traders (COT) data published by the Commodities Futures Trading Commission (CFTC).
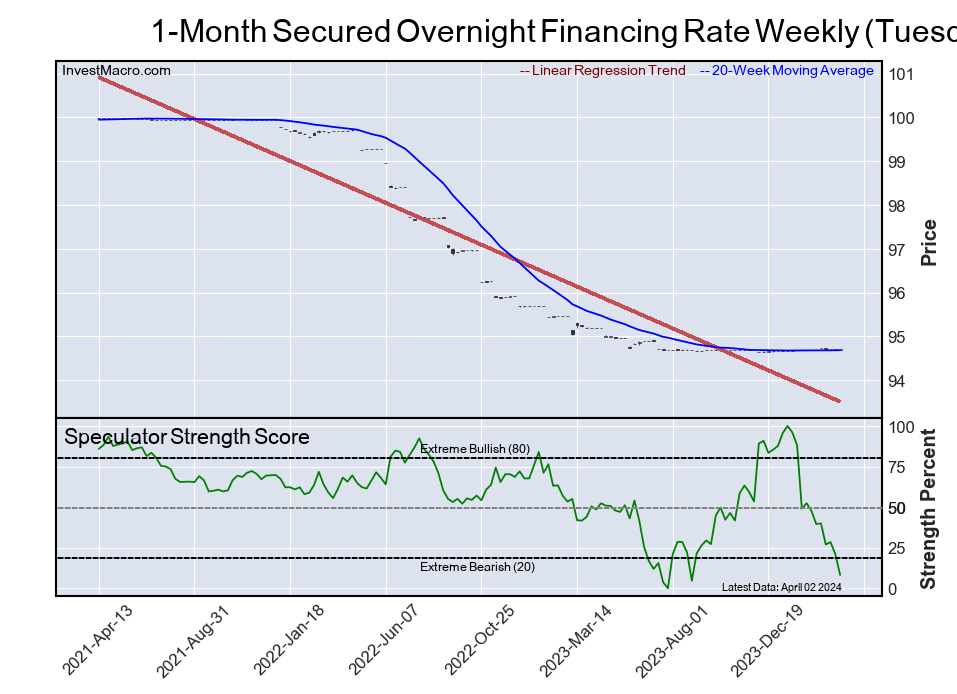
The latest COT data is updated through Tuesday April 2nd and shows a quick view of how large traders (for-profit speculators and commercial entities) were positioned in the futures markets.
Weekly Speculator Changes led by Gold, Silver & Platinum
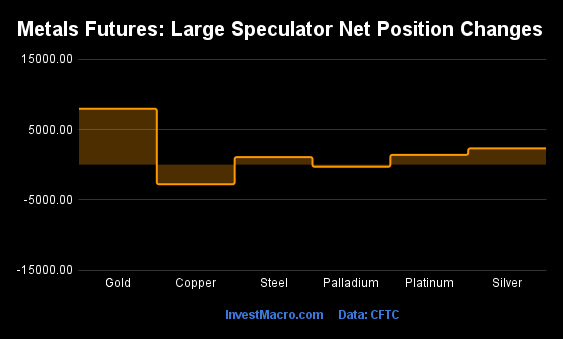
The COT metals markets speculator bets were higher this week as four out of the six metals markets we cover had higher positioning while the other two markets had lower speculator contracts.
Leading the gains for the metals was Gold (7,956 contracts) with Silver (2,311 contracts), Platinum (1,394 contracts) and Steel (1,074 contracts) also recording positive weeks.
The markets with declines in speculator bets for the week were Copper (-2,787 contracts) and Palladium (-302 contracts).
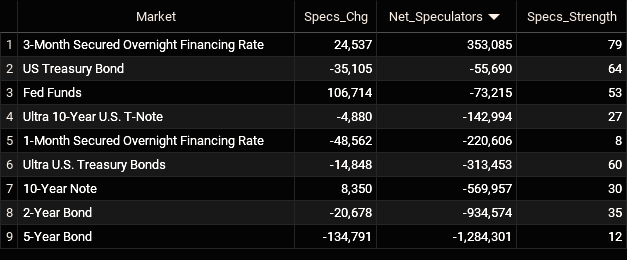
Metals Net Speculators Leaderboard
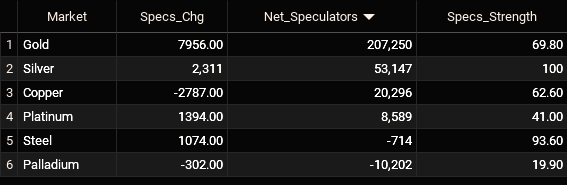
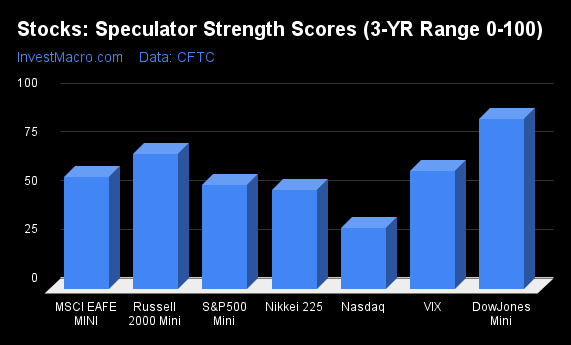
Legend: Weekly Speculators Change | Speculators Current Net Position | Speculators Strength Score compared to last 3-Years (0-100 range)
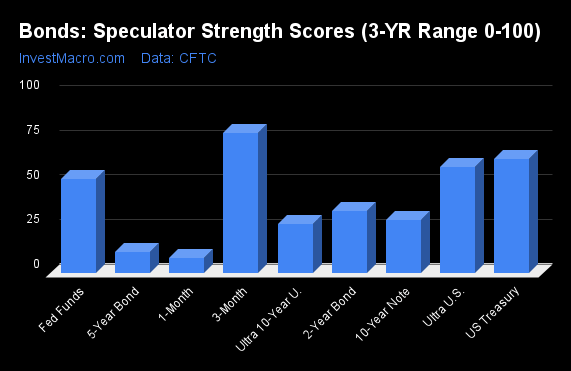
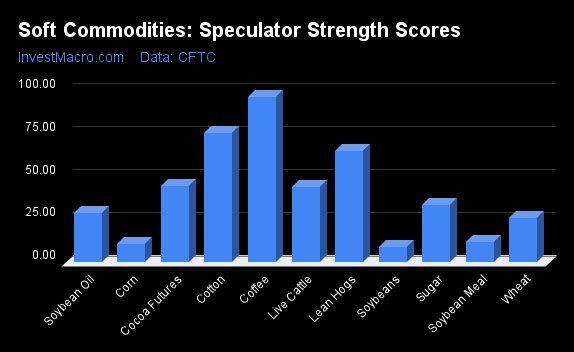
Strength Scores led by Silver & Steel
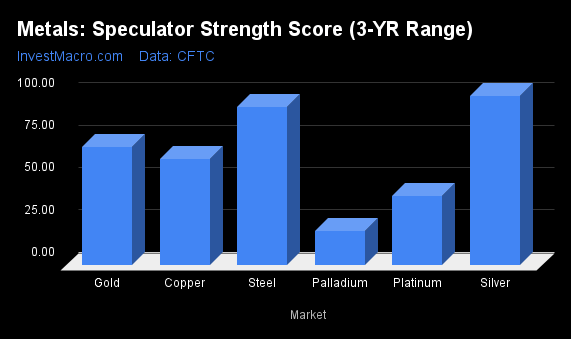
COT Strength Scores (a normalized measure of Speculator positions over a 3-Year range, from 0 to 100 where above 80 is Extreme-Bullish and below 20 is Extreme-Bearish) showed that Silver (100 percent) and Steel (94 percent) lead the metals markets this week and are at or near the top of their ranges. Gold (70 percent) and Copper (63 percent) come in as the next highest in the weekly strength scores.
On the downside, Palladium (20 percent) comes in at the lowest strength level currently and is just at the Extreme-Bearish cutoff (below 20 percent). The next lowest strength score this week was Platinum (41 percent).
Strength Statistics:
Gold (69.8 percent) vs Gold previous week (66.2 percent)
Silver (100.0 percent) vs Silver previous week (96.5 percent)
Copper (62.6 percent) vs Copper previous week (65.7 percent)
Platinum (41.0 percent) vs Platinum previous week (37.2 percent)
Palladium (19.9 percent) vs Palladium previous week (21.8 percent)
Steel (93.6 percent) vs Palladium previous week (89.5 percent)
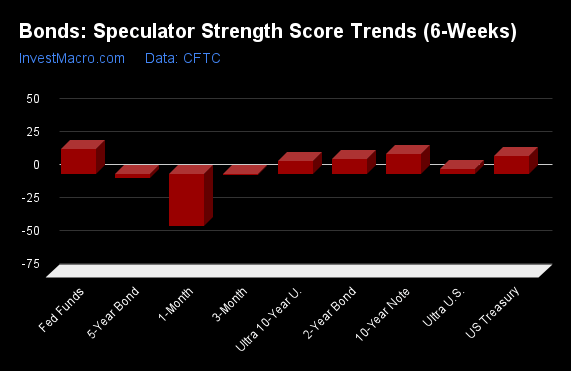
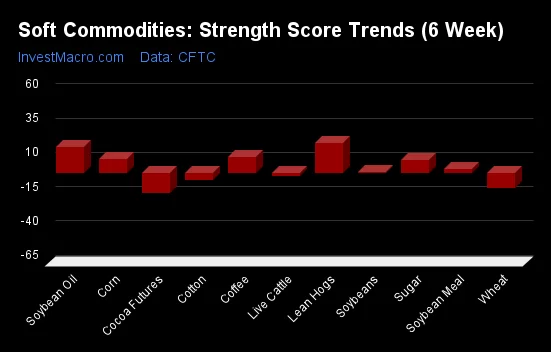
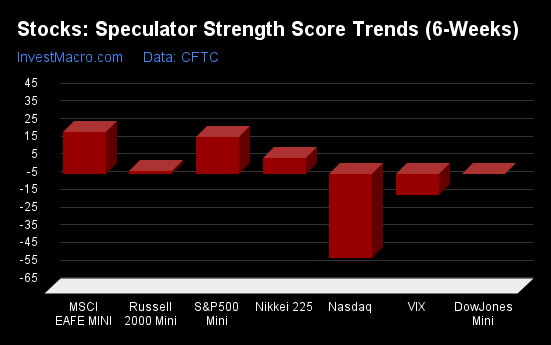
Silver & Copper top the 6-Week Strength Trends
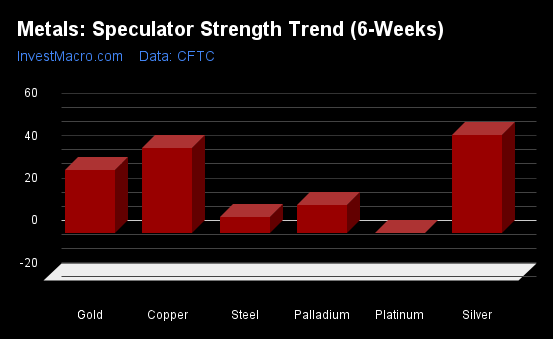
COT Strength Score Trends (or move index, calculates the 6-week changes in strength scores) showed that Silver (47 percent) and Copper (41 percent) lead the past six weeks trends for metals. Gold (30.1 percent), Palladium (14 percent) and Steel (8 percent) are the next highest positive mover in the latest trends data.
Platinum (0 percent) leads the downside trend scores currently.
Move Statistics:
Gold (30.1 percent) vs Gold previous week (30.6 percent)
Silver (46.7 percent) vs Silver previous week (58.3 percent)
Copper (40.5 percent) vs Copper previous week (62.3 percent)
Platinum (0.3 percent) vs Platinum previous week (14.0 percent)
Palladium (13.6 percent) vs Palladium previous week (21.8 percent)
Steel (7.6 percent) vs Steel previous week (1.5 percent)
Individual Markets:
Gold Comex Futures:
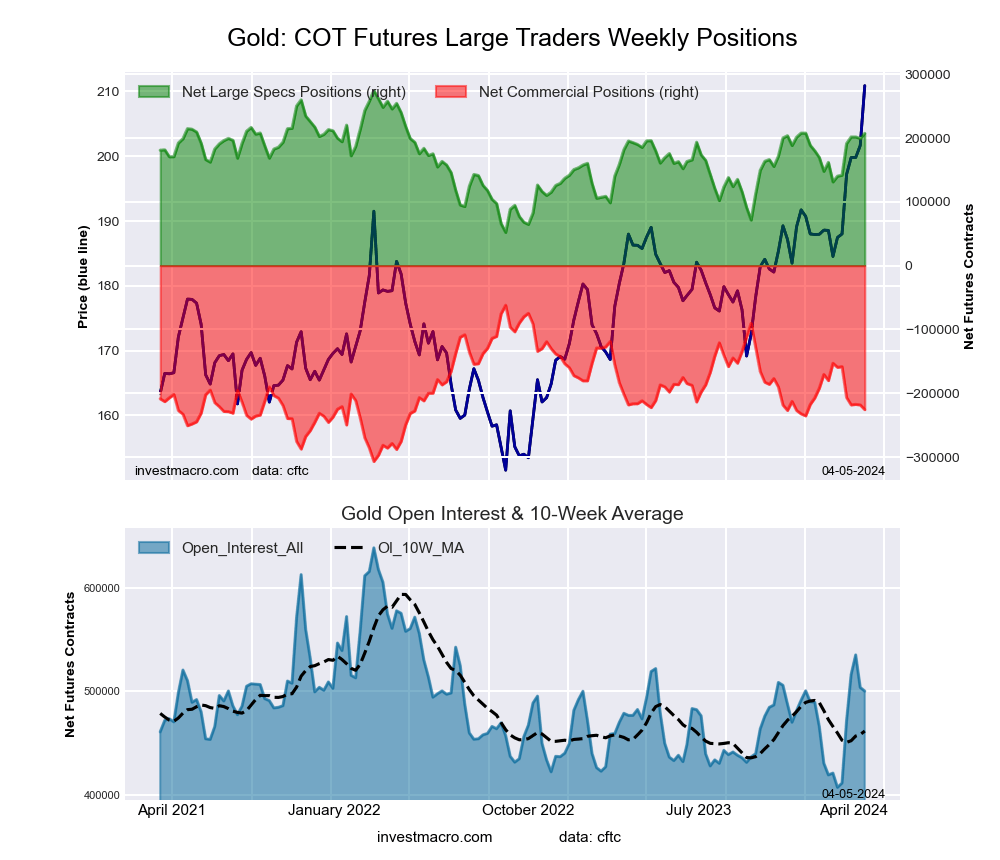 The Gold Comex Futures large speculator standing this week equaled a net position of 207,250 contracts in the data reported through Tuesday. This was a weekly increase of 7,956 contracts from the previous week which had a total of 199,294 net contracts.
This week’s current strength score (the trader positioning range over the past three years, measured from 0 to 100) shows the speculators are currently Bullish with a score of 69.8 percent. The commercials are Bearish with a score of 33.2 percent and the small traders (not shown in chart) are Bearish with a score of 33.5 percent.
Price Trend-Following Model: Strong Uptrend
Our weekly trend-following model classifies the current market price position as: Strong Uptrend. The current action for the model is considered to be: Hold – Maintain Long Position.
| Gold Futures Statistics | SPECULATORS | COMMERCIALS | SMALL TRADERS |
| – Percent of Open Interest Longs: | 56.3 | 25.4 | 9.8 |
| – Percent of Open Interest Shorts: | 14.8 | 70.6 | 6.1 |
| – Net Position: | 207,250 | -225,714 | 18,464 |
| – Gross Longs: | 281,399 | 127,114 | 48,931 |
| – Gross Shorts: | 74,149 | 352,828 | 30,467 |
| – Long to Short Ratio: | 3.8 to 1 | 0.4 to 1 | 1.6 to 1 |
| NET POSITION TREND: | |||
| – Strength Index Score (3 Year Range Pct): | 69.8 | 33.2 | 33.5 |
| – Strength Index Reading (3 Year Range): | Bullish | Bearish | Bearish |
| NET POSITION MOVEMENT INDEX: | |||
| – 6-Week Change in Strength Index: | 30.1 | -27.1 | -2.2 |
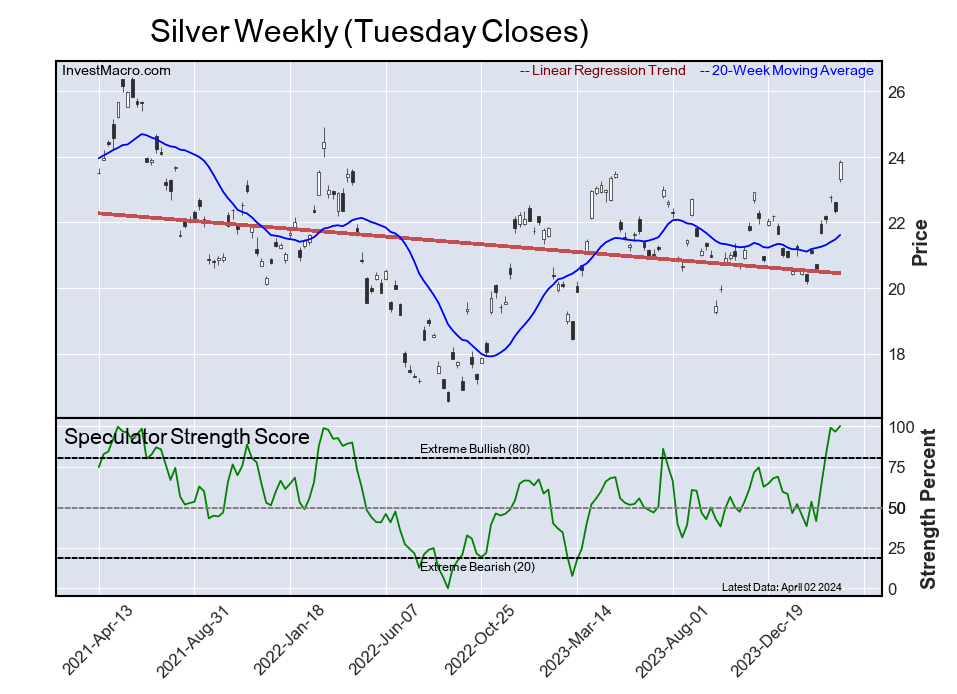
Silver Comex Futures:
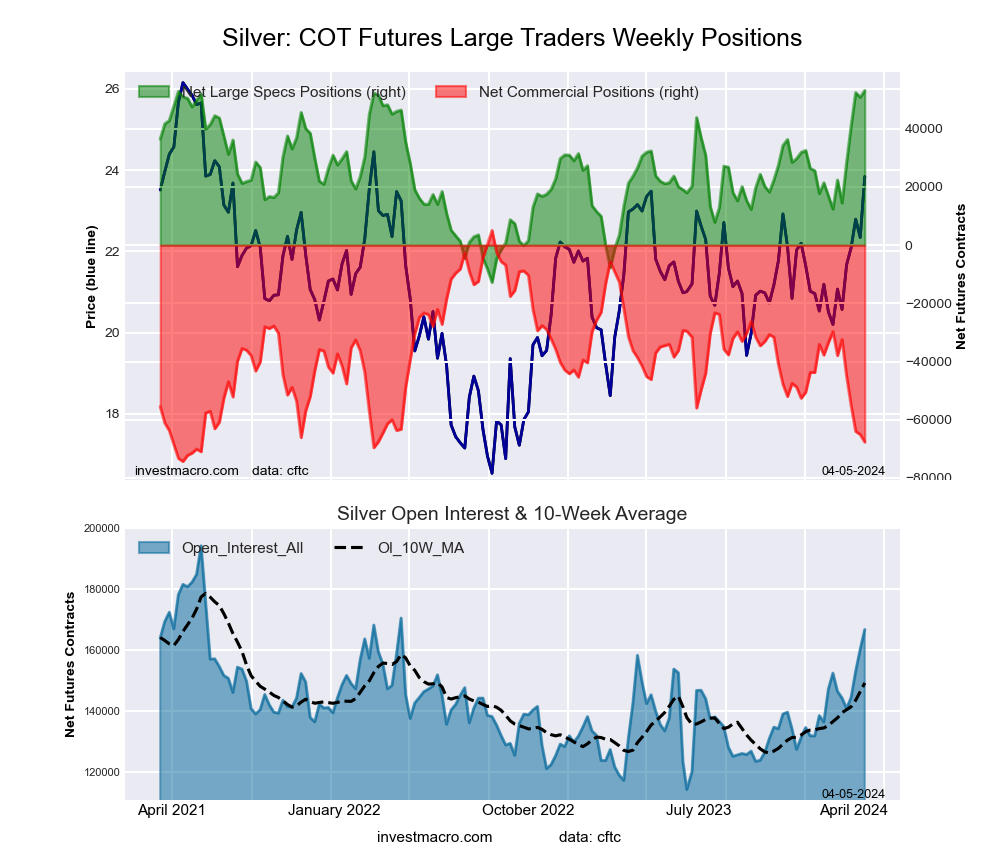 The Silver Comex Futures large speculator standing this week equaled a net position of 53,147 contracts in the data reported through Tuesday. This was a weekly boost of 2,311 contracts from the previous week which had a total of 50,836 net contracts.
This week’s current strength score (the trader positioning range over the past three years, measured from 0 to 100) shows the speculators are currently Bullish-Extreme with a score of 100.0 percent. The commercials are Bearish-Extreme with a score of 8.4 percent and the small traders (not shown in chart) are Bearish with a score of 47.3 percent.
Price Trend-Following Model: Strong Uptrend
Our weekly trend-following model classifies the current market price position as: Strong Uptrend. The current action for the model is considered to be: Hold – Maintain Long Position.
| Silver Futures Statistics | SPECULATORS | COMMERCIALS | SMALL TRADERS |
| – Percent of Open Interest Longs: | 50.1 | 25.7 | 17.8 |
| – Percent of Open Interest Shorts: | 18.2 | 66.3 | 9.1 |
| – Net Position: | 53,147 | -67,706 | 14,559 |
| – Gross Longs: | 83,565 | 42,938 | 29,775 |
| – Gross Shorts: | 30,418 | 110,644 | 15,216 |
| – Long to Short Ratio: | 2.7 to 1 | 0.4 to 1 | 2.0 to 1 |
| NET POSITION TREND: | |||
| – Strength Index Score (3 Year Range Pct): | 100.0 | 8.4 | 47.3 |
| – Strength Index Reading (3 Year Range): | Bullish-Extreme | Bearish-Extreme | Bearish |
| NET POSITION MOVEMENT INDEX: | |||
| – 6-Week Change in Strength Index: | 46.7 | -37.5 | -5.6 |
Copper Grade #1 Futures:
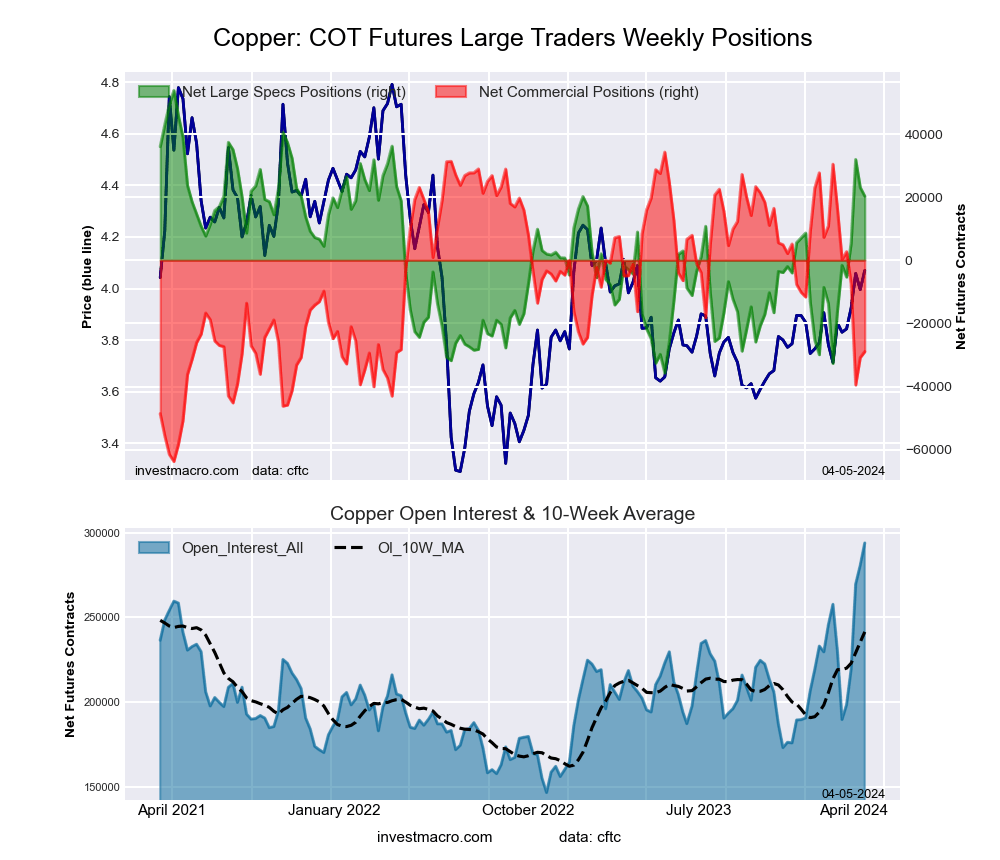 The Copper Grade #1 Futures large speculator standing this week equaled a net position of 20,296 contracts in the data reported through Tuesday. This was a weekly fall of -2,787 contracts from the previous week which had a total of 23,083 net contracts.
This week’s current strength score (the trader positioning range over the past three years, measured from 0 to 100) shows the speculators are currently Bullish with a score of 62.6 percent. The commercials are Bearish with a score of 35.5 percent and the small traders (not shown in chart) are Bullish with a score of 73.1 percent.
Price Trend-Following Model: Strong Uptrend
Our weekly trend-following model classifies the current market price position as: Strong Uptrend. The current action for the model is considered to be: Hold – Maintain Long Position.
| Copper Futures Statistics | SPECULATORS | COMMERCIALS | SMALL TRADERS |
| – Percent of Open Interest Longs: | 43.2 | 29.7 | 8.0 |
| – Percent of Open Interest Shorts: | 36.3 | 39.6 | 5.1 |
| – Net Position: | 20,296 | -28,946 | 8,650 |
| – Gross Longs: | 126,866 | 87,434 | 23,592 |
| – Gross Shorts: | 106,570 | 116,380 | 14,942 |
| – Long to Short Ratio: | 1.2 to 1 | 0.8 to 1 | 1.6 to 1 |
| NET POSITION TREND: | |||
| – Strength Index Score (3 Year Range Pct): | 62.6 | 35.5 | 73.1 |
| – Strength Index Reading (3 Year Range): | Bullish | Bearish | Bullish |
| NET POSITION MOVEMENT INDEX: | |||
| – 6-Week Change in Strength Index: | 40.5 | -46.1 | 56.3 |
Platinum Futures:
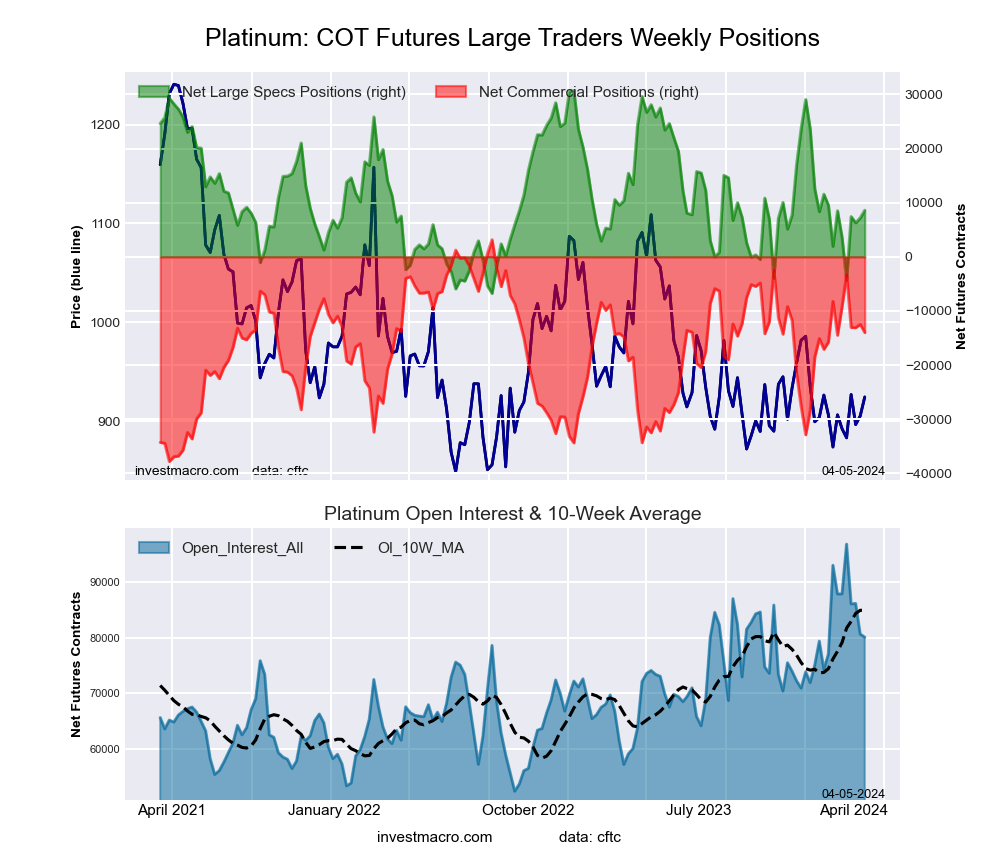 The Platinum Futures large speculator standing this week equaled a net position of 8,589 contracts in the data reported through Tuesday. This was a weekly increase of 1,394 contracts from the previous week which had a total of 7,195 net contracts.
This week’s current strength score (the trader positioning range over the past three years, measured from 0 to 100) shows the speculators are currently Bearish with a score of 41.0 percent. The commercials are Bullish with a score of 58.1 percent and the small traders (not shown in chart) are Bearish with a score of 40.3 percent.
Price Trend-Following Model: Weak Downtrend
Our weekly trend-following model classifies the current market price position as: Weak Downtrend. The current action for the model is considered to be: Hold – Maintain Short Position.
| Platinum Futures Statistics | SPECULATORS | COMMERCIALS | SMALL TRADERS |
| – Percent of Open Interest Longs: | 57.2 | 24.1 | 10.9 |
| – Percent of Open Interest Shorts: | 46.5 | 41.6 | 4.1 |
| – Net Position: | 8,589 | -13,982 | 5,393 |
| – Gross Longs: | 45,845 | 19,311 | 8,703 |
| – Gross Shorts: | 37,256 | 33,293 | 3,310 |
| – Long to Short Ratio: | 1.2 to 1 | 0.6 to 1 | 2.6 to 1 |
| NET POSITION TREND: | |||
| – Strength Index Score (3 Year Range Pct): | 41.0 | 58.1 | 40.3 |
| – Strength Index Reading (3 Year Range): | Bearish | Bullish | Bearish |
| NET POSITION MOVEMENT INDEX: | |||
| – 6-Week Change in Strength Index: | 0.3 | 1.2 | -7.8 |
Palladium Futures:
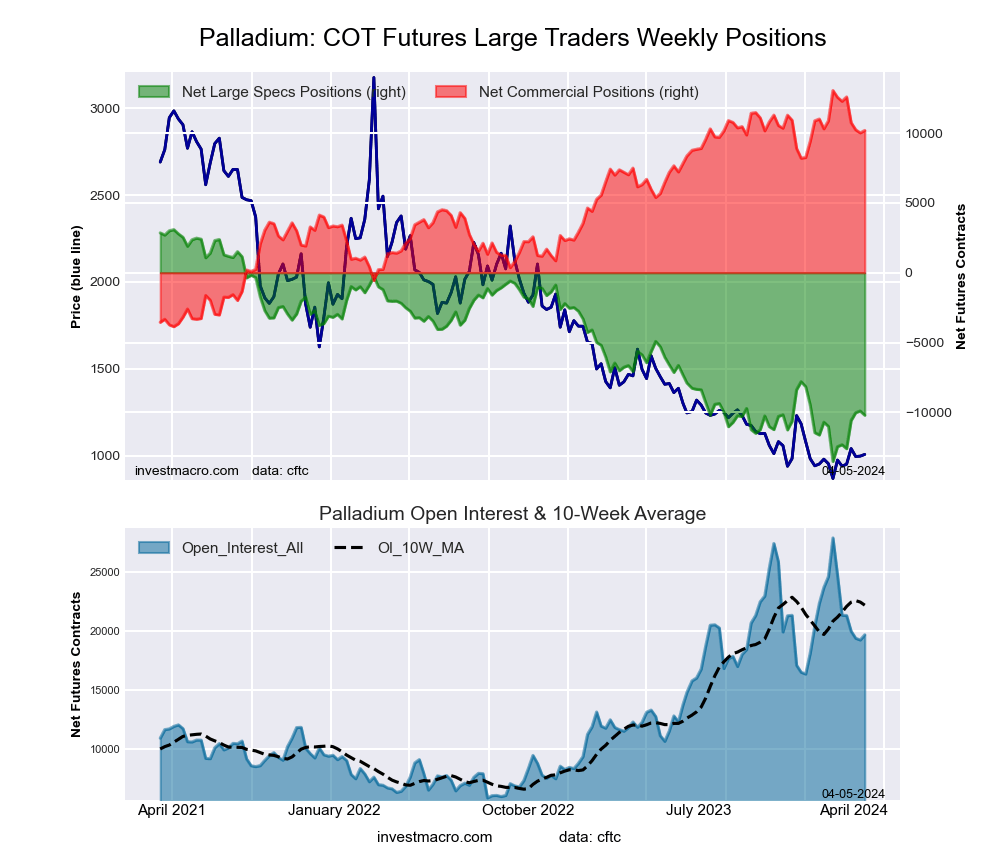 The Palladium Futures large speculator standing this week equaled a net position of -10,202 contracts in the data reported through Tuesday. This was a weekly decline of -302 contracts from the previous week which had a total of -9,900 net contracts.
This week’s current strength score (the trader positioning range over the past three years, measured from 0 to 100) shows the speculators are currently Bearish-Extreme with a score of 19.9 percent. The commercials are Bullish-Extreme with a score of 83.1 percent and the small traders (not shown in chart) are Bearish with a score of 42.8 percent.
Price Trend-Following Model: Downtrend
Our weekly trend-following model classifies the current market price position as: Downtrend. The current action for the model is considered to be: Hold – Maintain Short Position.
| Palladium Futures Statistics | SPECULATORS | COMMERCIALS | SMALL TRADERS |
| – Percent of Open Interest Longs: | 24.3 | 61.1 | 8.2 |
| – Percent of Open Interest Shorts: | 76.2 | 9.3 | 8.1 |
| – Net Position: | -10,202 | 10,184 | 18 |
| – Gross Longs: | 4,776 | 12,013 | 1,618 |
| – Gross Shorts: | 14,978 | 1,829 | 1,600 |
| – Long to Short Ratio: | 0.3 to 1 | 6.6 to 1 | 1.0 to 1 |
| NET POSITION TREND: | |||
| – Strength Index Score (3 Year Range Pct): | 19.9 | 83.1 | 42.8 |
| – Strength Index Reading (3 Year Range): | Bearish-Extreme | Bullish-Extreme | Bearish |
| NET POSITION MOVEMENT INDEX: | |||
| – 6-Week Change in Strength Index: | 13.6 | -14.0 | 7.3 |
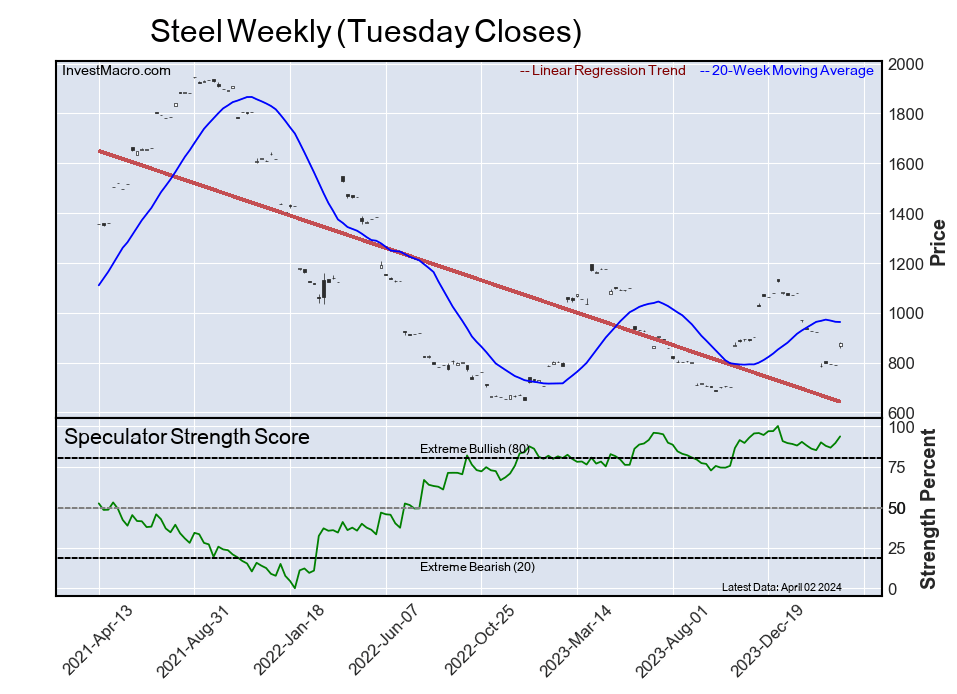
Steel Futures Futures:
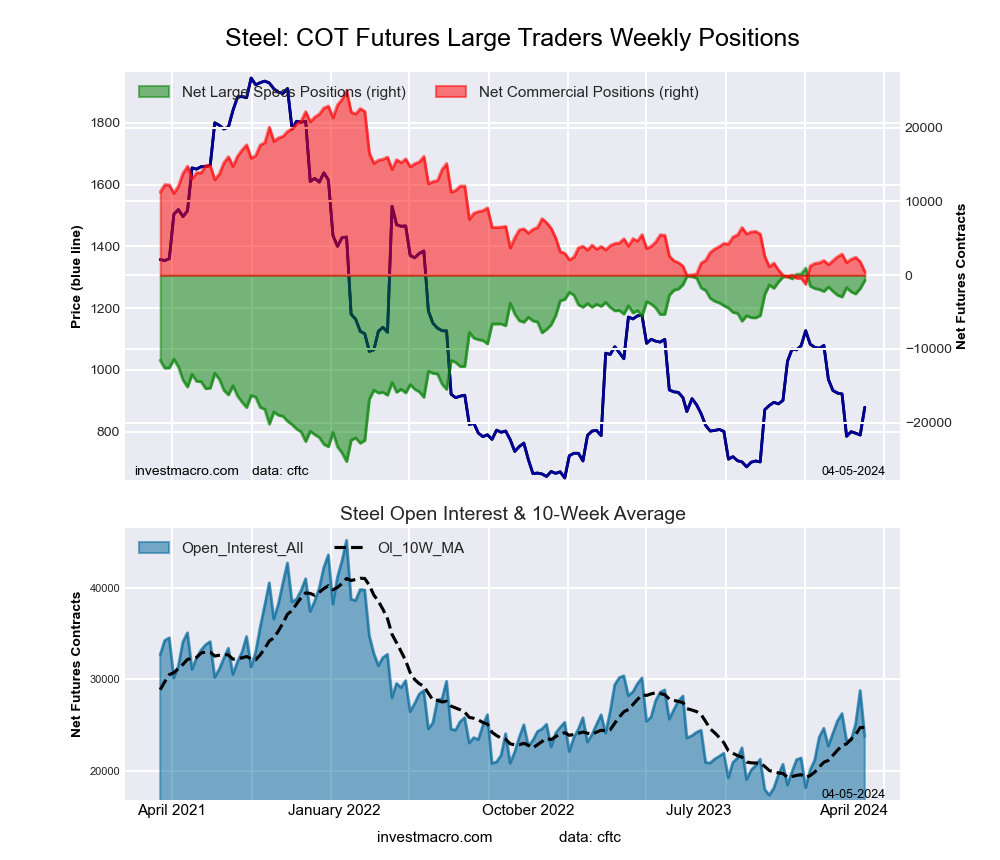 The Steel Futures large speculator standing this week equaled a net position of -714 contracts in the data reported through Tuesday. This was a weekly advance of 1,074 contracts from the previous week which had a total of -1,788 net contracts.
This week’s current strength score (the trader positioning range over the past three years, measured from 0 to 100) shows the speculators are currently Bullish-Extreme with a score of 93.6 percent. The commercials are Bearish-Extreme with a score of 6.5 percent and the small traders (not shown in chart) are Bullish with a score of 58.0 percent.
Price Trend-Following Model: Downtrend
Our weekly trend-following model classifies the current market price position as: Downtrend. The current action for the model is considered to be: Hold – Maintain Short Position.
| Steel Futures Statistics | SPECULATORS | COMMERCIALS | SMALL TRADERS |
| – Percent of Open Interest Longs: | 15.4 | 77.7 | 1.9 |
| – Percent of Open Interest Shorts: | 18.4 | 75.6 | 0.9 |
| – Net Position: | -714 | 480 | 234 |
| – Gross Longs: | 3,659 | 18,460 | 448 |
| – Gross Shorts: | 4,373 | 17,980 | 214 |
| – Long to Short Ratio: | 0.8 to 1 | 1.0 to 1 | 2.1 to 1 |
| NET POSITION TREND: | |||
| – Strength Index Score (3 Year Range Pct): | 93.6 | 6.5 | 58.0 |
| – Strength Index Reading (3 Year Range): | Bullish-Extreme | Bearish-Extreme | Bullish |
| NET POSITION MOVEMENT INDEX: | |||
| – 6-Week Change in Strength Index: | 7.6 | -7.7 | 3.5 |
Article By InvestMacro – Receive our weekly COT Newsletter
*COT Report: The COT data, released weekly to the public each Friday, is updated through the most recent Tuesday (data is 3 days old) and shows a quick view of how large speculators or non-commercials (for-profit traders) were positioned in the futures markets.
The CFTC categorizes trader positions according to commercial hedgers (traders who use futures contracts for hedging as part of the business), non-commercials (large traders who speculate to realize trading profits) and nonreportable traders (usually small traders/speculators) as well as their open interest (contracts open in the market at time of reporting). See CFTC criteria here.


