
By InvestMacro

Here are the latest charts and statistics for the Commitment of Traders (COT) data published by the Commodities Futures Trading Commission (CFTC).
The latest COT data is updated through Tuesday September 13th and shows a quick view of how large traders (for-profit speculators and commercial entities) were positioned in the futures markets.
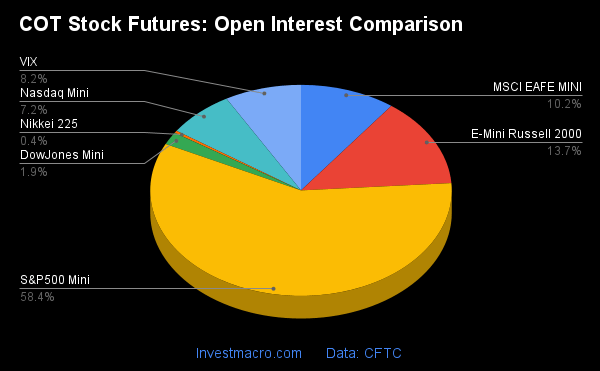
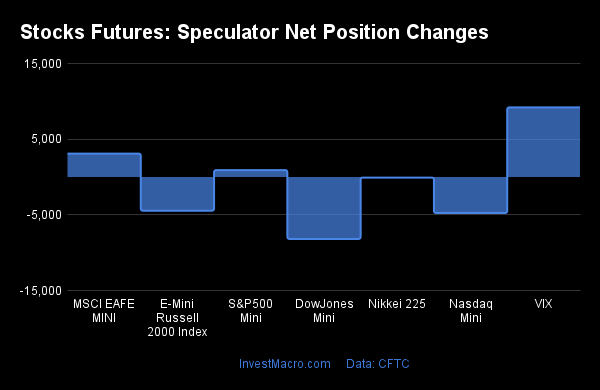
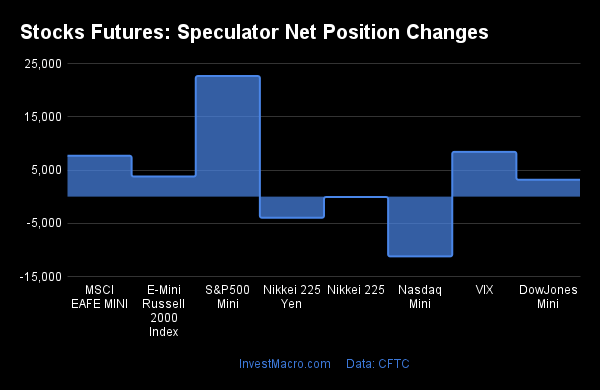
Weekly Speculator Changes led lower by the S&P500 Mini & the Nasdaq Mini
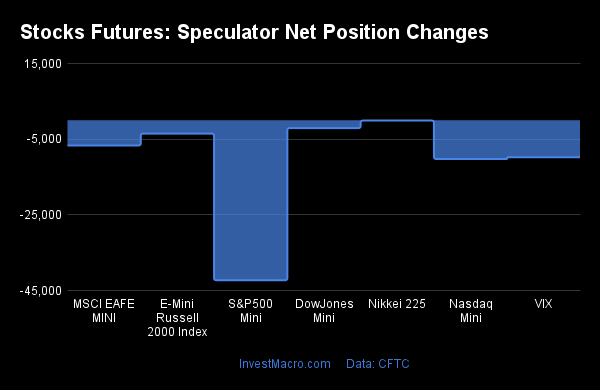
The COT stock market speculator bets had a down week this week as all of the seven stock markets we cover had lower positioning.
The stock markets leading the declines in speculator bets this week were the S&P500 Mini (-42,284 contracts) with the Nasdaq Mini (-10,240 contracts), VIX (-9,792 contracts), MSCI EAFE Mini (-6,664 contracts), Russell 2000 Mini (-3,547 contracts), Dow Jones Industrial Average Mini (-2,078 contracts) and the Nikkei 225 USD (-78 contracts) also recording lower bets for the week.
Overall, the stock markets we cover all have current negative or bearish net positioning with the exception of the Nasdaq Mini.
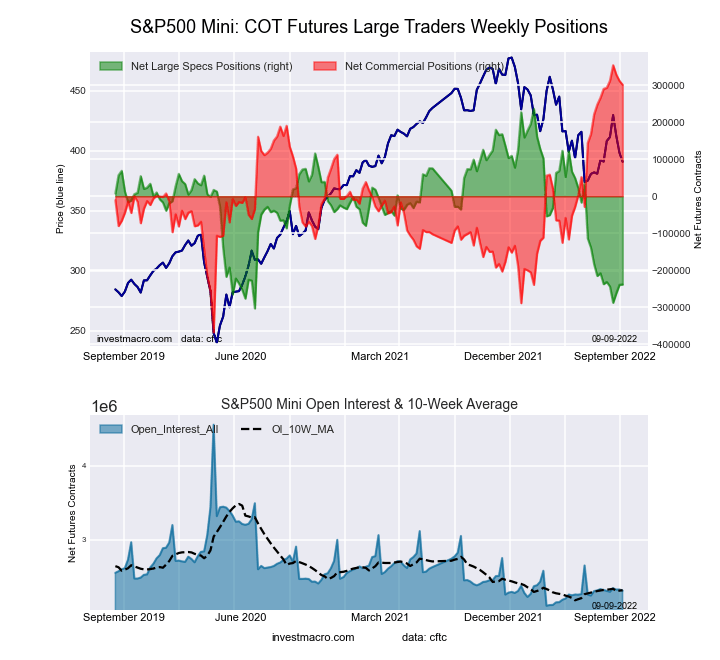
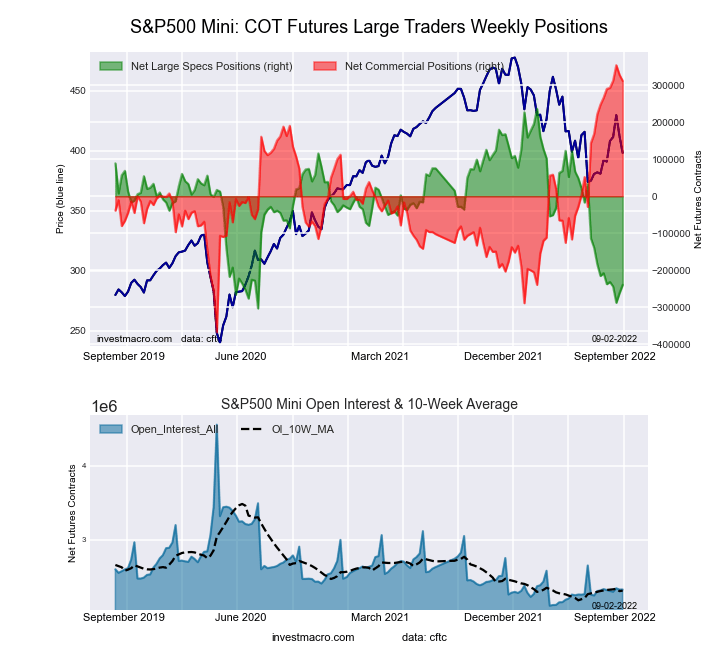
Highlighting the weakness in sentiment is the S&P500 Mini which has hit its lowest speculative positioning (-281,004 contracts currently) in the past 117 weeks, dating back to June of 2020. The S&P500 Mini speculator positions have now been below the -200,000 contract threshold for ten straight weeks. The S&P Mini has been in a bearish level for thirteen consecutive weeks since turning bearish on June 21st.
| Sep-13-2022 | OI | OI-Index | Spec-Net | Spec-Index | Com-Net | COM-Index | Smalls-Net | Smalls-Index |
|---|---|---|---|---|---|---|---|---|
| S&P500-Mini | 2,603,046 | 20 | -281,004 | 4 | 370,284 | 100 | -89,280 | 8 |
| Nikkei 225 | 14,151 | 10 | -4,641 | 55 | 2,949 | 44 | 1,692 | 50 |
| Nasdaq-Mini | 314,969 | 80 | 11,806 | 82 | 15,545 | 36 | -27,351 | 0 |
| DowJones-Mini | 92,577 | 59 | -11,686 | 23 | 13,522 | 77 | -1,836 | 29 |
| VIX | 348,672 | 41 | -98,526 | 60 | 105,680 | 41 | -7,154 | 57 |
| Nikkei 225 Yen | 46,260 | 23 | 1,033 | 37 | 21,754 | 80 | -22,787 | 28 |
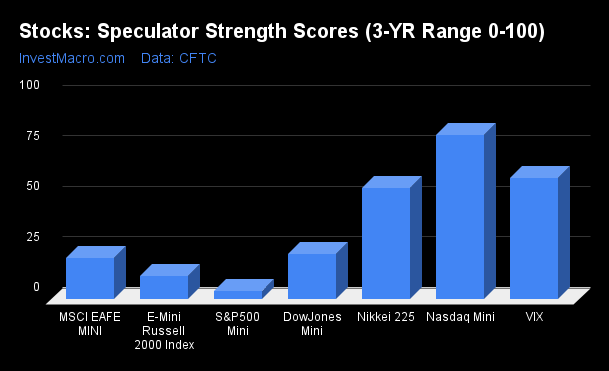
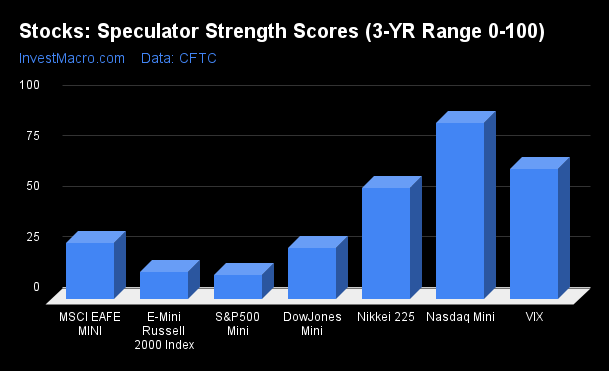
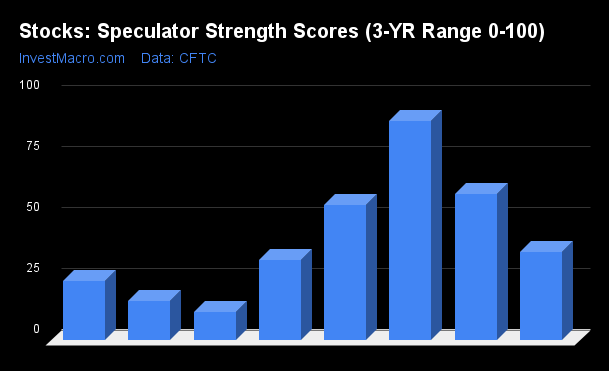
Nasdaq-Mini, VIX and Nikkei lead the Strength Scores
Strength Scores (a normalized measure of Speculator positions over a 3-Year range, from 0 to 100 where above 80 is extreme bullish and below 20 is extreme bearish) showed that the Nasdaq-Mini continues to leads the stocks with an 81.6 percent score. The Nasdaq strength score in bullish extreme positions (above 80 percent) but has been sliding over the past few weeks. The VIX (59.9 percent) and the Nikkei USD (55.4 percent) come in as the next highest stocks market in strength scores and their scores are above the 3-year midpoints (50 percent).
On the downside, the S&P500-Mini (4.1 percent) comes in at the lowest strength level followed by the Russell2000-Mini (11.7 percent) and both markets are in a bearish extreme position (below 20 percent).
Strength Statistics:
VIX (59.9 percent) vs VIX previous week (64.8 percent)
S&P500-Mini (4.1 percent) vs S&P500-Mini previous week (12.0 percent)
DowJones-Mini (22.7 percent) vs DowJones-Mini previous week (25.5 percent)
Nasdaq-Mini (81.6 percent) vs Nasdaq-Mini previous week (87.3 percent)
Russell2000-Mini (11.7 percent) vs Russell2000-Mini previous week (13.7 percent)
Nikkei USD (55.4 percent) vs Nikkei USD previous week (55.8 percent)
EAFE-Mini (20.5 percent) vs EAFE-Mini previous week (27.8 percent)
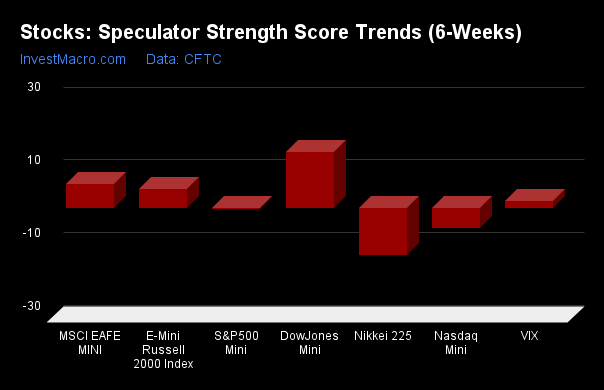
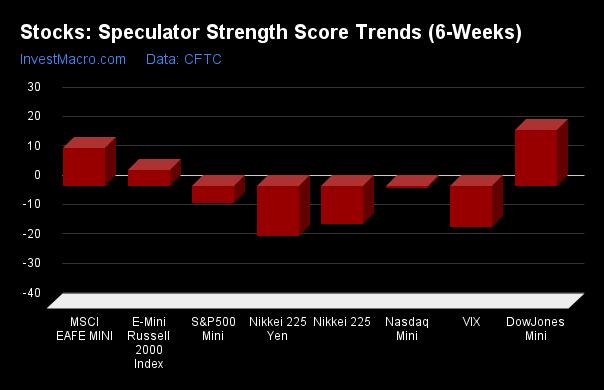
EAFE, Russell 2000 and Dow Jones lead the Strength Trends
Strength Score Trends (or move index, calculates the 6-week changes in strength scores) showed that the EAFE-Mini (15.4 percent) and the Russell2000-Mini (11.7 percent) lead the past six weeks trends for stocks this week. The DowJones-Mini (9.0 percent) and the VIX (0.2 percent) fill out the other positive movers in the latest trends data.
The Nikkei USD (-12.8 percent) leads the downside trend scores currently while the next market with lower trend scores were the S&P500-Mini (-9.1 percent) followed by the Nasdaq-Mini (-7.2 percent).

Strength Trend Statistics:
VIX (0.2 percent) vs VIX previous week (1.9 percent)
S&P500-Mini (-9.1 percent) vs S&P500-Mini previous week (-0.2 percent)
DowJones-Mini (9.0 percent) vs DowJones-Mini previous week (15.4 percent)
Nasdaq-Mini (-7.2 percent) vs Nasdaq-Mini previous week (-5.5 percent)
Russell2000-Mini (11.7 percent) vs Russell2000-Mini previous week (5.4 percent)
Nikkei USD (-12.8 percent) vs Nikkei USD previous week (-13.4 percent)
EAFE-Mini (15.4 percent) vs EAFE-Mini previous week (6.6 percent)
Individual Markets:
VIX Volatility Futures:
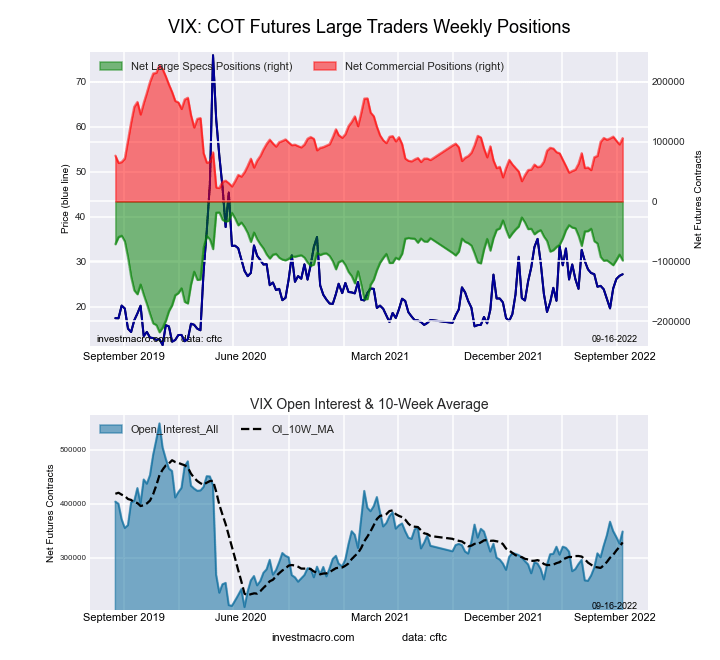 The VIX Volatility large speculator standing this week reached a net position of -98,526 contracts in the data reported through Tuesday. This was a weekly reduction of -9,792 contracts from the previous week which had a total of -88,734 net contracts.
This week’s current strength score (the trader positioning range over the past three years, measured from 0 to 100) shows the speculators are currently Bullish with a score of 59.9 percent. The commercials are Bearish with a score of 40.6 percent and the small traders (not shown in chart) are Bullish with a score of 56.7 percent.
| VIX Volatility Futures Statistics | SPECULATORS | COMMERCIALS | SMALL TRADERS |
| – Percent of Open Interest Longs: | 12.2 | 58.9 | 8.3 |
| – Percent of Open Interest Shorts: | 40.4 | 28.6 | 10.3 |
| – Net Position: | -98,526 | 105,680 | -7,154 |
| – Gross Longs: | 42,480 | 205,325 | 28,804 |
| – Gross Shorts: | 141,006 | 99,645 | 35,958 |
| – Long to Short Ratio: | 0.3 to 1 | 2.1 to 1 | 0.8 to 1 |
| NET POSITION TREND: | |||
| – Strength Index Score (3 Year Range Pct): | 59.9 | 40.6 | 56.7 |
| – Strength Index Reading (3 Year Range): | Bullish | Bearish | Bullish |
| NET POSITION MOVEMENT INDEX: | |||
| – 6-Week Change in Strength Index: | 0.2 | -0.1 | -0.1 |
S&P500 Mini Futures:
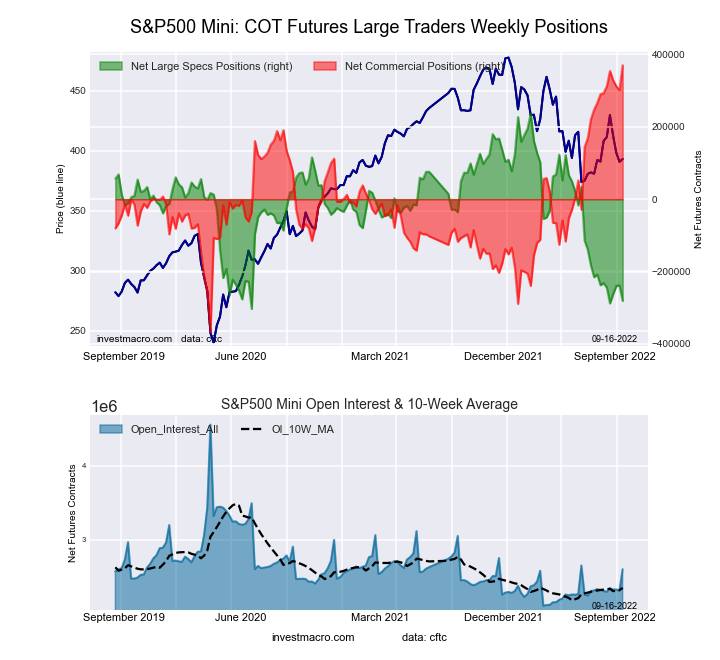 The S&P500 Mini large speculator standing this week reached a net position of -281,004 contracts in the data reported through Tuesday. This was a weekly fall of -42,284 contracts from the previous week which had a total of -238,720 net contracts.
This week’s current strength score (the trader positioning range over the past three years, measured from 0 to 100) shows the speculators are currently Bearish-Extreme with a score of 4.1 percent. The commercials are Bullish-Extreme with a score of 100.0 percent and the small traders (not shown in chart) are Bearish-Extreme with a score of 7.6 percent.
| S&P500 Mini Futures Statistics | SPECULATORS | COMMERCIALS | SMALL TRADERS |
| – Percent of Open Interest Longs: | 9.0 | 76.3 | 10.9 |
| – Percent of Open Interest Shorts: | 19.8 | 62.1 | 14.3 |
| – Net Position: | -281,004 | 370,284 | -89,280 |
| – Gross Longs: | 234,795 | 1,986,386 | 282,571 |
| – Gross Shorts: | 515,799 | 1,616,102 | 371,851 |
| – Long to Short Ratio: | 0.5 to 1 | 1.2 to 1 | 0.8 to 1 |
| NET POSITION TREND: | |||
| – Strength Index Score (3 Year Range Pct): | 4.1 | 100.0 | 7.6 |
| – Strength Index Reading (3 Year Range): | Bearish-Extreme | Bullish-Extreme | Bearish-Extreme |
| NET POSITION MOVEMENT INDEX: | |||
| – 6-Week Change in Strength Index: | -9.1 | 10.5 | -5.9 |
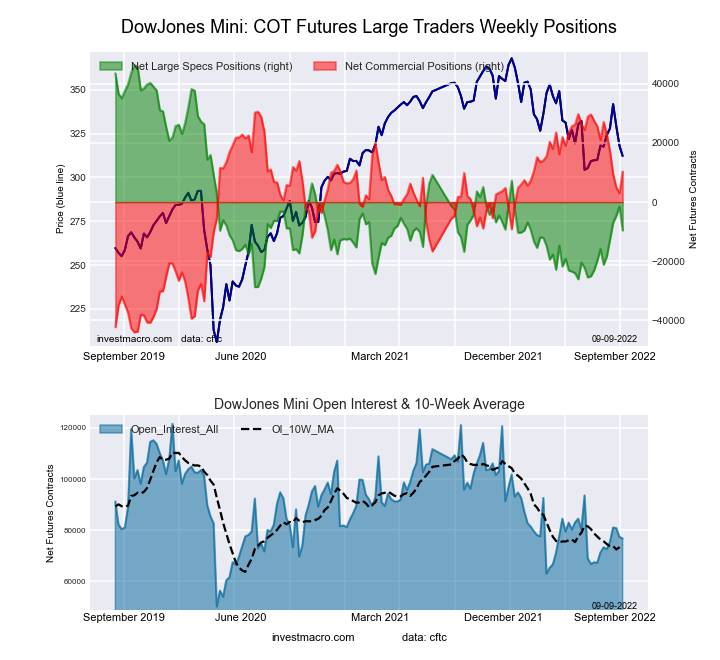
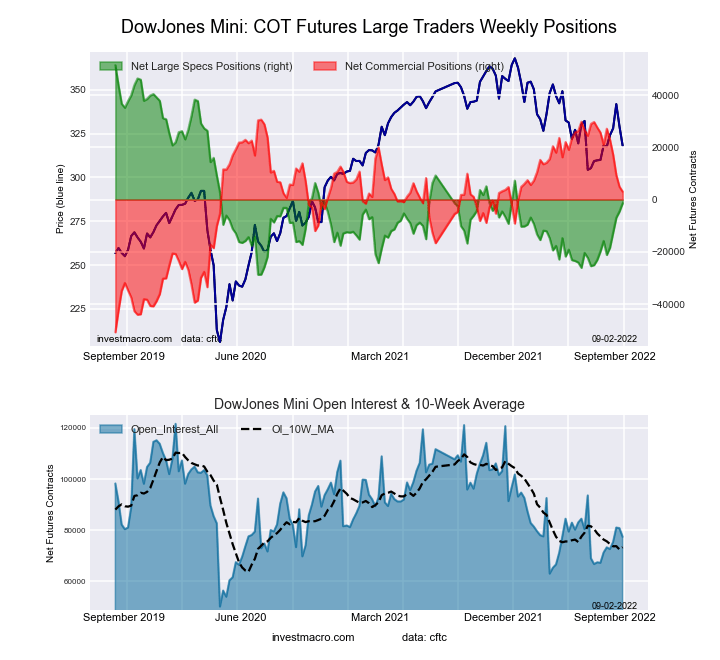
Dow Jones Mini Futures:
 The Dow Jones Mini large speculator standing this week reached a net position of -11,686 contracts in the data reported through Tuesday. This was a weekly decline of -2,078 contracts from the previous week which had a total of -9,608 net contracts.
This week’s current strength score (the trader positioning range over the past three years, measured from 0 to 100) shows the speculators are currently Bearish with a score of 22.7 percent. The commercials are Bullish with a score of 77.1 percent and the small traders (not shown in chart) are Bearish with a score of 28.6 percent.
| Dow Jones Mini Futures Statistics | SPECULATORS | COMMERCIALS | SMALL TRADERS |
| – Percent of Open Interest Longs: | 22.3 | 57.6 | 13.0 |
| – Percent of Open Interest Shorts: | 34.9 | 43.0 | 15.0 |
| – Net Position: | -11,686 | 13,522 | -1,836 |
| – Gross Longs: | 20,662 | 53,298 | 12,067 |
| – Gross Shorts: | 32,348 | 39,776 | 13,903 |
| – Long to Short Ratio: | 0.6 to 1 | 1.3 to 1 | 0.9 to 1 |
| NET POSITION TREND: | |||
| – Strength Index Score (3 Year Range Pct): | 22.7 | 77.1 | 28.6 |
| – Strength Index Reading (3 Year Range): | Bearish | Bullish | Bearish |
| NET POSITION MOVEMENT INDEX: | |||
| – 6-Week Change in Strength Index: | 9.0 | -12.6 | 14.5 |
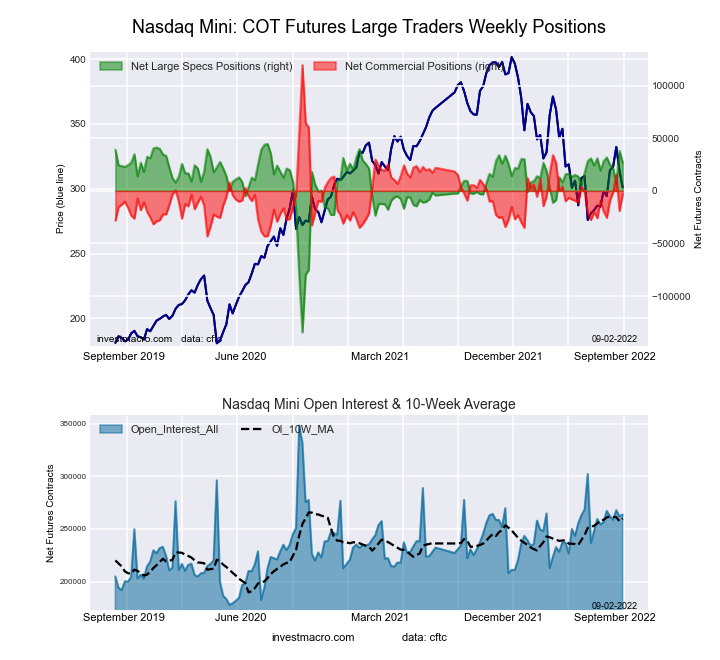
Nasdaq Mini Futures:
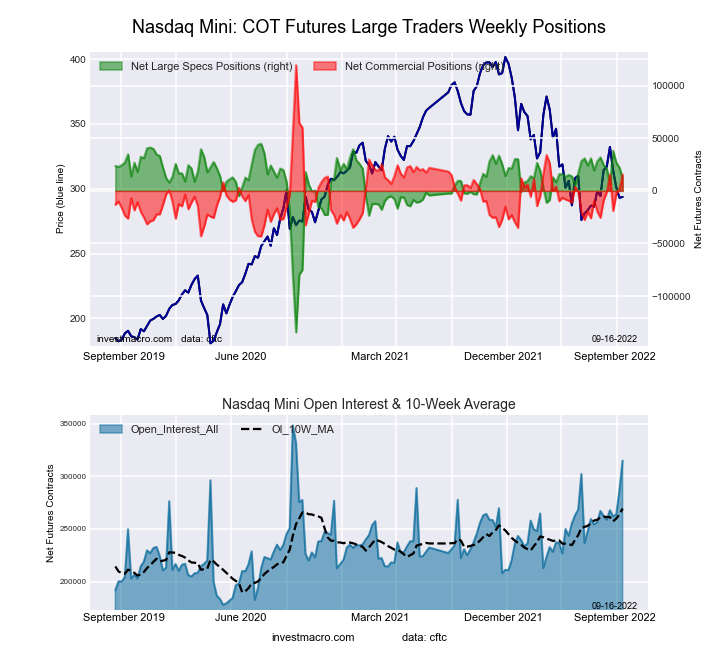 The Nasdaq Mini large speculator standing this week reached a net position of 11,806 contracts in the data reported through Tuesday. This was a weekly decrease of -10,240 contracts from the previous week which had a total of 22,046 net contracts.
This week’s current strength score (the trader positioning range over the past three years, measured from 0 to 100) shows the speculators are currently Bullish-Extreme with a score of 81.6 percent. The commercials are Bearish with a score of 36.1 percent and the small traders (not shown in chart) are Bearish-Extreme with a score of 0.0 percent.
| Nasdaq Mini Futures Statistics | SPECULATORS | COMMERCIALS | SMALL TRADERS |
| – Percent of Open Interest Longs: | 23.9 | 58.2 | 12.3 |
| – Percent of Open Interest Shorts: | 20.2 | 53.3 | 21.0 |
| – Net Position: | 11,806 | 15,545 | -27,351 |
| – Gross Longs: | 75,279 | 183,440 | 38,679 |
| – Gross Shorts: | 63,473 | 167,895 | 66,030 |
| – Long to Short Ratio: | 1.2 to 1 | 1.1 to 1 | 0.6 to 1 |
| NET POSITION TREND: | |||
| – Strength Index Score (3 Year Range Pct): | 81.6 | 36.1 | 0.0 |
| – Strength Index Reading (3 Year Range): | Bullish-Extreme | Bearish | Bearish-Extreme |
| NET POSITION MOVEMENT INDEX: | |||
| – 6-Week Change in Strength Index: | -7.2 | 15.2 | -22.4 |
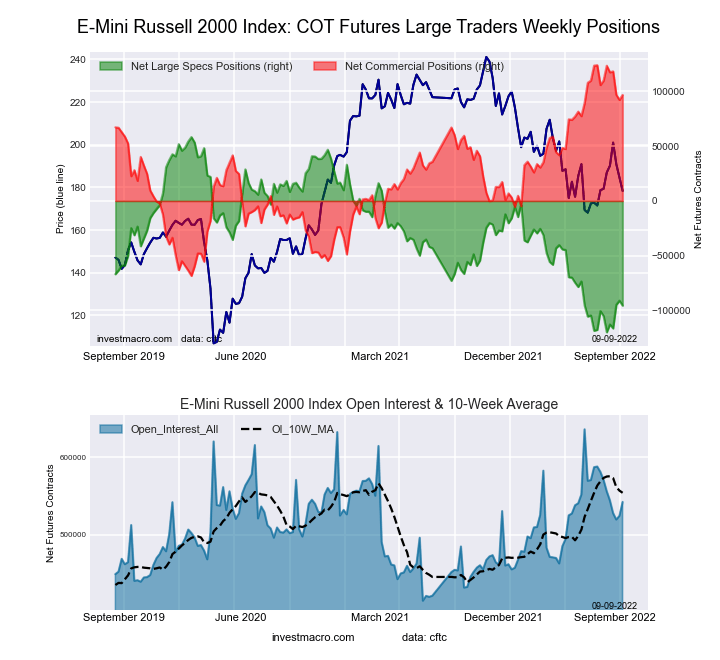
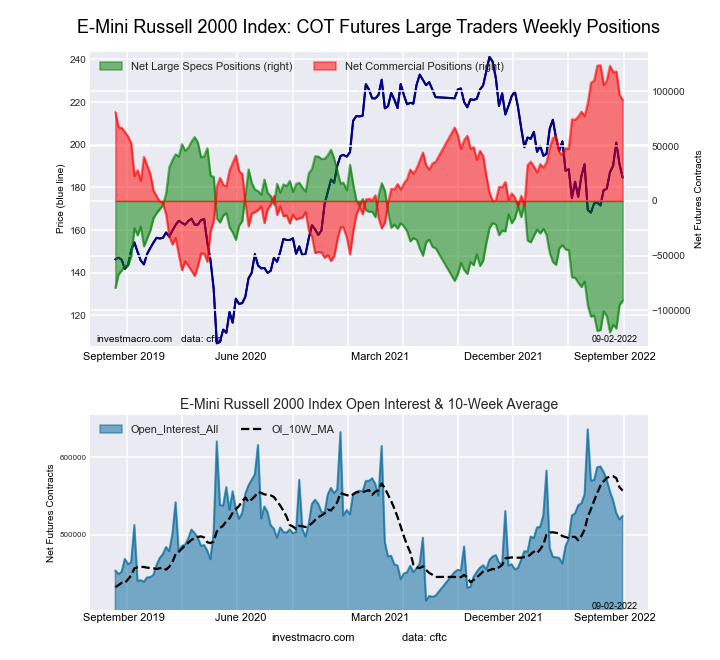
Russell 2000 Mini Futures:
 The Russell 2000 Mini large speculator standing this week reached a net position of -99,152 contracts in the data reported through Tuesday. This was a weekly lowering of -3,547 contracts from the previous week which had a total of -95,605 net contracts.
This week’s current strength score (the trader positioning range over the past three years, measured from 0 to 100) shows the speculators are currently Bearish-Extreme with a score of 11.7 percent. The commercials are Bullish-Extreme with a score of 91.6 percent and the small traders (not shown in chart) are Bearish-Extreme with a score of 1.1 percent.
| Russell 2000 Mini Futures Statistics | SPECULATORS | COMMERCIALS | SMALL TRADERS |
| – Percent of Open Interest Longs: | 6.4 | 86.3 | 4.5 |
| – Percent of Open Interest Shorts: | 23.3 | 67.8 | 6.0 |
| – Net Position: | -99,152 | 107,746 | -8,594 |
| – Gross Longs: | 37,156 | 504,080 | 26,407 |
| – Gross Shorts: | 136,308 | 396,334 | 35,001 |
| – Long to Short Ratio: | 0.3 to 1 | 1.3 to 1 | 0.8 to 1 |
| NET POSITION TREND: | |||
| – Strength Index Score (3 Year Range Pct): | 11.7 | 91.6 | 1.1 |
| – Strength Index Reading (3 Year Range): | Bearish-Extreme | Bullish-Extreme | Bearish-Extreme |
| NET POSITION MOVEMENT INDEX: | |||
| – 6-Week Change in Strength Index: | 11.7 | -8.2 | -15.5 |
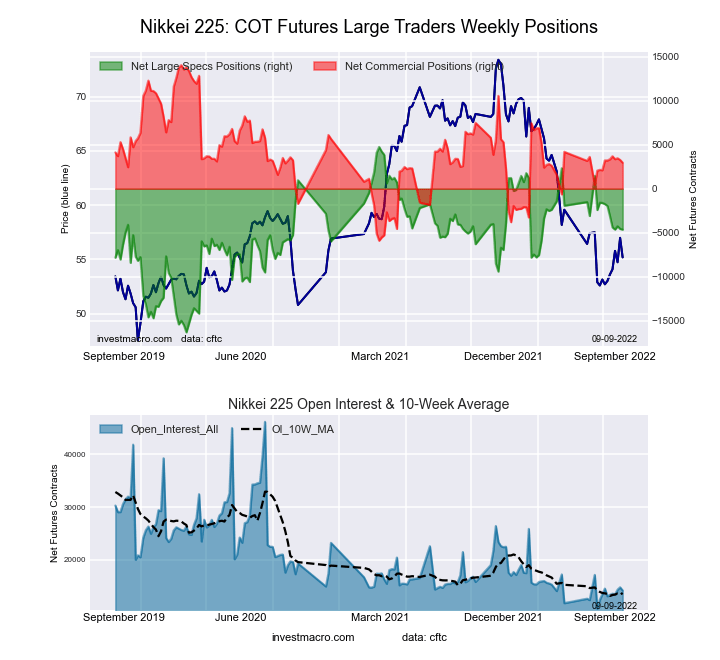
Nikkei Stock Average (USD) Futures:
 The Nikkei Stock Average (USD) large speculator standing this week reached a net position of -4,641 contracts in the data reported through Tuesday. This was a weekly lowering of -78 contracts from the previous week which had a total of -4,563 net contracts.
This week’s current strength score (the trader positioning range over the past three years, measured from 0 to 100) shows the speculators are currently Bullish with a score of 55.4 percent. The commercials are Bearish with a score of 44.4 percent and the small traders (not shown in chart) are Bearish with a score of 49.6 percent.
| Nikkei Stock Average Futures Statistics | SPECULATORS | COMMERCIALS | SMALL TRADERS |
| – Percent of Open Interest Longs: | 12.2 | 53.3 | 34.2 |
| – Percent of Open Interest Shorts: | 45.0 | 32.5 | 22.3 |
| – Net Position: | -4,641 | 2,949 | 1,692 |
| – Gross Longs: | 1,729 | 7,548 | 4,844 |
| – Gross Shorts: | 6,370 | 4,599 | 3,152 |
| – Long to Short Ratio: | 0.3 to 1 | 1.6 to 1 | 1.5 to 1 |
| NET POSITION TREND: | |||
| – Strength Index Score (3 Year Range Pct): | 55.4 | 44.4 | 49.6 |
| – Strength Index Reading (3 Year Range): | Bullish | Bearish | Bearish |
| NET POSITION MOVEMENT INDEX: | |||
| – 6-Week Change in Strength Index: | -12.8 | -1.3 | 37.0 |
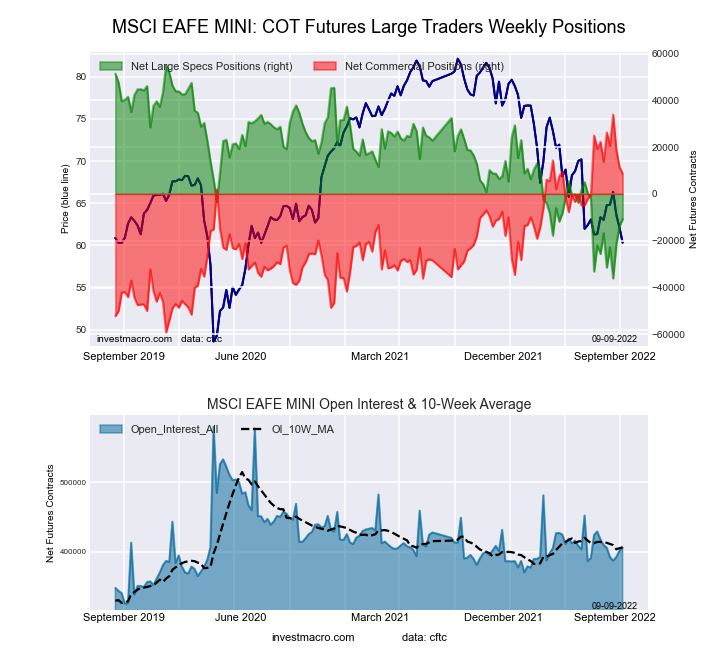
MSCI EAFE Mini Futures:
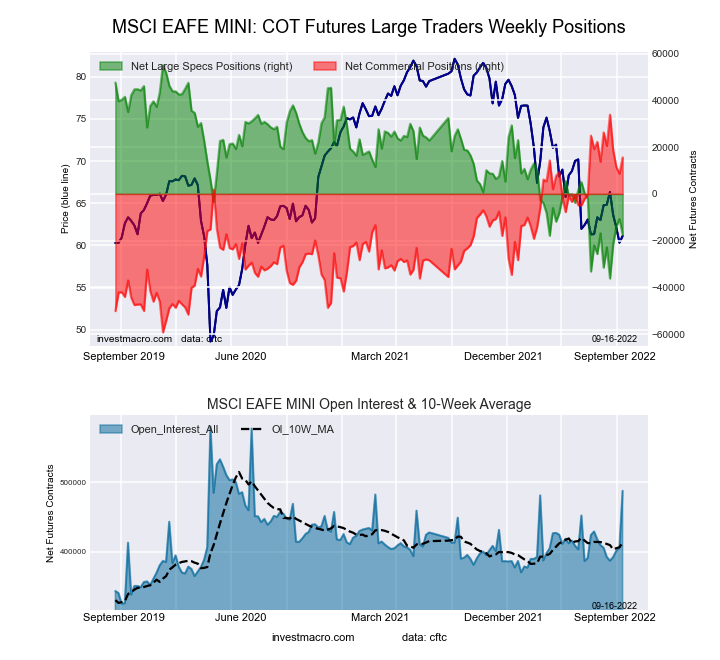 The MSCI EAFE Mini large speculator standing this week reached a net position of -17,432 contracts in the data reported through Tuesday. This was a weekly decrease of -6,664 contracts from the previous week which had a total of -10,768 net contracts.
This week’s current strength score (the trader positioning range over the past three years, measured from 0 to 100) shows the speculators are currently Bearish with a score of 20.5 percent. The commercials are Bullish-Extreme with a score of 80.4 percent and the small traders (not shown in chart) are Bearish with a score of 34.7 percent.
| MSCI EAFE Mini Futures Statistics | SPECULATORS | COMMERCIALS | SMALL TRADERS |
| – Percent of Open Interest Longs: | 4.2 | 90.0 | 5.2 |
| – Percent of Open Interest Shorts: | 7.8 | 86.8 | 4.8 |
| – Net Position: | -17,432 | 15,627 | 1,805 |
| – Gross Longs: | 20,356 | 438,607 | 25,389 |
| – Gross Shorts: | 37,788 | 422,980 | 23,584 |
| – Long to Short Ratio: | 0.5 to 1 | 1.0 to 1 | 1.1 to 1 |
| NET POSITION TREND: | |||
| – Strength Index Score (3 Year Range Pct): | 20.5 | 80.4 | 34.7 |
| – Strength Index Reading (3 Year Range): | Bearish | Bullish-Extreme | Bearish |
| NET POSITION MOVEMENT INDEX: | |||
| – 6-Week Change in Strength Index: | 15.4 | -11.4 | -30.2 |
Article By InvestMacro – Receive our weekly COT Reports by Email
*COT Report: The COT data, released weekly to the public each Friday, is updated through the most recent Tuesday (data is 3 days old) and shows a quick view of how large speculators or non-commercials (for-profit traders) were positioned in the futures markets.
The CFTC categorizes trader positions according to commercial hedgers (traders who use futures contracts for hedging as part of the business), non-commercials (large traders who speculate to realize trading profits) and nonreportable traders (usually small traders/speculators) as well as their open interest (contracts open in the market at time of reporting). See CFTC criteria here.


