Archive for Stock Market News – Page 48

The Final Act BEFORE a Housing Bubble Bursts

Here’s a time-tested indicator of trend turns in financial markets

By Elliott Wave International

Financial history shows that feverish foreign buying of a financial asset usually marks the end of that asset’s upward trend.

The reason why is that foreign buyers tend to enthusiastically jump on a trend after it’s already run its course — or nearly so.

You can find an example of this going as far back as Tulip Mania in Holland in the 1600s. But let’s stick with history which goes back just a generation or so, namely, the commercial real estate boom of the late 1980s.

Japan’s stock market had been racing higher and Japanese investors were pouring money into U.S. real estate. One of their prize purchases was Rockefeller Center in 1989. Mitsubishi paid $2 billion for this “Hope Diamond of world real estate.” By 1995, Rockefeller Center went bankrupt and Mitsubishi lost its entire investment.

Another case in point is the U.S. stock market in 2007.

The August 2007 Global Market Perspective, a monthly Elliott Wave International publication which covers 50-plus worldwide financial markets, showed this chart and said:

Foreigners jumped into the U.S. market like never before in May [2007]. The new record was a full third higher than the old one, which was set in February 2000, one month after the Dow Industrials’ 2000 peak. … The first five months of [2007] produced what was easily the biggest gusher of net foreign buying in history. The record suggests that falling prices lie directly ahead for the U.S. market.

Two months after that analysis was provided, the Dow Industrials topped, and then entered a bear market which lasted nearly a year and a half.

What does all of this have to do with today?

Get this: Chinese investors spent a record $6.1 billion on U.S. homes from April 2021 through March 2022, according to the National Association of Realtors.

Canada was second on the list — buyers there spent $5.5 billion on U.S. residential real estate. Buyers from India ranked third at $3.6 billion.

So this July Washington Post headline is not surprising:

The housing market, at last, appears to be cooling off

Here’s a quote from the Elliott Wave Theorist, a monthly publication which has provided analysis of financial markets and major cultural trends since 1979:

A burst in the U.S. housing bubble could have enormous repercussions in the world economy. The aggregate value of housing is far greater than that of the stock market, so fluctuations in house prices may have a much greater effect on consumer spending.

This was written in January 2006 — about six months before the peak in the prior housing bubble, which helped to usher in the Great Recession.

Another housing market indicator is none other than the stock market. In other words, the housing market tends to be correlated with the trend of the stock market.

Elliott wave analysis can help you anticipate what’s next for the stock market. If you need a refresher on the Elliott wave model, you are encouraged to read Frost & Prechter’s book, Elliott Wave Principle: Key to Market Behavior. Here’s a quote from this Wall Street classic:

In markets, progress ultimately takes the form of five waves of a specific structure. Three of these waves, which are labeled 1, 3 and 5, actually effect the directional movement. They are separated by two countertrend interruptions, which are labeled 2 and 4. The two interruptions are apparently a requisite for overall directional movement to occur.

You can delve deeper into the Wave Principle by reading the entire online version of the book for free!

The only requirement for free and unlimited access is a Club EWI membership, which is also free.

Club EWI is the world’s largest Elliott wave educational community and members enjoy complimentary access to a wealth of Elliott wave resources on financial markets, investing and trading without any obligations.

Simply follow the link to get started right away: Elliott Wave Principle: Key to Market Behaviorget instant access — free.

This article was syndicated by Elliott Wave International and was originally published under the headline The Final Act BEFORE a Housing Bubble Bursts. EWI is the world’s largest market forecasting firm. Its staff of full-time analysts led by Chartered Market Technician Robert Prechter provides 24-hour-a-day market analysis to institutional and private investors around the world.

ETFs That Track Retail Investing Trends

By Ino.com

– Over the past few years, retail investors have shown they have the power (money) to take stock prices to ‘the moon’ if they operate as a group.

Last year it was GameStop (GME) and AMC (AMC).

Just a few weeks ago, it was AMTD Digital Inc (HKD), which was IPO’d in July and has had a trading range of $13.52 per share up to $2,555.30 per share since the initial public offer. HKD is currently trading in the low $200 range.

But just because retail investors can do something, does that mean they should? Are the retail crowd good stock pickers? And should you follow their lead?

At this time, we don’t know the answer to these questions. That is because we don’t have enough data on whether or not retail investors operating as a whole are good stock pickers. They have only really been flexing their muscle for a little more than a year.

Plus, when they started with GME and AMC, we were still in a bull market. But now, we are in a bear market. So it would be unfair to say the retail investor’s recent performance shows their lack of sophistication and that they don’t belong picking stocks.

A few Exchange Traded Funds track what retail investors are talking about on social media or buying in their brokerage accounts, and as of late, retail investor stock picks are not outperforming the market.

The VanEck Social Sentiment ETF (BUZZ), which tracks the top 75 companies with the most popular sentiment online based on a proprietary AI model to select stocks, is down 32% year-to-date.

The SoFi Social 50 ETF (SFYF), which tracks the 50 most widely held stocks in self-directed brokerage accounts of Sofi Securities, is down 25.55% year-to-date.

And the FOMO ETF (FOMO), which invests in the areas of the market that are currently in favor with retail and individual investors or currently ‘trending,’ is down 17.94% year-to-date.

For comparison, a few ETFs that are either managed by professional stock pickers or track the performance of hedge funds are also having a tough year.

The Motley Fool 100 Index ETF (TMFC), which invests in the top 100 stocks selected by Motley Fool analysts, is down 17.64% year-to-date.

The Global X Guru Index ETF (GURU), the Goldman Sachs Hedge Industry VIP ETF (GVIP), and the AlphaClone Alternative Alpha ETF (ALFA), all of which track and mimic the holdings of hedge funds; have produced negative year-to-date returns of 23.22%, 22.90%, and 21.66% respectively.

The performance of these professionally run ETFs shows that even the pros, who are getting paid millions to manage other people’s money, are, as a whole, performing just as poorly as the retail investors.

The S&P 500 is what many consider the ‘market,’ and the QQQ comprises the top 100 technology stocks on the NASDAQ.

However, the SPDR S&P 500 ETF (SPY) is down 12.09% year-to-date, while the Invesco QQQ ETF (QQQ) is down 18.59%. So these are great examples of alternative ETF investments investors could buy as opposed to BUZZ, SFYF, or FOMO.

Furthermore, based on the QQQ’s performance, there is an argument that it’s not that retail investors are poor at picking stocks but that technology stocks, which represent a large portion of the retail investor-focused ETFs, are having an overwhelmingly lousy year.

The performance of the S&P 500 in 2022 highlights the old argument that stock picking is not worth the time or energy professionals or retail investors dedicate to it.

But again, we are only eight months into the year, which is a tiny snapshot of time for long-term investors. And much of which has been during a bear market.

Historical data (Warren Buffett, Peter Lynch, Carl Icahn, Bill Miller) has shown that some investors can beat the market, and maybe the next great generational investor will come from the retail side, not Wall Street.

Regardless, investors interested in what other retail investors are buying and discussing on message boards may find BUZZ, SFYF, or FOMO attractive since they take the work out of tracking what other investors like and dislike.

My only suggestion would be to make one of these ETFs a small percentage of your total portfolio. The bulk of your portfolio should be in one of the S&P 500, NASDAQ, or other major index-focused ETFs.

Matt Thalman
INO.com Contributor
Follow me on Twitter @mthalman5513

Disclosure: This contributor did not hold a position in any investment mentioned above at the time this blog post was published. This article is the opinion of the contributor themselves. The above is a matter of opinion provided for general information purposes only and is not intended as investment advice. This contributor is not receiving compensation (other than from INO.com) for their opinion.

By Ino.com – See our Trader Blog, INO TV Free & Market Analysis Alerts

Source: ETFs That Track Retail Investing Trends

2 REITs to Buy and Hold

By Ino.com

– Despite the macroeconomic headwinds, real estate investment trusts (REITs) are expected to remain resilient due to rising demand, appreciation of property prices amid the high inflation, and increasing rental income. Moreover, REITs are considered ideal investments in uncertain market conditions since they pay out at least 90% of their income as dividends.

So, quality REITs LTC Properties (LTC) and Getty Realty (GTY) could be ideal investments to survive the short-term market fluctuations and create solid long-term returns.

High inflation, rising interest rates, and economic uncertainties have discouraged home buyers this year. However, increased regional population distribution, rising demand for rental properties, and appreciating property prices bode well for real estate investment trusts (REITs).

In addition, the inclination of businesses toward local sourcing after the pandemic is expected to drive further growth in this sector. The real estate sector in the United States is projected to grow at a 3.7% CAGR to $412.60 billion by 2025.

Moreover, REITs are considered safe investments in uncertain times since they must pay at least 90% of their taxable income as dividends.

Fundamentally sound REITs LTC Properties, Inc. (LTC) and Getty Realty Corporation (GTY) could offer diversification, inflation hedge, and superior dividend returns to long-term investors.

LTC Properties, Inc. (LTC)

LTC invests in senior housing and healthcare properties. It invests in four broad segments: Skilled Nursing centers (SNF); Assisted Living Facilities (ALF); Independent Living Facilities (ILF); and Memory Care facilities (MC). Its operations include sale-leasebacks, mortgage financing, joint ventures, construction financing, and structured financing solutions.

On July 1, LTC declared a monthly cash dividend of $0.19 per common share for July, August, and September 2022. Its dividend payouts have grown at a 6.3% CAGR over the last three years and a 0.2% CAGR over the past five years. Its dividend payout ratio is 98.28%, while its current dividend translates to a 5.24% yield.

On May 12, LTC confirmed a $36 million investment for refinancing debt on four assisted living communities and a land parcel.

According to LTC’s Chairman and CEO, Wendy Simpson, “Year-to-date, LTC has used its flexibility and creativity to invest more than $110 million, with a current focus on newer construction. We will continue to identify new and strategic opportunities across a variety of financing vehicles to put our capital to work in a way that benefits all LTC’s stakeholders.”

LTC’s total revenues increased 12.8% year-over-year to $43.02 million in the fiscal 2022 second quarter ended June 30, 2022. Its operating income came in at $54.11 million, up 201.4% year-over-year. FFO attributable to common shareholders, excluding non-recurring items, amounted to $24.49 million, up 9.8% year-over-year. Its FFO per common share improved 12.3% year-over-year to $0.64.

The consensus FFO estimate of $2.53 for the fiscal year 2022 represents a 7.3% improvement year-over-year. The consensus revenue estimate of $161.80 million for the current year represents a 4.2% increase from the previous year. The company has surpassed the consensus revenue and FFO estimates in each of the trailing four quarters.

LTC has gained 27.9% over the past six months and 23.2% over the past year to close the last trading session at $43.48.

LTC’s POWR Ratings reflect this stable outlook. The REIT has an overall rating of B, which translates to a Buy in the POWR Ratings system. The POWR Ratings assess stocks by 118 different factors, each with its own weighting.

LTC is also rated B in Growth, Momentum, and Sentiment. Within the REITs – Healthcare industry, it is ranked #1 of 16 stocks. Click here to learn more about POWR Ratings.

Getty Realty Corporation (GTY)

GTY invests in convenience stores, automotive service centers, and other single-tenant real estates, such as drive-through quick service restaurants. Its operations include acquisition, financing, and development, and it has a variety of national and regional brands as its tenants.

On July 27, GTY announced that its board of directors declared a dividend of $0.41 per share common payable on October 6 to holders of record on September 22. Its dividend payouts have grown at a 5.8% CAGR over the last three years and an 8.3% CAGR over the past five years. The stock’s four-year average dividend yield is 4.96%, while its current dividend translates to a 5.51% yield.

GTY’s total revenues increased 6.5% year-over-year to $41.18 million in the fiscal 2022 second quarter ended June 30, 2022. Its operating income came in at $37.34 million during the same period, up 98.2% year-over-year. Adjusted FFO amounted to $25.38 million, up 8.3% year-over-year. Its adjusted FFO per common share improved 1.9% year-over-year to $0.53.

The consensus FFO estimate of $2.10 for the fiscal year 2022 represents an 11.6% improvement year-over-year. The consensus revenue estimate of $163.45 million for the current year represents a 6.2% increase from the previous year. It’s no surprise that the company has topped the consensus FFO estimates in three of the trailing four quarters.

GTY has gained 5.4% over the past six months to close the last trading session at $29.74.

GTY’s POWR Ratings reflect this stable outlook. The company has an overall rating of B, which translates to a Buy in the POWR Ratings system. It also has a B grade for Momentum, Stability, and Sentiment. In the 33-stock REITs – Retail industry, it is ranked #3.

Beyond what’s stated above, there are GTY grades for Growth, Value, and Quality. Click here to learn more about POWR Ratings.


About the Author

Mangeet Kaur Bouns’s keen interest in the stock market led her to become an investment researcher and financial journalist. Using her fundamental approach to analyzing stocks, Mangeet’s looks to help retail investors understand the underlying factors before making investment decisions. She earned a bachelor’s degree in finance from BI Norwegian Business School. Mangeet is a regular contributor for StockNews.com.

By Ino.com – See our Trader Blog, INO TV Free & Market Analysis Alerts

Source: 2 REITs to Buy and Hold

COT Week 32 Charts: Stock Market Speculator bets rise led by MSCI EAFE, Russell 2000 & Dow Jones

By InvestMacro | COT | Data Tables | COT Leaders | Downloads | COT Newsletter
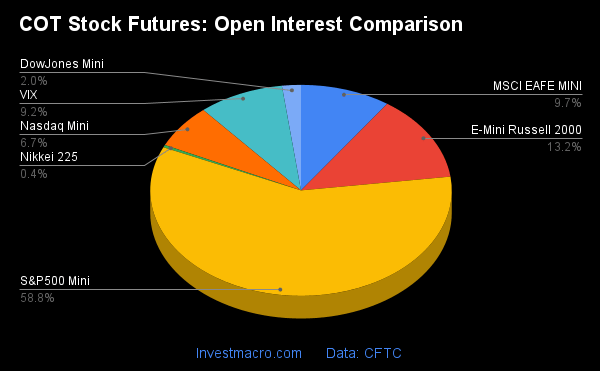
Here are the latest charts and statistics for the Commitment of Traders (COT) data published by the Commodities Futures Trading Commission (CFTC).

The latest COT data is updated through Tuesday August 9th and shows a quick view of how large traders (for-profit speculators and commercial entities) were positioned in the futures markets.

Weekly Speculator Changes

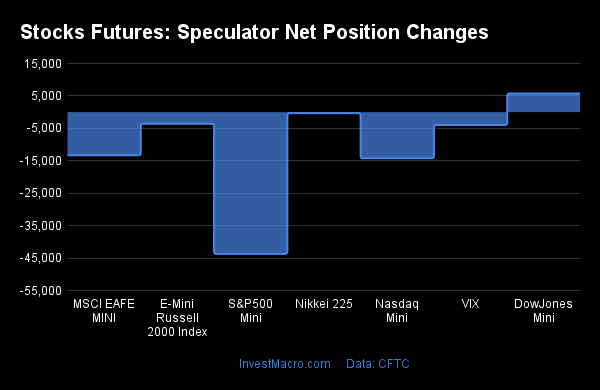
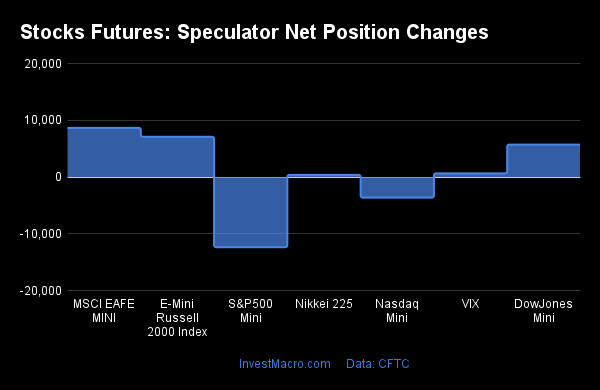
COT stock market speculator bets were mostly higher this week as five out of the seven stock markets we cover had higher positioning this week while two markets had decreasing spec contracts.

Leading the gains for stock markets was the MSCI EAFE Mini (8,666 contracts) and the Russell 2000 Mini (7,087 contracts) with the Dow Jones Mini (5,711 contracts), VIX (643 contracts) and  Nikkei 225 USD (375 contracts) also showing positive weeks.

The stock markets leading the declines this week were the S&P500 Mini (-12,376 contracts) and the Nasdaq Mini (-3,637 contracts) with falling speculator bets on the week.

Stocks Futures Speculators


Data Snapshot of Stock Market Traders | Columns Legend
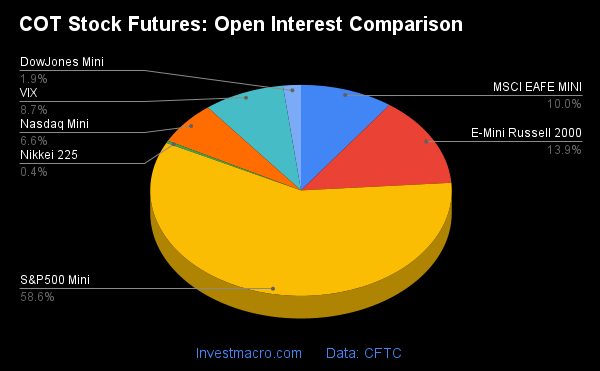
Aug-09-2022OIOI-IndexSpec-NetSpec-IndexCom-NetCOM-IndexSmalls-NetSmalls-Index
S&P500-Mini2,299,3888-244,26111312,241100-67,98012
Nikkei 22514,29710-4,260573,4624779838
Nasdaq-Mini258,7844721,07587-1,16726-19,9088
DowJones-Mini75,39435-12,7102117,16882-4,45815
VIX341,69939-98,19560103,10439-4,90968
Nikkei 225 Yen59,192427,6555823,07584-30,73011


Strength Scores

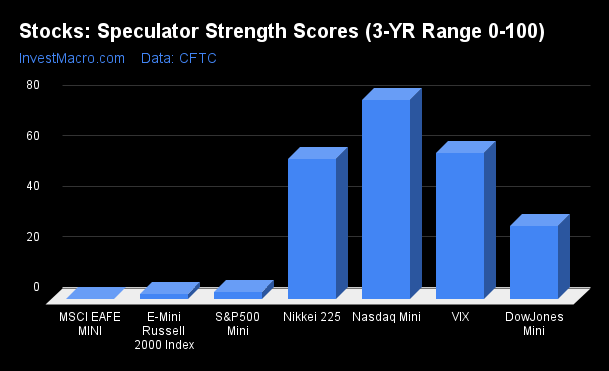
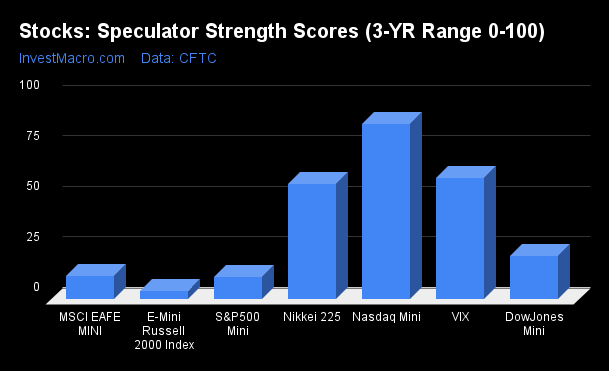
Strength Scores (a normalized measure of Speculator positions over a 3-Year range, from 0 to 100 where above 80 is extreme bullish and below 20 is extreme bearish) show that the Nasdaq-Mini (86.8 percent) continues to lead stocks and remains in a bullish extreme position (above 80 percent). The VIX (60.1 percent) and the Nikkei USD (57.2 percent) come in as the next highest stock markets in strength scores. On the downside, the Russell 2000-Mini (4.0 percent), the S&P500-Mini (10.9 percent) and the EAFE-Mini (11.7 percent) come in as the lowest strength scores currently and are all in bearish extreme speculator levels (below 20 percent).

Stocks Spec Strength Scores (3-YR Range 0-100)

Strength Statistics:
VIX (60.1 percent) vs VIX previous week (59.8 percent)
S&P500-Mini (10.9 percent) vs S&P500-Mini previous week (13.2 percent)
DowJones-Mini (21.4 percent) vs DowJones-Mini previous week (13.8 percent)
Nasdaq-Mini (86.8 percent) vs Nasdaq-Mini previous week (88.8 percent)
Russell2000-Mini (4.0 percent) vs Russell2000-Mini previous week (0.0 percent)
Nikkei USD (57.2 percent) vs Nikkei USD previous week (55.4 percent)
EAFE-Mini (11.7 percent) vs EAFE-Mini previous week (1.9 percent)

Strength Trends

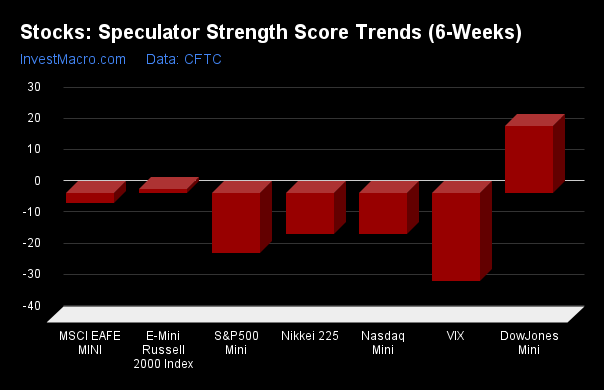
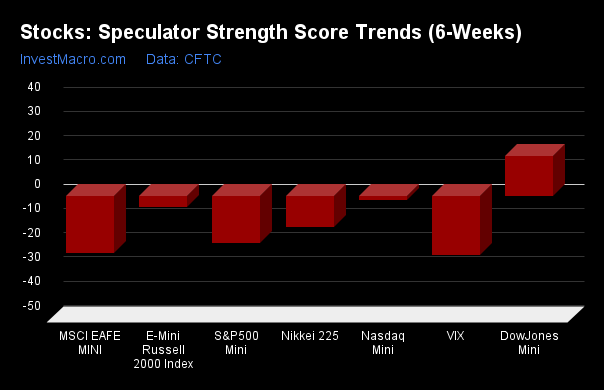
Strength Score Trends (or move index, calculates the 6-week changes in strength scores) show that the DowJones-Mini (16.5 percent) leads the past six weeks trends for stocks and is the only positive mover in the data. The VIX (-24.3 percent), the EAFE-Mini (-23.6 percent) and the S&P500-Mini (-19.5 percent) lead the downside trend scores currently. The data shows that overall, the speculators have had a bearish tilt over that past six weeks.

Stocks Spec Strength Score Trends (6-Weeks)

Strength Trend Statistics:
VIX (-24.3 percent) vs VIX previous week (-24.5 percent)
S&P500-Mini (-19.5 percent) vs S&P500-Mini previous week (-21.8 percent)
DowJones-Mini (16.5 percent) vs DowJones-Mini previous week (9.4 percent)
Nasdaq-Mini (-1.7 percent) vs Nasdaq-Mini previous week (-3.4 percent)
Russell2000-Mini (-4.6 percent) vs Russell2000-Mini previous week (-8.1 percent)
Nikkei USD (-12.6 percent) vs Nikkei USD previous week (-14.5 percent)
EAFE-Mini (-23.6 percent) vs EAFE-Mini previous week (-35.9 percent)


Individual Markets:

VIX Volatility Futures:
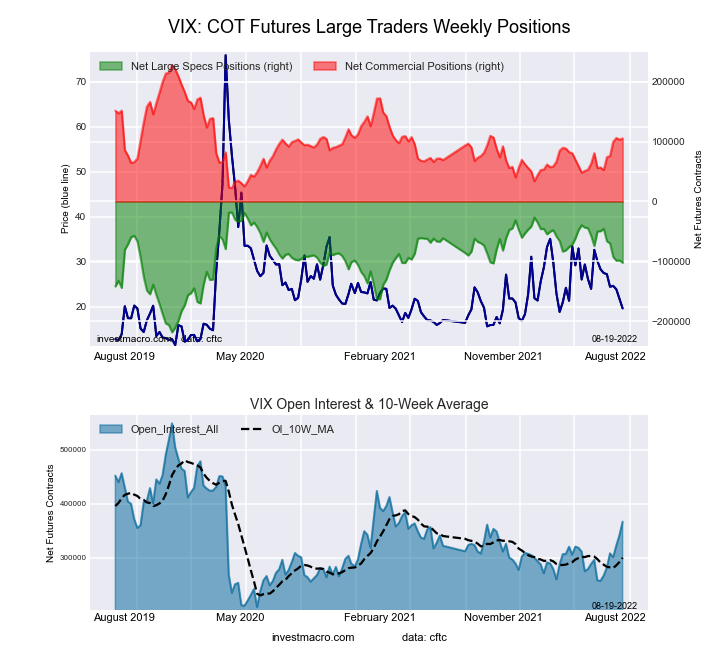
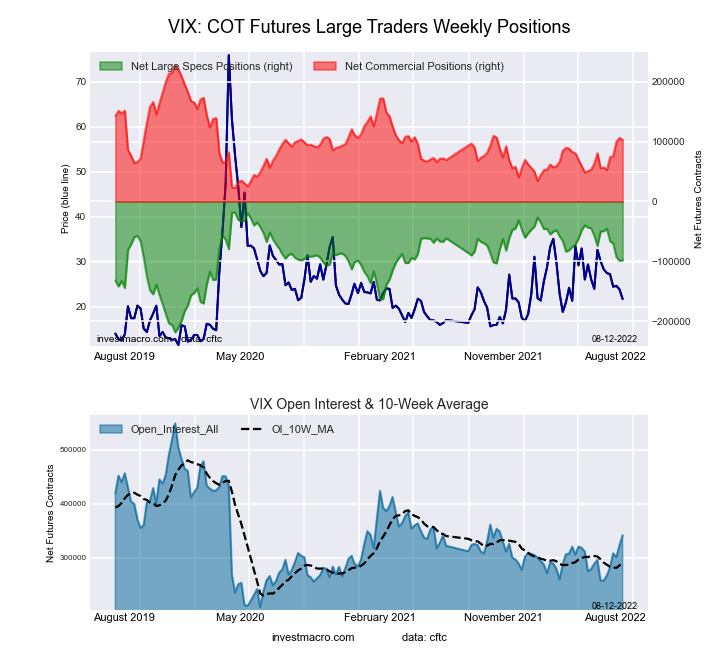
VIX Volatility Futures COT ChartThe VIX Volatility large speculator standing this week came in at a net position of -98,195 contracts in the data reported through Tuesday. This was a weekly lift of 643 contracts from the previous week which had a total of -98,838 net contracts.

This week’s current strength score (the trader positioning range over the past three years, measured from 0 to 100) shows the speculators are currently Bullish with a score of 60.1 percent. The commercials are Bearish with a score of 39.3 percent and the small traders (not shown in chart) are Bullish with a score of 67.5 percent.

VIX Volatility Futures StatisticsSPECULATORSCOMMERCIALSSMALL TRADERS
– Percent of Open Interest Longs:12.160.97.4
– Percent of Open Interest Shorts:40.830.78.8
– Net Position:-98,195103,104-4,909
– Gross Longs:41,377208,08525,269
– Gross Shorts:139,572104,98130,178
– Long to Short Ratio:0.3 to 12.0 to 10.8 to 1
NET POSITION TREND:
– Strength Index Score (3 Year Range Pct):60.139.367.5
– Strength Index Reading (3 Year Range):BullishBearishBullish
NET POSITION MOVEMENT INDEX:
– 6-Week Change in Strength Index:-24.322.611.2


S&P500 Mini Futures:

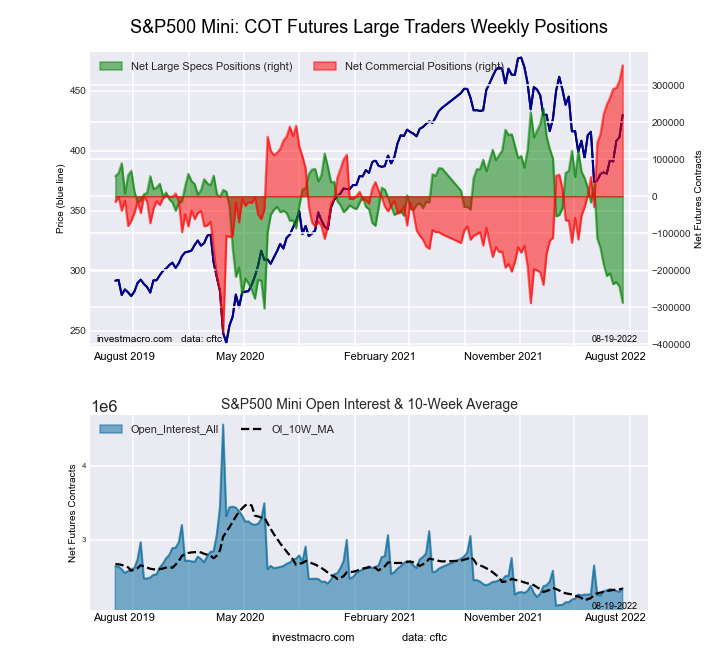
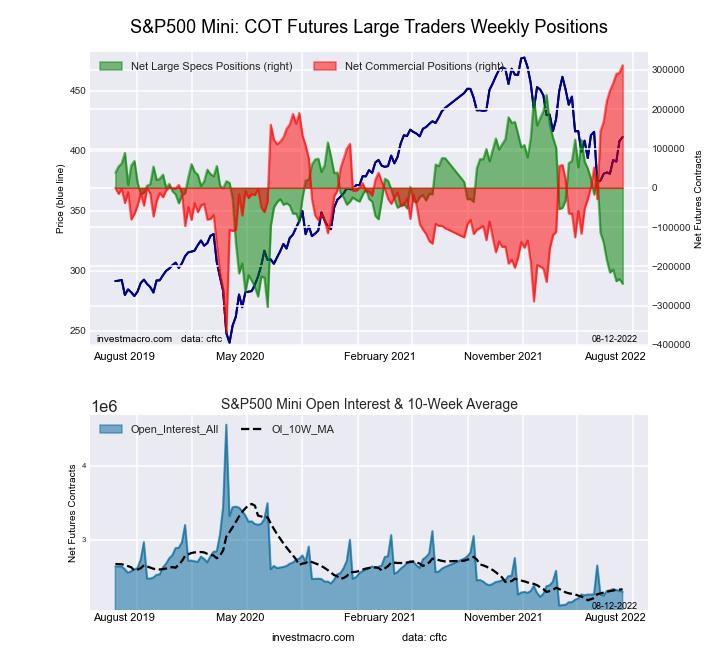
SP500 Mini Futures COT ChartThe S&P500 Mini large speculator standing this week came in at a net position of -244,261 contracts in the data reported through Tuesday. This was a weekly lowering of -12,376 contracts from the previous week which had a total of -231,885 net contracts.

This week’s current strength score (the trader positioning range over the past three years, measured from 0 to 100) shows the speculators are currently Bearish-Extreme with a score of 10.9 percent. The commercials are Bullish-Extreme with a score of 100.0 percent and the small traders (not shown in chart) are Bearish-Extreme with a score of 12.1 percent.

S&P500 Mini Futures StatisticsSPECULATORSCOMMERCIALSSMALL TRADERS
– Percent of Open Interest Longs:9.977.69.5
– Percent of Open Interest Shorts:20.564.112.5
– Net Position:-244,261312,241-67,980
– Gross Longs:227,0641,785,298218,709
– Gross Shorts:471,3251,473,057286,689
– Long to Short Ratio:0.5 to 11.2 to 10.8 to 1
NET POSITION TREND:
– Strength Index Score (3 Year Range Pct):10.9100.012.1
– Strength Index Reading (3 Year Range):Bearish-ExtremeBullish-ExtremeBearish-Extreme
NET POSITION MOVEMENT INDEX:
– 6-Week Change in Strength Index:-19.521.1-8.1


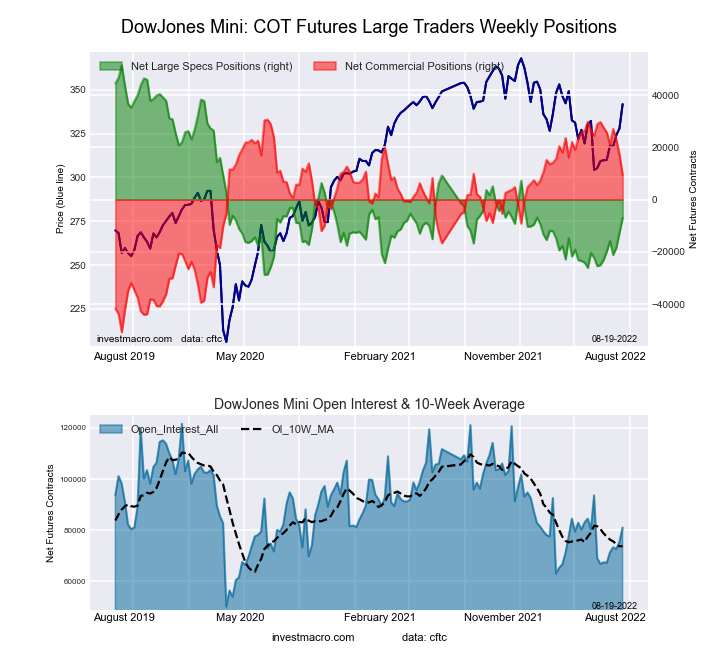
Dow Jones Mini Futures:

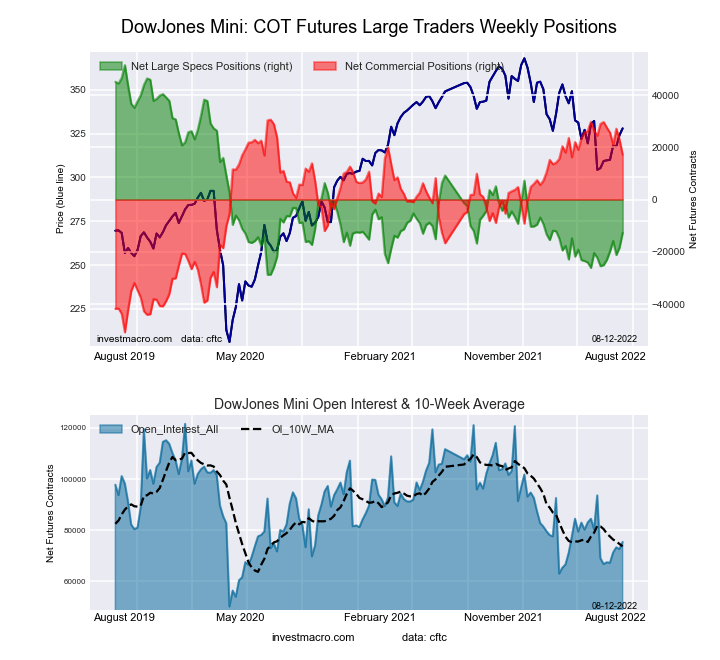
Dow Jones Mini Futures COT ChartThe Dow Jones Mini large speculator standing this week came in at a net position of -12,710 contracts in the data reported through Tuesday. This was a weekly lift of 5,711 contracts from the previous week which had a total of -18,421 net contracts.

This week’s current strength score (the trader positioning range over the past three years, measured from 0 to 100) shows the speculators are currently Bearish with a score of 21.4 percent. The commercials are Bullish-Extreme with a score of 82.0 percent and the small traders (not shown in chart) are Bearish-Extreme with a score of 14.6 percent.

Dow Jones Mini Futures StatisticsSPECULATORSCOMMERCIALSSMALL TRADERS
– Percent of Open Interest Longs:26.559.113.7
– Percent of Open Interest Shorts:43.436.319.7
– Net Position:-12,71017,168-4,458
– Gross Longs:20,00844,52710,357
– Gross Shorts:32,71827,35914,815
– Long to Short Ratio:0.6 to 11.6 to 10.7 to 1
NET POSITION TREND:
– Strength Index Score (3 Year Range Pct):21.482.014.6
– Strength Index Reading (3 Year Range):BearishBullish-ExtremeBearish-Extreme
NET POSITION MOVEMENT INDEX:
– 6-Week Change in Strength Index:16.5-16.80.8


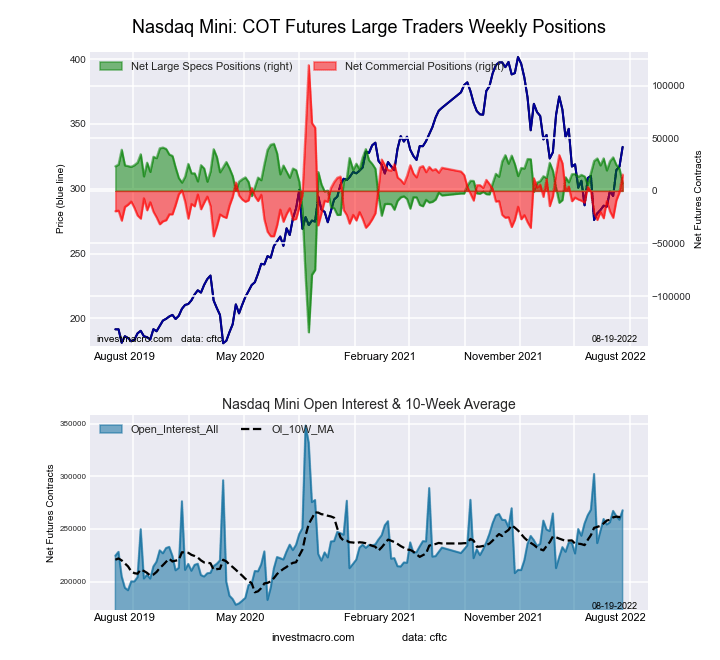
Nasdaq Mini Futures:

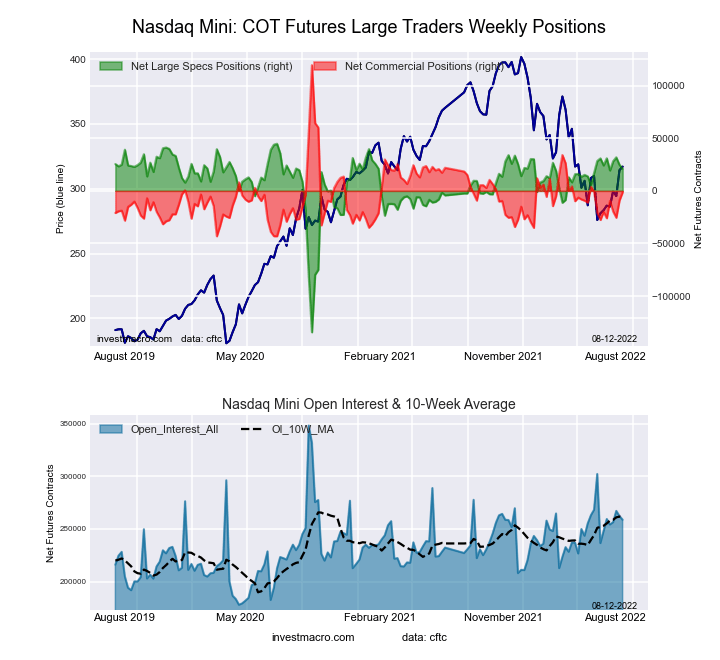
Nasdaq Mini Futures COT ChartThe Nasdaq Mini large speculator standing this week came in at a net position of 21,075 contracts in the data reported through Tuesday. This was a weekly decrease of -3,637 contracts from the previous week which had a total of 24,712 net contracts.

This week’s current strength score (the trader positioning range over the past three years, measured from 0 to 100) shows the speculators are currently Bullish-Extreme with a score of 86.8 percent. The commercials are Bearish with a score of 25.8 percent and the small traders (not shown in chart) are Bearish-Extreme with a score of 7.5 percent.

Nasdaq Mini Futures StatisticsSPECULATORSCOMMERCIALSSMALL TRADERS
– Percent of Open Interest Longs:28.657.811.7
– Percent of Open Interest Shorts:20.458.319.4
– Net Position:21,075-1,167-19,908
– Gross Longs:73,939149,70530,221
– Gross Shorts:52,864150,87250,129
– Long to Short Ratio:1.4 to 11.0 to 10.6 to 1
NET POSITION TREND:
– Strength Index Score (3 Year Range Pct):86.825.87.5
– Strength Index Reading (3 Year Range):Bullish-ExtremeBearishBearish-Extreme
NET POSITION MOVEMENT INDEX:
– 6-Week Change in Strength Index:-1.711.5-32.2


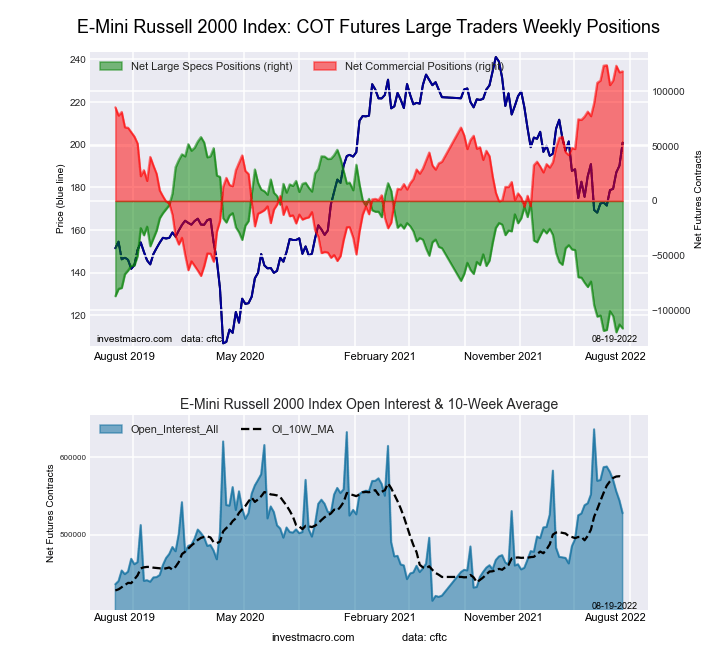
Russell 2000 Mini Futures:

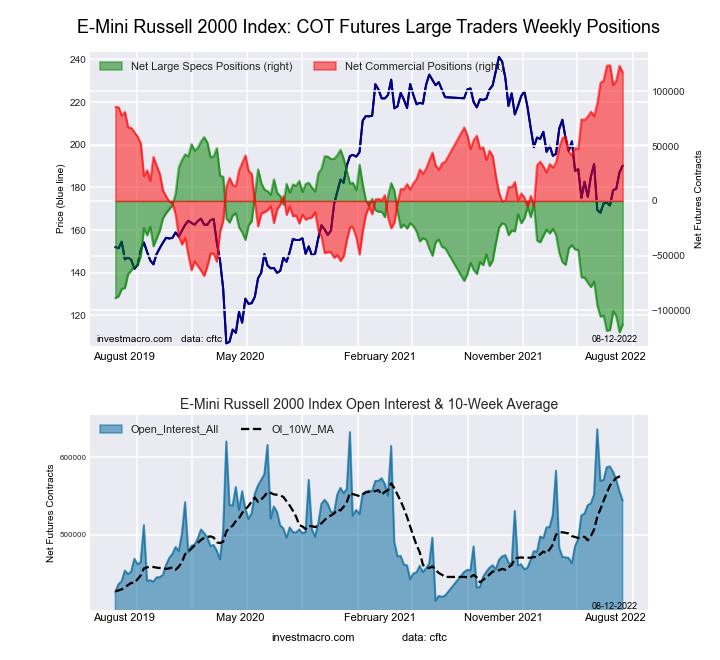
Russell 2000 Mini Futures COT ChartThe Russell 2000 Mini large speculator standing this week came in at a net position of -112,867 contracts in the data reported through Tuesday. This was a weekly rise of 7,087 contracts from the previous week which had a total of -119,954 net contracts.

This week’s current strength score (the trader positioning range over the past three years, measured from 0 to 100) shows the speculators are currently Bearish-Extreme with a score of 4.0 percent. The commercials are Bullish-Extreme with a score of 96.6 percent and the small traders (not shown in chart) are Bearish-Extreme with a score of 13.4 percent.

Russell 2000 Mini Futures StatisticsSPECULATORSCOMMERCIALSSMALL TRADERS
– Percent of Open Interest Longs:5.289.83.6
– Percent of Open Interest Shorts:26.068.24.4
– Net Position:-112,867117,463-4,596
– Gross Longs:28,422488,82319,479
– Gross Shorts:141,289371,36024,075
– Long to Short Ratio:0.2 to 11.3 to 10.8 to 1
NET POSITION TREND:
– Strength Index Score (3 Year Range Pct):4.096.613.4
– Strength Index Reading (3 Year Range):Bearish-ExtremeBullish-ExtremeBearish-Extreme
NET POSITION MOVEMENT INDEX:
– 6-Week Change in Strength Index:-4.63.92.3


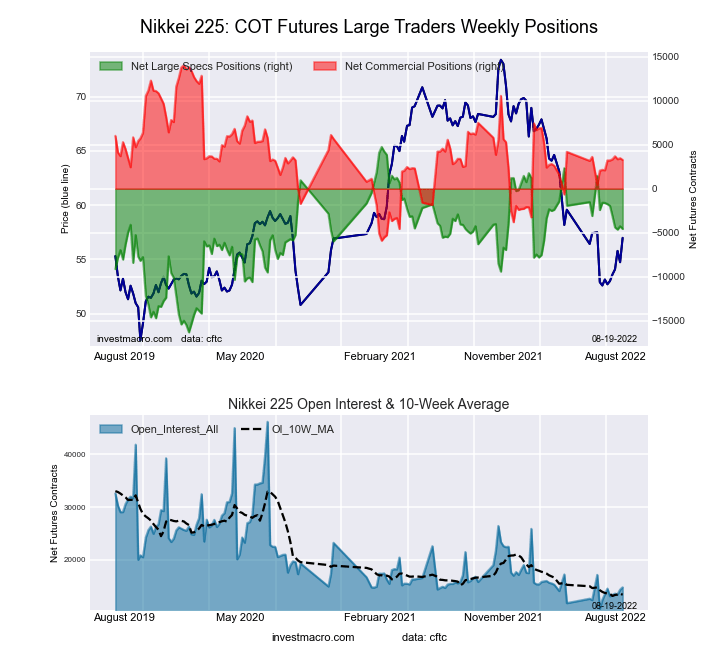
Nikkei Stock Average (USD) Futures:

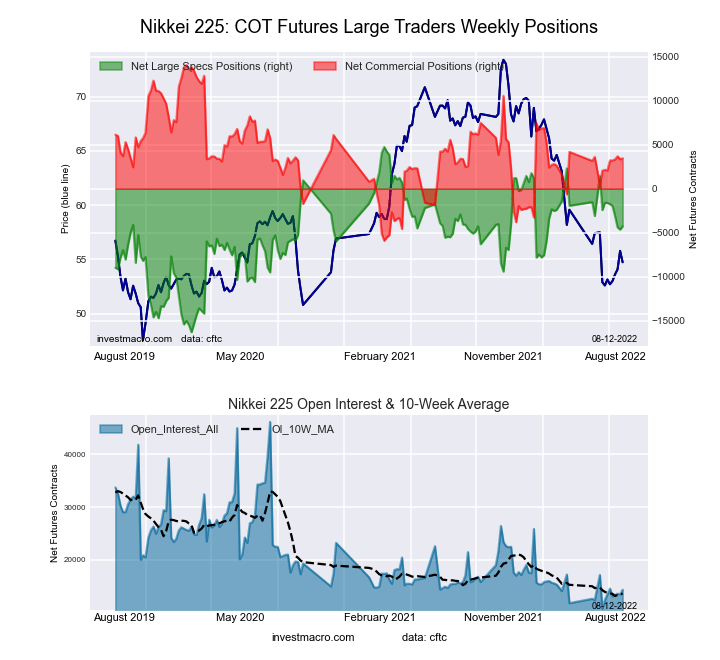
Nikkei Stock Average (USD) Futures COT ChartThe Nikkei Stock Average (USD) large speculator standing this week came in at a net position of -4,260 contracts in the data reported through Tuesday. This was a weekly lift of 375 contracts from the previous week which had a total of -4,635 net contracts.

This week’s current strength score (the trader positioning range over the past three years, measured from 0 to 100) shows the speculators are currently Bullish with a score of 57.2 percent. The commercials are Bearish with a score of 47.0 percent and the small traders (not shown in chart) are Bearish with a score of 38.3 percent.

Nikkei Stock Average Futures StatisticsSPECULATORSCOMMERCIALSSMALL TRADERS
– Percent of Open Interest Longs:15.956.127.4
– Percent of Open Interest Shorts:45.731.921.9
– Net Position:-4,2603,462798
– Gross Longs:2,2788,0173,922
– Gross Shorts:6,5384,5553,124
– Long to Short Ratio:0.3 to 11.8 to 11.3 to 1
NET POSITION TREND:
– Strength Index Score (3 Year Range Pct):57.247.038.3
– Strength Index Reading (3 Year Range):BullishBearishBearish
NET POSITION MOVEMENT INDEX:
– 6-Week Change in Strength Index:-12.66.816.1


MSCI EAFE Mini Futures:

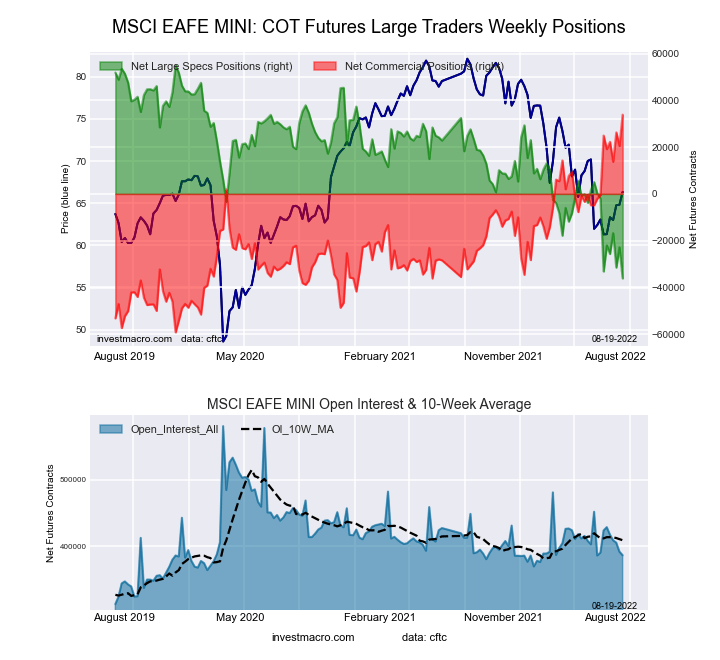
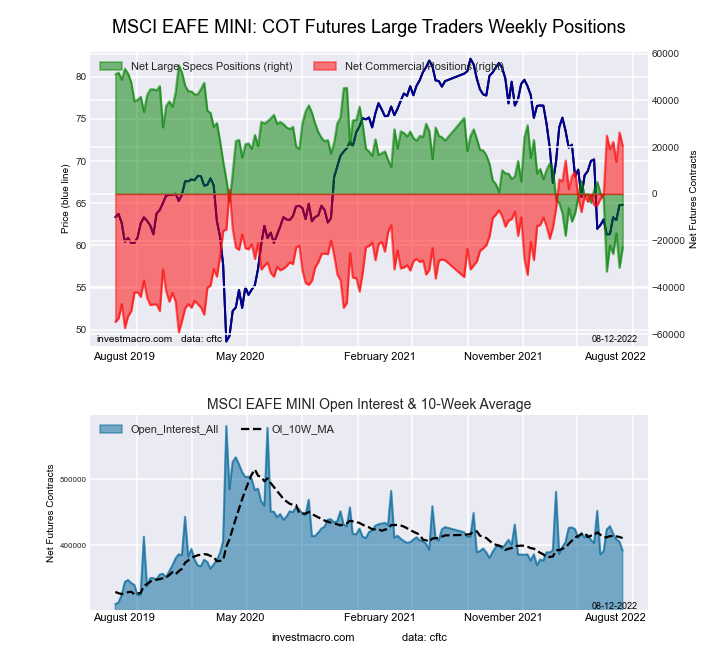
MSCI EAFE Mini Futures COT ChartThe MSCI EAFE Mini large speculator standing this week came in at a net position of -22,848 contracts in the data reported through Tuesday. This was a weekly lift of 8,666 contracts from the previous week which had a total of -31,514 net contracts.

This week’s current strength score (the trader positioning range over the past three years, measured from 0 to 100) shows the speculators are currently Bearish-Extreme with a score of 11.7 percent. The commercials are Bullish-Extreme with a score of 93.2 percent and the small traders (not shown in chart) are Bearish with a score of 39.4 percent.

MSCI EAFE Mini Futures StatisticsSPECULATORSCOMMERCIALSSMALL TRADERS
– Percent of Open Interest Longs:5.192.42.0
– Percent of Open Interest Shorts:10.987.11.4
– Net Position:-22,84820,4972,351
– Gross Longs:19,817362,2557,872
– Gross Shorts:42,665341,7585,521
– Long to Short Ratio:0.5 to 11.1 to 11.4 to 1
NET POSITION TREND:
– Strength Index Score (3 Year Range Pct):11.793.239.4
– Strength Index Reading (3 Year Range):Bearish-ExtremeBullish-ExtremeBearish
NET POSITION MOVEMENT INDEX:
– 6-Week Change in Strength Index:-23.624.6-1.3


Article By InvestMacroReceive our weekly COT Reports by Email

*COT Report: The COT data, released weekly to the public each Friday, is updated through the most recent Tuesday (data is 3 days old) and shows a quick view of how large speculators or non-commercials (for-profit traders) were positioned in the futures markets.

The CFTC categorizes trader positions according to commercial hedgers (traders who use futures contracts for hedging as part of the business), non-commercials (large traders who speculate to realize trading profits) and nonreportable traders (usually small traders/speculators) as well as their open interest (contracts open in the market at time of reporting).See CFTC criteria here.

Single Stock ETFs Are Here

By Ino.com

In July, AXS Investments debuted US-based investors’ first single stock Exchange Traded Funds. These ETFs allow investors to gain leverage on certain individual stocks.

However, because you are using leverage, there is more risk involved, and the authorities want investors to understand these risks before purchasing these new products.

The risks are associated with the leveraged exposure these new ETFs offer and the risk associated with investing in individual stocks. But since leverage is being applied, the risk level multiplies.

For example, one of the new ETFs being offered is the AXS 2X NKE Bull Daily ETF (NKEL) which provides investors 2X leverage to Nike (NKE) stock. This would mean that if you owned NKEL on a day when Nike stock increased by 0.50%, the NKEL ETF, which is 2X leverage, will go up 1.00%.

But, the opposite is also true. So if Nike stock fell by 1%, the NKEL ETF, which tracks Nike stock at a 2X leveraged ratio, would lose 2%.

Leverage is a very nice thing to have when it is being applied in the direction you want it to move. But leverage can be deadly when it is going against you.

Hence why the Securities and Exchange Commission is warning investors of the dangers associated with any single stock ETF, even if it is not marketing itself as leveraged.

One example of a new single stock ETF that is not marketing itself as leveraged is the AXS TSLA Bear Daily ETF (TSLQ). This ETF only tracks Tesla, but to the downside with just 1X leveraged exposure.

This essentially means that the TSLQ is shorting Tesla. But, unlike having to short a stock, which would require approval from your broker, a margin account, and the risk of not losing more than 100% of your investment, you simply have to buy this one ETF and not worry about the other things.

AXS currently has eight single-stock ETFs:

The AXS TSLA Bear Daily ETF (TSLQ), shorts Tesla.
The AXS 1.25X NVDA Bear Daily ETF (NVDS) is short NVDA.
The AXS 1.5X PYPL Bear Daily ETF (PYPS) which shorts PayPal.
The AXS 1.5X PYPL Bull Daily ETF (PYPT) which is long PayPal.
The AXS 2X NKE Bear Daily ETF (NKEQ) which is short Nike.
The AXS 2X NKE Bull Daily ETF (NKEL) which is bullish Nike.
The AXS 2X PFE Bear Daily ETF (PFES) is short Pfizer.
The AXS 2X PFE Bull Daily ETF (PFEL) is long Pfizer.

The leveraged ones have the amount of leverage they are providing in the name of the ETF. But all the funds currently charge a 1.15% expense ratio and are intended to be held one day at a time due to the contango effect caused by gaining leverage or the inversion.

More single stock leveraged and inverse ETFs are coming to the market as Direxion, GraniteShares, and Kurv Investment Management all have filed with the SEC to be permitted to offer their own single stock ETFs.

The filing shows that roughly 35 stocks will have a corresponding ETF, with some being blue chip stocks, some in the technology world, some in energy, and even some that are just very volatile stocks.

Investors are and will continue to be given a lot of opportunities to invest with leverage and make ‘bets’ on the direction of individual stocks.

But, just because you can do something does not always mean you should do it.

Learn more about the risks of investing in these ETFs and how contango will affect your investment if you hold these ETFs for longer than one day at a time before owning these single stock ETFs.

Matt Thalman
INO.com Contributor
Follow me on Twitter @mthalman5513

Disclosure: This contributor did not hold a position in any investment mentioned above at the time this blog post was published. This article is the opinion of the contributor themselves. The above is a matter of opinion provided for general information purposes only and is not intended as investment advice. This contributor is not receiving compensation (other than from INO.com) for their opinion.

By Ino.com – See our Trader Blog, INO TV Free & Market Analysis Alerts

Source: Single Stock ETFs Are Here

What is a semiconductor? An electrical engineer explains how these critical electronic components work and how they are made

By Trevor Thornton, Arizona State University 

Semiconductors are a critical part of almost every modern electronic device, and the vast majority of semiconductors are made in Tawain. Increasing concerns over the reliance on Taiwain for semiconductors – especially given the tenuous relationship between Taiwan and China – led the U.S. Congress to pass the CHIPS and Science act in late July 2022. The act provides more than US$50 billion in subsidies to boost U.S. semiconductor production and has been widely covered in the news. Trevor Thornton, an electrical engineer who studies semiconductors, explains what these devices are and how they are made.

Two shiny black discs.
Thin, round slices of silicon crystals, called wafers, are the starting point for most semiconductor chips.
Hebbe/Wikimedia Commons

1. What is a semiconductor?

Generally speaking, the term semiconductor refers to a material – like silicon – that can conduct electricity much better than an insulator such as glass, but not as well as metals like copper or aluminum. But when people are talking about semiconductors today, they are usually referring to semiconductor chips.

These chips are typically made from thin slices of silicon with complex components laid out on them in specific patterns. These patterns control the flow of current using electrical switches – called transistors – in much the same way you control the electrical current in your home by flipping a switch to turn on a light.

The difference between your house and a semiconductor chip is that semiconductor switches are entirely electrical – no mechanical components to flip – and the chips contain tens of billions of switches in an area not much larger than the size of a fingernail.

A silicon disc, or ‘wafer,’ yields dozens of semiconductor chips.
Steve Jurvetson/Wikimedia Commons, CC BY

2. What do semiconductors do?

Semiconductors are how electronic devices process, store and receive information. For instance, memory chips store data and software as binary code, digital chips manipulate the data based on the software instructions, and wireless chips receive data from high-frequency radio transmitters and convert them into electrical signals. These different chips work together under the control of software. Different software applications perform very different tasks, but they all work by switching the transistors that control the current.

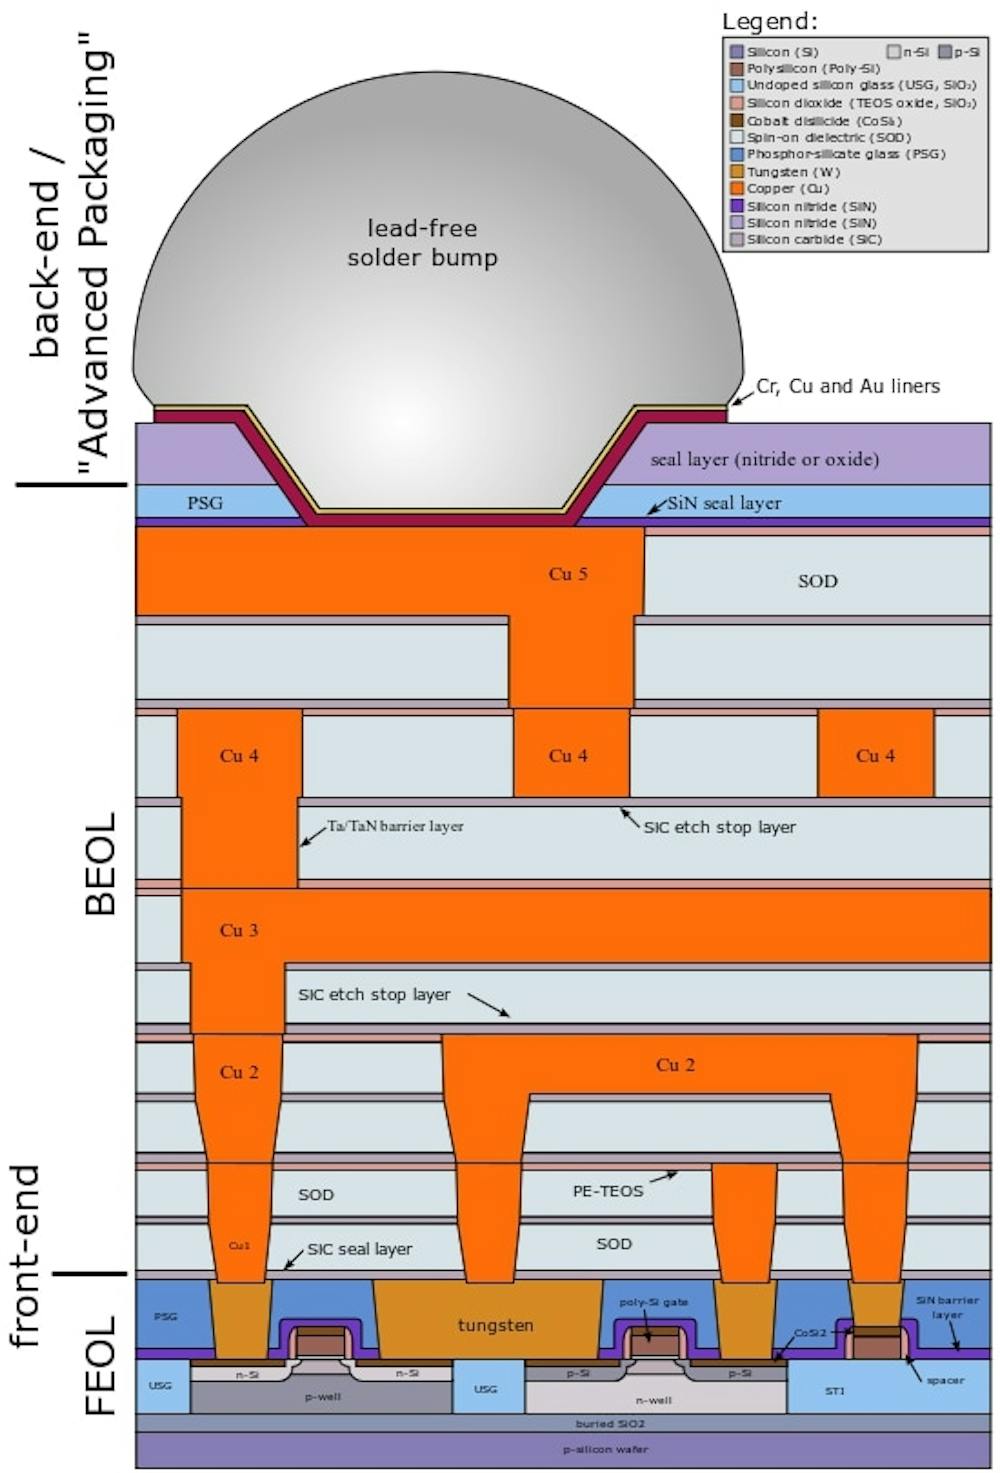
A diagram showing more than a dozen layers of material.
This schematic of a semiconductor chip shows many different materials in different colors and the complicated layering involved in producing a modern chip.
Cepheiden/Wikimedia Commons, CC BY

3. How do you build a semiconductor chip?

The starting point for the vast majority of semiconductors is a thin slice of silicon called a wafer. Today’s wafers are the size of dinner plates and are cut from single silicon crystals. Manufacturers add elements like phosphorus and boron in a thin layer at the surface of the silicon to increase the chip’s conductivity. It is in this surface layer where the transistor switches are made.

The transistors are built by adding thin layers of conductive metals, insulators and more silicon to the entire wafer, sketching out patterns on these layers using a complicated process called lithography and then selectively removing these layers using computer-controlled plasmas of highly reactive gases to leave specific patterns and structures. Because the transistors are so small, it is much easier to add materials in layers and then carefully remove unwanted material than it is to place microscopically thin lines of metal or insulators directly onto the chip. By depositing, patterning and etching layers of different materials dozens of times, semiconductor manufacturers can create chips with tens of billions of transistors per square inch.

4. How are chips today different from the early chips?

There are many differences, but the most important is probably the increase in the number of transistors per chip.

Among the earliest commercial applications for semiconductor chips were pocket calculators, which became widely available in the 1970s. These early chips contained a few thousand transistors. In 1989 Intel introduced the the first semiconductors to exceed a million transistors on a single chip. Today, the largest chips contain more than 50 billion transistors. This trend is described by what is known as Moore’s law, which says that the number of transistors on a chip will double approximately every 18 months.

Moore’s law has held up for five decades. But in recent years, the semiconductor industry has had to overcome major challenges – mainly, how to continue shrinking the size of transistors – to continue this pace of advancement.

One solution was to switch from flat, two-dimensional layers to three-dimensional layering with fin-shaped ridges of silicon projecting up above the surface. These 3D chips significantly increased the number of transistors on a chip and are now in widespread use, but they’re also much more difficult to manfacture.

5. Do more complicated chips require more sophisticated factories?

Simply put, yes, the more complicated the chip, the more complicated – and more costly – the factory.

There was a time when almost every U.S. semiconductor company built and maintained its own factories. But today, a new foundry can cost more than $10 billion to build. Only the largest companies can afford that kind of investment. Instead, the majority of semiconductor companies send their designs to independent foundries for manufacturing. Taiwan Semiconductor Manufacturing Co. and GlobalFoundries, headquartered in New York, are two examples of multinational foundries that build chips for other companies. They have the expertise and economies of scale to invest in the hugely expensive technology required to produce next-generation semiconductors.

Ironically, while the transistor and semiconductor chip were invented in the U.S., no state-of-the-art semiconductor foundries are currently on American soil. The U.S. has been here before in the 1980s when there were concerns that Japan would dominate the global memory business. But with the newly passed CHIPS act, Congress has provided the incentives and opportunities for next-generation semiconductors to be manufactured in the U.S.

Perhaps the chips in your next iPhone will be “designed by Apple in California, built in the USA.”The Conversation

About the Author:

Trevor Thornton, Professor of Electrical Engineering, Arizona State University

This article is republished from The Conversation under a Creative Commons license. Read the original article.


Is the worst over for US stocks?

By ForexTime

The S&P 500 index is widely used as the benchmark to gauge how overall US stocks are performing.

And much has already been made about the selloff that had persisted through the first half of this year, driven by fears that the Fed will send US interest rates soaring (which it has, by 225 basis points since March).

Since posting a record high early this year, this blue-chip index then fell by as much as 23.55% on June 16th, crossing over into ‘bear market’ territory.

However, since mid-June, the S&P 500 has climbed by 14.8%. Yesterday (Wednesday, August 10th), this index posted its highest closing price since May.


The question now that’s being hotly debated now is whether the worst of the US stock market’s selloff is already over.

And markets are watching closely whether we’ll see a key piece of technical evidence on the S&P 500 today that could help substantially address that very question.

But first … let’s try and understand what may be contributing to the S&P 500’s gains over the past couple of months.


What’s driving this rebound in the S&P 500?

Arguably, the primary reason is that markets believe that the Fed has done the largest chunks of its rate hikes already.

Since March, the Fed has already hiked by 225 basis points. At the time of writing, markets think there are only 125 basis points in hikes left in the Fed’s tank, to be triggered between next month and March 2023.

After that, markets think the US central bank then has to start unwinding its rate hikes (i.e. lower interest rates) sometime in the middle of next year, so as to either avoid sending the US into a full-blown recession, or at least support the demand that the Fed has already gone about destroying in the name of quelling red-hot inflation.


Recall that, generally speaking, riskier assets such as stocks dislike the thought of US interest rates moving higher.

However, if the worst of those fears (markets at one point thought that the Fed would trigger a gargantuan 100 bps hike) had already been priced in, any relief from such perceived worst-case scenarios should translate into a recovery for risk assets.

Hence, investors have been emboldened by the above narrative, and have been rewarded (so far) for “buying the dip”.

Which brings us back to the main question …


Is the worst of this year’s selloff over for the S&P 500?

And here’s the important technical indicator that could confirm whether that the mid-June low of 3637.3 would be the lowest point for the S&P 500 for this latest selloff.


The S&P 500 has to register a daily close above 50% Fibonacci retracement level!


Looking back at the chart above, the S&P 500 has already managed to breach the 4228.6 line, which marks the halfway point from its peak-to-trough plummet in the first half of this year.

According to data compiled by CFRA (research firm) and S&P Global (ratings, analytics, and market intelligence agency), in 18 of the 19 bear markets witnessed since World War 2 (with the exception being the bear market of 1973-1974), the S&P 500 goes on to make a recovery/mark a new bull run once it closes back above its 50% Fibonacci retracement line.

In other words, once the S&P 500 secures a daily close above 4228.6, market participants can then say with greater confidence that the market bottom is indeed in the past.


But wait, there’s more …

Also, the S&P 500 has already posted a higher-high above the late-May cycle peak of 4205.7.

Such a technical event may carry less weight compared to a daily close above the 50% Fib retracement level, but can be used as a point in deciphering whether the S&P 500’s downtrend has been broken.


But let’s be careful.

To be clear, markets never move in a single, straight line.

And also from a technical perspective, the S&P 500 may be due for a pullback, given that its 14-day relative strength index is now flirting with the 70 mark that denotes ‘overbought’ conditions.

So it’s still entirely possible that the S&P 500 falters back below 4228.6, even after a daily close above that mark.

Instead, the idea is that the S&P 500 will not fall lower than the mid-June bottom of 3637.3 if the index posts a daily close above that 50% retracement level of 4228.6 (or so suggest the proponents of such a signal).


S&P 500 still at the mercy of the Fed/US economy

Risk assets have in the past two months clearly basked in the thought that the incoming Fed rate hikes would be fewer and smaller from here on out.

Such a notion was emboldened by yesterday’s (Wednesday, August 10th) lower-than-expected headline US inflation print.

The consumer price index (CPI) “only” rose by 8.5%. That is lower than almost all economists’ had forecasted (at least those surveyed by Bloomberg), and also lower than June’s year-on-year CPI advance of 9.1%.

Those participating in recent gains appear to harbour the belief that US inflation has peaked, which in turn may allow the Fed to step away from being so aggressive in its battle against multi-decade high inflation.

And so, it remains to be seen whether US inflation has truly peaked. Also, whether a full-blown, risk-off recession could undermine the S&P 500’s attempts at a full recovery.


More confirmation could be had at these upcoming economic events:

  • August 25-27: Fed’s Jackson Hole Symposium
    (where central bankers gather to talk about issues pertaining to the economy and monetary policy. More clues about the Fed’s view on inflation/rate hikes?)
  • September 2: US August nonfarm payrolls report
    (can the US jobs market stay resilient enough to handle US interest rates going much higher?)
  • September 13: US August CPI release
    (a print below July’s 8.5% may confirm that inflation in the world’s largest economy has indeed peaked)
  • September 21: FOMC meeting
    (Fed to hike by 75bps? Or “just” 50bps?)


So stay alert and watch this space.


Forex-Time-LogoArticle by ForexTime

ForexTime Ltd (FXTM) is an award winning international online forex broker regulated by CySEC 185/12 www.forextime.com

Severe Bear Market: Will You Be Among the Prepared 1.5%?

“Oftentimes, rallies will end with an inter-index non-confirmation”

By Elliott Wave International

A long-long time ago in a galaxy far away… errr, on the heels of the year 2000 dot-com crash, to be exact — which is ancient history for many investors today — the February 2003 Elliott Wave Theorist, a monthly publication which has covered financial markets and major cultural trends since 1979, published an interview with Elliott Wave International President Robert Prechter.

Prechter was asked if he was surprised by investors’ lack of capitulation since the bear market started in 2000.

Prechter replied:

I read a statistic that said no more than 1 to 1½% of investors actually got out. This is utterly typical. The average investor stays in. [emphasis added]

This is mentioned because the patterns of investor psychology tend to repeat, which is the entire basis of Elliott wave analysis, which helps you track those patterns on the scale from intraday to multi-century.

So, with that in mind, consider what the July 2022 Elliott Wave Financial Forecast, a monthly publication which focuses on major U.S. financial markets, says:

Even as stocks fell hard into the middle of June, the bullish resolve of investors remained on display. On June 14, for instance, Bloomberg reported that “Undeterred Retail Traders Piled into Stocks.”

The chances are high that many of these investors will hold onto their stocks into the worst part of the bear market, if indeed the January top in stocks marked the end of the long bull market.

By one measure, investors know that the S&P 500 had already suffered at least a minimum bear market because in June, the index had declined 25% from its January all-time high. Of course, a 20% decline is widely considered to be the “official” entry into a bear market.

Since June 17, however, the index has rallied.

The question is: Is the bear market over, or is the price climb since June 17 a countertrend rally in a bigger bear market?

Well, if indeed the rally is countertrend, the August 1 U.S. Short Term Update, a thrice weekly Elliott Wave International publication which offers near-term analysis of key U.S. financial markets, provided a clue on how to possibly ascertain the end of the rally:

Oftentimes, rallies will end with an inter-index non-confirmation, where one or more stock index will fail to confirm the final rally high in the other indexes.

Elliott Wave International’s analysts show you where the various related indexes are right now in relation to each other in EWI’s publications. EWI’s analysts also show what the Elliott wave model is revealing about the price pattern of the main indexes.

The whole idea is to make sure you’re among the 1.5% of investors who are on the sidelines if a bigger bear market has yet to unfold.

If you’re new to Elliott wave analysis, you are encouraged to read Frost & Prechter’s Wall Street classic, Elliott Wave Principle: Key to Market Behavior. Here’s a quote from the book:

After you have acquired an Elliott “touch,” it will be forever with you, just as a child who learns to ride a bicycle never forgets. Thereafter, catching a turn becomes a fairly common experience and not really too difficult. Furthermore, by giving you a feeling of confidence as to where you are in the progress of the market, a knowledge of Elliott can prepare you psychologically for the fluctuating nature of price movement and free you from sharing the widely practiced analytical error of forever projecting today’s trends linearly into the future. Most important, the Wave Principle often indicates in advance the relative magnitude of the next period of market progress or regress. Living in harmony with those trends can make the difference between success and failure in financial affairs.

Good news: You can access the entire online version of the book for free once you become a member of Club EWI, the world’s largest Elliott wave educational community (about 500,000 worldwide members and growing).

You can join Club EWI for free, and members get complimentary access to an array of Elliott wave resources on financial markets and investing, which includes videos and exclusive interviews with Elliott Wave International’s analysts.

If you’re already familiar with Elliott wave analysis and you love “free,” the chances are high that you’ll love Club EWI.

Jump on the Club EWI bandwagon by following this link: Elliott Wave Principle: Key to Market Behavior — get instant access.

This article was syndicated by Elliott Wave International and was originally published under the headline Severe Bear Market: Will You Be Among the Prepared 1.5%?. EWI is the world’s largest market forecasting firm. Its staff of full-time analysts led by Chartered Market Technician Robert Prechter provides 24-hour-a-day market analysis to institutional and private investors around the world.

Elliott Waves: Your “Rhyme & Reason” to Mainstream Market Opinions

R.N. Elliott’s stock market observations fell together “into a general set of principles”

By Elliott Wave International

It’s understandable why investors with little experience consult the market opinions of professionals.

But many of these new investors are left scratching their heads. Two headlines from July 29 indicate why:

  • [Fundstrat Managing Partner] says the 2022 bear market is over, stocks could hit new highs before year-end (CNBC)
  • Stock market’s post-Fed bounce is a ‘trap,’ says Morgan Stanley’s [Chief Investment Officer] (Marketwatch]

Yes, two directly opposing opinions that were published on the same day.

The date before those headlines published (July 28), happened to be Ralph Nelson Elliott’s 151st birthday.

You may be interested in his discovery about stock market behavior because it offers an alternative to consulting mainstream financial stories.

Here’s a brief overview: In the 1930s, Ralph Nelson Elliott (1871-1948) discovered that the stock market moves in recurring patterns that he called waves.

Elliott had led an active life as an accountant and management consultant, working at various times for railroad companies in Mexico, Central America and South America, a business magazine, and for the State Department before becoming seriously ill with pernicious anemia.

In the book, R.N. Elliott’s Masterworks, Elliott Wave International President Robert Prechter describes what happened next:

Despite being physically debilitated by his malady, Elliott needed something to occupy his acute mind while recuperating between its worst attacks. … It was around 1932 that Elliott began turning his full attention to … finding out whether there was any rhyme or reason to the stock market. …

Around May 1934 … his numerous observations of general stock market behavior began falling together into a general set of principles that applied to all degrees of wave movement in the stock price averages.

Elliott’s insights continue to be employed by investors today.

The basic Elliott wave pattern consists of five subwaves (denoted by numbers) which move in the same direction as the trend of the next larger size and three corrective subwaves (denoted by letters) which move against the trend of the next larger size:

When this initial eight-wave cycle such as shown by the illustration ends, a similar cycle begins.

In other words, the basic Elliott wave pattern links to form five- and three-wave structures of increasingly larger size.

An important point is that the Wave Principle helps investors to identify turning points in the trends of financial markets.

Indeed, here’s a quote from Frost & Prechter’s Wall Street classic, Elliott Wave Principle: Key to Market Behavior:

When after a while the apparent jumble gels into a clear picture, the probability that a turning point is at hand can suddenly and excitingly rise to nearly 100%. It is a thrilling experience to pinpoint a turn, and the Wave Principle is the only approach that can occasionally provide the opportunity to do so.

Here’s the good news: You can access the entire online version of the book for free once you become a member of Club EWI, the world’s largest Elliott wave educational community.

Club EWI is free to join without any obligations and members enjoy free access to Elliott wave resources on financial markets and investing, including exclusive articles and interviews with Elliott Wave International’s analysts.

Click on the link to get started right away: Elliott Wave Principle: Key to Market Behavior — get free and instant access.

This article was syndicated by Elliott Wave International and was originally published under the headline Elliott Waves: Your “Rhyme & Reason” to Mainstream Market Opinions. EWI is the world’s largest market forecasting firm. Its staff of full-time analysts led by Chartered Market Technician Robert Prechter provides 24-hour-a-day market analysis to institutional and private investors around the world.

COT Week 31 Charts: Stock Market Speculator bets led lower by Russell 2000 & MSCI EAFE Minis

By InvestMacro | COT | Data Tables | COT Leaders | Downloads | COT Newsletter

Here are the latest charts and statistics for the Commitment of Traders (COT) data published by the Commodities Futures Trading Commission (CFTC).

The latest COT data is updated through Tuesday August 2nd and shows a quick view of how large traders (for-profit speculators and commercial entities) were positioned in the futures markets.

Weekly Speculator Changes

COT stock market speculator bets were overall lower this week as just two out of the seven stock markets we cover had higher positioning this week while the other five markets had lower contracts on the week.

Leading the gains for stock markets was the S&P500 Mini (5,750 contracts) and the Dow Jones Industrial Average Mini with a gain of 2,764 contracts.

The stock markets leading the declines in speculator bets this week were the Russell 2000 Mini (-14,743 contracts) and the MSCI EAFE Mini (-14,707 contracts) while the Nasdaq Mini (-7,097 contracts), the VIX (-6,273 contracts) and the Nikkei 225 USD (-245 contracts) also had lower bets on the week.


Data Snapshot of Stock Market Traders | Columns Legend
Aug-02-2022OIOI-IndexSpec-NetSpec-IndexCom-NetCOM-IndexSmalls-NetSmalls-Index
S&P500-Mini2,310,6658-231,88513293,137100-61,25214
Nikkei 22513,4108-4,635553,353461,28244
Nasdaq-Mini262,3255024,71289-9,09421-15,61816
DowJones-Mini72,61931-18,4211422,96090-4,53914
VIX322,60433-98,83860105,97141-7,13357
Nikkei 225 Yen59,868438,3486024,11686-32,4648


Strength Scores

Strength Scores (a normalized measure of Speculator positions over a 3-Year range, from 0 to 100 where above 80 is extreme bullish and below 20 is extreme bearish) showed that the Nasdaq-Mini (88.8 percent) has the highest strength score currently and remains in a bullish extreme position (above 80 percent) although slightly lower from last week (92.8 percent). The VIX (59.8 percent) and the Nikkei USD (55.4 percent) come in as the next highest stocks market in strength scores. On the downside, the Russell 2000-Mini (0.0 percent), the EAFE-Mini (1.9 percent), the S&P500-Mini (13.2 percent) and the DowJones-Mini (13.8 percent) all currently have very weak speculator sentiment and are in bearish extreme positions (below 20 percent).


Strength Statistics:
VIX (59.8 percent) vs VIX previous week (62.9 percent)
S&P500-Mini (13.2 percent) vs S&P500-Mini previous week (12.2 percent)
DowJones-Mini (13.8 percent) vs DowJones-Mini previous week (10.1 percent)
Nasdaq-Mini (88.8 percent) vs Nasdaq-Mini previous week (92.8 percent)
Russell2000-Mini (0.0 percent) vs Russell2000-Mini previous week (8.3 percent)
Nikkei USD (55.4 percent) vs Nikkei USD previous week (56.6 percent)
EAFE-Mini (1.9 percent) vs EAFE-Mini previous week (18.6 percent)

Strength Trends

Strength Score Trends (or move index, calculates the 6-week changes in strength scores) showed that the DowJones-Mini (9.4 percent) is the only stock market that has a positive six week trend for stocks at the moment.  The EAFE-Mini (-35.9 percent) leads the downside trend scores currently while the next lower trend scores were from the VIX (-24.5 percent) followed by the S&P500-Mini (-21.8 percent) and the Nikkei USD (-14.5 percent).


Strength Trend Statistics:
VIX (-24.5 percent) vs VIX previous week (-9.2 percent)
S&P500-Mini (-21.8 percent) vs S&P500-Mini previous week (-50.4 percent)
DowJones-Mini (9.4 percent) vs DowJones-Mini previous week (1.5 percent)
Nasdaq-Mini (-3.4 percent) vs Nasdaq-Mini previous week (1.9 percent)
Russell2000-Mini (-8.1 percent) vs Russell2000-Mini previous week (-5.6 percent)
Nikkei USD (-14.5 percent) vs Nikkei USD previous week (-9.4 percent)
EAFE-Mini (-35.9 percent) vs EAFE-Mini previous week (-24.8 percent)


Individual Markets:

VIX Volatility Futures:

VIX Volatility Futures COT ChartThe VIX Volatility large speculator standing this week resulted in a net position of -98,838 contracts in the data reported through Tuesday. This was a weekly decline of -6,273 contracts from the previous week which had a total of -92,565 net contracts.

This week’s current strength score (the trader positioning range over the past three years, measured from 0 to 100) shows the speculators are currently Bullish with a score of 59.8 percent. The commercials are Bearish with a score of 40.7 percent and the small traders (not shown in chart) are Bullish with a score of 56.8 percent.

VIX Volatility Futures StatisticsSPECULATORSCOMMERCIALSSMALL TRADERS
– Percent of Open Interest Longs:12.262.87.7
– Percent of Open Interest Shorts:42.929.99.9
– Net Position:-98,838105,971-7,133
– Gross Longs:39,442202,54224,811
– Gross Shorts:138,28096,57131,944
– Long to Short Ratio:0.3 to 12.1 to 10.8 to 1
NET POSITION TREND:
– Strength Index Score (3 Year Range Pct):59.840.756.8
– Strength Index Reading (3 Year Range):BullishBearishBullish
NET POSITION MOVEMENT INDEX:
– 6-Week Change in Strength Index:-24.524.5-6.4


S&P500 Mini Futures:

SP500 Mini Futures COT ChartThe S&P500 Mini large speculator standing this week resulted in a net position of -231,885 contracts in the data reported through Tuesday. This was a weekly advance of 5,750 contracts from the previous week which had a total of -237,635 net contracts.

This week’s current strength score (the trader positioning range over the past three years, measured from 0 to 100) shows the speculators are currently Bearish-Extreme with a score of 13.2 percent. The commercials are Bullish-Extreme with a score of 100.0 percent and the small traders (not shown in chart) are Bearish-Extreme with a score of 13.5 percent.

S&P500 Mini Futures StatisticsSPECULATORSCOMMERCIALSSMALL TRADERS
– Percent of Open Interest Longs:10.377.39.6
– Percent of Open Interest Shorts:20.364.612.2
– Net Position:-231,885293,137-61,252
– Gross Longs:237,5941,786,757220,741
– Gross Shorts:469,4791,493,620281,993
– Long to Short Ratio:0.5 to 11.2 to 10.8 to 1
NET POSITION TREND:
– Strength Index Score (3 Year Range Pct):13.2100.013.5
– Strength Index Reading (3 Year Range):Bearish-ExtremeBullish-ExtremeBearish-Extreme
NET POSITION MOVEMENT INDEX:
– 6-Week Change in Strength Index:-21.822.5-6.6


Dow Jones Mini Futures:

Dow Jones Mini Futures COT ChartThe Dow Jones Mini large speculator standing this week resulted in a net position of -18,421 contracts in the data reported through Tuesday. This was a weekly boost of 2,764 contracts from the previous week which had a total of -21,185 net contracts.

This week’s current strength score (the trader positioning range over the past three years, measured from 0 to 100) shows the speculators are currently Bearish-Extreme with a score of 13.8 percent. The commercials are Bullish-Extreme with a score of 89.8 percent and the small traders (not shown in chart) are Bearish-Extreme with a score of 14.2 percent.

Dow Jones Mini Futures StatisticsSPECULATORSCOMMERCIALSSMALL TRADERS
– Percent of Open Interest Longs:22.362.514.1
– Percent of Open Interest Shorts:47.630.920.4
– Net Position:-18,42122,960-4,539
– Gross Longs:16,16145,38510,253
– Gross Shorts:34,58222,42514,792
– Long to Short Ratio:0.5 to 12.0 to 10.7 to 1
NET POSITION TREND:
– Strength Index Score (3 Year Range Pct):13.889.814.2
– Strength Index Reading (3 Year Range):Bearish-ExtremeBullish-ExtremeBearish-Extreme
NET POSITION MOVEMENT INDEX:
– 6-Week Change in Strength Index:9.4-8.0-5.7


Nasdaq Mini Futures:

Nasdaq Mini Futures COT ChartThe Nasdaq Mini large speculator standing this week resulted in a net position of 24,712 contracts in the data reported through Tuesday. This was a weekly decrease of -7,097 contracts from the previous week which had a total of 31,809 net contracts.

This week’s current strength score (the trader positioning range over the past three years, measured from 0 to 100) shows the speculators are currently Bullish-Extreme with a score of 88.8 percent. The commercials are Bearish with a score of 20.9 percent and the small traders (not shown in chart) are Bearish-Extreme with a score of 16.3 percent.

Nasdaq Mini Futures StatisticsSPECULATORSCOMMERCIALSSMALL TRADERS
– Percent of Open Interest Longs:28.657.111.6
– Percent of Open Interest Shorts:19.160.617.6
– Net Position:24,712-9,094-15,618
– Gross Longs:74,918149,77330,452
– Gross Shorts:50,206158,86746,070
– Long to Short Ratio:1.5 to 10.9 to 10.7 to 1
NET POSITION TREND:
– Strength Index Score (3 Year Range Pct):88.820.916.3
– Strength Index Reading (3 Year Range):Bullish-ExtremeBearishBearish-Extreme
NET POSITION MOVEMENT INDEX:
– 6-Week Change in Strength Index:-3.411.4-25.5


Russell 2000 Mini Futures:

Russell 2000 Mini Futures COT ChartThe Russell 2000 Mini large speculator standing this week resulted in a net position of -119,954 contracts in the data reported through Tuesday. This was a weekly decline of -14,743 contracts from the previous week which had a total of -105,211 net contracts.

This week’s current strength score (the trader positioning range over the past three years, measured from 0 to 100) shows the speculators are currently Bearish-Extreme with a score of 0.0 percent. The commercials are Bullish-Extreme with a score of 99.7 percent and the small traders (not shown in chart) are Bearish-Extreme with a score of 16.6 percent.

Russell 2000 Mini Futures StatisticsSPECULATORSCOMMERCIALSSMALL TRADERS
– Percent of Open Interest Longs:5.589.53.5
– Percent of Open Interest Shorts:27.167.34.1
– Net Position:-119,954123,483-3,529
– Gross Longs:30,724497,84419,324
– Gross Shorts:150,678374,36122,853
– Long to Short Ratio:0.2 to 11.3 to 10.8 to 1
NET POSITION TREND:
– Strength Index Score (3 Year Range Pct):0.099.716.6
– Strength Index Reading (3 Year Range):Bearish-ExtremeBullish-ExtremeBearish-Extreme
NET POSITION MOVEMENT INDEX:
– 6-Week Change in Strength Index:-8.18.1-3.8


Nikkei Stock Average (USD) Futures:

Nikkei Stock Average (USD) Futures COT ChartThe Nikkei Stock Average (USD) large speculator standing this week resulted in a net position of -4,635 contracts in the data reported through Tuesday. This was a weekly fall of -245 contracts from the previous week which had a total of -4,390 net contracts.

This week’s current strength score (the trader positioning range over the past three years, measured from 0 to 100) shows the speculators are currently Bullish with a score of 55.4 percent. The commercials are Bearish with a score of 46.4 percent and the small traders (not shown in chart) are Bearish with a score of 44.4 percent.

Nikkei Stock Average Futures StatisticsSPECULATORSCOMMERCIALSSMALL TRADERS
– Percent of Open Interest Longs:8.860.829.8
– Percent of Open Interest Shorts:43.335.820.3
– Net Position:-4,6353,3531,282
– Gross Longs:1,1788,1514,002
– Gross Shorts:5,8134,7982,720
– Long to Short Ratio:0.2 to 11.7 to 11.5 to 1
NET POSITION TREND:
– Strength Index Score (3 Year Range Pct):55.446.444.4
– Strength Index Reading (3 Year Range):BullishBearishBearish
NET POSITION MOVEMENT INDEX:
– 6-Week Change in Strength Index:-14.56.123.0


MSCI EAFE Mini Futures:

MSCI EAFE Mini Futures COT ChartThe MSCI EAFE Mini large speculator standing this week resulted in a net position of -31,514 contracts in the data reported through Tuesday. This was a weekly fall of -14,707 contracts from the previous week which had a total of -16,807 net contracts.

This week’s current strength score (the trader positioning range over the past three years, measured from 0 to 100) shows the speculators are currently Bearish-Extreme with a score of 1.9 percent. The commercials are Bullish-Extreme with a score of 100.0 percent and the small traders (not shown in chart) are Bullish with a score of 64.8 percent.

MSCI EAFE Mini Futures StatisticsSPECULATORSCOMMERCIALSSMALL TRADERS
– Percent of Open Interest Longs:4.991.42.9
– Percent of Open Interest Shorts:12.784.91.6
– Net Position:-31,51426,2695,245
– Gross Longs:20,008370,69811,622
– Gross Shorts:51,522344,4296,377
– Long to Short Ratio:0.4 to 11.1 to 11.8 to 1
NET POSITION TREND:
– Strength Index Score (3 Year Range Pct):1.9100.064.8
– Strength Index Reading (3 Year Range):Bearish-ExtremeBullish-ExtremeBullish
NET POSITION MOVEMENT INDEX:
– 6-Week Change in Strength Index:-35.933.229.5


Article By InvestMacroReceive our weekly COT Reports by Email

*COT Report: The COT data, released weekly to the public each Friday, is updated through the most recent Tuesday (data is 3 days old) and shows a quick view of how large speculators or non-commercials (for-profit traders) were positioned in the futures markets.

The CFTC categorizes trader positions according to commercial hedgers (traders who use futures contracts for hedging as part of the business), non-commercials (large traders who speculate to realize trading profits) and nonreportable traders (usually small traders/speculators) as well as their open interest (contracts open in the market at time of reporting).See CFTC criteria here.