Archive for Stock Market News – Page 39

Biotech at Good Entry Point for Investors, Analyst Says

Source: Andrew Partheniou  (12/20/22)

The company, focused on psychedelic-assisted psychotherapies to better treat addiction, is worth more than the CA$10 million the market is valuing it at, noted a Stifel report.

Awakn Life Sciences Corp. (AWKN:NEO; AWKNF:OTCQB) is currently undervalued and, thus, providing investors an attractive time to get into the stock, reported Stifel analyst Andrew Partheniou in a Dec. 16 research note.

With the Canadian biotech firm, the “market sees about a CA$10 million ($10M) valuation,” he wrote. “We see a Phase 3 company with a derisked molecule.”

Further, Awakn offers significant potential return for investors given the difference between its current share price (CA$0.40) and Stifel’s target price on it (CA$1.75). As such, Stifel rates the biotech Speculative Buy.

The reasons Stifel considers Awakn undervalued are its three recent key accomplishments, Partheniou wrote, “despite a materially challenging market backdrop.”

Recent Progress Made

1) Awakn completed the second tranche of its capital raise, generating US$1.9M. The two tranches together and debt settlement yielded US$3M, enough to get it through the next three quarters, Partheniou wrote.

“This could provide the company with time to realize some potential catalyst to create shareholder value through derisking its outlook and pursue another equity financing,” he added.

2) Awakn partnered with the British government on the life sciences firm’s Phase 3 pivotal trial of ketamine for alcohol use disorder, and it will be conducted at seven National Health Service sites. Also, the company secured governmental funding in the form of a grant that will cover 66% of the trial cost, or CA$3.75M, dropping Awakn’s contribution at CA$1.25M, “a significantly advantageous position,” noted Partheniou.

3) Awakn further grew its ketamine clinic business, adding locations in Norway and the U.S. reported Partheniou. In Norway, the biotech signed a lease for a second location, expected to be up and running by late Q1/23. The company also entered a licensing agreement with Nushama in New York, making it the third such arrangement in North America. Nushama will pay Awakn an annual fee and a royalty of an unknown amount.

“Hence, we see good momentum overall,” wrote Partheniou.

Disclosures:
1) Doresa Banning wrote this article for Streetwise Reports LLC and provides services to Streetwise Reports as an independent contractor. She or members of her household own securities of the following companies mentioned in the article: None. She or members of her household are paid by the following companies mentioned in this article: None.

2) The following companies mentioned in this article are billboard sponsors of Streetwise Reports: None. Click here for important disclosures about sponsor fees. The information provided above is for informational purposes only and is not a recommendation to buy or sell any security. As of the date of this article, an affiliate of Streetwise Reports has a consulting relationship with: Awakn Life Sciences Corp. Please click here for more information.

3) Comments and opinions expressed are those of the specific experts and not of Streetwise Reports or its officers. The information provided above is for informational purposes only and is not a recommendation to buy or sell any security.

4) The article does not constitute investment advice. Each reader is encouraged to consult with his or her individual financial professional and any action a reader takes as a result of information presented here is his or her own responsibility. By opening this page, each reader accepts and agrees to Streetwise Reports’ terms of use and full legal  disclaimer. This article is not a solicitation for investment. Streetwise Reports does not render general or specific investment advice and the information on Streetwise Reports should not be considered a recommendation to buy or sell any security. Streetwise Reports does not endorse or recommend the business, products, services or securities of any company mentioned on Streetwise Reports.

5) From time to time, Streetwise Reports LLC and its directors, officers, employees or members of their families, as well as persons interviewed for articles and interviews on the site, may have a long or short position in securities mentioned. Directors, officers, employees or members of their immediate families are prohibited from making purchases and/or sales of those securities in the open market or otherwise from the time of the decision to publish an article until three business days after the publication of the article. The foregoing prohibition does not apply to articles that in substance only restate previously published company releases. As of the date of this article, officers and/or employees of Streetwise Reports LLC (including members of their household) own securities of Awakn Life Sciences Corp., a company mentioned in this article.

6) This article does not constitute medical advice. Officers, employees and contributors to Streetwise Reports are not licensed medical professionals. Readers should always contact their healthcare professionals for medical advice.

Disclosures For Stifel GMP, Awakn Life Sciences Corp a.nd Cybin Inc.,  December 16, 2022

I, Andrew Partheniou, certify that the views expressed in this research report accurately reflect my personal views about the subject securities or issuers; and I, Andrew Partheniou, certify that no part of my compensation was, is, or will be directly or indirectly related to the specific recommendations or views contained in this research report.

Stifel or an affiliate expects to receive or intends to seek compensation for investment banking services from Awakn Life Sciences Corp. in the next 3 months. The equity research analyst(s) responsible for the preparation of this report receive(s) compensation based on various factors, including Stifel’s overall revenue, which includes investment banking revenue.

The information contained herein has been prepared from sources believed to be reliable but is not guaranteed by us and is not a complete summary or statement of all available data, nor is it considered an offer to buy or sell any securities referred to herein. Opinions expressed are as of the date of this publication and are subject to change without notice. These opinions do not constitute a personal recommendation and do not take into account the particular investment objectives, financial situation or needs of individual investors. Employees of Stifel, or its affiliates may, at times, release written or oral commentary, technical analysis or trading strategies that differ from the opinions expressed within. Stifel or any of its affiliates may have positions in the securities mentioned and may make purchases or sales of such securities from time to time in the open market or otherwise and may sell to or buy from customers such securities on a principal basis; such transactions may be contrary to recommendations in this report. Past performance should not and cannot be viewed as an indicator of future performance.

Unless otherwise noted, the financial instruments mentioned in this report are priced as of market close on the previous trading day and presumed performance is calculated always over the next 12 months. As a multi-disciplined financial services firm, Stifel regularly seeks investment banking assignments and compensation from issuers for services including, but not limited to, acting as an underwriter in an offering or financial advisor in a merger or acquisition, or serving as a placement agent in private transactions.

Affiliate Disclosures: References to “Stifel” (collectively ”Stifel”) refer to SFC and other associated affiliated subsidiaries including (i) Stifel, Nicolaus & Company, Incorporated (“SNC”); (ii) Keefe, Bruyette & Woods, Incorporated (“KBWI’’), which are both U.S. broker-dealers registered with the United States Securities and Exchange Commission (“SEC”) and members of the Financial Industry National Regulatory Authority (“FINRA”), respectively; (iii) Stifel Nicolaus Canada, Incorporated. (“Stifel Canada”), which is authorised and regulated by Investment Industry Regulatory Organization of Canada (“IIROC”), and also trades under the names “Stifel GMP” and/or “Stifel FirstEnergy”; (iv) Stifel Nicolaus Europe Limited (“SNEL”), which is authorised and regulated by the Financial Conduct Authority (“FCA”) (FRN 190412) and is a member of the London Stock Exchange and also trades under the name Keefe, Bruyette & Woods Europe (“KBW Europe”); (v) Stifel Europe Bank AG (“SEBA”), which is regulated by the German Federal Financial Supervisory Authority (Bundesanstalt für Finanzdienstleistungsaufsicht; “BaFin”) and is a member of Deutsche Boerse and SIX Swiss Exchange and (vi) Stifel Schweiz AG (“STSA”), which is representative of SEBA in Switzerland and regulated by the Eidgenössische Finanzmarktaufsicht (“FINMA”). SNEL, SEBA and STSA are collectively referred to as Stifel Europe.

What Will Happen to PM Stocks During a Market Crash?

Source: Clive Maund  (12/20/22) 

Expert Clive Maund reviews three charts to explain to you what he believes will happen to precious metals if the stock market crashes.

The U.S. stock market is in a position to crash and has been for some time, but so far, it has held up, and a reason for this is that risk has moderated somewhat. An important signal that a crash may be imminent will be if we suddenly see the 10-year yield starting to trend higher again, which could be due to a “black swan” event.

The current story is that the Fed’s trend of rising rates is slowing, but that could change abruptly if inflation gathers pace again. There are plenty of black swans not least of which is the growing risk of Russia launching a nuke or nukes. Russia is under attack from cruise missiles launched from Ukraine deep into its territory, which is obviously the handiwork of the U.S. and faces an existential crisis that may result in it playing its big card.

While we can expect the PM sector to drop hard if the market crashes, it can also be expected to come back strongly way ahead of the broad market hitting bottom.

If this happens, markets could crater.

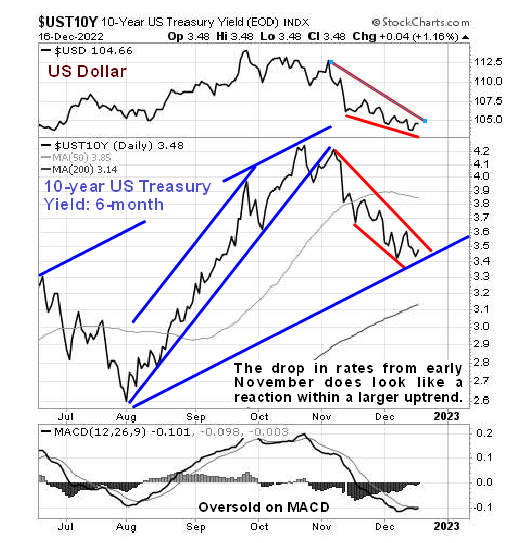
On the 6-month chart for the 10-year Treasury Yield, we can see that the debt market is still relatively tranquil, with the yield down at 3.48%, having peaked above 4.2% in mid-late October.

However, this chart also suggests that yields could start higher again rather than they did early in August, as the drop from October looks like a reaction back towards a rising 200-day moving average within a larger uptrend, with it now being considerably oversold on its MACD indicator.

If they do start rising again, and especially if they should rise sharply, it would probably rip the rug out from under the stock market which remains very vulnerable to such a development.

The chief purpose of this update is to consider what will happen to the PM sector in the event that the stock market does crash soon. Market crashes generally involve “pan selloffs” because the financial stresses created cause investors to “dump everything over the side” in many instances because they are forced to due to margin calls.

This is why during the initial crash phase we can expect the PM sector to drop too. To illustrate this point and see what is likely to happen to the PM sector, we are now going to go back and see what happened during the 2008 crash.

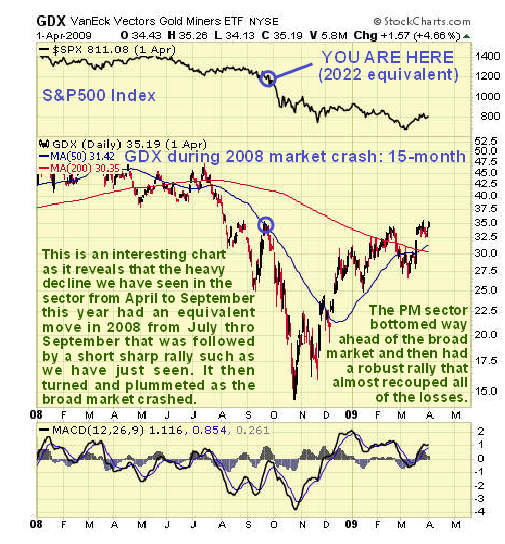
The chart below, which is for a 15-month timeframe, shows what happened to GDX during the 2008 market crash. One of the most important points to note is that the PM sector suffered a severe decline from July through September 2008 before the stock market had even begun to crash. and this decline may correspond to the heavy drop we saw in the sector from April through September this year.

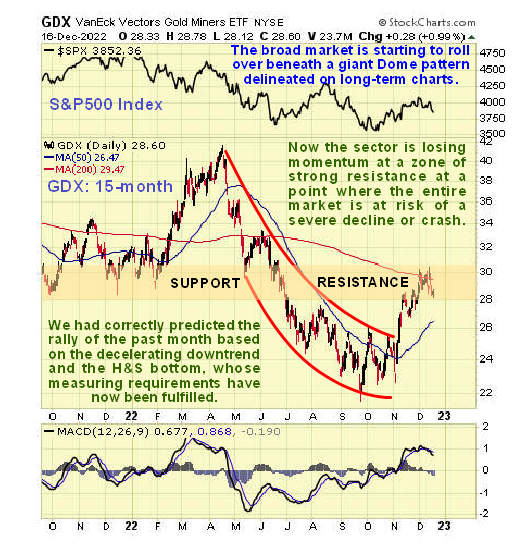
That drop in 2008 was followed by a sharp relief rally in September before the stock market crashed and took the PM sector down with it, so it is interesting to observe that we have just seen a sharp relief rally in November back into an area of heavy resistance where the sector appears to be rolling over again.

Clearly, if we see a repeat of what happened in 2008 — and so far, the broad market has had an uncanny resemblance to what happened then — then the stock market will crash soon and take the PM sector with it down to a final low.

Now compare the chart above to the 15-month chart, for now, keeping in mind that there is no crash on this chart because it hasn’t started yet, but might be about to.

A very important point to note that is a big reason why we are looking at the chart for 2008 is that during the 2008 crash, the PM sector bottomed way ahead of the broad market and a powerful rally ensued that recouped almost all of the losses occasioned by the crash.

What this means is that while we can expect the PM sector to drop hard if the market crashes, it can also be expected to come back strongly way ahead of the broad market hitting bottom.

We will shortly consider the most effective ways to position for a severe sector selloff provoked by a market crash.

CliveMaund.com Disclosures

The above represents the opinion and analysis of Mr. Maund, based on data available to him, at the time of writing. Mr. Maund’s opinions are his own, and are not a recommendation or an offer to buy or sell securities. Mr. Maund is an independent analyst who receives no compensation of any kind from any groups, individuals or corporations mentioned in his reports. As trading and investing in any financial markets may involve serious risk of loss, Mr. Maund recommends that you consult with a qualified investment advisor, one licensed by appropriate regulatory agencies in your legal jurisdiction and do your own due diligence and research when making any kind of a transaction with financial ramifications. Although a qualified and experienced stock market analyst, Clive Maund is not a Registered Securities Advisor. Therefore Mr. Maund’s opinions on the market and stocks can only be construed as a solicitation to buy and sell securities when they are subject to the prior approval and endorsement of a Registered Securities Advisor operating in accordance with the appropriate regulations in your area of jurisdiction.

Disclosures:
1) Statements and opinions expressed are the opinions of Clive Maund and not of Streetwise Reports or its officers. The author is wholly responsible for the validity of the statements. Streetwise Reports was not involved in any aspect of the article preparation. The author was not paid by Streetwise Reports LLC for this article. Streetwise Reports was not paid by the author to publish or syndicate this article.

2) This article does not constitute investment advice. Each reader is encouraged to consult with his or her individual financial professional and any action a reader takes as a result of information presented here is his or her own responsibility. By opening this page, each reader accepts and agrees to Streetwise Reports’ terms of use and full legal disclaimer. This article is not a solicitation for investment. Streetwise Reports does not render general or specific investment advice and the information on Streetwise Reports should not be considered a recommendation to buy or sell any security. Streetwise Reports does not endorse or recommend the business, products, services or securities of any company mentioned on Streetwise Reports.

3) From time to time, Streetwise Reports LLC and its directors, officers, employees or members of their families, as well as persons interviewed for articles and interviews on the site, may have a long or short position in securities mentioned. Directors, officers, employees or members of their immediate families are prohibited from making purchases and/or sales of those securities in the open market or otherwise from the time of the decision to publish an article until three business days after the publication of the article. The foregoing prohibition does not apply to articles that in substance only restate previously published company releases.

Data on New Cell Therapy for LBCL Encouraging, Analyst Says

The biopharma behind the investigational treatment plans to advance it into a potentially pivotal clinical program next year, noted a BTIG report.

Adicet Bio Inc. (ACET:NASDAQ) presented “encouraging” data from its ongoing Phase 1 trial evaluating the company’s lead therapeutic ADI-001, its chimeric antigen receptor (CAR) T-cell therapy, in large B-cell lymphoma, reported BTIG analyst Justin Zelin in a Dec. 12 research note. The data update took place at the American Society of Hematology’s annual meeting on Dec. 10 to 13.

The study showed Adicet’s anti-CD20, allogeneic, gamma delta CAR T-cell therapy to have a six-month complete response rate that is comparable to that of autologous CAR-T therapy as well as key safety advantages, Zelin highlighted.

“An off-the-shelf, allogeneic therapy with [a] differentiated and well-tolerated safety profile carries a strong value proposition in this setting,” Zelin commented.

Next Steps and Possible Catalysts

Massachusetts-based Adicet will continue enrolling patients in the study to gain further insights into durability and the recommended Phase 2 dose selection, noted Zelin. The likely choices are two infusions of DL3 (300 million cells) with one lymphodepletion or one dose of DL4 (1 billion cells).

“We look forward to clinical and regulatory updates from the company next year,” wrote Zelin.

Also, in about Q2/23, Adicet plans to move ADI-001 into a potentially pivotal clinical program, Zelin noted.

This would include two studies, one in post-CAR-T large B cell lymphoma patients and the other in earlier-line large B cell lymphoma patients. Discussions are planned with the U.S. Food and Drug Administration and the European Medicines Agency about the regulatory path forward for this program.

“We look forward to clinical and regulatory updates from the company next year,” wrote Zelin.

Positive Efficacy and Safety

The updated Phase 1 data indicated a potential efficacy signal for ADI-001 in post-CAR-T large B cell lymphoma patients, Zelin wrote. At all ADI-001 dose levels, patients showed a 75% overall response rate and a 69% complete response rate. Five patients, who previously relapsed on anti-CD19 autologous CAR-T therapy, had 100% overall response and complete response rates.

Zelin relayed that Dr. Sattva Neelapu, in the Department of Lymphoma-Myeloma at the MD Anderson Cancer Center, “expressed his excitement of the complete response rate in heavily pretreated patients with few alternative treatment options (estimated median progression-free survival is about two months), especially in post-CAR-T large B cell lymphoma patients. Dr. Neelapu notes a roughly 30% duration of response at six months would be viewed favorably.”

BTIG has a Buy rating and a US$34 per share price target on Adicet, which is currently trading at about US$19.88 per share.

In terms of safety, at the DL3+ dose (DL3: 300 million CAR+ cells; DL4: 1 billion CAR+ cells), at which the complete response rate was 86%, there were no grade 3 or higher side effects, including cytokine release syndrome, immune effector cell associated neurotoxicity, graft versus host disease or dose-limiting toxicities. Infections were minimal despite enhanced lymphodepletion being employed.

The “ability to safely redose with a single lymphodepletion regimen supports outpatient-community dosing as key advantages for Adicet’s allogeneic cell therapy,” Zelin added.

BTIG has a Buy rating and a US$34 per share price target on Adicet, which is currently trading at about US$19.88 per share.

Disclosures:

1) Doresa Banning compiled this article for Streetwise Reports LLC and provides services to Streetwise Reports as an independent contractor. She or members of her household own securities of the following companies mentioned in the article: None. She or members of her household are paid by the following companies mentioned in this article: None.

2) The following companies mentioned in this article are billboard sponsors of Streetwise Reports: None. Click here for important disclosures about sponsor fees.

3) Comments and opinions expressed are those of the specific experts and not of Streetwise Reports or its officers. The information provided above is for informational purposes only and is not a recommendation to buy or sell any security.

4) The article does not constitute investment advice. Each reader is encouraged to consult with his or her individual financial professional and any action a reader takes as a result of information presented here is his or her own responsibility. By opening this page, each reader accepts and agrees to Streetwise Reports’ terms of use and full legal disclaimer. This article is not a solicitation for investment. Streetwise Reports does not render general or specific investment advice and the information on Streetwise Reports should not be considered a recommendation to buy or sell any security. Streetwise Reports does not endorse or recommend the business, products, services or securities of any company mentioned on Streetwise Reports.

5) From time to time, Streetwise Reports LLC and its directors, officers, employees or members of their families, as well as persons interviewed for articles and interviews on the site, may have a long or short position in securities mentioned. Directors, officers, employees or members of their immediate families are prohibited from making purchases and/or sales of those securities in the open market or otherwise from the time of the decision to publish an article until three business days after the publication of the article. The foregoing prohibition does not apply to articles that in substance only restate previously published company releases.

6) This article does not constitute medical advice. Officers, employees and contributors to Streetwise Reports are not licensed medical professionals. Readers should always contact their healthcare professionals for medical advice.

BTIG Research, Adicet Bio Inc., December 12, 2022

Analyst Certification: I, Justin Zelin, hereby certify that the views about the companies and securities discussed in this report are accurately expressed and that I have not received and will not receive direct or indirect compensation in exchange for expressing specific recommendations or views in this report.

I, Vishal Sethi, hereby certify that the views about the companies and securities discussed in this report are accurately expressed and that I have not received and will not receive direct or indirect compensation in exchange for expressing specific recommendations or views in this report.

General Disclosures: Research reports produced by BTIG LLC (“BTIG”) are published for and intended to be distributed solely to BTIG institutional and corporate clients. Recipients of BTIG reports will not be considered clients of BTIG solely because they may have received such BTIG report.

To the extent recipient accesses BTIG research, whether on a BTIG research website or through a third-party platform, BTIG is able to search, filter, download and review information on the readership of BTIG’s research, including the specific research consumed and the name, company name, email address and, in certain circumstances, the location of the individual who accessed the research (the “Readership Information”). Recipient consents to BTIG’s receipt of the Readership Information, including receipt of that information from a third party.

The research analyst(s) responsible for the preparation of this report receives compensation based upon a variety of factors, including the quality and accuracy of research, internal/client feedback, and overall Firm revenues. BTIG reports are based on public information and BTIG considers the same to be reliable, comprehensive information, but makes no representation or warranty that the reports are accurate or complete. BTIG opinions and information provided in this report are as of the date of the report and may change without notice. An issuer may be classified as “Under Review” or “Research Restricted”. In these cases, investors should consider any previous investment recommendation and/or rating to a subject company/issuer to no longer be current and should not be relied upon nor considered a solicitation.

This research report is not an offer to buy or sell or solicitation of an offer to buy or sell any security in any jurisdiction where such an offer or solicitation would be illegal. This research report was not drafted specifically for any particular individual or entity and is not a personal recommendation to participate in any particular trading strategy or transaction. Any recipient of this research report should obtain independent advice specific to their personal circumstances before undertaking any investment activity and must make their own independent evaluation of any securities or financial instruments.

Facts, views or opinions presented in this report have not been reviewed by, and may not reflect information known to, employees or other professionals in the “BTIG Group” (BTIG Group includes, but is not limited to, BTIG and its parents, subsidiaries and/ or affiliates). BTIG Group employees, including Sales Representatives and Traders, may provide oral or written commentary or advice that may be inconsistent with the opinions and/or views expressed in this research report. BTIG Group employees and/or its affiliates not involved in the preparation of this research report may have investments in securities or derivatives of securities of companies mentioned in this report that are inconsistent with the views discussed in this report.

Investors in securities products bear certain risks in conjunction with those investments. The value of, and income from, any investments may vary because of changes in interest rates or foreign exchange rates, securities prices or market indexes, operational or financial conditions of companies or other factors within or beyond the companies’ control. Recipient of the research reports should be aware that investments in securities may pose significant risks due to the inherent uncertainty associated with relying on forecasts of various factors that can affect the earnings, cash flow and overall valuation of a company.

Any investment in securities should be undertaken only upon consideration of issues relating to the recipient’s overall investment portfolio and objectives (such as diversification by asset class, industry or company) as well as time horizon and liquidity needs. Further, past performance should not be taken as an indication or guarantee of future performance, and no representation or warranty, express or implied, is made regarding future performance. There may be time limitations on the exercise of options or other rights in any securities transactions.

Investing in foreign markets and securities, including ADRs, is subject to additional risks such as currency fluctuation, limited information, political instability, economic risk, and the potential for illiquid markets. Investing in emerging markets may accentuate these risks. Non-U.S. reporting issuers of foreign securities, however, may not make regular or complete public disclosure relating to their financial condition or the securities that they issue.

The trademarks and service marks contained herein are the property of their respective owners. Third-party data providers make no warranties or representations of any kind relating to the accuracy, completeness, or timeliness of the data they provide and shall not have liability of any damages of any kind relating to such data. The report or any portion hereof may not be reprinted, sold or redistributed without the written consent of BTIG. This report is intended only for use by the recipient. The recipient acknowledges that all research and analysis in this report are the property of BTIG and agrees to limit the use of all publications received from BTIG within his, or her or its, own company or organization. No rights are given for passing on, transmitting, re transmitting or reselling the information provided.

Jurisdiction and Dissemination: BTIG is a U.S. broker-dealer and member of FINRA and SIPC

Franco’s Largest Asset Is at Risk

Source: Adrian Day  (12/19/22)

Today, expert Adrian Day gives updates on developments affecting several of his favorite companies, mostly positive but with one potentially damaging piece of news.

Franco-Nevada Corp. (FNV:TSX; FNV:NYSE) shares were down sharply after the government of Panama effectively seized First Quantum’s Cobre Panama mine, on which Franco has its largest stream, representing about 15% of both Net Asset Value and revenues.

The government announced it had ordered the mine shut down and that it was taking over care and maintenance until another “partner” could be found. There has been a long-simmering dispute over payments due from the company to the government. The mine represents the country’s largest investment and a large tax contributor.

The move stunned the local business community as well as Canada’s mining industry. It may be a negotiating tactic by the government, but given the drastic action, it would seem that there is something else behind this. Perhaps the government simply wants to show that it is serious, though that would be a pretty high-stakes move.

We suspect, however, that there will be a resolution. The mine means too much to First Quantum and to the government, whose reputation would be severely damaged were the seizure to hold. In fact, the mine is continuing to operate since halting operations would require resolutions to rescind the contracts, thus allowing time for talks to continue.

Franco Will Survive in Any Event

Franco has a gold stream on the copper mine that has only just achieved a full run rate. With over US$1 billion in cash, Franco can withstand the financial risk. It may yet reach its annual guidance, even with the shortfall from Cobre Panama. More important is whether First Quantum resumes ownership since streams are usually with the operator.

The shares fell from Wednesday’s close of US$144, where they were arguably ahead of themselves anyway. Franco has a rock-solid balance sheet, top management, and a well-diversified portfolio. It is still too early to jump back in — the shares are still well above where they were early last month — and the Panama issue may drag on for a while, but we shall certainly be looking for opportunities to buy shares in this blue chip.

Orogen Cash-flow Positive With Jump in Revenues

Orogen Royalties Inc. (OGN:TSX.V) reported a strong quarter, with royalty revenue from Ermitaño in Mexico up nearly 40% from previous quarters. The company also generated net income from its prospect generation business, involving gains on project sales and active option agreements. It has also been busy with transactions; so far this year, nine deals have been completed adding eight royalties. Overall, the company achieved positive cash flow from operations and ended the quarter with about CA$8.5 in cash and short-term investments.

The year ahead promises to be a very strong one. First Majestic Silver Corp. (FR:TSX; AG:NYSE; FMV:FSE) has indicated that all the ore feed for its mill in 2023 will come from Ermitaño (rather than a blend with the original lower-grade Santa Elena deposit), which should boost Orogen’s revenue.

This Could Be Huge and May Spur M&A

In addition, in February, AngloGold Ashanti Ltd. (AU:NYSE; ANG:JSE; AGG:ASX; AGD:LSE) is expected to publish a pre-feasibility study on its central Silicon deposit as well as a conceptual study of the Merlin deposit, in southern Nevada. Orogen holds a 1% royalty on an area covering both deposits. Altius has a 1.5% royalty over the same area and also claims a royalty of a “larger area of interest,” but Anglo is disputing that, and the claim is currently in arbitration.

We have been looking for some transaction of some type involving Orogen and Altius’ Silicon royalties, but the arbitration may delay this. Anglo has been publicly excited about the Silicon district, indicating it expects a multidecade operation. Silicon itself, known to be mineralized to 625 meters, remains open at depth. The district is clearly large and Anglo is planning to take its time in methodically studying the entire area.

Orogen is one of our top holdings. After meandering around the CA$0,40 mark for the past six months, the stock suddenly jumped last week amid higher-than-normal volume. The company has been doing some investor meetings, and there is no other reason for stock strength that we can discern.

Although we like Orogen and believe it represents strong value even at the higher price, we will hold off on additional buying to see if there is an easing over the normally quiet holiday period. But we want to be building positions.

More Activity and Success at Midland Means Shares Should Be Owned

Midland Exploration Inc. (MD:TSX.V) continues to achieve exploration success at various properties; it is in as good a position as any exploration company for discovery success, while its shares continue to languish, providing an excellent opportunity for investors to continue to accumulate.

First, Midland announced the discovery of a large copper-gold-silver-molybdenum mineralized system on its La Peltrie property in the Detour region of northern Quebec. The property is under the option to Probe Metals. The discovery was made from a single drill hole in the first drilling but suggests a larger system. The companies plan to follow up early next year.

Earlier, Midland had reported the discovery of at least two new gold-bearing structures during a recent prospecting program on the Laflamme joint-venture project in Abitibi, Quebec. This is an early stage, but the area is highly prospective for new discoveries.

Separately, the company announced it was beginning a 10,000-metre drilling program on its gold and nickel-copper projects in the Abitibi region, designed to test more than 40 of its targets developed over the past few years. The targets are on five separate projects, and drilling will continue until March.

Midland has a solid balance sheet and strong management. It has numerous projects, including 10 active joint ventures, across Quebec and is very active. With a market cap of only CA$28 million, it is very undervalued and trading around its all-time lows. It is a strong Buy at this level.

Altius Ups Interest in Renewal Unit

Altius Minerals Corp. (ALS:TSX.V) invested a further US$21 million in Altius Renewal Royalties (ARR.NY), which in turn holds 50% of Great Bear Renewables. This brings Altius’ interest in ARR to 59%. Great Bear, which is already cash flow positive, also announced a US$46 million royalty investment in a California solar project. See also comments above regarding Altius’ Silicon royalty.

Altius is a core holding for us, with innovative management which has the discipline to act counter-cyclically — essential in a highly cyclical sector — and a diversified group of royalties. There are several potential growth opportunities in the next year or two.

We recommend buying back in July when the shares were around US$16. Given the volatility of the stock, we will wait for new buying opportunities.

Nestle Reaffirms Focus and Continues To Grow

Nestle SA (NESN:VX; NSRGY:OTC) confirmed an 8% organic sales growth target and upper single-digit earnings-per-share annual growth. At its investor seminar in Europe, it also confirmed that it would continue to focus on food and beverages, including Nestlé Health Science and nutritional health products, as an additional growth platform.

The company also said it aims to continue increasing its annual dividend each year. Analyst forecasts are for an April dividend of Sfr 3, up from 2.80 earlier this year. Next year’s dividend has not yet been announced. Nestlé also confirmed its ongoing program to repurchase CHF 20 billion of its shares over the period 2022 to 2024.

The company has already bought around CHF 9.7 billion of shares in 2022. Nestlé is a core global holding, and for those who do not already own it, it can be bought at this level.

TOP BUYS, in addition to above, include Ares Capital Corp. (ARCC:NASDAQ).

Adrian Day Disclosures:

Adrian Day’s Global Analyst is distributed for $990 per year by Investment Consultants International, Ltd., P.O. Box 6644, Annapolis, MD 21401. (410) 224-8885. www.AdrianDayGlobalAnalyst.com. Publisher: Adrian Day. Owner: Investment Consultants International, Ltd. Staff may have positions in securities discussed herein. Adrian Day is also President of Global Strategic Management (GSM), a registered investment advisor, and a separate company from this service. In his capacity as GSM president, Adrian Day may be buying or selling for clients securities recommended herein concurrently, before or after recommendations herein, and may be acting for clients in a manner contrary to recommendations herein. This is not a solicitation for GSM. Views herein are the editor’s opinion and not fact. All information is believed to be correct, but its accuracy cannot be guaranteed. The owner and editor are not responsible for errors and omissions. © 2022. Adrian Day’s Global Analyst. Information and advice herein are intended purely for the subscriber’s own account. Under no circumstances may any part of a Global Analyst e-mail be copied or distributed without prior written permission of the editor. Given the nature of this service, we will pursue any violations aggressively.

Disclosures:

1) Adrian Day: I, or members of my immediate household or family, own securities of the following companies mentioned in this article: All. I personally am, or members of my immediate household or family are, paid by the following companies mentioned in this article: None. My company has a financial relationship with the following companies mentioned in this article: None. Funds controlled by Adrian Day Asset Management, which is unaffiliated with Adrian Day’s newsletter, hold shares of the following companies mentioned in this article: All. I determined which companies would be included in this article based on my research and understanding of the sector.

2) The following companies mentioned in this article are billboard sponsors of Streetwise Reports: None. Click here for important disclosures about sponsor fees. The information provided above is for informational purposes only and is not a recommendation to buy or sell any security.

3) Statements and opinions expressed are the opinions of the author and not of Streetwise Reports or its officers. The author is wholly responsible for the validity of the statements. The author was not paid by Streetwise Reports for this article. Streetwise Reports was not paid by the author to publish or syndicate this article. Streetwise Reports requires contributing authors to disclose any shareholdings in, or economic relationships with, companies that they write about. Streetwise Reports relies upon the authors to accurately provide this information and Streetwise Reports has no means of verifying its accuracy.

4) This article does not constitute investment advice. Each reader is encouraged to consult with his or her individual financial professional and any action a reader takes as a result of information presented here is his or her own responsibility. By opening this page, each reader accepts and agrees to Streetwise Reports’ terms of use and full legal disclaimer. This article is not a solicitation for investment. Streetwise Reports does not render general or specific investment advice and the information on Streetwise Reports should not be considered a recommendation to buy or sell any security. Streetwise Reports does not endorse or recommend the business, products, services, or securities of any company mentioned on Streetwise Reports.

5) From time to time, Streetwise Reports LLC and its directors, officers, employees, or members of their families, as well as persons interviewed for articles and interviews on the site, may have a long or short position in the securities mentioned. Directors, officers, employees, or members of their immediate families are prohibited from making purchases and/or sales of those securities in the open market or otherwise from the time of the decision to publish an article until three business days after the publication of the article. The foregoing prohibition does not apply to articles that in substance only restate previously published company release. As of the date of this article, officers and/or employees of Streetwise Reports LLC (including members of their household) own securities of First Majestic Silver Corp., a company mentioned in this article.

Stock indices continue to fall due to recession worries

By JustMarkets

The US stock market fell on Monday for the fourth straight session as investors fear that the Federal Reserve’s campaign to tighten monetary policy could push the US economy into recession. This sentiment is creating downward pressure on major indices. At the stock market’s close, Dow Jones (US30) decreased by 0.49%, while S&P 500 (US500) fell by 0.90%. The Technology Index NASDAQ (US100) was down by 1.49% on Monday. All three indices closed the day lower.

Stock markets in Europe mostly rose yesterday. German DAX (DE30) gained 0.36%, French CAC 40 (FR40) added 0.32%, Spanish IBEX 35 (ES35) increased by 0.30%, and British FTSE 100 (UK100) closed on Monday plus 0.40%.

Germany may avoid a recession this winter. The fiscal stimulus packages implemented by the government have prevented the economy from falling off a cliff. But at the same time, the cold winter of the last few days has shown how quickly the nation’s replenished gas reserves could disappear again. Today, many official forecasts suggest that the German economy will return to its average quarterly growth rate by mid-2023.

Oil prices rose Monday as optimism over China’s easing COVID-19 restrictions outweighed fears of a global recession affecting energy demand. Oil also received support from the US Department of Energy, which said Friday it would begin buying crude for the Strategic Petroleum Reserve.

European Union energy ministers on Monday agreed to limit gas prices as the EU aims to tackle the energy crisis. The restriction could be imposed starting February 15, 2023. Germany voted to support the deal despite expressing concerns about the policy’s impact on Europe’s ability to attract gas supplies. Ministers agreed to impose a cap if prices exceed 180 euros per megawatt hour for three days on the contract for the coming month with the Dutch gas transmission center (TTF), which serves as the European benchmark. The Intercontinental Exchange ICE, which trades the TTF on its exchange in Amsterdam, said last week that it might move TTF trading outside the EU if the bloc caps prices.

Asian markets were mostly down yesterday. Japan’s Nikkei 225 (JP225) decreased by 1.05%, China’s FTSE China A50 (CHA50) fell by 0.33%, Hong Kong’s Hang Seng (HK50) ended the day down by 0.50%, India’s NIFTY 50 (IND50) rose by 0.83%, and Australia’s S&P/ASX 200 (AU200) ended Monday in minus 0.18%.

The Bank of Japan shocked markets Tuesday by doubling the 10-year bond yield cap, causing the yen to spike and government bonds to fall, helping pave the way for a possible policy normalization. The Bank of Japan will now allow Japan’s 10-year bond yield to rise to about 0.5%, up from the previous limit of 0.25%. The Central Bank said the move would enhance the sustainability of its monetary easing, but many economists interpreted the move as laying a preliminary foundation for an exit from a decade of extraordinary stimulus policies.

In Australia, the minutes of the November monetary policy meeting showed that the Australian economy continues to grow steadily. However, economic growth is expected to slow next year. The council expects further interest rate increases in the coming period. The size and timing of future interest rate increases will continue to be determined by incoming data and the Board’s assessment of inflation and labor market prospects.

S&P 500 (F) (US500) 3,817.66 −34.70 (−0.90%)

Dow Jones (US30) 32,757.54 −162.92 (−0.49%)

DAX (DE40) 13,942.87 +49.80 (+0.36%)

FTSE 100 (UK100) 7,361.31 +29.19 (+0.40%)

USD Index 104.35 -0.45 (-0.43%)

Important events for today:
  • – Australia RBA Meeting Minutes (m/m) at 02:30 (GMT+2);
  • – China PBoC Loan Prime Rate at 03:15 (GMT+2);
  • – Japan BoJ Interest Rate Decision at 05:00 (GMT+2);
  • – Japan BoJ Monetary Policy Statement at 05:00 (GMT+2);
  • – Japan BoJ Press Conference at 05:00 (GMT+2);
  • – US Building Permits (m/m) at 15:30 (GMT+2);
  • – Canada Retail Sales (m/m) at 15:30 (GMT+2).

By JustMarkets


This article reflects a personal opinion and should not be interpreted as an investment advice, and/or offer, and/or a persistent request for carrying out financial transactions, and/or a guarantee, and/or a forecast of future events.

Stocks rebound as central banks point to a tricky 2023

By ForexTime

Stumbling markets had fallen for a second consecutive week on Friday after investors heard hawkish messages from the feast of central bank meetings.

Expectations had been set that interest rates would remain higher for longer even though inflation and economic data has started to turn lower.

But this morning has seen a bid in equity markets with US futures looking positive and in the green.

The benchmark S&P500 US index has eyes on the 50-day simple moving average at 3863 as initial resistance.

The mild change in improved sentiment comes from China’s alleged move to enact pro-business policies and stimulus next year.

The upside target for the bulls is the 100-day SMA at 3926.4 which would take prices back to the choppy range that was seen for most of November and December.


Will DAX’s “golden cross” entice more bulls?

European stocks are still digesting their biggest decline in many months last week.

The ECB delivered a much more hawkish message than expected saying that interest rates were set to rise “significantly” at a steady pace.

Many ECB watchers were taken aback by this shift with some calling it a “hawkish pivot”.

This rhetoric will be a key driver for European assets in the new year, but it certainly put a dent in eurozone and global growth prospects as well over the coming months.

The German Dax tumbled last Thursday out of its recent range, despite forming a ‘golden cross’ (when 50-day SMA crosses above its 200-day counterpart) earlier this month.

The 50-day simple moving average sits at 13736 with the widely-watched 200-day SMA at 13561.


Forex-Time-LogoArticle by ForexTime

ForexTime Ltd (FXTM) is an award winning international online forex broker regulated by CySEC 185/12 www.forextime.com

Stock Market Speculator bets trend lower led by S&P500-Mini & VIX

By InvestMacro

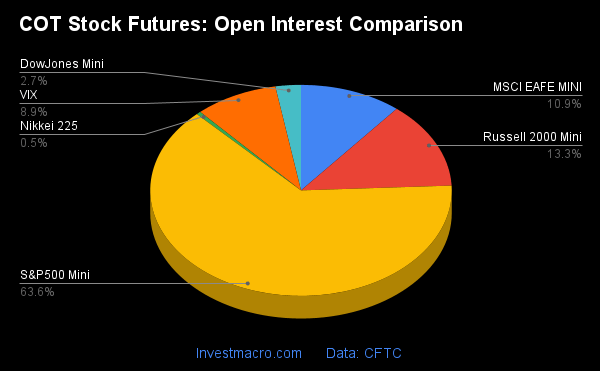
Here are the latest charts and statistics for the Commitment of Traders (COT) data published by the Commodities Futures Trading Commission (CFTC).

The latest COT data is updated through Tuesday December 13th and shows a quick view of how large traders (for-profit speculators and commercial entities) were positioned in the futures markets.

Weekly Speculator Changes led lower by S&P500-Mini & VIX

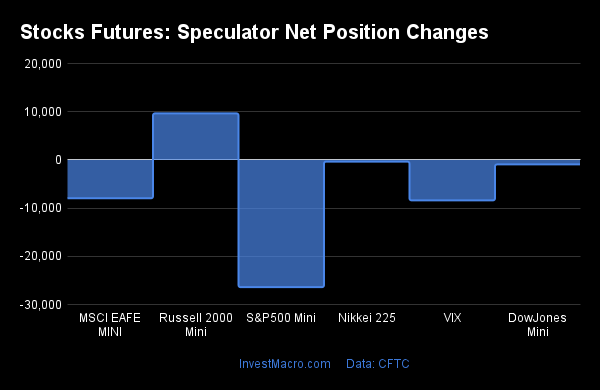
The COT stock markets speculator bets were lower this week as two out of the seven stock markets we cover had higher positioning while the other five markets had lower speculator contracts.

Leading the gains for the stock markets was Russell-Mini (9,651 contracts) with the Nasdaq-Mini (5,681 contracts) also showing a positive week.

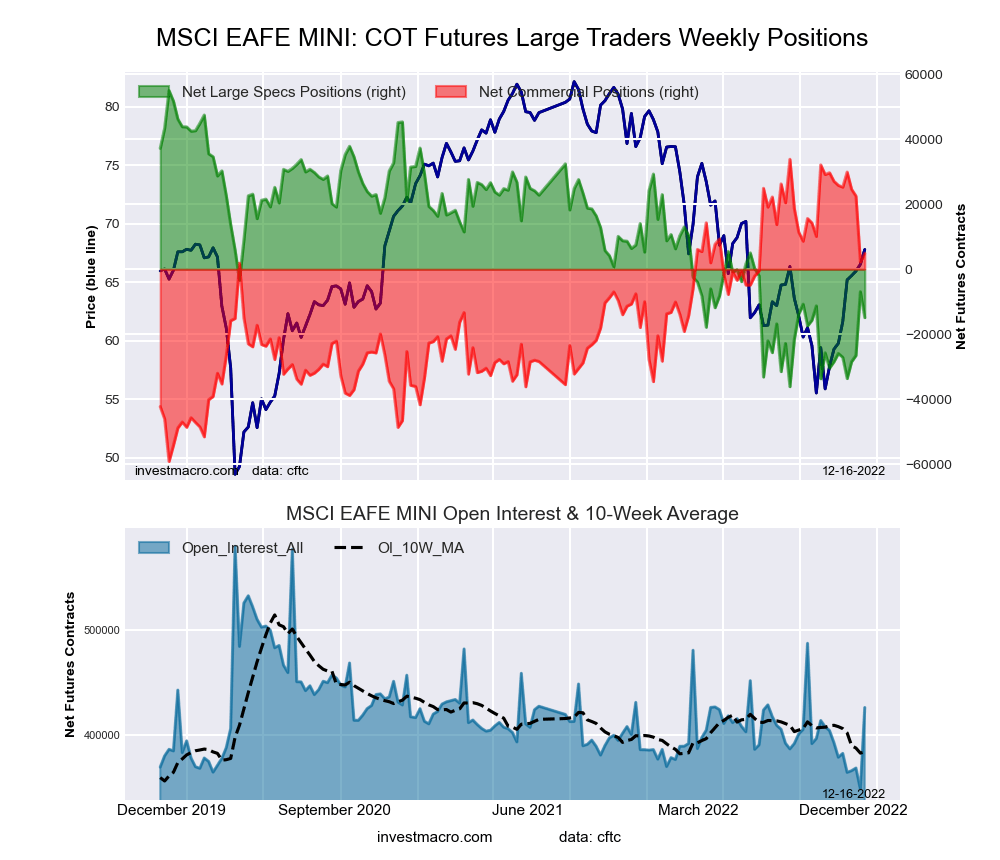
The markets with the declines in speculator bets this week were the S&P500-Mini (-26,403 contracts), VIX (-8,399 contracts), MSCI EAFE-Mini (-7,969 contracts), DowJones-Mini (-939 contracts) and the Nikkei 225 (-356 contracts) also registering lower bets on the week.


Data Snapshot of Stock Market Traders | Columns Legend
Dec-13-2022OIOI-IndexSpec-NetSpec-IndexCom-NetCOM-IndexSmalls-NetSmalls-Index
S&P500-Mini2,477,14015-230,12214212,7267917,39630
Nikkei 22518,81323-2,964631,418371,54648
Nasdaq-Mini312,9847919,19886-12,77919-6,41940
DowJones-Mini106,45479-12,5422420,24985-7,7071
VIX347,72351-82,9785785,45342-2,47579
Nikkei 225 Yen39,328198,049593,51120-11,56057


Strength Scores led by Nasdaq-Mini & Nikkei 225

COT Strength Scores (a normalized measure of Speculator positions over a 3-Year range, from 0 to 100 where above 80 is Extreme-Bullish and below 20 is Extreme-Bearish) showed that the Nasdaq-Mini (86 percent) and the Nikkei 225 (63 percent) lead the stock markets this week. The VIX (57 percent) comes in as the next highest in the weekly strength scores.

On the downside, the S&P500-Mini (14 percent) is at the lowest strength level currently and is in Extreme-Bearish territory (below 20 percent). The next lowest strength score is the DowJones-Mini (24.2 percent).

Strength Statistics:
VIX (57.4 percent) vs VIX previous week (63.0 percent)
S&P500-Mini (13.6 percent) vs S&P500-Mini previous week (18.5 percent)
DowJones-Mini (24.2 percent) vs DowJones-Mini previous week (25.6 percent)
Nasdaq-Mini (85.8 percent) vs Nasdaq-Mini previous week (82.6 percent)
Russell2000-Mini (31.5 percent) vs Russell2000-Mini previous week (26.1 percent)
Nikkei USD (63.4 percent) vs Nikkei USD previous week (65.1 percent)
EAFE-Mini (25.4 percent) vs EAFE-Mini previous week (35.0 percent)


Nasdaq-Mini tops the 6-Week Strength Trends

COT Strength Score Trends (or move index, calculates the 6-week changes in strength scores) showed that the Nasdaq-Mini (19.2 percent) leads the past six weeks trends for the stock markets. The MSCI EAFE-Mini (13 percent) is the next highest positive mover in the latest trends data.

The Nikkei 225 (-14 percent) and the Russell-Mini (-8 percent) lead the downside trend scores currently.

Strength Trend Statistics:
VIX (-12.5 percent) vs VIX previous week (-14.3 percent)
S&P500-Mini (-10.2 percent) vs S&P500-Mini previous week (2.9 percent)
DowJones-Mini (-6.5 percent) vs DowJones-Mini previous week (3.4 percent)
Nasdaq-Mini (19.2 percent) vs Nasdaq-Mini previous week (4.4 percent)
Russell2000-Mini (-7.9 percent) vs Russell2000-Mini previous week (4.0 percent)
Nikkei USD (-14.1 percent) vs Nikkei USD previous week (-19.9 percent)
EAFE-Mini (13.2 percent) vs EAFE-Mini previous week (25.8 percent)


Individual Stock Market Charts:

VIX Volatility Futures:

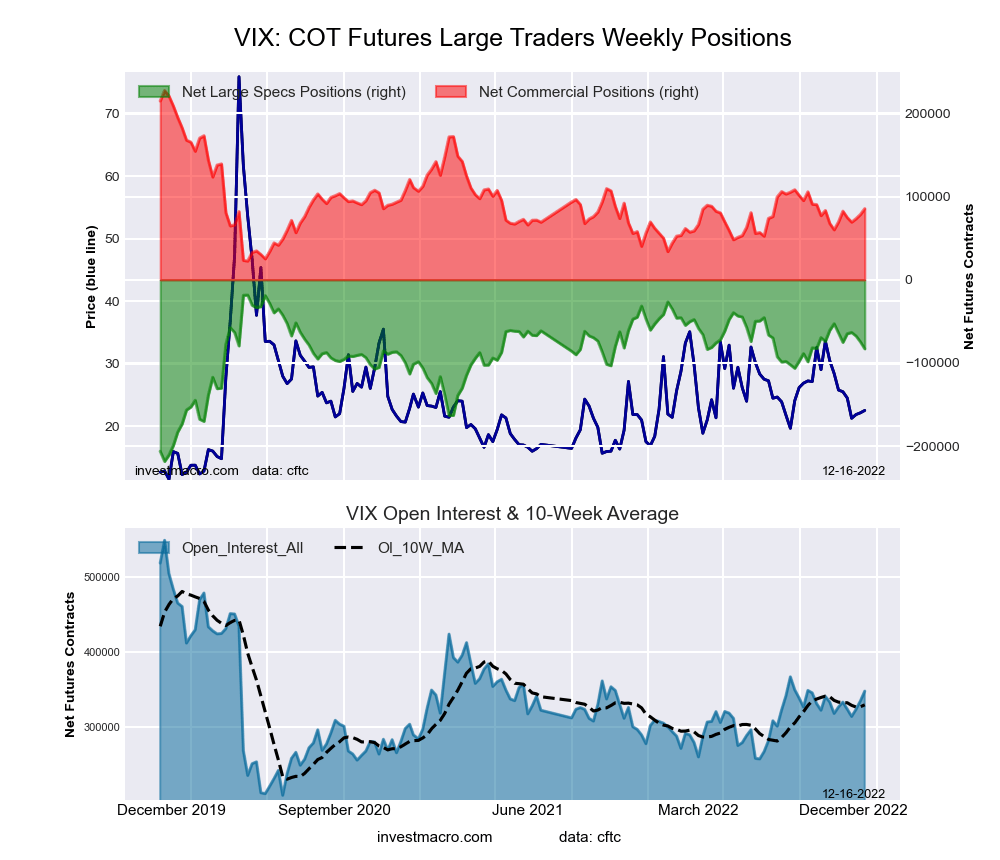
VIX Volatility Futures COT ChartThe VIX Volatility large speculator standing this week came in at a net position of -82,978 contracts in the data reported through Tuesday. This was a weekly decline of -8,399 contracts from the previous week which had a total of -74,579 net contracts.

This week’s current strength score (the trader positioning range over the past three years, measured from 0 to 100) shows the speculators are currently Bullish with a score of 57.4 percent. The commercials are Bearish with a score of 41.8 percent and the small traders (not shown in chart) are Bullish with a score of 79.3 percent.

VIX Volatility Futures StatisticsSPECULATORSCOMMERCIALSSMALL TRADERS
– Percent of Open Interest Longs:16.254.37.4
– Percent of Open Interest Shorts:40.129.78.1
– Net Position:-82,97885,453-2,475
– Gross Longs:56,330188,88325,721
– Gross Shorts:139,308103,43028,196
– Long to Short Ratio:0.4 to 11.8 to 10.9 to 1
NET POSITION TREND:
– Strength Index Score (3 Year Range Pct):57.441.879.3
– Strength Index Reading (3 Year Range):BullishBearishBullish
NET POSITION MOVEMENT INDEX:
– 6-Week Change in Strength Index:-12.510.614.8


S&P500 Mini Futures:

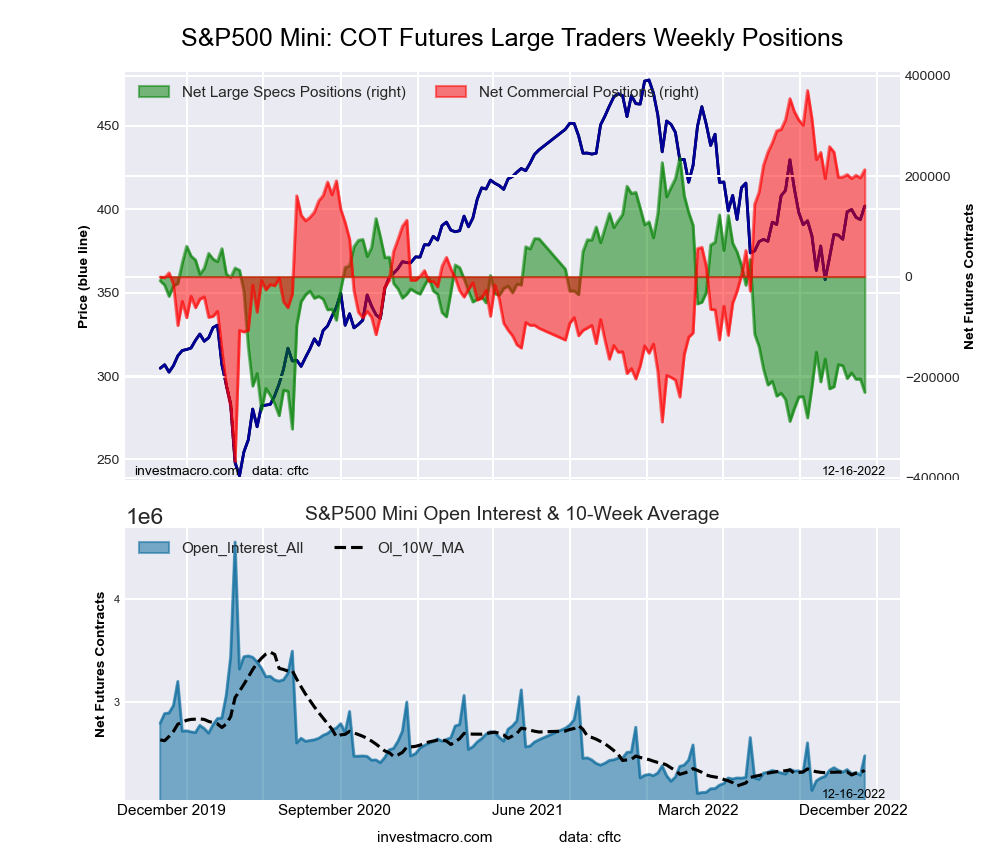
SP500 Mini Futures COT ChartThe S&P500 Mini large speculator standing this week came in at a net position of -230,122 contracts in the data reported through Tuesday. This was a weekly fall of -26,403 contracts from the previous week which had a total of -203,719 net contracts.

This week’s current strength score (the trader positioning range over the past three years, measured from 0 to 100) shows the speculators are currently Bearish-Extreme with a score of 13.6 percent. The commercials are Bullish with a score of 78.7 percent and the small traders (not shown in chart) are Bearish with a score of 30.0 percent.

S&P500 Mini Futures StatisticsSPECULATORSCOMMERCIALSSMALL TRADERS
– Percent of Open Interest Longs:9.173.311.3
– Percent of Open Interest Shorts:18.464.810.6
– Net Position:-230,122212,72617,396
– Gross Longs:226,5071,816,921279,775
– Gross Shorts:456,6291,604,195262,379
– Long to Short Ratio:0.5 to 11.1 to 11.1 to 1
NET POSITION TREND:
– Strength Index Score (3 Year Range Pct):13.678.730.0
– Strength Index Reading (3 Year Range):Bearish-ExtremeBullishBearish
NET POSITION MOVEMENT INDEX:
– 6-Week Change in Strength Index:-10.22.18.3


Dow Jones Mini Futures:

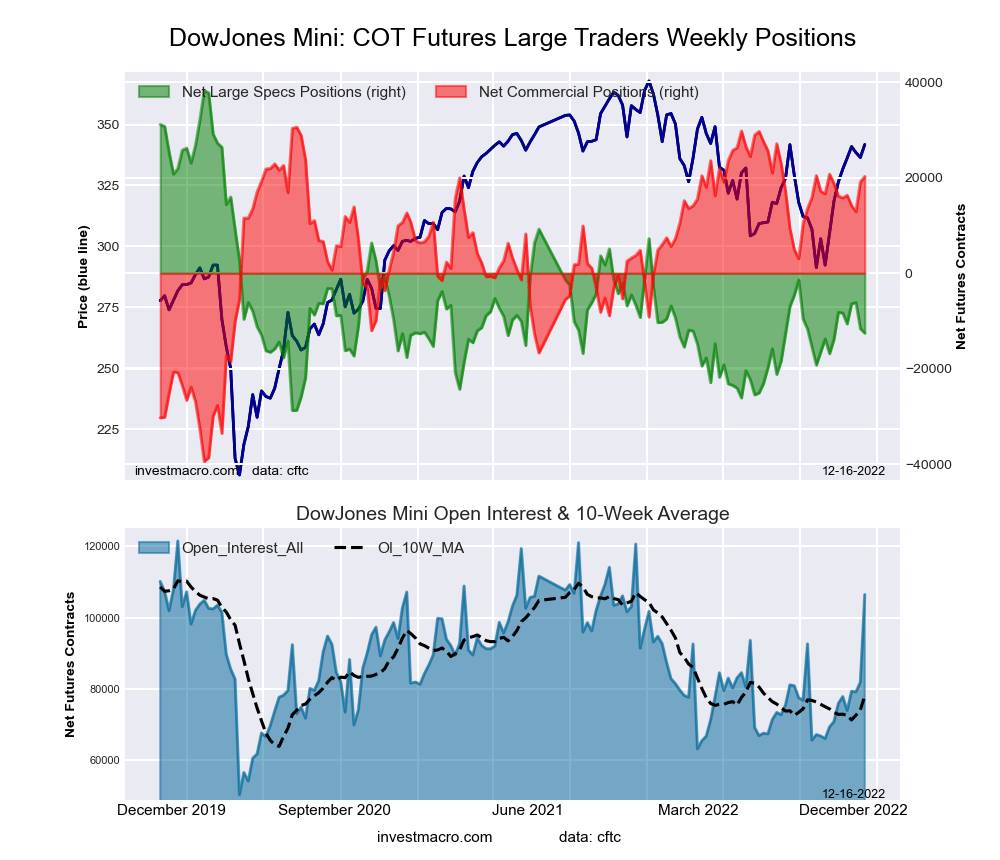
Dow Jones Mini Futures COT ChartThe Dow Jones Mini large speculator standing this week came in at a net position of -12,542 contracts in the data reported through Tuesday. This was a weekly decrease of -939 contracts from the previous week which had a total of -11,603 net contracts.

This week’s current strength score (the trader positioning range over the past three years, measured from 0 to 100) shows the speculators are currently Bearish with a score of 24.2 percent. The commercials are Bullish-Extreme with a score of 85.2 percent and the small traders (not shown in chart) are Bearish-Extreme with a score of 1.2 percent.

Dow Jones Mini Futures StatisticsSPECULATORSCOMMERCIALSSMALL TRADERS
– Percent of Open Interest Longs:22.055.913.0
– Percent of Open Interest Shorts:33.836.820.3
– Net Position:-12,54220,249-7,707
– Gross Longs:23,41159,47713,855
– Gross Shorts:35,95339,22821,562
– Long to Short Ratio:0.7 to 11.5 to 10.6 to 1
NET POSITION TREND:
– Strength Index Score (3 Year Range Pct):24.285.21.2
– Strength Index Reading (3 Year Range):BearishBullish-ExtremeBearish-Extreme
NET POSITION MOVEMENT INDEX:
– 6-Week Change in Strength Index:-6.55.91.2


Nasdaq Mini Futures:

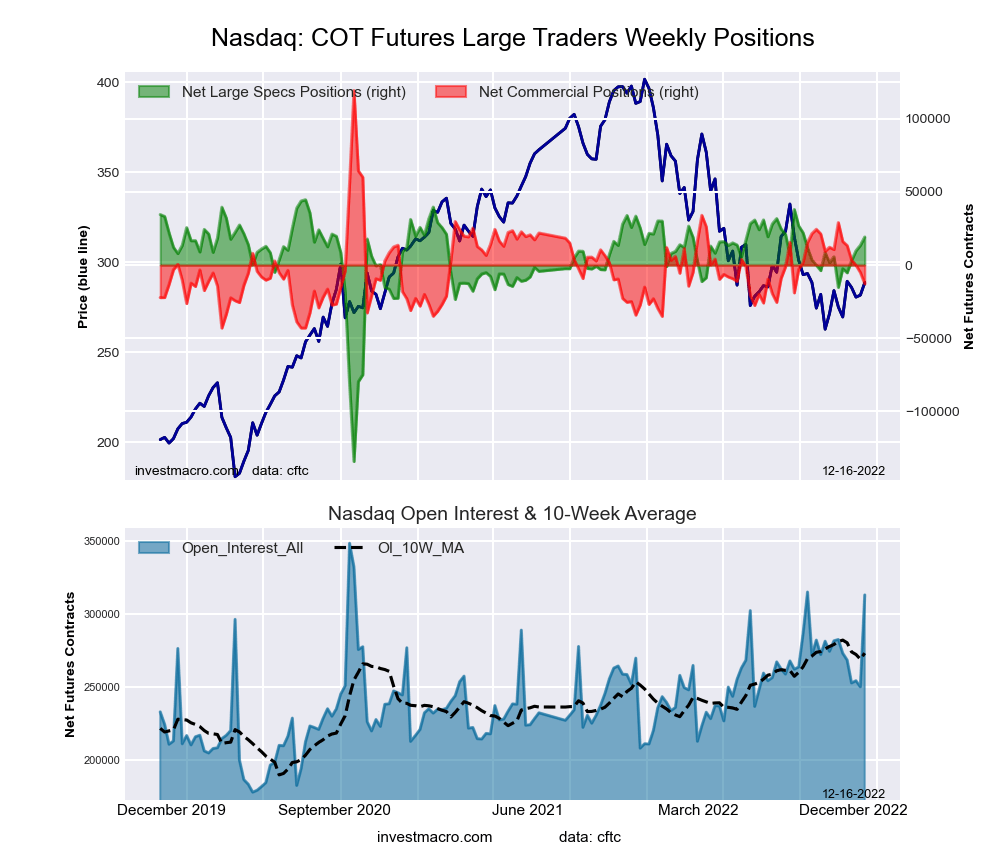
Nasdaq Mini Futures COT ChartThe Nasdaq Mini large speculator standing this week came in at a net position of 19,198 contracts in the data reported through Tuesday. This was a weekly increase of 5,681 contracts from the previous week which had a total of 13,517 net contracts.

This week’s current strength score (the trader positioning range over the past three years, measured from 0 to 100) shows the speculators are currently Bullish-Extreme with a score of 85.8 percent. The commercials are Bearish-Extreme with a score of 18.6 percent and the small traders (not shown in chart) are Bearish with a score of 40.0 percent.

Nasdaq Mini Futures StatisticsSPECULATORSCOMMERCIALSSMALL TRADERS
– Percent of Open Interest Longs:23.458.611.8
– Percent of Open Interest Shorts:17.262.713.9
– Net Position:19,198-12,779-6,419
– Gross Longs:73,103183,30636,975
– Gross Shorts:53,905196,08543,394
– Long to Short Ratio:1.4 to 10.9 to 10.9 to 1
NET POSITION TREND:
– Strength Index Score (3 Year Range Pct):85.818.640.0
– Strength Index Reading (3 Year Range):Bullish-ExtremeBearish-ExtremeBearish
NET POSITION MOVEMENT INDEX:
– 6-Week Change in Strength Index:19.2-25.814.1


Russell 2000 Mini Futures:

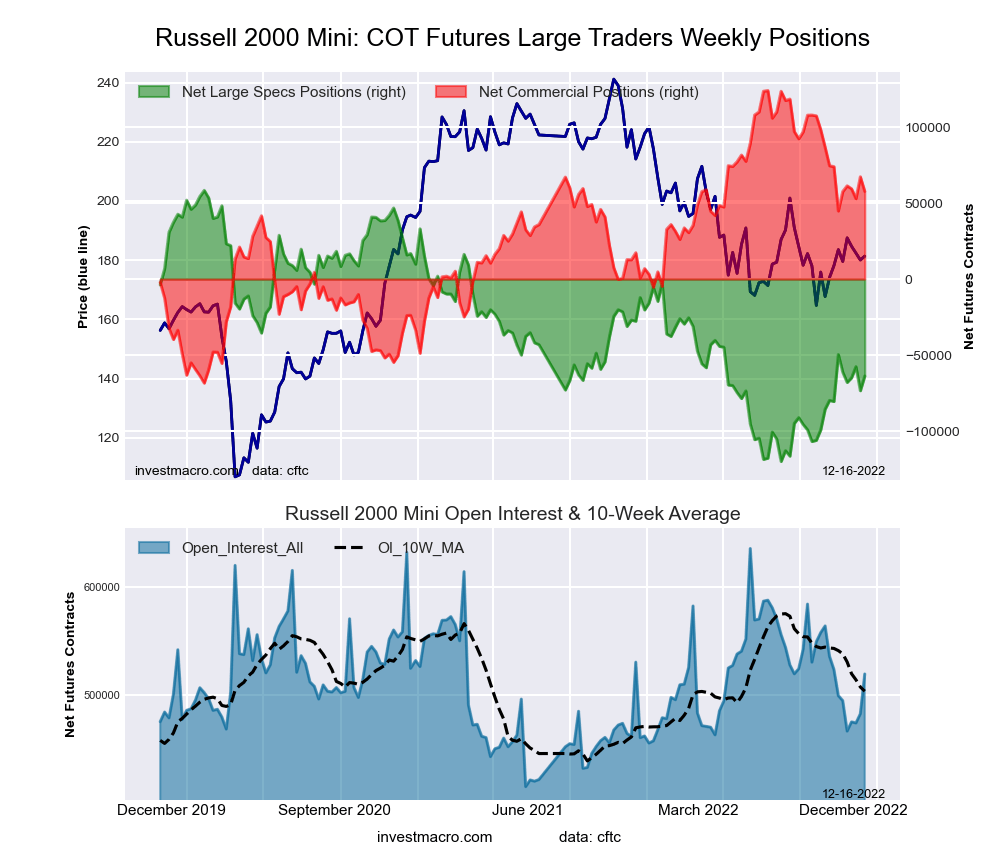
Russell 2000 Mini Futures COT ChartThe Russell 2000 Mini large speculator standing this week came in at a net position of -63,784 contracts in the data reported through Tuesday. This was a weekly lift of 9,651 contracts from the previous week which had a total of -73,435 net contracts.

This week’s current strength score (the trader positioning range over the past three years, measured from 0 to 100) shows the speculators are currently Bearish with a score of 31.5 percent. The commercials are Bullish with a score of 65.5 percent and the small traders (not shown in chart) are Bearish with a score of 45.6 percent.

Russell 2000 Mini Futures StatisticsSPECULATORSCOMMERCIALSSMALL TRADERS
– Percent of Open Interest Longs:8.682.25.4
– Percent of Open Interest Shorts:20.971.14.2
– Net Position:-63,78457,6476,137
– Gross Longs:44,847426,83127,878
– Gross Shorts:108,631369,18421,741
– Long to Short Ratio:0.4 to 11.2 to 11.3 to 1
NET POSITION TREND:
– Strength Index Score (3 Year Range Pct):31.565.545.6
– Strength Index Reading (3 Year Range):BearishBullishBearish
NET POSITION MOVEMENT INDEX:
– 6-Week Change in Strength Index:-7.96.73.9


Nikkei Stock Average (USD) Futures:

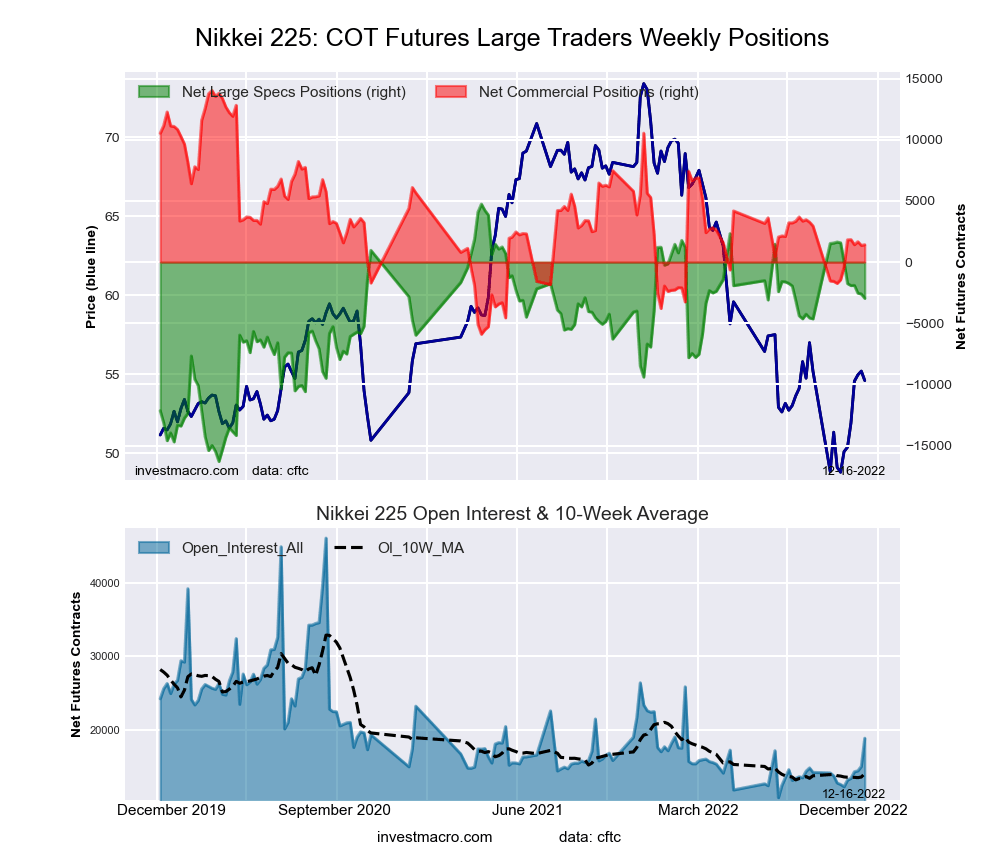
Nikkei Stock Average (USD) Futures COT ChartThe Nikkei Stock Average (USD) large speculator standing this week came in at a net position of -2,964 contracts in the data reported through Tuesday. This was a weekly decrease of -356 contracts from the previous week which had a total of -2,608 net contracts.

This week’s current strength score (the trader positioning range over the past three years, measured from 0 to 100) shows the speculators are currently Bullish with a score of 63.4 percent. The commercials are Bearish with a score of 36.7 percent and the small traders (not shown in chart) are Bearish with a score of 47.7 percent.

Nikkei Stock Average Futures StatisticsSPECULATORSCOMMERCIALSSMALL TRADERS
– Percent of Open Interest Longs:17.045.922.0
– Percent of Open Interest Shorts:32.738.413.7
– Net Position:-2,9641,4181,546
– Gross Longs:3,1938,6344,132
– Gross Shorts:6,1577,2162,586
– Long to Short Ratio:0.5 to 11.2 to 11.6 to 1
NET POSITION TREND:
– Strength Index Score (3 Year Range Pct):63.436.747.7
– Strength Index Reading (3 Year Range):BullishBearishBearish
NET POSITION MOVEMENT INDEX:
– 6-Week Change in Strength Index:-14.19.214.2


MSCI EAFE Mini Futures:

MSCI EAFE Mini Futures COT ChartThe MSCI EAFE Mini large speculator standing this week came in at a net position of -14,886 contracts in the data reported through Tuesday. This was a weekly decline of -7,969 contracts from the previous week which had a total of -6,917 net contracts.

This week’s current strength score (the trader positioning range over the past three years, measured from 0 to 100) shows the speculators are currently Bearish with a score of 25.4 percent. The commercials are Bullish with a score of 66.1 percent and the small traders (not shown in chart) are Bullish-Extreme with a score of 100.0 percent.

MSCI EAFE Mini Futures StatisticsSPECULATORSCOMMERCIALSSMALL TRADERS
– Percent of Open Interest Longs:4.290.54.6
– Percent of Open Interest Shorts:7.789.42.2
– Net Position:-14,8864,9269,960
– Gross Longs:18,081386,03119,545
– Gross Shorts:32,967381,1059,585
– Long to Short Ratio:0.5 to 11.0 to 12.0 to 1
NET POSITION TREND:
– Strength Index Score (3 Year Range Pct):25.466.1100.0
– Strength Index Reading (3 Year Range):BearishBullishBullish-Extreme
NET POSITION MOVEMENT INDEX:
– 6-Week Change in Strength Index:13.2-24.573.6


Article By InvestMacroReceive our weekly COT Newsletter

*COT Report: The COT data, released weekly to the public each Friday, is updated through the most recent Tuesday (data is 3 days old) and shows a quick view of how large speculators or non-commercials (for-profit traders) were positioned in the futures markets.

The CFTC categorizes trader positions according to commercial hedgers (traders who use futures contracts for hedging as part of the business), non-commercials (large traders who speculate to realize trading profits) and nonreportable traders (usually small traders/speculators) as well as their open interest (contracts open in the market at time of reporting). See CFTC criteria here.

Murrey Math Lines 16.12.2022 (Brent, S&P 500)

By RoboForex.com

BRENT

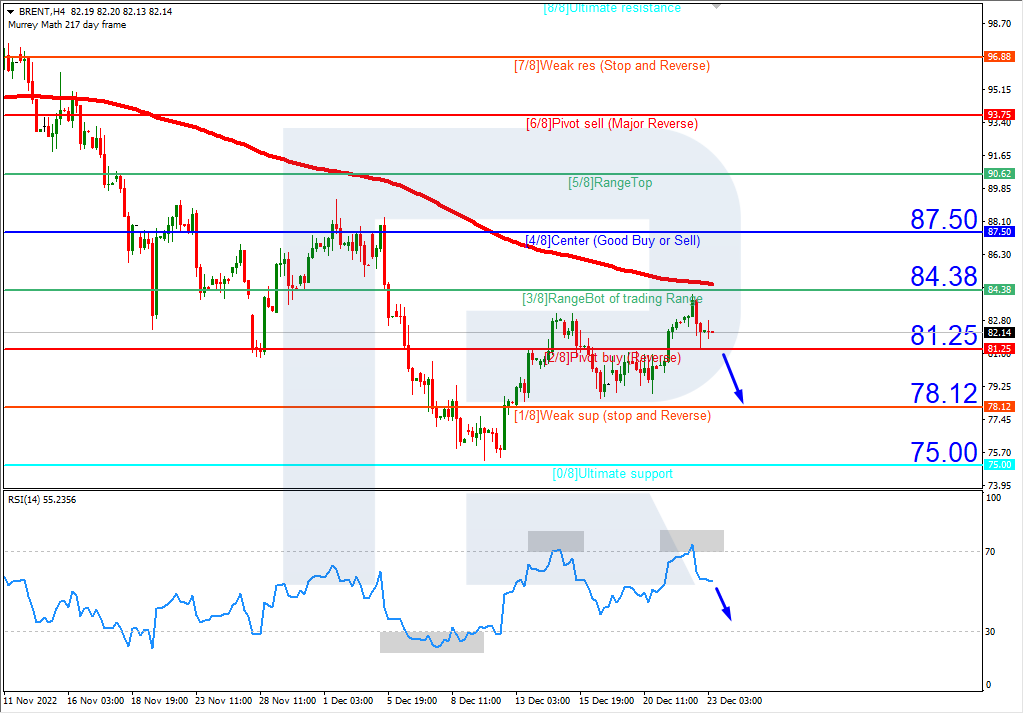
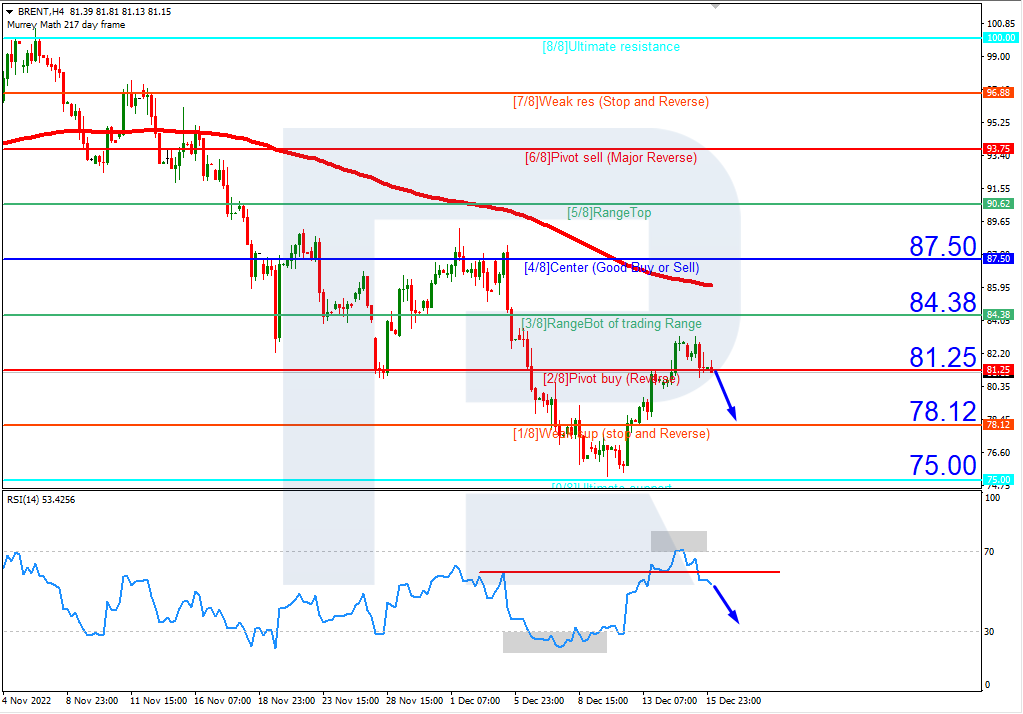
On H4, Brent quotes are under the 200-day Moving Average, which indicates a downtrend. The RSI has broken through the descending trendline. In this situation, further falling to the support level of 1/8 (78.12) is expected. The scenario can be cancelled by an upwards breakaway of the resistance level of 3/8 (84.38), which might lead to a trend reversal and growth to the resistance level of 4/8 (87.50).

BRENTH4
Risk Warning: the result of previous trading operations do not guarantee the same results in the future

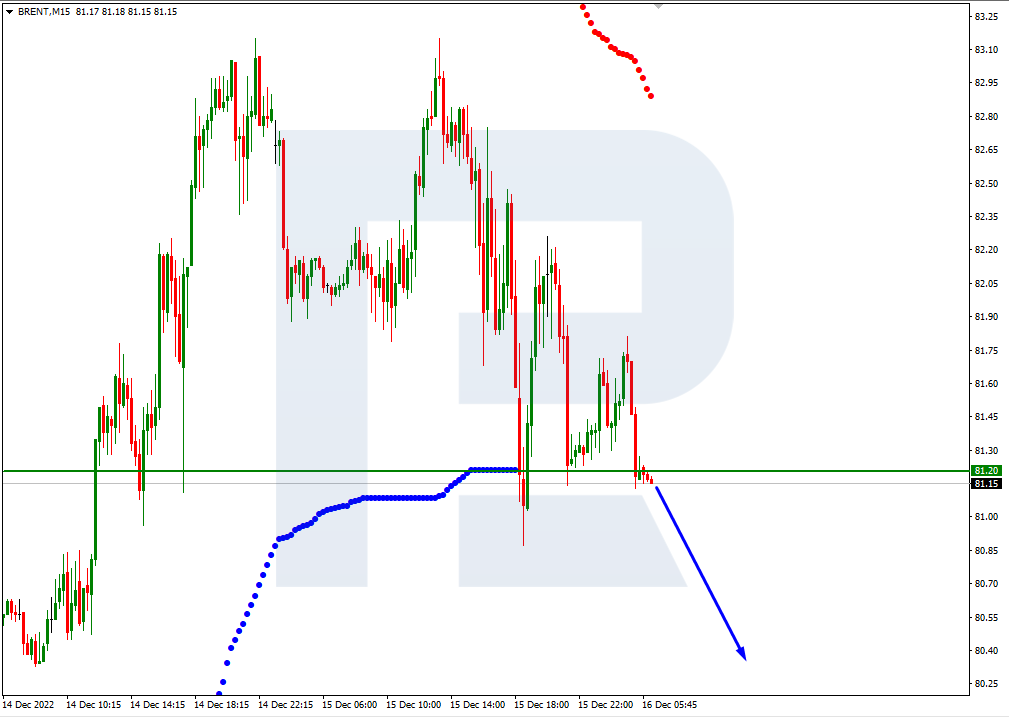
On M15, the lower line of VoltyChannel is broken away, which confirms a downtrend and increases the probability of further price falling.

BRENT_M15
Risk Warning: the result of previous trading operations do not guarantee the same results in the future

S&P 500

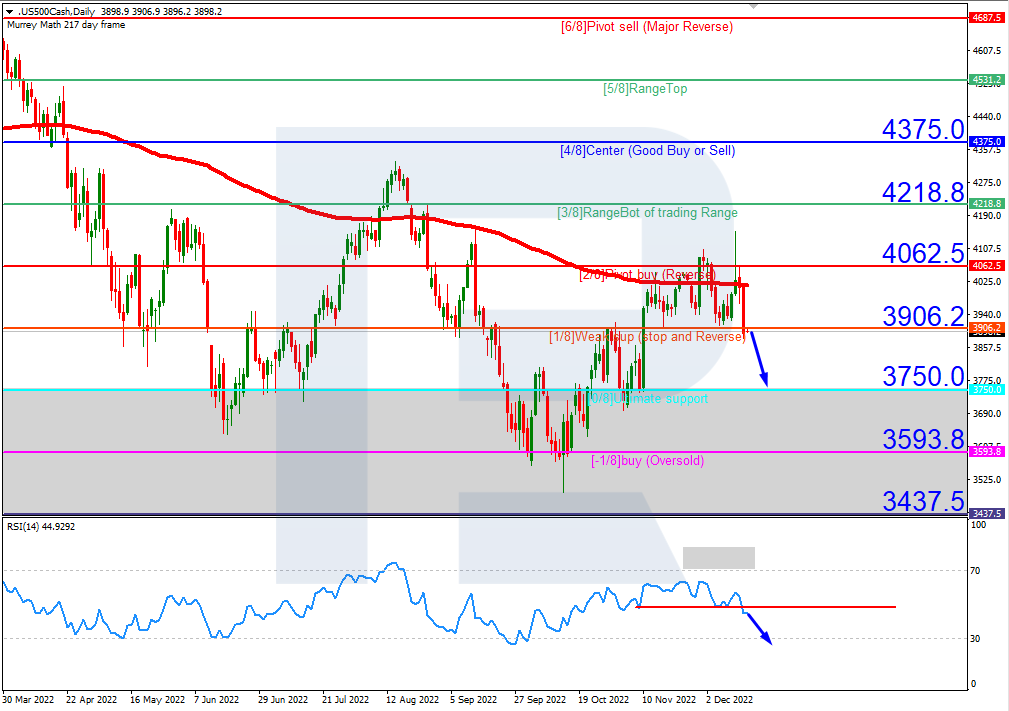
On H4, the quotes have dropped under the 200-day Moving Average, indicating the prevalence of a downtrend. The RSI has broken through the support level downwards. As a result, further falling of the quotes to 0/8 (3750.0) is expected. The scenario can be cancelled by rising over the resistance level of 2/8 (4062.5). This might lead to a trend reversal and growth to 3/8 (4218.8).

S&P 500_H4
Risk Warning: the result of previous trading operations do not guarantee the same results in the future

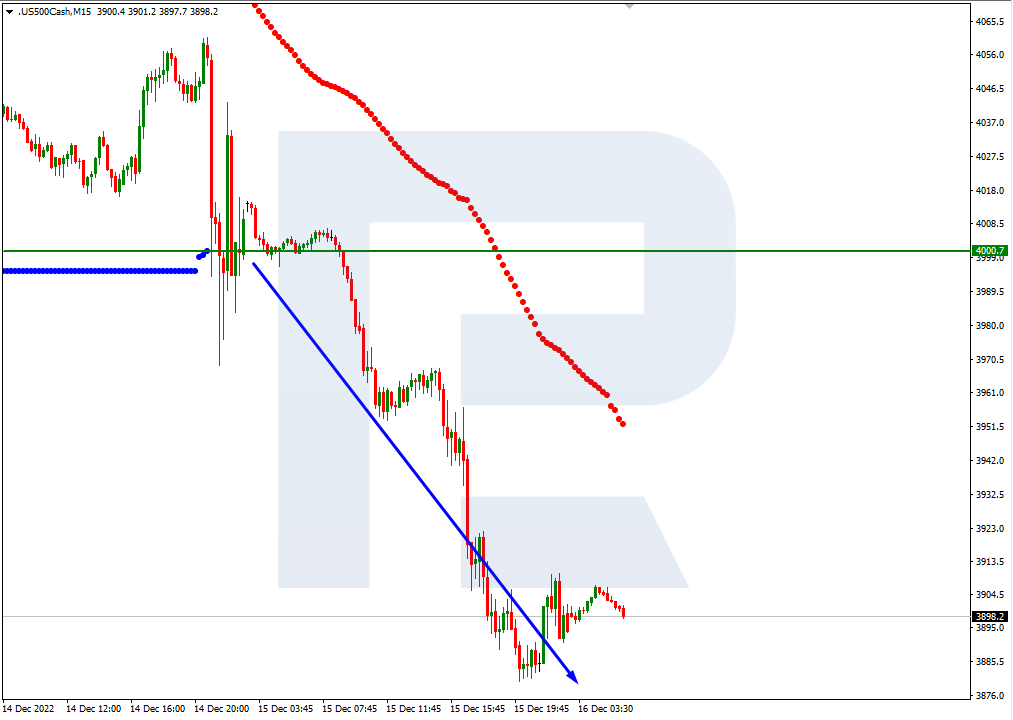
On M15, the lower line of VoltyChannel is broken away, which increases the probability of further price falling.

S&P 500_M15

Article By RoboForex.com

Attention!
Forecasts presented in this section only reflect the author’s private opinion and should not be considered as guidance for trading. RoboForex LP bears no responsibility for trading results based on trading recommendations described in these analytical reviews.

R StocksTrader Mobile Trading Platform by RoboMarkets Is Acknowledged as the Best of 2022

RoboMarkets, a European financial broker and developer of the R StocksTrader platform, proudly announces that its efforts have been acknowledged at the Professional Trader Awards event. The R StocksTrader mobile app was voted “Best Mobile Trading Platform-2022” globally. The winners were selected by the professional traders’ community.

The award winners companies were announced at a reception on 8 December 2022 in London. RoboMarkets has proudly earned the “Best Mobile Trading Platform” accolade for three consecutive years. This award is granted to the company that offers a top-tier mobile product to the market of professional trading accounts.

R StocksTrader is a brand-new trading platform, a powerful software for trading stocks and other financial instruments, featuring many added functions. The terminal makes available more than 12,000 trading instruments, allows for creating automated strategies, and more:

  • Access to the global markets from one platform
  • Minimal deposit of 100 USD
  • Leverage up to 1:20
  • 3,000 stocks and 8,000 CFDs to choose from

Denis Golomedov, Chief Marketing Officer at RoboMarkets, comments: “We are extremely excited to receive this award, and would like to thank everyone who voted for us. Since the very start, we have focused on providing cutting-edge services to our clients, and this award reflects the result of our efforts. Our R StocksTrader mobile app offers direct access to the global financial markets from your mobile gadget from anywhere in the world. The app contains over 12,000 trading instruments, handy watchlists, a built-in corporate events calendar, analytics, and more. We constantly update the app, implementing solutions that enhance the trading functions of the platform, and improve risk control. Our team is truly engaged in providing users with an unhindered, cutting-edge trading experience.”

The winners of the Professional Trader Awards were selected after a three-stage process. Firstly, in the four weeks from 5 through 30 September, applications were filed to the organising committee by the brokers themselves, nominating their companies for the chosen award. Next, the organisers polled professional traders, who voted for their preferred nominees. Lastly, the winners of the Professional Trader Awards 2022 were announced after the final calculation of the votes.

About RoboMarkets

RoboMarkets is an investment company, operating under CySEC licence No. 191/13. RoboMarkets offers investment services in European countries by providing access to its proprietary trading platforms to traders who work on financial markets. Find out more about the Company’s products and activities on www.robomarkets.com.

Why One Fund Owns 13% of This Small-Cap Pharma

Source: Streetwise Reports  (12/12/22)

Clinical-stage Algernon Pharmaceuticals’ multiple pipelines include testing a psychedelic for the treatment of stroke, and testing other drugs for idiopathic pulmonary fibrosis and chronic kidney disease.

Clinical-stage drug development company Algernon Pharmaceuticals Inc. (AGN:CSE; AGNPF:OTCQB; AGN0:XFRA) has multiple drugs in its pipeline and has garnered the support of AlphaNorth Asset Management, which now holds approximately 13% of the firm’s shares.

Why has the firm taken such a large position? AlphaNorth President and CEO Steve Palmer explained in a recent episode of Streetwise Live!: “We like it primarily because of the valuation. It’s quite cheap. Currently, the value of the whole company is CA$6–7 million. We also like it because they have multiple programs; I like companies like have multiple shots on goal, so to speak. And the trials that they are conducting are also lower risk than the typical biotech because they are using drugs that are already known to be safe.”

Analyst Andre Uddin with Research Capital Corporation follows the company and notes that Algernon has an “in-depth pipeline based on its novel repurposing drug development strategy.” He has calculated a CA$10.25/share target price on the company, an implied fourfold return based on the current share price of CA$2.78.

Multiple Pipelines

Algernon is about to begin testing the psychedelic compound DMT (N, N-dimethyltryptamine) for ischemic stroke, the type of stroke caused by blood clots blocking the flow of blood in the brain. The current treatment, tPA, must be administered within about three hours of the start of symptoms to be effective, a threshold that a large proportion of stroke victims don’t meet.

“The trials that they are conducting are also lower risk than the typical biotech,” said Steve Palmer of AlphaNorth Asset Management

The company has commenced screening subjects for the Phase 1 clinical study that will be conducted at the Centre for Human Drug Research in The Netherlands and expects to dose the first subject soon. Up to 60 healthy volunteers are expected to participate.

Algernon notes that the purpose of the study is to identify the “safety, tolerability, and pharmacokinetics of DMT when administered as an intravenous bolus followed by a prolonged infusion, for durations which have never been studied clinically. In addition, several pharmacodynamic measures believed to be associated with neuroplasticity, including both measurements of biochemical markers and electroencephalographic readings, will be recorded.”

“The potential of a stroke treatment drug is enormous,” Christopher Moreau, CEO of Algernon, stated. “On the human side, for approximately 85% of ischemic stroke patients, there is no treatment except to watch and hope. And on the market side, it is estimated to become a US$15 billion market by 2027, and so it’s truly global in scale and would have a huge impact on patients who suffer from this terrible injury.”

The company noted that its decision to investigate DMT and move it into human trials for stroke is “based on multiple independent, positive preclinical studies demonstrating that DMT, at a sub-psychedelic dose, helps promote structural and functional neuroplasticity. These are key factors involved in the brain’s ability to form and reorganize synaptic connections, which are needed for healing following a brain injury.”

Research Capital Corp. analyst Andre Uddin noted, “We believe AGN’s best asset is ifenprodil.”

“The preclinical data shows that DMT promotes the production of brain-derived neurotrophic factor, which is an important part of the brain’s recovery process after an injury like a stroke,” Moreau stated.

Because other Phase 1 studies have been completed on DMT, the company is not expecting any serious adverse events.

Algernon is also looking into DMT for additional indications. In late October, the company announced that it has entered into a clinical trial agreement with Yale University School of Medicine, New Haven, Conn., for the use of DMT in a Phase 2 depression study. “Although the treatment of psychiatric disorders with DMT [is] not the company’s current focus, we have patents pending on novel forms of DMT which could potentially be used across a broad range of diseases,” stated Moreau. “In addition, we believe the data generated from this study may help inform Algernon’s stroke research program.”

Orphan Drug Status for Ifenprodil for IPF

Algernon has received from the U.S. Food and Drug Administration Orphan Drug designation for Ifenprodil for the treatment of idiopathic pulmonary fibrosis (IPF). Orphan drug status is conferred on diseases that affect fewer than 200,000 patients in the U.S. and provides tax credits for trials and an exemption from user fees. If the drug receives FDA approval, seven years of market exclusivity are granted.

“We appreciate the U.S. FDA’s decision to grant ODD status to Ifenprodil for IPF, a disease for which prognosis remains dismal, with 50% mortality expected within three to four years,” said Moreau. “This regulatory milestone comes at an important time in the development of Ifenprodil as a potential new therapy for IPF as we plan the next steps for our clinical program.”

Technical analyst Clive Maund of CliveMaund.com recently charted Algernon’s stock and rated the stock a Buy.

Algernon’s Phase 2a study of Ifenprodil in patients recently concluded and met its co-primary endpoint “with patients receiving Ifenprodil experiencing no worsening of their lung function, and significant improvements were seen in the frequency of their IPF-associated cough as well. In addition, improvements in patient-reported measures of cough severity and quality of life were observed. Ifenprodil was also confirmed to be safe and well-tolerated in the study.”

Research Capital Corp. analyst Andre Uddin noted, “We believe AGN’s best asset is ifenprodil for treating refractory chronic cough (RCC) in idiopathic fibrosis (IPF)/IPF patients. . . Based on the positive Phase 2a data, we expect management to advance its 3x per day formulation of ifenprodil and initiate a Phase 2b trial in chronic cough H2 CY2023. A data set from a Phase 2b chronic cough trial would potentially be a large value-creating inflection point.”

Catalyst: Company Will Begin Testing For Chronic Kidney Disease Drug

The company plans to begin testing repirinast, a drug sold for 25 years in Japan for asthma, for chronic kidney disease. Analyst Uddin noted that Algernon “expects to begin conducting a Phase 1 study using repirinast to treat CKD in calendar year Q2 2023.”

Analysts and Expert Coverage

Technical analyst Clive Maund of CliveMaund.com recently charted Algernon’s stock and rated the stock a Buy. He wrote in October that “those interested should aim to buy it as soon as possible.”

of The National Investor also commented on the stock in a September post, saying that he considered the company an Immediate Buy.

The stock is also covered by analyst Dr. André Uddin of Research Capital Corp. and newsletter writers of The National Inflation Association, of 321gold.com, and of Pennyqueen.com. 

Click “See More Live Data” in the data box above to read more of what they are saying.

Ownership and Share Structure

AlphaNorth Asset Management is Algernon’s largest shareholder owning 13.46% of Algernon’s shares.

Algernon has approximately 2.3 million shares outstanding and 3.6 million fully diluted. It trades on the Canadian Securities Exchange under the ticker AGN and under the ticker AGNPF on the U.S. OTCQB platform.

Sign up for our FREE newsletter

Disclosures:
1) Patrice Fusillo wrote this article for Streetwise Reports LLC and provides services to Streetwise Reports as an independent contractor.  She or members of her household own securities of the following companies mentioned in the article: None. She or members of her household are paid by the following companies mentioned in this article: None.

2) The following companies mentioned in this article are billboard sponsors of Streetwise Reports: Algernon Pharmaceuticals Inc. Click here for important disclosures about sponsor fees. As of the date of this article, an affiliate of Streetwise Reports has a consulting relationship with Algernon Pharmaceuticals Inc. Please click here for more information.

3) Comments and opinions expressed are those of the specific experts and not of Streetwise Reports or its officers. The information provided above is for informational purposes only and is not a recommendation to buy or sell any security.

4) The article does not constitute investment advice. Each reader is encouraged to consult with his or her individual financial professional and any action a reader takes as a result of information presented here is his or her own responsibility. By opening this page, each reader accepts and agrees to Streetwise Reports’ terms of use and full legal disclaimer. This article is not a solicitation for investment. Streetwise Reports does not render general or specific investment advice and the information on Streetwise Reports should not be considered a recommendation to buy or sell any security. Streetwise Reports does not endorse or recommend the business, products, services or securities of any company mentioned on Streetwise Reports.

5) From time to time, Streetwise Reports LLC and its directors, officers, employees or members of their families, as well as persons interviewed for articles and interviews on the site, may have a long or short position in securities mentioned. Directors, officers, employees or members of their immediate families are prohibited from making purchases and/or sales of those securities in the open market or otherwise from the time of the decision to publish an article until three business days after the publication of the article. The foregoing prohibition does not apply to articles that in substance only restate previously published company releases. As of the date of this article, officers and/or employees of Streetwise Reports LLC (including members of their household) own securities of Algernon Pharmaceuticals Inc., a company mentioned in this article.

6) This article does not constitute medical advice. Officers, employees and contributors to Streetwise Reports are not licensed medical professionals. Readers should always contact their healthcare professionals for medical advice.

Research Capital Corporation disclosures:

1. This Issuer has generated investment banking revenue for RCC.

Analyst Certification
I, Andre Uddin, Ph.D., certify the views expressed in this report were formed by my review of relevant company data and industry investigation, and accurately reflect my opinion about the investment merits of the securities mentioned in the report. I also certify that my compensation is not related to specific recommendations or views expressed in this report. Research Capital Corporation publishes research and investment recommendations for the use of its clients. Information regarding our categories of recommendations, quarterly summaries of the percentage of our recommendations which fall into each category and our policies regarding the release of our research reports is available at www.researchcapital.com or may be requested by contacting the analyst. Each analyst of Research Capital Corporation whose name appears in this report hereby certifies that (i) the recommendations and opinions expressed in this research report accurately reflect the analyst’s personal views and (ii) no part of the research analyst’s compensation was or will be directly or indirectly related to the specific conclusions or recommendations expressed in this research report.

CliveMaund.com disclosures:

Clive Maund has not been paid by the company and does not own shares of Algernon.