Archive for Stock Market News – Page 32

Banking crises rooted in a system that rewards excessive risk-taking – as First Republic’s precarious situation shows

By Alexandra Digby, University of Rochester; Dollie Davis, Minerva Schools at KGI, and Robson Hiroshi Hatsukami Morgan, Minerva Schools at KGI 

First Republic Bank is on the brink of collapse, a victim of the panic that has roiled small and midsize banks since the failure of Silicon Valley Bank in March 2023.

Should First Republic fail, it would underscore how the impact of risky decisions at one bank can quickly spread into the broader financial system. It should also provide the impetus for policymakers and regulators to address a systemic problem that has plagued the banking industry from the savings and loan crisis of the 1980s to the financial crisis of 2008 to the recent turmoil following SVB’s demise: incentive structures that encourage excessive risk-taking.

The Federal Reserve’s top regulator seems to agree. On April 28, 2023, the central bank’s vice chair for supervision delivered a stinging report on the collapse of Silicon Valley Bank, blaming its failures on its weak risk management, as well as supervisory missteps.

We are professors of economics who study and teach the history of financial crises. In each of the financial upheavals since the 1980s, the common denominator was risk. Banks provided incentives that encouraged executives to take big risks to boost profits, with few consequences if their bets turned bad. In other words, all carrot and no stick.

One question we are grappling with now is what can be done to keep history from repeating itself and threatening the banking system, economy and jobs of everyday people.

S&L crisis sets the stage

The precursor to the banking crises of the 21st century was the savings and loan crisis of the 1980s.

The so-called S&L crisis, like the collapse of SVB, began in a rapidly changing interest rate environment. Savings and loan banks, also known as thrifts, provided home loans at attractive interest rates. When the Federal Reserve under Chairman Paul Volcker aggressively raised rates in the late 1970s to fight raging inflation, S&Ls were suddenly earning less on fixed-rate mortgages while having to pay higher interest to attract depositors. At one point, their losses topped US$100 billion.

To help the teetering banks, the federal government deregulated the thrift industry, allowing S&Ls to expand beyond home loans to commercial real estate. S&L executives were often paid based on the size of their institutions’ assets, and they aggressively lent to commercial real estate projects, taking on riskier loans to grow their loan portfolios quickly.

In the late 1980s, the commercial real estate boom turned bust. S&Ls, burdened by bad loans, failed in droves, requiring the federal government take over banks and delinquent commercial properties and sell the assets to recover money paid to insured depositors. Ultimately, the bailout cost taxpayers more than $100 billion.

Short-term incentives

The 2008 crisis is another obvious example of incentive structures that encourage risky strategies.

At all levels of mortgage financing – from Main Street lenders to Wall Street investment firms – executives prospered by taking excessive risks and passing them to someone else. Lenders passed mortgages made to people who could not afford them onto Wall Street firms, which in turn bundled those into securities to sell to investors. It all came crashing down when the housing bubble burst, followed by a wave of foreclosures.

Incentives rewarded short-term performance, and executives responded by taking bigger risks for immediate gains. At the Wall Street investment banks Bear Stearns and Lehman Brothers, profits grew as the firms bundled increasingly risky loans into mortgage-backed securities to sell, buy and hold.

As foreclosures spread, the value of these securities plummeted, and Bear Stearns collapsed in early 2008, providing the spark of the financial crisis. Lehman failed in September of that year, paralyzing the global financial system and plunging the U.S. economy into the worst recession since the Great Depression.

Executives at the banks, however, had already cashed in, and none were held accountable. Researchers at Harvard University estimated that top executive teams at Bear Stearns and Lehman pocketed a combined $2.4 billion in cash bonuses and stock sales from 2000 to 2008.

A familiar ring

That brings us back to Silicon Valley Bank.

Executives tied up the bank’s assets in long-term Treasury and mortgage-backed securities, failing to protect against rising interest rates that would undermine the value of these assets. The interest rate risk was particularly acute for SVB, since a large share of depositors were startups, whose finances depend on investors’ access to cheap money.

When the Fed began raising interest rates last year, SVB was doubly exposed. As startups’ fundraising slowed, they withdrew money, which required SVB to sell long-term holdings at a loss to cover the withdrawals. When the extent of SVB’s losses became known, depositors lost trust, spurring a run that ended with SVB’s collapse.

For executives, however, there was little downside in discounting or even ignoring the risk of rising rates. The cash bonus of SVB CEO Greg Becker more than doubled to $3 million in 2021 from $1.4 million in 2017, lifting his total earnings to $10 million, up 60% from four years earlier. Becker also sold nearly $30 million in stock over the past two years, including some $3.6 million in the days leading up to his bank’s failure.

The impact of the failure was not contained to SVB. Share prices of many midsize banks tumbled. Another American bank, Signature, collapsed days after SVB did.

First Republic survived after it was rescued by a consortium of major banks led by JPMorgan Chase, but the damage was already done. First Republic recently reported that depositors withdrew more than $100 billion in the six weeks following SVB’s collapse, and now it appears that it could soon fail too.

The crisis isn’t over yet. Banks had over $620 billion in unrealized losses at the end of 2022, largely due to rapidly rising interest rates.

The big picture

So, what’s to be done?

We believe the bipartisan bill recently filed in Congress, the Failed Bank Executives Clawback, would be a good start. In the event of a bank failure, the legislation would empower regulators to claw back compensation received by bank executives in the five-year period preceding the failure.

Clawbacks, however, kick in only after the fact. To prevent risky behavior, regulators could require executive compensation to prioritize long-term performance over short-term gains. And new rules could restrict the ability of bank executives to take the money and run, including requiring executives to hold substantial portions of their stock and options until they retire.

The Fed’s new report on what led to SVB’s failure points in this direction. The 102-page report recommends new limits on executive compensation, saying leaders “were not compensated to manage the bank’s risk,” as well as stronger stress-testing and higher liquidity requirements.

We believe these are also good steps, but probably not enough.

It comes down to this: Financial crises are less likely to happen if banks and bank executives consider the interest of the entire banking system, not just themselves, their institutions and shareholders.The Conversation

About the Authors:

Alexandra Digby, Adjunct Assistant professor of Economics, University of Rochester; Dollie Davis, Associate Dean of Faculty, Minerva Schools at KGI, and Robson Hiroshi Hatsukami Morgan, Assistant Professor of Social Sciences, Minerva Schools at KGI

This article is republished from The Conversation under a Creative Commons license. Read the original article.

Calm before storm: Is a 10% market correction on the horizon?

By George Prior 

Investors should brace for a 10% market correction over the next few weeks, warns the CEO and founder of one of the world’s largest independent financial advisory, asset management and fintech organizations.

The warning from deVere Group’s Nigel Green comes as major central banks continue their battle to try and tame inflation and differing signals from stock and bond markets.

He says: “We expect the US Federal Reserve will raise interest rates once again at its upcoming May meeting; the Bank of England’s chief economist has hinted at a further interest rate rise next month; and a half-point interest rate increase can’t be ruled out for the European Central Bank’s meeting next week according to Executive Board member Isabel Schnabel.

“This is likely to cause jitters in the market as some investors, concerned about short-term profits, will move into panic-selling mode.

“Furthermore, they will have legitimate concerns that further rate hikes now – when monetary policy time lags are notoriously long – could steer economies into a recession.

“The time lag in monetary policies is very high. Economists estimate interest rate changes take up to 18 months to have the full effect. This means monetary policymakers need to try and predict the state of the economy for up to 18 months ahead.

“With inflation seemingly having peaked, central banks are slowly winning the battle and officials now need to take their foot of the brake.”

Stock markets are currently calm and enjoying a month-long rally. This suggests that confidence in the outlook for profits and dividends growth is returning. And yet core major bond markets continue to be marked by inverted yield curves, which suggest recession is ahead.

“We’ve seen solid gains on all the major stock markets, over the last month. Fear of a further crisis in the financial system has subsided, and investor risk appetite has returned,” notes Nigel Green.

“In addition, stock market volatility has fallen, with the VIX index of implied volatility on the S&P500 at 17.8, near an 18-month low.

“Investors appear to be seeing beyond the current interest rate cycle, and its likely impact on company earnings, and looking ahead to the next upswing in the economic cycle.”

He continues: “In contrast, the bond market is very much focused on the interest rate cycle, with yield curves inverted in the US, UK and Eurozone. Longer term lending rates are below the overnight rates set by central banks.

“This reflects fear that the final rounds of interest rate hikes, from the major central banks this spring and summer, may tip economies into recession.

“The IMF, never an organisation to be glass half full, recently supplied a number of arguments as to why recession might occur. They included reduced real wages (because of inflation), low investment spending, and the need for governments to repair their finances after Covid-era deficits.”

The deVere group CEO goes on to add: “This huge disconnect between stocks and bonds suggests that investors should brace themselves for significant volatility in global financial markets over the next few weeks. We could see a 10% correction.”

He concludes: “We expect that we’re currently in the ‘calm before the storm’ phase.

“That said, a market correction is a natural part of the market cycle and can present major buying opportunities for long-term investors who are willing to weather short-term volatility.”

About:

deVere Group is one of the world’s largest independent advisors of specialist global financial solutions to international, local mass affluent, and high-net-worth clients.  It has a network of more than 70 offices across the world, over 80,000 clients and $12bn under advisement.

Nasdaq bears making a comeback?

By ForexTime

The Nasdaq 100 on the daily timeframe was in an uptrend that continued until a last higher top formed at 13242.2 on 4 April. Bears then saw an opportunity and started testing a weekly support level.

Bulls could not hold their own and bears broke through the weekly support now turned resistance level. The 15 and 34 Simple Moving Averages (SMA) and the Momentum Oscillator changed course to the downside as well, confirming the possible change in market momentum.  

A possible critical support level formed when a lower bottom was recorded on 25 April at 12723.6. The bulls might try to drive the price back through the weekly resistance level in a bid to gain supremacy again but that remains to be seen.

If the Nasdaq 100 breaks through the critical support level at 12723.6, three possible price targets can be calculated from there. Attaching the Fibonacci tool to the lower bottom at 12723.6 and dragging it to a lower top that formed on 18 April at 13207.2, the following targets can be determined. The first target may be estimated at 12424.7 (161.8%). The second price target might be expected at 11941.1 (261.8%) and if bears manage to break through a weekly support level, then the third and final target might be estimated at 11158.7 (423.6%).

If the resistance level at 13207.2 is broken, the current scenario is no longer reasonable and must be reassessed.

As long as the bears continue to direct the market, the outlook for the Nasdaq 100 market on the D1 time frame will remain to the downside.


Forex-Time-LogoArticle by ForexTime

ForexTime Ltd (FXTM) is an award winning international online forex broker regulated by CySEC 185/12 www.forextime.com

What are stock buybacks, which critics are blaming for hastening Bed Bath & Beyond’s bankruptcy? A finance professor explains

By D. Brian Blank, Mississippi State University 

Bed Bath & Beyond filed for bankruptcy on April 23, 2023, and some analysts are blaming the billions of dollars the retailer spent on share buybacks as one of the reasons for its downfall. In total, the company has spent nearly US$12 billion buying back its own stock since 2005, including $1 billion in 2021 alone – cash that could have potentially helped stave off bankruptcy.

Bed Bath & Beyond is hardly alone in snapping up its own stock. Companies have been buying back record amounts of their own shares in recent years, which prompted President Joe Biden to propose quadrupling the tax on buybacks to 4%.

But what are stock buybacks, and why do some people consider them to be a bad thing? The Conversation tapped D. Brian Blank, who studies company financial decision-making at Mississippi State University, to fill us in.

1. What are stock buybacks?

Before we can answer that question, first we need to understand the basics of how stock works.

Stock represents an ownership interest in a company, such that stockholders have a stake in the business. Companies use stock as one way to raise capital by selling their shares to investors, usually in an initial public offering.

Most stockholders, however, obtain stock by buying it on a secondary market, like the New York Stock Exchange. In this case, one person chooses to sell their ownership in the company, while another person buys it.

As partial owners, shareholders see the value of their stock rise when the company does well.

One way investors can benefit from holding the stock is that some corporations pay dividends, which are payments made directly to shareholders. Another way that stockholders can benefit is by selling the stock for more than they paid for it. Together, this creates a return on investment.

And this brings us to share buybacks – and why investors like them.

2. Why do companies buy back their own stock?

When companies have extra capital, they might go into the secondary market and buy back stock from investors. This is often referred to as a stock repurchase or buyback program. Companies that are older and less focused on rapid growth tend to do them more often.

Companies do this for a variety of reasons, such as because they think their shares are undervalued and want to signal optimism to Wall Street, or because they simply want another way to distribute profits to shareholders – a key goal of any companyother than through dividends.

Shareholders like buybacks because companies often pay a premium over market price. And when companies buy their own stock, this removes those shares from the market, which has the effect of lifting share prices as supply goes down, benefiting existing stockholders.

It’s estimated that American companies bought back a record $1 trillion of their own stock in 2022. And Apple is the biggest user of buybacks, having spent $557 billion over the past decade repurchasing its own shares.

3. Why do Biden and others dislike buybacks?

Critics like Biden contend that share buybacks represent short-term thinking that doesn’t actually create any real value. They argue instead that companies should use more of their profits to invest in more productive activities like business operations, innovation or employees.

Returning money that a company makes to stockholders does mean less capital is available for other investments. In his speech, Biden specifically called out “Big Oil” companies for using the record profits they’ve earned from high energy prices to buy back their stock rather than investing in new wells to increase supply – and help reduce gas prices.

But the decision whether to invest to increase domestic production is a complicated one. For example, the reason companies aren’t investing in new wells right now is not simply because they are buying back stock. The reason has more to do with how oil companies, and their shareholders, don’t think it is profitable to invest in more supply for a whole host of reasons, including the global push for greener energy by both policymakers and consumers, which is bound to reduce demand for fossil fuels in the future.

It’s also worth noting that while share repurchases are becoming increasingly common and controversial, they remain very similar to dividends, which don’t prompt the same concerns among politicians.

4. Would increasing the tax result in fewer buybacks?

The 1% tax on buybacks is actually brand new.

Congress passed the tax in 2022 as part of the Inflation Reduction Act. It took effect at the beginning of 2023 and only affects buyback programs of $1 million or more.

Usually when an activity is taxed, it happens less frequently. So, I expect the tax to nudge companies to spend less on buybacks and more elsewhere. While politicians intend more of the money to be used to invest in their productive capacity, companies may simply spend more on paying shareholders dividends.

Since the tax is new, it’s hard to evaluate its actual impact. Companies reportedly accelerated their repurchase programs in 2022 to avoid paying the tax.

But early data from 2023 suggests the 1% tax isn’t significantly deterring buybacks. Companies announced $132 billion in buybacks in January, three times as much as a year earlier and the most for the month on record.

Biden’s proposal to boost the tax to 4% may alter corporate behavior more. But again, it may just lead to greater dividend payments, not the other types of investments he and others hope for.

In addition, given that Republicans control the House, and Democrats have only a narrow majority in the Senate, this proposal has little chance of becoming law anytime soon.

The reasons why large corporations make the decisions they do about where to allocate capital – whether to build a factory, hire more workers or buy back stock – are complicated and, in my view, never taken lightly. These decisions have many facets and implications, and are not necessarily bad. I believe this is something worth remembering the next time you hear politicians sayingcorporations should do the right thing.”

This is an updated version of an article originally published on Feb. 10, 2023.The Conversation

About the Author:

D. Brian Blank, Assistant Professor of Finance, Mississippi State University

This article is republished from The Conversation under a Creative Commons license. Read the original article.

Big tech earnings: tech surprisingly robust – here’s why

By George Prior

The Big Tech titans are reporting earnings this week and the sector remains “surprisingly robust” for three key reasons, affirms the CEO of one of the world’s largest independent financial advisory, asset management and fintech organizations.

The analysis from deVere Group’s Nigel Green comes as Microsoft and Alphabet (parent company of Google) report on Tuesday, Meta (parent company of Facebook, Instagram and Whatsapp) report Wednesday, and Amazon on Thursday.

He says: “Five tech companies have made up two-thirds of the S&P 500’s gains this year, so global investors are watching carefully the earnings reports of Big Tech this week.

“Of course, not all the titans will have performed to the same level, however, in general terms, tech remains surprisingly robust.

“Despite the sharp rise in the cost of capital over the last year, tech and other growth sectors have shared in the broader stock market gains since the start of the year.

“This is surprising to many market analysts.

“A rise in interest rates is often associated with weakness in growth stocks, as investors favour money market funds and other products that benefit from rate hikes.

“While some of the not-yet-profitable tech companies have been hit by this effect, in aggregate the quoted tech sector looks resilient.”

A combination of factors is probably at work, according to the deVere CEO.

“First, the largest US tech stocks sit on large cash piles, reducing their need to borrow money to fund investment and growth.

“Second, falls in bond yields over the last six weeks, triggered by the Silicon Valley Bank crisis, have helped reduce funding costs for smaller growth companies.

“Third, in an era of weaker long-term GDP growth, investors may be searching out -and willing to pay a premium for- the sectors that will show earnings growth.”

Indeed, investor confidence in the sector remains strong.

Despite last year’s share price falls, the trailing price-earnings ratio on the NASDAQ index of US tech stocks is currently 25 times. This is down from the pandemic-era peak of 29 at the end of 2021, but it is still well above the 21 times at the end of March 2020.

On Monday, Nigel Green said in a media statement that investors around the world will be looking for three main factors from the tech giants this reporting season.

“Guidance will be critical as indicators show the economy is headed for a downturn and investors will be eager to know which companies are best-positioned to manage this.”
Guidance helps evaluate a company’s past performance in light of its future prospects.

“Cost-cutting measures and their efficacy will be poured over too. Have the recent mass lay-offs, following the mass hiring spree during and post Covid had an impact on the bottom line?”

“Plus, the AI (artificial intelligence) race will be closely monitored by investors.”

He concludes: “The total market cap of the top six tech companies in the US is an estimated $7 trillion. It’s a hugely critical sector and, as such, it’s surprising robustness will cheer markets and global investors.”

About:

deVere Group is one of the world’s largest independent advisors of specialist global financial solutions to international, local mass affluent, and high-net-worth clients.  It has a network of more than 70 offices across the world, over 80,000 clients and $12bn under advisement.

Big Tech earnings out this week – what investors are looking for

By George Prior 

With Microsoft, Alphabet, Amazon and Meta all reporting their earnings this week, investors around the world are switching their attention from banks to Big Tech, says the CEO of one of the world’s largest independent financial advisory, asset management and fintech organizations.

The comments from Nigel Green, chief executive and founder of deVere Group, come as US stock futures dropped slightly on Sunday night, and European markets are expected to open flat, as investors prepare for corporate earnings reports from mega-cap tech titans.

He says: “Many of the tech giants spent 2022 ‘cleaning house’ and getting rid of factors weighing on earnings, so we expect to see some positive reports this week.

“The earnings will highlight which companies have been able to maintain margin. In this environment of higher rates for longer than had previously been anticipated, some companies have found it difficult to maintain margin, others have done well.

“But due to the difficult work done last year, Big Tech is likely to provide some decent earnings.”

There are three main factors that investors will be looking for, says Nigel Green.

“Guidance will be critical as indicators show the economy is headed for a downturn and investors will be eager to know which companies are best-positioned to manage this. Guidance helps evaluate a company’s past performance in light of its future prospects.

“Cost-cutting measures and their efficacy will be poured over too. Have the recent mass lay-offs, following the mass hiring spree during and post Covid had an impact on the bottom line?”

“Plus, the AI (artificial intelligence) race will be closely monitored by investors.”

Only two months after its launch in late November, ChatGPT had 100 million monthly active users in January. To put this into context, it took Instagram two and a half years to get to 100 million.

“Therefore, the pressure is on for all tech titans to ramp up their AI divisions.”

This week is a big week and the halfway point in earnings season.

The deVere CEO concludes: “Just five tech companies have made up two-thirds of the S&P 500’s gains this year.  Needless to say, all eyes are on Big Tech earnings this week.”

About:

deVere Group is one of the world’s largest independent advisors of specialist global financial solutions to international, local mass affluent, and high-net-worth clients.  It has a network of more than 70 offices across the world, over 80,000 clients and $12bn under advisement.

Stock indices remain under pressure from high rates

By JustMarkets

At the close of the stock market on Friday, the Dow Jones Index (US30) gained 0.06% (-0.32% for the week), while the S&P 500 (US500) added 0.09% (-0.25% for the week). The Technology Index NASDAQ (US100) gained 0.11% on Friday (-0.30% for the week). Stock indices remain under pressure from high rates. The US Federal Reserve is 90% likely to raise interest rates by 0.25% at its May meeting. As of April 21, 18% of companies in the S&P 500 Index reported actual results for Q1 2023, of which 63% reported actual earnings above estimates. Many important US macro statistics will be released this week, and the tech giants (AAPL, MSFT, GOOGL, AMZN, META) will also report, which will be a key test for the stock market. Investors have gravitated toward tech stocks this year, believing that the Fed will soon stop raising interest rates and that the sector will remain resilient as growth slows. Reports will show if this is true.

Ray Dalio, a founder of Bridgewater Associates, warned of the risk of rising debt burdens and rising interest rates, putting the economy on the verge of a recession that will make things much more difficult in the next year or two. According to Dalio, debts will grow so much that central banks will have to buy them out.

Stock markets in Europe were mostly up on Friday. German DAX (DE30) gained 0.54% (+0.27% for the week), French CAC 40 (FR40) gained 0.51% on Friday (+0.55% for the week), Spanish IBEX 35 Index (ES35) decreased by 0.37% (+0.30% for the week), British FTSE 100 (UK100) was up by 0.15% (+0.54% for the week).

Most ECB Governing Council officials remain concerned about the risks of rising inflation and intend to raise rates further. Concerns about the banking sector have forced the ECB to adopt a more cautious tone in its communications, but recently those concerns seem to have receded. Another rate hike at the May meeting looks like a done deal, but the size of the move remains an open question. Market pricing is leaning toward a 25 basis point rate hike. But another inflation report and GDP data will be released before the May meeting. Also, some prominent European banks are due to report earnings this week, including UBS, Deutsche Bank, Santander, and Barclays. The first quarter has been very turbulent for banks after the collapse of two regional US lenders last month and the dramatic takeover of Credit Suisse by rival UBS. As a result, the value of European banks fell by nearly $180 billion at one point. The sector has since recovered, but its value is still $70 billion less than before the collapse.

UK consumer confidence rose from 49 to 30. The latest report showed that investors should not expect a quick recovery in retail activity, but given other economic data (labor market, inflation, GDP, manufacturing activity), the UK economy is likely to avoid a technical recession in the first half of the year. The Bank of England is preparing for another 25 basis point rate hike.

Oil prices fell about 5.5% last week, the worst five-day decline since mid-March. But analysts still believe oil prices will rebound ahead of the summer as demand rises and supply may fall short, given that crude inventories are low and OPEC+ announced a surprise cut last month amid waning global growth prospects. If WTI crude oil prices fall to $75 or below again, it could cause OPEC+ to be unhappy again. The need for oil at or above $80 is crucial to OPEC+.

Asian markets were mostly down last week. Japan’s Nikkei 225 (JP225) added 0.09% for the week, China’s FTSE China A50 (CHA50) decreased by 0.41% for the week, Hong Kong’s Hang Seng (HK50) was down by 1.47% for the week, India’s NIFTY 50 (IND50) lost 0.05%, and Australia’s S&P/ASX 200 (AU200) fell by 0.42% for the week.

In 2023, China and other emerging markets in Asia saw the biggest drop in export growth due to weakening global demand. When economies reopened, trade growth began to slow. The pandemic led to a skew in consumption of goods, which has now shifted toward demand for services.

The new governor of the Bank of Japan, Kazuo Ueda, will hold his first monetary policy meeting on Friday, and while analysts do not expect any changes to the central bank’s ultra-blunt monetary policy, traders should be prepared for surprises. Inflation in Japan is ahead of estimates, but Ueda’s comments in recent weeks suggest that stimulus parameters remain appropriate for now.

The G7 countries are considering an almost total ban on exports to Russia. Former Russian President Dmitry Medvedev said Sunday that if the G7 decided to ban exports to Russia, Moscow would respond by canceling the Black Sea Grain deal, which allows the export of vital grain from Ukraine.

In the commodities market, futures on platinum (+8.28%), palladium (+7.06%), and natural gas (+5.01%) showed the biggest gains last week. Futures on gasoline futures (-8.21%), corn (-7.77%), lumber (-6.8%), WTI oil (-5.54%), Brent oil (-5.28%), soybeans (-3.57%), cotton (-3.29%) and copper (-2.97%) showed the biggest drop.

S&P 500 (F) (US500) 4,133.52 +3.73 (+0.090%)

Dow Jones (US30)33,808.96 +22.34 (+0.066%)

DAX (DE40) 15,881.66 +85.69 (+0.54%)

FTSE 100 (UK100) 7,914.13 +11.52 (+0.15%)

USD Index 101.72 -0.12 (-0.11%)

Important events for today:
  • – Singapore Consumer Price Index (m/m) at 08:00 (GMT+3);
  • – German Ifo Business Climate (m/m) at 11:00 (GMT+3);
  • – Canada Wholesale Sales (m/m) at 15:30 (GMT+3).

By JustMarkets


This article reflects a personal opinion and should not be interpreted as an investment advice, and/or offer, and/or a persistent request for carrying out financial transactions, and/or a guarantee, and/or a forecast of future events.

COT Stock Market Charts: Weekly Speculator Changes led by the Nasdaq-Mini & MSCI EAFE-Mini 

By InvestMacro

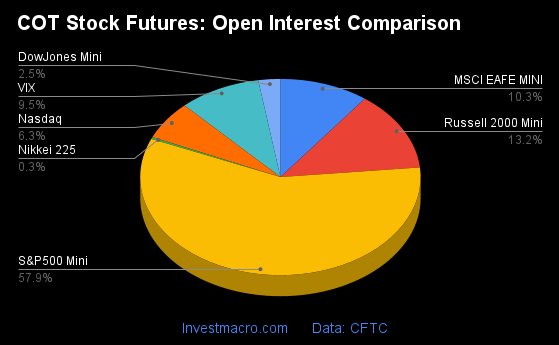
Here are the latest charts and statistics for the Commitment of Traders (COT) data published by the Commodities Futures Trading Commission (CFTC).

The latest COT data is updated through Tuesday April 18th and shows a quick view of how large traders (for-profit speculators and commercial entities) were positioned in the futures markets.

Weekly Speculator Changes led by the Nasdaq-Mini & MSCI EAFE-Mini
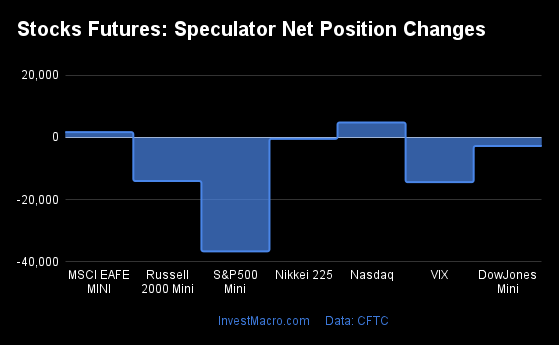
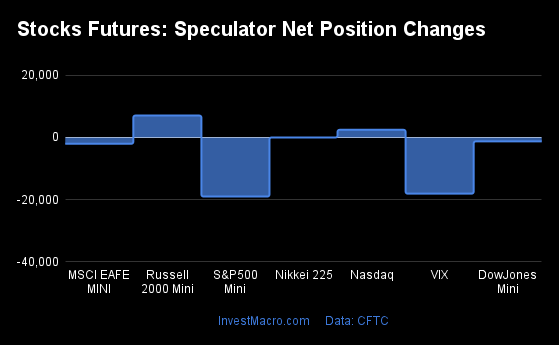
The COT stock markets speculator bets were lower this week as two out of the seven stock markets we cover had higher positioning while the other five markets had lower speculator contracts.

Leading the gains for the stock markets was the Nasdaq-Mini (4,803 contracts) with MSCI EAFE-Mini (1,708 contracts) also having a positive week.

The markets with the declines in speculator bets this week were the S&P500-Mini (-36,645 contracts) with the VIX (-14,395 contracts), Russell-Mini (-14,031 contracts), DowJones-Mini (-2,751 contracts) and the Nikkei 225 (-442 contracts) also registering lower bets on the week.


Data Snapshot of Stock Market Traders | Columns Legend
Apr-18-2023OIOI-IndexSpec-NetSpec-IndexCom-NetCOM-IndexSmalls-NetSmalls-Index
S&P500-Mini2,278,32121-344,2570359,83098-15,57324
Nikkei 22511,7164-2,556611,555401,00141
Nasdaq-Mini245,059382,673776,41730-9,09036
DowJones-Mini96,06157-24,3971129,34593-4,94820
VIX391,65485-63,7616965,59028-1,82987
Nikkei 225 Yen42,204256,6105414,39050-21,00036


Strength Scores led by Nasdaq-Mini & VIX
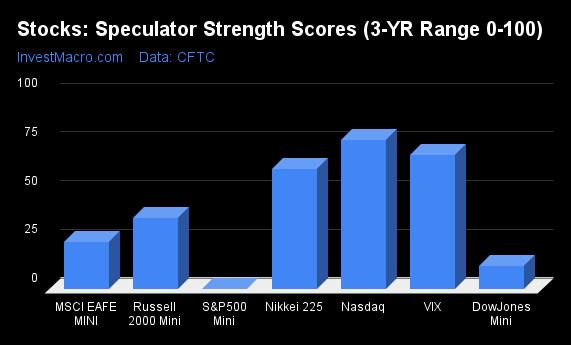
COT Strength Scores (a normalized measure of Speculator positions over a 3-Year range, from 0 to 100 where above 80 is Extreme-Bullish and below 20 is Extreme-Bearish) showed that the Nasdaq-Mini (77 percent) and the VIX (69 percent) lead the stock markets this week. The Nikkei 225 (61 percent) and Nikkei 225 Yen (54 percent) come in as the next highest in the weekly strength scores.

On the downside, the S&P500-Mini (0 percent) and the DowJones-Mini (11 percent) come in at the lowest strength level currently and are in Extreme-Bearish territory (below 20 percent).

Strength Statistics:
VIX (69.0 percent) vs VIX previous week (78.9 percent)
S&P500-Mini (0.0 percent) vs S&P500-Mini previous week (6.3 percent)
DowJones-Mini (11.5 percent) vs DowJones-Mini previous week (18.7 percent)
Nasdaq-Mini (76.5 percent) vs Nasdaq-Mini previous week (73.8 percent)
Russell2000-Mini (36.5 percent) vs Russell2000-Mini previous week (44.9 percent)
Nikkei USD (61.4 percent) vs Nikkei USD previous week (63.8 percent)
EAFE-Mini (23.9 percent) vs EAFE-Mini previous week (21.8 percent)


Nasdaq-Mini & Nikkei 225 top the 6-Week Strength Trends
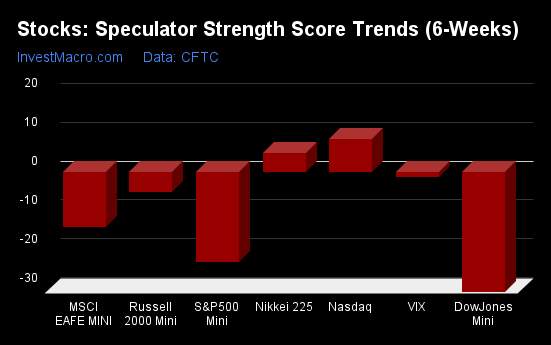
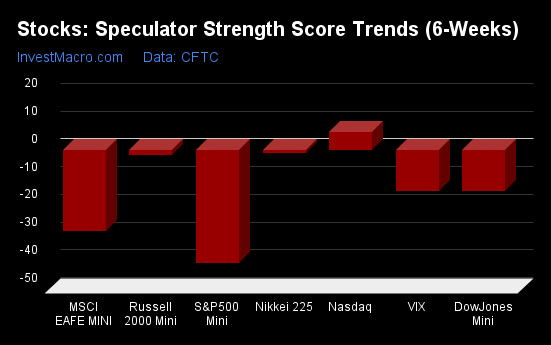
COT Strength Score Trends (or move index, calculates the 6-week changes in strength scores) showed that the Nasdaq-Mini (8 percent) leads the past six weeks trends for the stock markets. The Nikkei 225 (5 percent) is the next highest positive mover in the latest trends data.

The Nikkei 225 Yen (-42 percent) leads the downside trend scores currently with the DowJones-Mini (-31 percent) coming in as the next market with lower trend scores.

Strength Trend Statistics:
VIX (-1.3 percent) vs VIX previous week (4.1 percent)
S&P500-Mini (-23.2 percent) vs S&P500-Mini previous week (-21.3 percent)
DowJones-Mini (-30.8 percent) vs DowJones-Mini previous week (-14.9 percent)
Nasdaq-Mini (8.4 percent) vs Nasdaq-Mini previous week (12.1 percent)
Russell2000-Mini (-5.2 percent) vs Russell2000-Mini previous week (-1.4 percent)
Nikkei USD (4.8 percent) vs Nikkei USD previous week (-0.6 percent)
EAFE-Mini (-14.1 percent) vs EAFE-Mini previous week (-7.1 percent)


Individual Stock Market Charts:

VIX Volatility Futures:

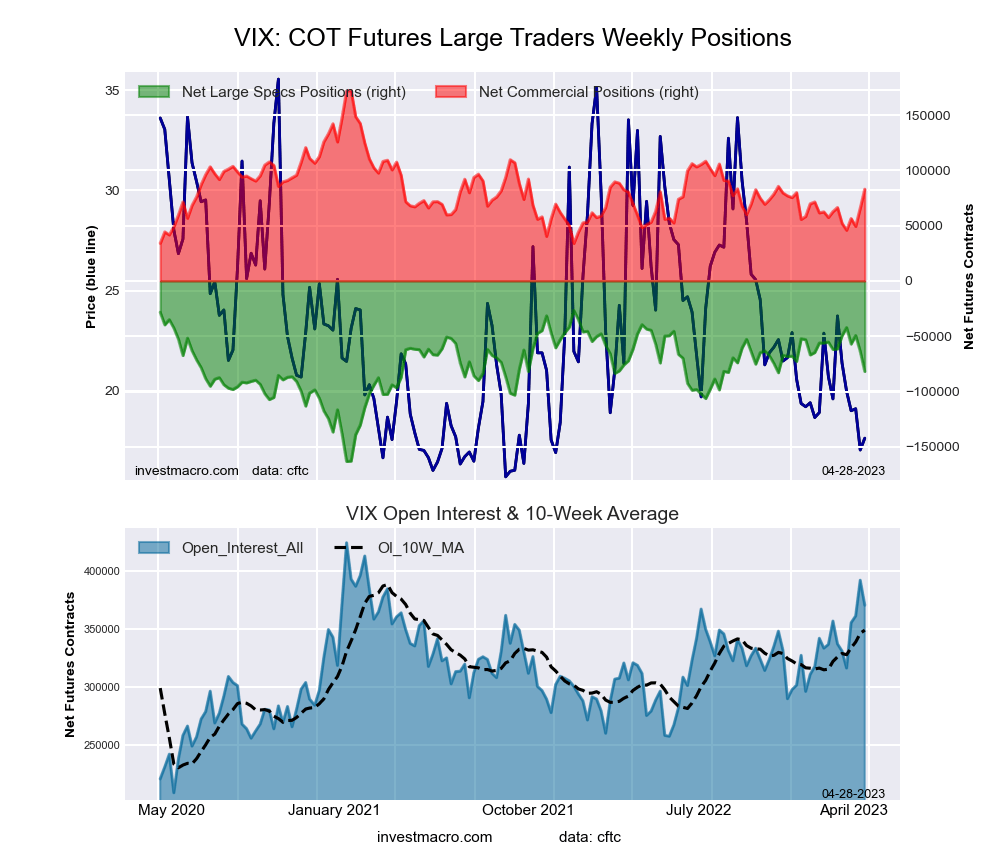
VIX Volatility Futures COT ChartThe VIX Volatility large speculator standing this week resulted in a net position of -63,761 contracts in the data reported through Tuesday. This was a weekly fall of -14,395 contracts from the previous week which had a total of -49,366 net contracts.

This week’s current strength score (the trader positioning range over the past three years, measured from 0 to 100) shows the speculators are currently Bullish with a score of 69.0 percent. The commercials are Bearish with a score of 27.5 percent and the small traders (not shown in chart) are Bullish-Extreme with a score of 86.5 percent.

VIX Volatility Futures StatisticsSPECULATORSCOMMERCIALSSMALL TRADERS
– Percent of Open Interest Longs:20.353.66.6
– Percent of Open Interest Shorts:36.636.97.1
– Net Position:-63,76165,590-1,829
– Gross Longs:79,608210,03025,841
– Gross Shorts:143,369144,44027,670
– Long to Short Ratio:0.6 to 11.5 to 10.9 to 1
NET POSITION TREND:
– Strength Index Score (3 Year Range Pct):69.027.586.5
– Strength Index Reading (3 Year Range):BullishBearishBullish-Extreme
NET POSITION MOVEMENT INDEX:
– 6-Week Change in Strength Index:-1.32.0-5.9


S&P500 Mini Futures:

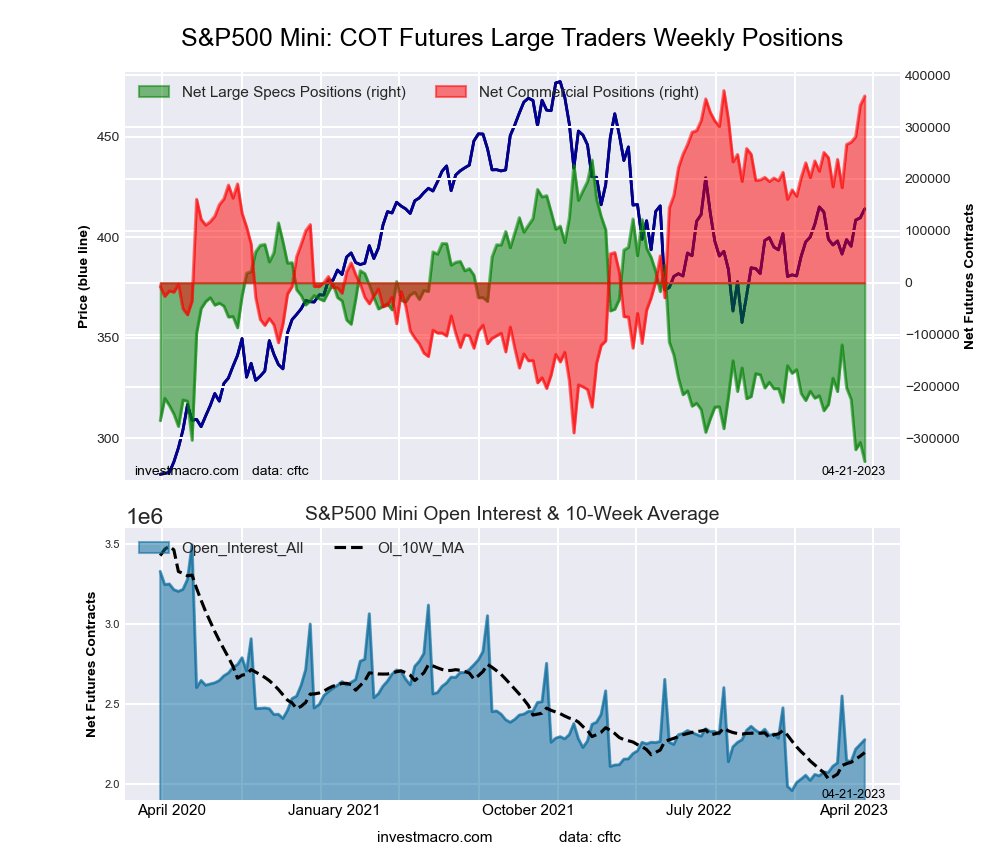
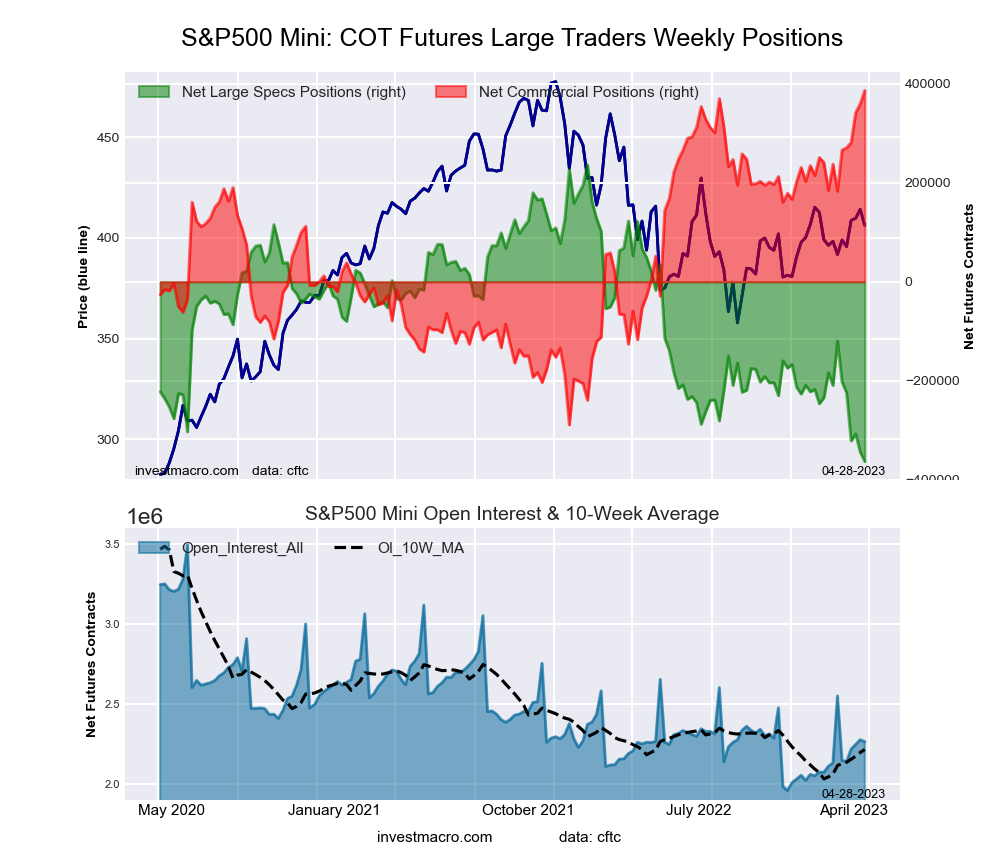
SP500 Mini Futures COT ChartThe S&P500 Mini large speculator standing this week resulted in a net position of -344,257 contracts in the data reported through Tuesday. This was a weekly lowering of -36,645 contracts from the previous week which had a total of -307,612 net contracts.

This week’s current strength score (the trader positioning range over the past three years, measured from 0 to 100) shows the speculators are currently Bearish-Extreme with a score of 0.0 percent. The commercials are Bullish-Extreme with a score of 98.4 percent and the small traders (not shown in chart) are Bearish with a score of 23.7 percent.

S&P500 Mini Futures StatisticsSPECULATORSCOMMERCIALSSMALL TRADERS
– Percent of Open Interest Longs:9.077.410.6
– Percent of Open Interest Shorts:24.161.611.3
– Net Position:-344,257359,830-15,573
– Gross Longs:204,5581,764,361241,651
– Gross Shorts:548,8151,404,531257,224
– Long to Short Ratio:0.4 to 11.3 to 10.9 to 1
NET POSITION TREND:
– Strength Index Score (3 Year Range Pct):0.098.423.7
– Strength Index Reading (3 Year Range):Bearish-ExtremeBullish-ExtremeBearish
NET POSITION MOVEMENT INDEX:
– 6-Week Change in Strength Index:-23.218.52.7


Dow Jones Mini Futures:

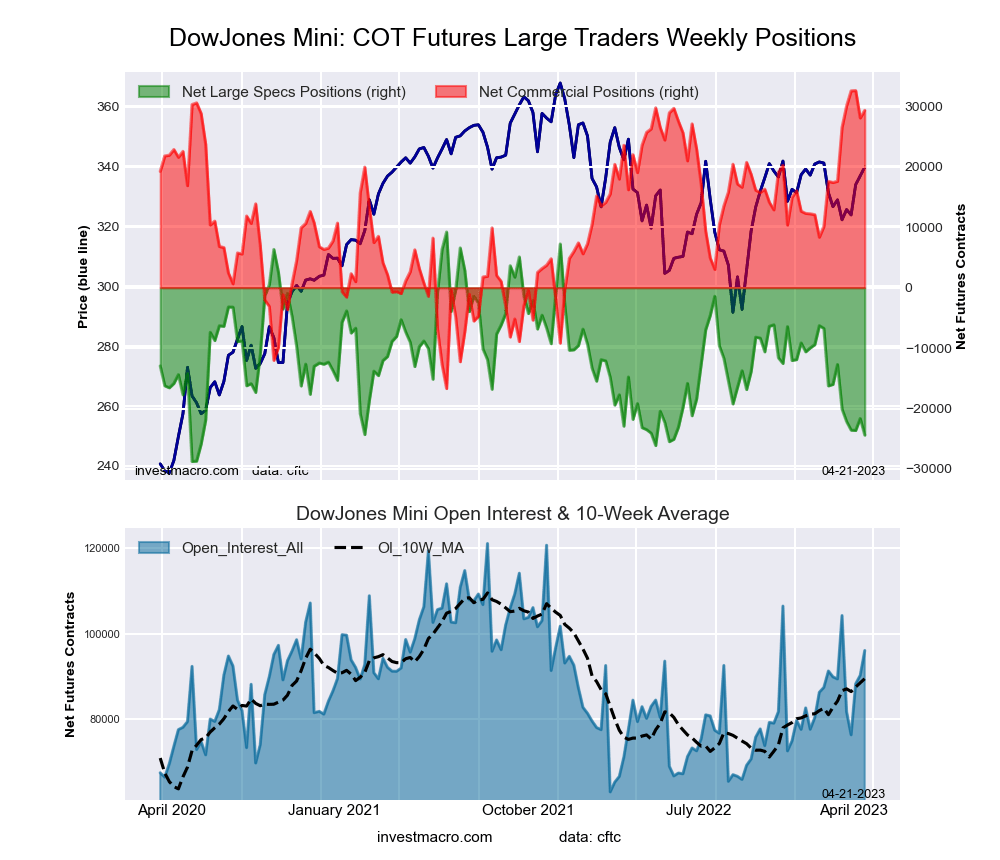
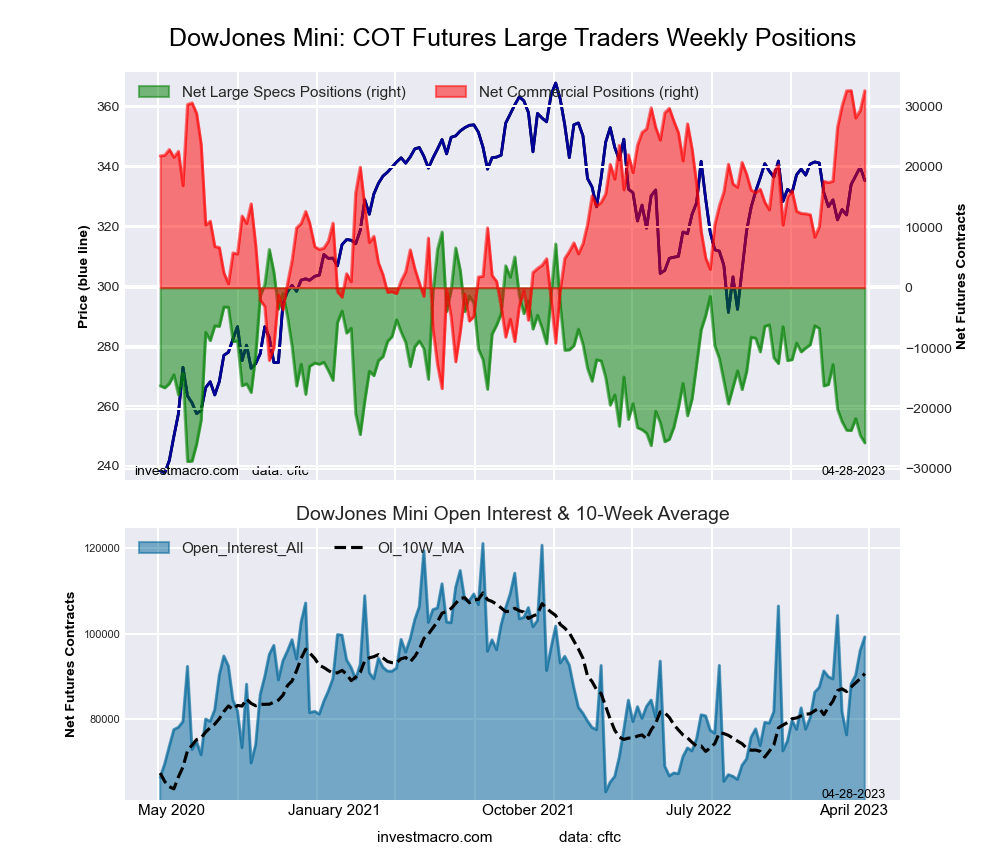
Dow Jones Mini Futures COT ChartThe Dow Jones Mini large speculator standing this week resulted in a net position of -24,397 contracts in the data reported through Tuesday. This was a weekly reduction of -2,751 contracts from the previous week which had a total of -21,646 net contracts.

This week’s current strength score (the trader positioning range over the past three years, measured from 0 to 100) shows the speculators are currently Bearish-Extreme with a score of 11.5 percent. The commercials are Bullish-Extreme with a score of 93.4 percent and the small traders (not shown in chart) are Bearish-Extreme with a score of 19.8 percent.

Dow Jones Mini Futures StatisticsSPECULATORSCOMMERCIALSSMALL TRADERS
– Percent of Open Interest Longs:19.766.912.7
– Percent of Open Interest Shorts:45.136.417.9
– Net Position:-24,39729,345-4,948
– Gross Longs:18,89664,30512,225
– Gross Shorts:43,29334,96017,173
– Long to Short Ratio:0.4 to 11.8 to 10.7 to 1
NET POSITION TREND:
– Strength Index Score (3 Year Range Pct):11.593.419.8
– Strength Index Reading (3 Year Range):Bearish-ExtremeBullish-ExtremeBearish-Extreme
NET POSITION MOVEMENT INDEX:
– 6-Week Change in Strength Index:-30.823.8-0.2


Nasdaq Mini Futures:

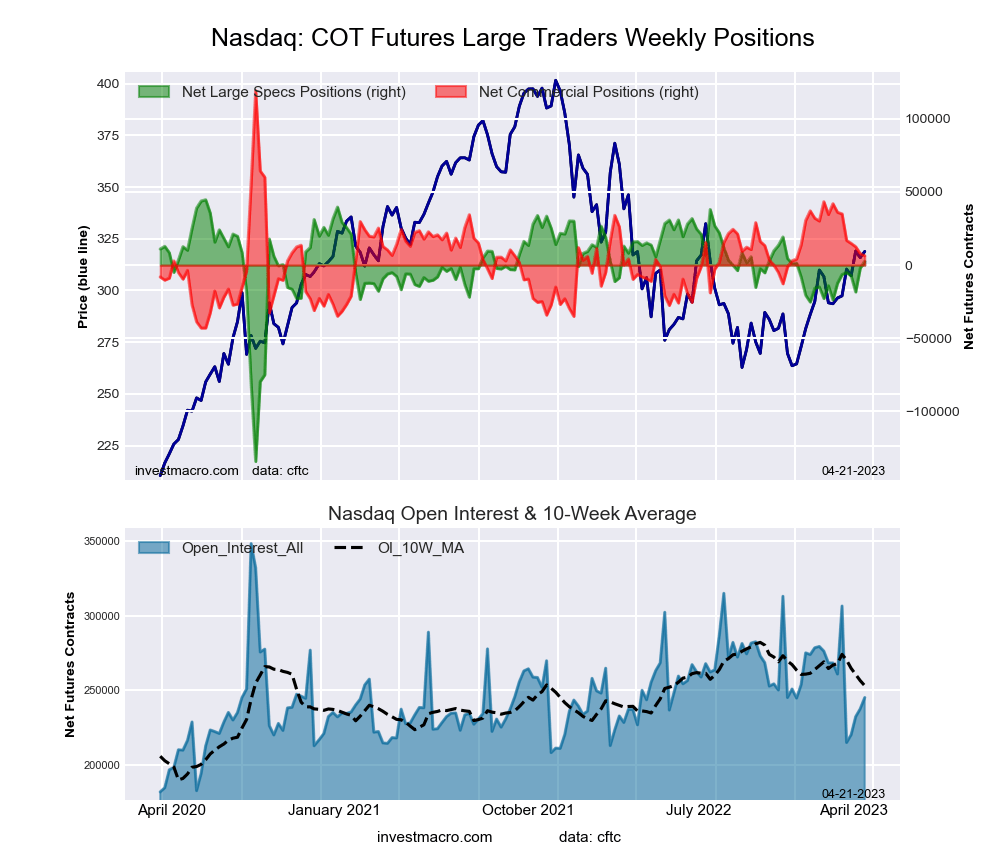
Nasdaq Mini Futures COT ChartThe Nasdaq Mini large speculator standing this week resulted in a net position of 2,673 contracts in the data reported through Tuesday. This was a weekly advance of 4,803 contracts from the previous week which had a total of -2,130 net contracts.

This week’s current strength score (the trader positioning range over the past three years, measured from 0 to 100) shows the speculators are currently Bullish with a score of 76.5 percent. The commercials are Bearish with a score of 30.4 percent and the small traders (not shown in chart) are Bearish with a score of 36.4 percent.

Nasdaq Mini Futures StatisticsSPECULATORSCOMMERCIALSSMALL TRADERS
– Percent of Open Interest Longs:24.060.114.3
– Percent of Open Interest Shorts:22.957.418.0
– Net Position:2,6736,417-9,090
– Gross Longs:58,753147,19135,128
– Gross Shorts:56,080140,77444,218
– Long to Short Ratio:1.0 to 11.0 to 10.8 to 1
NET POSITION TREND:
– Strength Index Score (3 Year Range Pct):76.530.436.4
– Strength Index Reading (3 Year Range):BullishBearishBearish
NET POSITION MOVEMENT INDEX:
– 6-Week Change in Strength Index:8.4-18.327.2


Russell 2000 Mini Futures:

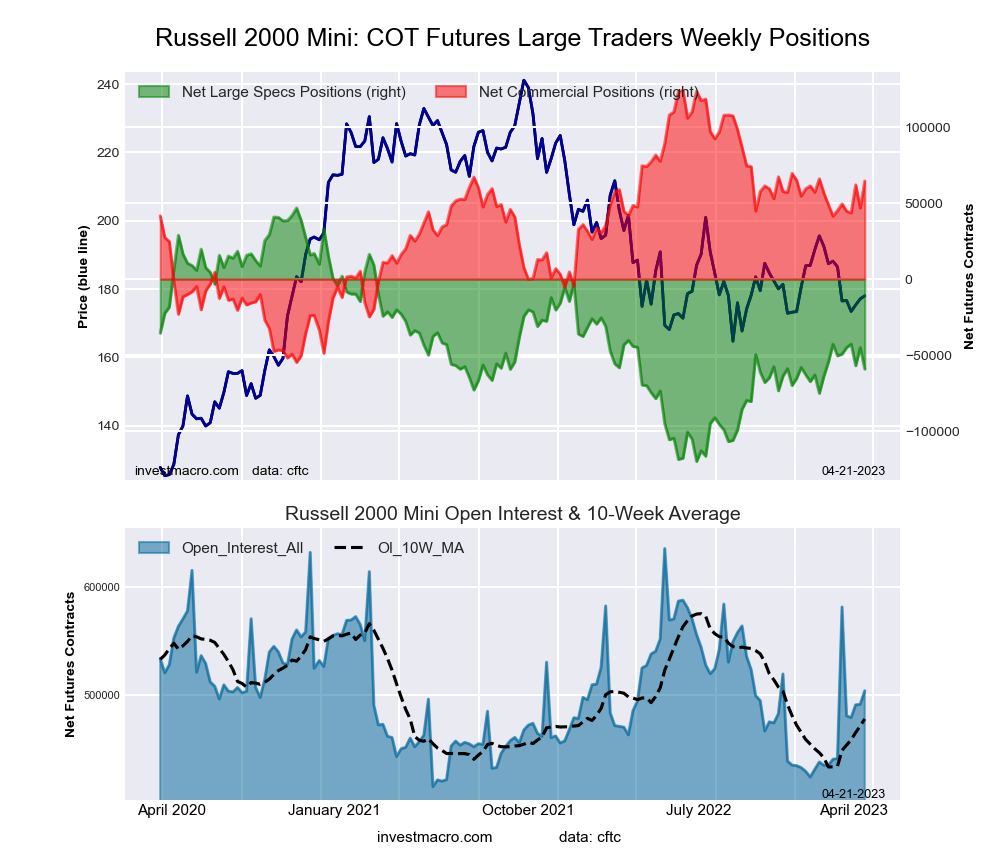
Russell 2000 Mini Futures COT ChartThe Russell 2000 Mini large speculator standing this week resulted in a net position of -59,162 contracts in the data reported through Tuesday. This was a weekly decline of -14,031 contracts from the previous week which had a total of -45,131 net contracts.

This week’s current strength score (the trader positioning range over the past three years, measured from 0 to 100) shows the speculators are currently Bearish with a score of 36.5 percent. The commercials are Bullish with a score of 66.7 percent and the small traders (not shown in chart) are Bearish-Extreme with a score of 10.1 percent.

Russell 2000 Mini Futures StatisticsSPECULATORSCOMMERCIALSSMALL TRADERS
– Percent of Open Interest Longs:10.383.94.1
– Percent of Open Interest Shorts:22.071.15.1
– Net Position:-59,16264,474-5,312
– Gross Longs:51,876422,60620,475
– Gross Shorts:111,038358,13225,787
– Long to Short Ratio:0.5 to 11.2 to 10.8 to 1
NET POSITION TREND:
– Strength Index Score (3 Year Range Pct):36.566.710.1
– Strength Index Reading (3 Year Range):BearishBullishBearish-Extreme
NET POSITION MOVEMENT INDEX:
– 6-Week Change in Strength Index:-5.210.8-33.1


Nikkei Stock Average (USD) Futures:

Nikkei Stock Average (USD) Futures COT ChartThe Nikkei Stock Average (USD) large speculator standing this week resulted in a net position of -2,556 contracts in the data reported through Tuesday. This was a weekly lowering of -442 contracts from the previous week which had a total of -2,114 net contracts.

This week’s current strength score (the trader positioning range over the past three years, measured from 0 to 100) shows the speculators are currently Bullish with a score of 61.4 percent. The commercials are Bearish with a score of 39.8 percent and the small traders (not shown in chart) are Bearish with a score of 40.9 percent.

Nikkei Stock Average Futures StatisticsSPECULATORSCOMMERCIALSSMALL TRADERS
– Percent of Open Interest Longs:18.348.633.0
– Percent of Open Interest Shorts:40.135.424.5
– Net Position:-2,5561,5551,001
– Gross Longs:2,1475,6973,872
– Gross Shorts:4,7034,1422,871
– Long to Short Ratio:0.5 to 11.4 to 11.3 to 1
NET POSITION TREND:
– Strength Index Score (3 Year Range Pct):61.439.840.9
– Strength Index Reading (3 Year Range):BullishBearishBearish
NET POSITION MOVEMENT INDEX:
– 6-Week Change in Strength Index:4.8-5.31.1


MSCI EAFE Mini Futures:

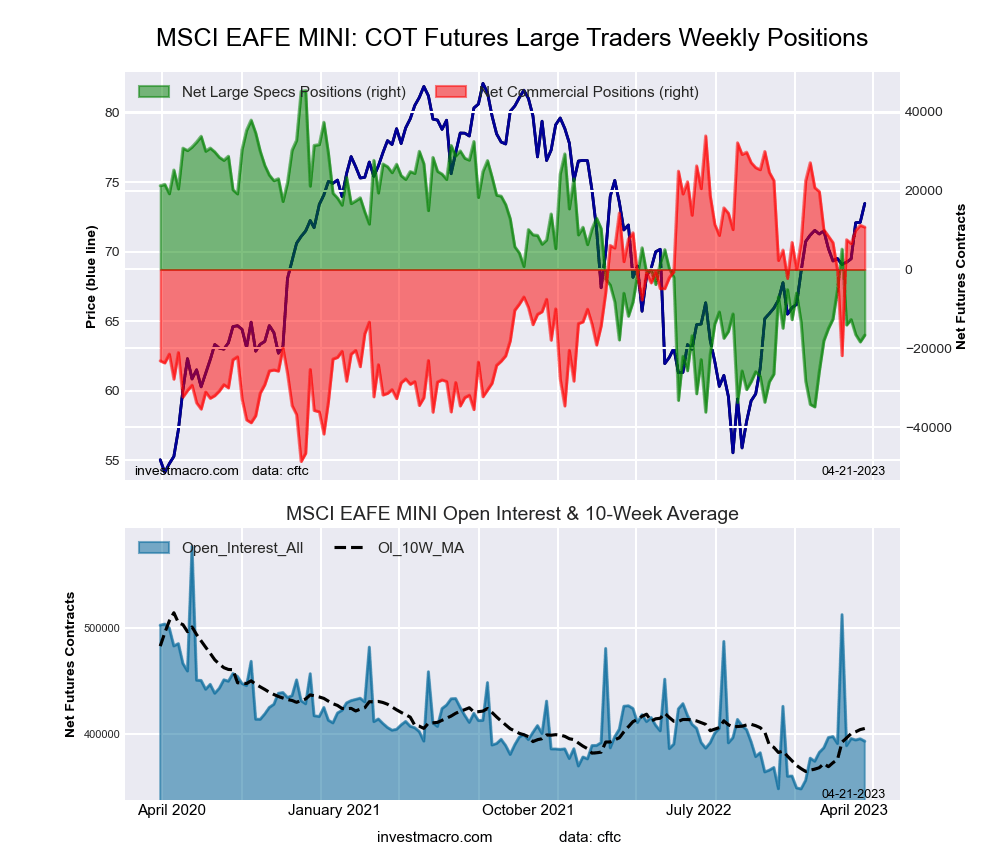
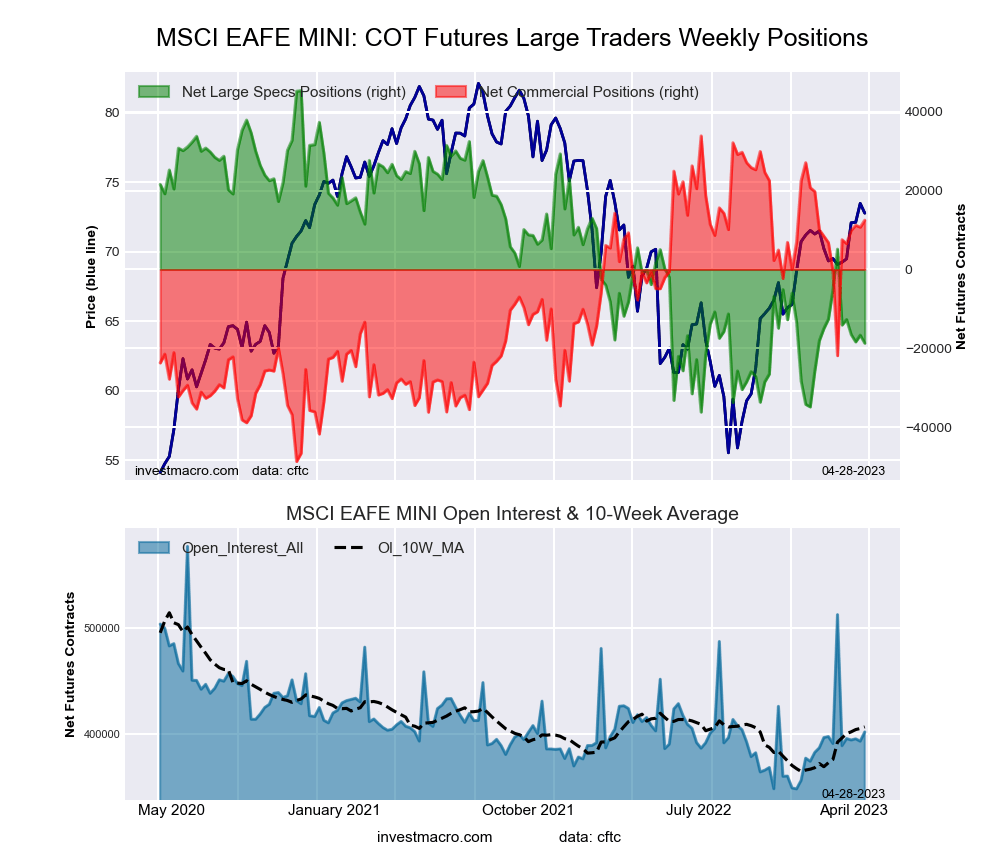
MSCI EAFE Mini Futures COT ChartThe MSCI EAFE Mini large speculator standing this week resulted in a net position of -16,652 contracts in the data reported through Tuesday. This was a weekly boost of 1,708 contracts from the previous week which had a total of -18,360 net contracts.

This week’s current strength score (the trader positioning range over the past three years, measured from 0 to 100) shows the speculators are currently Bearish with a score of 23.9 percent. The commercials are Bullish with a score of 72.0 percent and the small traders (not shown in chart) are Bearish with a score of 46.5 percent.

MSCI EAFE Mini Futures StatisticsSPECULATORSCOMMERCIALSSMALL TRADERS
– Percent of Open Interest Longs:7.689.12.8
– Percent of Open Interest Shorts:11.886.41.3
– Net Position:-16,65210,7315,921
– Gross Longs:29,950350,48811,085
– Gross Shorts:46,602339,7575,164
– Long to Short Ratio:0.6 to 11.0 to 12.1 to 1
NET POSITION TREND:
– Strength Index Score (3 Year Range Pct):23.972.046.5
– Strength Index Reading (3 Year Range):BearishBullishBearish
NET POSITION MOVEMENT INDEX:
– 6-Week Change in Strength Index:-14.113.52.0


Article By InvestMacroReceive our weekly COT Newsletter

*COT Report: The COT data, released weekly to the public each Friday, is updated through the most recent Tuesday (data is 3 days old) and shows a quick view of how large speculators or non-commercials (for-profit traders) were positioned in the futures markets.

The CFTC categorizes trader positions according to commercial hedgers (traders who use futures contracts for hedging as part of the business), non-commercials (large traders who speculate to realize trading profits) and nonreportable traders (usually small traders/speculators) as well as their open interest (contracts open in the market at time of reporting). See CFTC criteria here.

Week Ahead: “Big M.A.M.A.” to weigh on NQ100_m

By ForexTime

Four Big Tech companies, with a combined market cap of over US$ 5 trillion (that’s $5,000,000,000,000), are set to release their respective quarterly earnings in the coming week.

The final week of April also features these scheduled economic data releases and events:

Monday, April 24

  • EUR: Germany April IFO business climate
  • Walt Disney may cut thousands of jobs this week
  • Q1 earnings from embattled banks: Credit Suisse, First Republic Bank

Tuesday, April 25

  • USD: US April consumer confidence
  • NQ100_m: Microsoft, Alphabet Q1 earnings (after US markets close)

Wednesday, April 26

  • NZD: New Zealand March external trade
  • AUD: Australia March CPI
  • CAD: Bank of Canada releases April meeting minutes
  • NQ100_m: Meta Q1 earnings (after US markets close)

Thursday, April 27

  • EUR: Eurozone April economic confidence
  • USD: US 1Q GDP; weekly initial jobless claims
  • NQ100_m: Amazon Q1 earnings (after US markets close)

Friday, April 28

  • JPY: Bank of Japan rate decision; April Tokyo CPI; Japan March industrial production, retail sales, and unemployment
  • EUR: Eurozone 1Q GDP; Germany April CPI
  • USD: US March PCE Deflator, personal income and spending


How big is “Big M.A.M.A.”?

First, a quick reminder about the sheer size of these tech giants that are due to report their Q1 earnings.

Here’s their respective market cap as of US market’s close on Thursday, April 20:

(Market capitalization = how much each company is valued by the markets)

  • Microsoft: US$ 2.130 trillion
  • Alphabet: US$ 1.352 trillion
  • Amazon: US$ 1.064 trillion
  • Meta: US$ 0.5466 trillion


What to look out for from these Big Tech announcements?

  1. Economic headwinds dampening earnings?

Fears of a looming global recession are set to weigh negatively on the core businesses of these Big Tech companies:

  • Microsoft is already facing a structural slowdown in the PC industry
  • Alphabet’s ad business may see a pullback from customers in the financial sector from last month’s banking turmoil
  • Meta’s Facebook is experiencing weakening engagement
  • Amazon’s core business of selling goods across the US has lost money for the last 5 consecutive quarters

The challenging economic backdrop is also expected to be a drag on demand for cloud computing services out of Microsoft (Azure), Amazon (AWS), and Alphabet (Google Cloud) – which have been key earnings drivers for these respective companies.


  1. Job cuts: boost to the bottom line?

Here are the headline figures for the intended number of jobs to be slashed according to announcements made in Q1 2023:

  • Microsoft: 10,000 jobs (5% of its workforce)
  • Amazon: 18,000 jobs (1% of total employees)
  • Meta: 10,000 jobs (accumulated 25% of workforce, including the 11k jobs, or 13% of its workforce, already removed back in November 2022)
  • Alphabet: 12,000 jobs (6% of global workforce)

Ultimately, fundamentally-driven investors want to know whether such cost-cutting measures are having the desired effect of propping up the company’s financials amidst these challenging times.


  1. ChatGPT: the AI race is on

​​​​​​​The buzz surrounding ChatGPT/AI technologies have certainly contributed to the double-digit gains for Big Tech stocks so far in 2023.

Markets will be eager to find out how soon before the hype can turn into a profits boost, and whether each of these tech companies have enough of an edge in this red-hot AI race.


How much could these stocks move post-earnings?

Here are the forecasted moves for each stock, either upwards or downwards, on the trading day after their respective financial announcements:

  • Microsoft: 3.7% move on Wednesday, April 25th
  • Alphabet: 5.45% move on Wednesday, April 25th
  • Meta: 9% move on Thursday, April 27th
  • Amazon: 6.54% move on Friday, April 28th

(% figures as of Friday, April 21st before US markets open)


Why would NQ100_m react to these Big Tech earnings?

Note that every single one of these behemoths (Microsoft, Alphabet, Amazon, and Meta) are members of the tech-heavy index, the Nasdaq 100, which is the underlying asset tracked by the NQ100_m.

Their combined market cap of US$5.09 trillion accounts for one-third of the Nasdaq 100’s market cap of US$15.03 trillion.

Hence, the market’s collective reaction to these upcoming Big Tech earnings is set to have an outsized impact on how the NQ100_m performs in the final week of April.


How might NQ100_m react to Big Tech earnings?

  • Should markets react positively to these Big Tech earnings, that could send the NQ100_m above its month-to-date high at 13,242, and to a fresh 8-month peak.
  • However, disappointing earnings out of these tech giants may drag the NQ100_m to a lower low beneath the key 12850 support region.

    This price area also contains the 38.2% Fibonacci retracement level from NQ100_m’s November 2021 peak down to the October 2022 trough.


To be clear, the Nasdaq 100’s year-to-date advance still stands at an impressive 18.7% so far in 2023, despite the rally having stalled so far in April.

These tech giants could do with a fundamental boost by way of better-than-expected earnings to extend that advance in share prices before April is over.

Otherwise, tech stock bulls might have to wait until the Federal Reserve’s next policy meeting in early May.

A more dovish note out of the US central bank, perhaps indicating a pause on its rate hikes after its May FOMC meeting with perhaps an eye on lowering interest rates later in 2023, may just send stock market bulls racing once more and charging US stock indices higher.

On the other hand, a disappointing earnings season out of Big Tech next week, followed by still-hawkish signals out of the Fed in early May, would likely undo some of the NQ100_m’s year-to-date gains.


Forex-Time-LogoArticle by ForexTime

ForexTime Ltd (FXTM) is an award winning international online forex broker regulated by CySEC 185/12 www.forextime.com

Financial Advisors Take Heat for Market Losses (Will Anger Intensify?)

Was 2022 an aberration for the 60/40 allocation?

By Elliott Wave International

Many financial advisors steer clients who are willing to take some risk toward a 60% stocks / 40% bonds portfolio.

Alas, investors who followed that strategy in 2022 saw the value of their portfolios decrease substantially.

In November, The Elliott Wave Theorist, a monthly publication which provides analysis of major financial and cultural trends, said:

Our long term bearish stance on stocks and bonds for 2022 is certainly panning out. In mid-October, [this] headline and chart, from Bank of America, made the rounds in the media:

The bond market was a big contributor to investors’ losses. The September 2020 issue of EWT depicted a 78-year cycle in 10-year U.S. Treasury note yields and concluded that after 39 years of rise and 39 years of fall, interest rates had just registered a historic bottom.

Since then, as you know, interest rates have risen substantially, which means bond prices have fallen.

Even today, many clients of financial advisors are still fuming (Marketwatch, April 4):

Investors are mad as hell at advisers …
With the S&P 500 down 18% in 2022 and bonds off, too, investor sentiment toward full-service investment firms dropped significantly from last year

Yet, there are some who suggest the 60/40 allocation is still worth considering, along with perhaps a few tweaks (Forbes, March 9):

The 60/40 Portfolio Is Not Dead; It’s Just Not Well-Balanced

As I write, the 60/40 strategy has performed better so far in 2023, but the remainder of the year is another matter.

Elliott wave analysis can be useful in helping you get a handle on what the remainder of 2023 holds for stocks and bonds.

If you’d like to learn how the Elliott wave method can help you analyze financial markets, read Frost & Prechter’s Wall Street best seller, Elliott Wave Principle: Key to Market Behavior. Here’s a quote from the book:

In markets, progress ultimately takes the form of five waves of a specific structure. Three of these waves, which are labeled 1, 3 and 5, actually effect the directional movement. They are separated by two countertrend interruptions, which are labeled 2 and 4. The two interruptions are apparently a requisite for overall directional movement to occur.

[R.N.] Elliott noted three consistent aspects of the five-wave form. They are: Wave 2 never moves beyond the start of wave 1; wave 3 is never the shortest wave; wave 4 never enters the price territory of wave 1.

… Elliott did not specifically say that there is only one overriding form, the “five-wave” pattern, but that is undeniably the case. At any time, the market may be identified as being somewhere in the basic five-wave pattern at the largest degree of trend. Because the five-wave pattern is the overriding form of market progress, all other patterns are subsumed by it.

Here’s some good news: You can read the entire online version of Elliott Wave Principle: Key to Market Behavior for free once you become a member of Club EWI, the world’s largest Elliott wave educational community (approximately 500,000 worldwide members).

A Club EWI membership is also free and allows for complimentary access to a wealth of Elliott wave resources (videos and articles) on investing and trading.

Join Club EWI now by following this link: Elliott Wave Principle: Key to Market Behavior.

This article was syndicated by Elliott Wave International and was originally published under the headline Financial Advisors Take Heat for Market Losses (Will Anger Intensify?). EWI is the world’s largest market forecasting firm. Its staff of full-time analysts led by Chartered Market Technician Robert Prechter provides 24-hour-a-day market analysis to institutional and private investors around the world.