The Jap225 index on the H4 time frame was in bullish territory from the beginning of May. However, bears did try to challenge their reign a few times but to no avail. This changed on 23 May when a last higher top formed at 31348. The bears got enough backing to start a shift in the market momentum.
A closer look at the Momentum Oscillator reveals a negative divergence between points “a” and “b” when comparing the tops at 30955 and 31348. This could have alerted technical traders that the bulls might be running out of steam.
Further confirmation of the increasing bearish presence in the market was displayed when the price broke through the 15 and 34 Simple Moving Averages with the Momentum Oscillator following suit by breaking through the 100 baselines into bearish terrain.
A possible critical support level formed when a lower bottom was recorded on 24 May at 30394.
If the bears manage to break through the critical support level at 30394, then three possible price targets can be set from there. Attaching the Fibonacci tool to the lower bottom at 30394 and dragging it to the resistance level at 31348, the following targets may be determined. The first target can be estimated at 30012 (161.8%). The second price target can be expected at 29822 (261.8%) and the third and final target can be estimated at 29440 (423.6%).
If the resistance level at 31348 is broken, the current scenario must be re-evaluated.
As long as the bears maintain the upper hand, the outlook for the Jap225 Index on the H4 time frame will remain bearish.
Artificial Intelligence-powered tools, such as ChatGPT, have the potential to revolutionize the efficiency, effectiveness and speed of the work humans do.
And this is true in financial markets as much as in sectors like health care, manufacturing and pretty much every other aspect of our lives.
I’ve been researching financial markets and algorithmic trading for 14 years. While AI offers lots of benefits, the growing use of these technologies in financial markets also points to potential perils. A look at Wall Street’s past efforts to speed up trading by embracing computers and AI offers important lessons on the implications of using them for decision-making.
Program trading fuels Black Monday
In the early 1980s, fueled by advancements in technology and financial innovations such as derivatives, institutional investors began using computer programs to execute trades based on predefined rules and algorithms. This helped them complete large trades quickly and efficiently.
Back then, these algorithms were relatively simple and were primarily used for so-called index arbitrage, which involves trying to profit from discrepancies between the price of a stock index – like the S&P 500 – and that of the stocks it’s composed of.
As technology advanced and more data became available, this kind of program trading became increasingly sophisticated, with algorithms able to analyze complex market data and execute trades based on a wide range of factors. These program traders continued to grow in number on the largey unregulated trading freeways – on which over a trillion dollars worth of assets change hands every day – causing market volatility to increase dramatically.
Eventually this resulted in the massive stock market crash in 1987 known as Black Monday. The Dow Jones Industrial Average suffered what was at the time the biggest percentage drop in its history, and the pain spread throughout the globe.
In response, regulatory authorities implemented a number of measures to restrict the use of program trading, including circuit breakers that halt trading when there are significant market swings and other limits. But despite these measures, program trading continued to grow in popularity in the years following the crash.
HFT: Program trading on steroids
Fast forward 15 years, to 2002, when the New York Stock Exchange introduced a fully automated trading system. As a result, program traders gave way to more sophisticated automations with much more advanced technology: High-frequency trading.
HFT uses computer programs to analyze market data and execute trades at extremely high speeds. Unlike program traders that bought and sold baskets of securities over time to take advantage of an arbitrage opportunity – a difference in price of similar securities that can be exploited for profit – high-frequency traders use powerful computers and high-speed networks to analyze market data and execute trades at lightning-fast speeds. High-frequency traders can conduct trades in approximately one 64-millionth of a second, compared with the several seconds it took traders in the 1980s.
These trades are typically very short term in nature and may involve buying and selling the same security multiple times in a matter of nanoseconds. AI algorithms analyze large amounts of data in real time and identify patterns and trends that are not immediately apparent to human traders. This helps traders make better decisions and execute trades at a faster pace than would be possible manually.
Another important application of AI in HFT is natural language processing, which involves analyzing and interpreting human language data such as news articles and social media posts. By analyzing this data, traders can gain valuable insights into market sentiment and adjust their trading strategies accordingly.
Benefits of AI trading
These AI-based, high-frequency traders operate very differently than people do.
The human brain is slow, inaccurate and forgetful. It is incapable of quick, high-precision, floating-point arithmetic needed for analyzing huge volumes of data for identifying trade signals. Computers are millions of times faster, with essentially infallible memory, perfect attention and limitless capability for analyzing large volumes of data in split milliseconds.
And, so, just like most technologies, HFT provides several benefits to stock markets.
These traders typically buy and sell assets at prices very close to the market price, which means they don’t charge investors high fees. This helps ensure that there are always buyers and sellers in the market, which in turn helps to stabilize prices and reduce the potential for sudden price swings.
High-frequency trading can also help to reduce the impact of market inefficiencies by quickly identifying and exploiting mispricing in the market. For example, HFT algorithms can detect when a particular stock is undervalued or overvalued and execute trades to take advantage of these discrepancies. By doing so, this kind of trading can help to correct market inefficiencies and ensure that assets are priced more accurately.
The downsides
But speed and efficiency can also cause harm.
HFT algorithms can react so quickly to news events and other market signals that they can cause sudden spikes or drops in asset prices.
Additionally, HFT financial firms are able to use their speed and technology to gain an unfair advantage over other traders, further distorting market signals. The volatility created by these extremely sophisticated AI-powered trading beasts led to the so-called flash crash in May 2010, when stocks plunged and then recovered in a matter of minutes – erasing and then restoring about $1 trillion in market value.
The speed and efficiency with which high-frequency traders analyze the data mean that even a small change in market conditions can trigger a large number of trades, leading to sudden price swings and increased volatility.
In addition, research I published with several other colleagues in 2021 shows that most high-frequency traders use similar algorithms, which increases the risk of market failure. That’s because as the number of these traders increases in the marketplace, the similarity in these algorithms can lead to similar trading decisions.
This means that all of the high-frequency traders might trade on the same side of the market if their algorithms release similar trading signals. That is, they all might try to sell in case of negative news or buy in case of positive news. If there is no one to take the other side of the trade, markets can fail.
Enter ChatGPT
That brings us to a new world of ChatGPT-powered trading algorithms and similar programs. They could take the problem of too many traders on the same side of a deal and make it even worse.
In general, humans, left to their own devices, will tend to make a diverse range of decisions. But if everyone’s deriving their decisions from a similar artificial intelligence, this can limit the diversity of opinion.
Consider an extreme, nonfinancial situation in which everyone depends on ChatGPT to decide on the best computer to buy. Consumers are already very prone to herding behavior, in which they tend to buy the same products and models. For example, reviews on Yelp, Amazon and so on motivate consumers to pick among a few top choices.
Since decisions made by the generative AI-powered chatbot are based on past training data, there would be a similarity in the decisions suggested by the chatbot. It is highly likely that ChatGPT would suggest the same brand and model to everyone. This might take herding to a whole new level and could lead to shortages in certain products and service as well as severe price spikes.
This becomes more problematic when the AI making the decisions is informed by biased and incorrect information. AI algorithms can reinforce existing biases when systems are trained on biased, old or limited data sets. And ChatGPT and similar tools have been criticized for making factual errors.
In addition, since market crashes are relatively rare, there isn’t much data on them. Since generative AIs depend on data training to learn, their lack of knowledge about them could make them more likely to happen.
For now, at least, it seems most banks won’t be allowing their employees to take advantage of ChatGPT and similar tools. Citigroup, Bank of America, Goldman Sachs and several other lenders have already banned their use on trading-room floors, citing privacy concerns.
But I strongly believe banks will eventually embrace generative AI, once they resolve concerns they have with it. The potential gains are too significant to pass up – and there’s a risk of being left behind by rivals.
But the risks to financial markets, the global economy and everyone are also great, so I hope they tread carefully.
Stock markets are buoyant on optimism that the US will raise its debt ceiling, avoiding a default and global economic fallout, but investors now need to avoid complacency, warns the CEO and founder of one of the world’s largest independent financial advisory, asset management and fintech organizations.
The warning from deVere Group’s Nigel Green comes as Wall Street’s S&P 500 index and the Nasdaq Composite both reached their highest levels since August 2022, up 0.9% and 1.5%, respectively, on Thursday.
Meanwhile, Asia-Pacific markets rose on Friday and European markets are set to do the same at the open. US futures are also ticking higher.
The deVere CEO says: “A huge sense of relief is sweeping across stock markets after US policymakers said that a bill to raise the debt ceiling in the world’s largest economy may be put to a vote next week, raising the possibility of a deal to avoid a government default and the serious global economic repercussions that would follow.
“The reports coming out of Washington help restore confidence, stability and certainty – which markets thrive on – as they indicate that the US government will continue to meet its financial commitments.”
He continues: “However, investors must avoid complacency.
“While stock markets are enjoying this wave of buoyancy, with investors appearing to be looking beyond the current interest rate cycle and ahead to the next upswing in the economic cycle, core major bond markets continue to be marked by inverted yield curves, which suggest a recession is looming.
“The inverted yield curve indicates a recession is ahead because it’s a sign of a tight credit market and weak economic growth. The inversion has preceded most US recessions – which, of course, have a huge drag on the global economy – since 1950.
“With this disconnect between stocks and bonds, investors should brace themselves for significant volatility in global financial markets over the next few weeks. We could see a 10% correction.”
deVere believes that four key sectors would be mostly resilient in a recession. These include commodities, such as oil, as their prices typically rise in response to inflation; consumer staples like food, and hygiene products, as demand is likely to remain relatively stable; healthcare, as it provides essential services that are less affected by economic cycles; and utilities, including electricity, gas, and water as demand will also be typically consistent.
“While a resolution of the debt ceiling crisis may provide a temporary relief rally, it doesn’t guarantee sustained market growth or shield against other market risks.
“Investors need to be alive to the real challenges potentially coming down the track that could hit their returns if their portfolios are not properly diversified.”
About:
deVere Group is one of the world’s largest independent advisors of specialist global financial solutions to international, local mass affluent, and high-net-worth clients. It has a network of more than 70 offices across the world, over 80,000 clients and $12bn under advisement.
At the close of trading yesterday, the Dow Jones Index (US30) decreased by 0.66%, while the S&P 500 (US500) fell by 0.17%. Technology Index NASDAQ (US100) gained 0.18% on Thursday. The US indices continued to decline yesterday due to ongoing problems at regional banks. PacWest Bancorp shares fell by 22% after reports that the bank’s deposits decreased by 9.5% in the week ended May 5, continuing fears of a deeper banking crisis.
Alphabet (GOOGL) rose for the second straight day as the tech giant’s announcement that it will incorporate artificial intelligence into products, including its search engine, drew positive reactions from investors. Falling Treasury bond yields are also supporting growth in those stocks. Shares of Robinhood Markets Inc (HOOD) were up by 6% on the report. The company reported first-quarter results that beat Wall Street estimates, driven by higher earnings from securities lending.
Deutsche Bank said it would buy Disney stock, expecting cost-cutting, growth in streaming advertising, and the company’s strong position in consumer-focused pricing to support profitability over the long term.
The US Treasury Secretary Janet Yellen urged Congress to raise the $31.4 trillion federal debt limit and prevent an unprecedented default that would trigger a global economic slowdown. For its part, the International Monetary Fund said Thursday that a US debt default triggered by a failure to raise the nation’s debt ceiling would have “very serious consequences” for the US economy as well as the global economy, including a likely increase in borrowing costs.
Equity markets in Europe traded flat Thursday. Germany’s DAX (DE30) fell by 0.39%, France’s CAC 40 (FR40) gained 0.28% yesterday, Spain’s IBEX 35 (ES35) added 0.19%, Britain’s FTSE 100 (UK100) closed lower by 0.14% Thursday.
European Central Bank Vice President Luis de Guindos on Thursday cited rising services prices as the main problem in the ECB’s fight against inflation, saying higher wages caused the price hikes. Markets expect another 25 basis point increase at the ECB’s June meeting and possibly another by late summer, followed by a rate cut early next year.
The Bank of England expectedly to raise its key interest rate by 0.25% to 4.5%. Governor Andrew Bailey said the British central bank would continue to “stay the course” as the BoE seeks to curb high inflation in the economy. The Bank of England raised its inflation forecast for the end of 2023 from 3.92% to 5.12% but is no longer forecasting a recession. Analysts are predicting further rate hikes from the BoE, with a final rate level of 5% this fall.
The US dollar rose to its highest level since May 1 against a basket of major currencies after US jobless claims data bolstered the case for the Federal Reserve to stop raising interest rates. A stronger dollar makes oil more expensive globally. Higher interest rates can put pressure on oil demand by raising borrowing costs and putting pressure on economic growth. Oil prices were down 2% yesterday.
Asian markets were mostly down yesterday. Japan’s Nikkei 225 (JP225) increased by 0.02% for the day, China’s FTSE China A50 (CHA50) was down 0.12%, Hong Kong’s Hang Seng (HK50) fell by 0.09% for the day, India’s NIFTY 50 (IND50) was down 0.10%, and Australia’s S&P/ASX 200 (AU200) closed negative 0.05%.
The Nikkei 225 Index (JP225) outperformed other Asian indices thanks to a series of strong reports from automakers Nissan Motor and Honda Motor, which rose 4% and 5%, respectively, but shares of investment giant SoftBank Group Corp. fell by 3% after the bank posted its second straight year of losses. Strong earnings growth in Japan suggests that the economy’s headwinds of slowing growth and high inflation have so far had a limited impact on corporate earnings, indicating that the Japanese economy is still performing steadily. The Nikkei has also been supported by recent signals from the Bank of Japan to maintain its ultra-soft monetary policy.
S&P 500 (F) (US500) 4,130.62 −7.02 (−0.17%)
Dow Jones (US30)33,309.51 −221.82 (−0.66%)
DAX (DE40) 15,834.91 −61.32 (−0.39%)
FTSE 100 (UK100) 7,730.58 −10.75 (−0.14%)
USD Index 102.06 +0.59 (+0.59%)
Important events for today:
– New Zealand Inflation Expectations (q/q) at 06:00 (GMT+3);
– UK GDP (m/m) at 09:00 (GMT+3);
– UK Industrial Production (m/m) at 09:00 (GMT+3);
– UK Manufacturing Production (m/m) at 09:00 (GMT+3);
– Eurozone French Consumer Price Index (m/m) at 09:45 (GMT+3);
– Eurozone Spanish Consumer Price Index (m/m) at 10:00 (GMT+3);
– US Michigan Consumer Sentiment (m/m) at 17:00 (GMT+3).
This article reflects a personal opinion and should not be interpreted as an investment advice, and/or offer, and/or a persistent request for carrying out financial transactions, and/or a guarantee, and/or a forecast of future events.
In view of the Fed, American banking crisis is over. Yet, US and European banks face the most acute stress since 2008 and 2011, respectively. Global economy is exposed to new headwinds.
Last week, as the Federal Reserve pushed ahead with its 10th rate hike since last March, its chairman Jerome Powell declared that the period of U.S. bank failures had come to an end. That’s why Powell assured Americans, “There were three large banks, really from the very beginning, that were at the heart of the stress that we saw in early March — the severe period of stress. Those have now all been resolved, and all the depositors have been protected.”
In other words, the failures of Silicon Valley Bank, Signature Bank and First Republic Bank mark the end, not the spread of the banking crisis. As Powell added, the most recent failure of First Republic, and its subsequent sale to JPMorgan Chase, “kind of draws a line under that period.”
Obviously, such ideas are plain silly. U.S. banking crisis is not over; it has entered a new stage. And it continues to spread.
As dominoes fall
Nearly half (48%) of Americans are concerned about the safety of their bank deposits, according to a Gallup poll last week. Distressingly, the survey results resemble the aftermath of the Lehman Brothers’ collapse.
Recently, Lawrence McDonald, former vice-president at Lehman Brothers, projected that the banking crisis could derail another 50 regional lenders in America if the US fiscal and monetary authorities fail to take steps to resolve structural challenges.
In the U.S. and European banking sector, the rollercoaster ride began in early March, with three weeks of substantial volatility. First, two major US regional banks (Silicon Valley Bank [SVB] and Signature Bank) failed. Then, one of the 30 global systemically important banks, the Switzerland-based Credit Suisse, lost its autonomy after a government-facilitated takeover by UBS.
In the process, market and depositor confidence dissipated in key parts of the sector, with adverse repercussions in investor and consumer confidence.
To prevent the situation from affecting more banks, global industry regulators – including the Federal Reserve, the Bank of Canada, Bank of England, Bank of Japan, European Central Bank, and Swiss National Bank – were compelled to intervene and provide extraordinary liquidity.
How could it all happen – again?
Bank analysts would say that the lead-up period saw many banks invest their reserves in US Treasury securities. So, when the Fed sharply tightened financial conditions last year to rein in surging inflation, companies found it challenging to raise cash, which triggered deposit outflows.
To meet those outflows, SVB sold its long-term Treasuries at great loss. As a capital raise to cover the losses fell apart, a huge run on deposits ensued leading to the largest bank failure since the 2008 financial crisis. What compounded challenges was several banks’ exposure to the bursting cryptocurrency bubble. These events sparked a broad migration of deposits from the banking sector to money market funds while migrating to global systemically important banks, thus forcing some banks to source liquidity from the Fed – the mistakes of which had compounded the challenges in the first place.
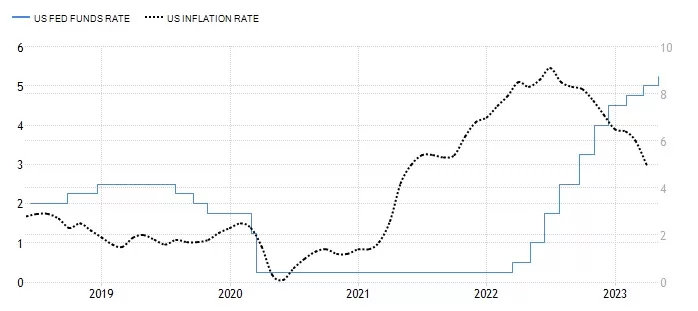
After mid-year 2021, when inflation started to climb rapidly, the Fed shunned a timely response. Instead, its chairman downplayed the threat of soaring prices calling them “transitionary.” The stunning complacency proved costly. By mid-2022, US inflation peaked at 9.1%; a four-decade high. And it remains around 5%, more than twice the 2% target. That’s too why the Fed raised the fed funds rate by 25bps to a range of 5%-5.25% in its May meeting.
If the Fed’s monetary pain wasn’t enough, the White House’s foreign policy has contributed to runaway inflation and elevated uncertainty. After years of trade protectionism, the global pandemic and depression, the net effect of the high-cost US/NATO-led proxy war against Russia in Ukraine has been a lethal mix of a global energy crisis and the meltdown of the global food system.
The spread effects
The elusive calm until the demise of First Republic Bank did not reflect the end of the crisis, but its steady progress. As Mohamed El-Erian, chief economic advisor at Allianz, put it last week. “Now we have stage two, where banks that are not particularly badly managed they have issues but they’re not particularly badly managed – are suddenly vulnerable.” In other words, “the cancer within [these banks] is starting to spread.”
As credit conditions are tightening, the risks of further contraction rise with banking contagion. Structural vulnerabilities remain huge. In parallel with the demise of SVB in March, one consequential study indicated that almost 200 more banks may be vulnerable to the type of risk that caused the collapse of SVB. These banks across the US could fail if half of their depositors quickly withdraw their funds. Even insured depositors — those with $250,000 or less in the bank — could have problems getting their cash if these institutions face the kind of run that SVB experienced.
According to the co-author of the study, a banking expert at Stanford University, half of US lenders are underwater: “Let’s not pretend that this is just about Silicon Valley Bank and First Republic,” he said recently. “A lot of the US banking system is potentially insolvent.” Presumably, some 2,315 banks across the US are currently sitting on assets worth less than their liabilities.
Still worse, the lingering banking crisis occurs at a time, when the White House is engaged in the largest war funding in decades and the Congress has wasted half a year failing to agree on a debt limit.
U.S. default risk as an “economic and financial catastrophe”
A week ago, US Treasury Secretary Janet Yellen warned that the US will run out of cash by June 1 if Congress fails to raise or suspend the debt ceiling. She urged Congress to act “as soon as possible” to address the $31.4 trillion limit. President Biden has called a meeting of congressional leaders on the matter on May 9.
The US hit the statutory limit already last December. Since then, Yellen has repeatedly warned that “failure to raise U.S. debt ceiling would lead to “economic and financial catastrophe.” Unsurprisingly, the Biden administration is under mounting pressure to reconcile the conflicting demands.
Historically, the debt ceiling has been raised, extended or revised 78 times since 1960. If this time is different, it will have significant and adverse global repercussions. If, however, a new debt limit arrangement will be achieved, it can only happen by taking more debt. In this case, Washington will delay its default by buying time, which will make the eventual US debt crisis worse.
The economic fundamentals and safety nets that prevailed in 2008 have been largely exhausted. The West is navigating in perilous waters with leaking lifeboats.
About the Author:
Dr. Dan Steinbock is an internationally recognized strategist of the multipolar world and the founder of Difference Group. He has served at the India, China and America Institute (USA), Shanghai Institutes for International Studies (China) and the EU Center (Singapore). For more, see https://www.differencegroup.net
Insider trading is the term used to describe the illegal act in which someone relies on market-moving, nonpublic information to decide whether to buy or sell a financial asset.
For example, say you work as an executive at a company that plans to make an acquisition. If it’s not public, that would count as inside information. It becomes a crime if you either tell a friend about it – and that person then buys or sells a financial asset using that information – or if you make a trade yourself.
While insider trading typically involves trading stocks of individual companies based on information about them, it can involve any kind of information about the economy, a commodity or anything else that moves markets.
Insider trading was dramatized in Oliver Stone’s 1987 classic movie “Wall Street.” Here, ruthless financier Gordon Gekko explains why information is so valuable.
Why insider trading matters
Insider trading is not a victimless crime. People trading on inside information benefit at the expense of others.
A key characteristic of well-functioning financial markets is high liquidity, which means it is easy to make large trades at low transaction costs. But when traders fear losing money to counterparts with inside information, they charge higher transaction costs, which leads to less liquidity and lower investor returns. And since a lot of people have a stake in financial markets – about half of U.S. families own stocks either directly or indirectly – this behavior hurts most Americans.
Insider trading also makes it more expensive for companies to issue stocks and bonds. If investors think that insiders might be trading bonds of a company, they will demand a higher return on the bonds to compensate for their disadvantage – increasing the cost to the company. As a result, the company has less money to hire more workers or invest in a new factory.
There are also broader impacts of insider trading. It undermines public confidence in financial markets and feeds the common view that the odds are stacked in favor of the elite and against everyone else.
Furthermore, since inside traders profit from privileged access to information rather than work, this makes people believe that the system is rigged.
A recent study estimated that overall only about 15% of insider trading in the U.S. is detected and prosecuted but suggested more of it is coming to light in recent years because of increased enforcement.
One of the more famous – and few – examples of insider trading being prosecuted was the 2004 conviction of businesswoman and media personality Martha Stewart for selling shares based on an illegal tip from a broker.
The sudden collapse of several banks in 2023 has also caught the attention of authorities. The Securities and Exchange Commission is reportedly investigating executives at both Silicon Valley Bank and First Republic Bank, which was seized and sold on May 1, for potential insider trading.
And, so, the cat-and-mouse game between regulators and those who want to game the system continues.
Artificial Intelligence (AI) stocks should now be part of most investors’ portfolios as Big Tech prepare for an AI boom, suggests the CEO and founder of one of the world’s largest independent financial advisory, asset management and fintech organizations.
The comments from deVere Group’s Nigel Green follow last week’s earnings reports from tech titans including Microsoft, Alphabet (parent company of Google) Meta (parent company of Facebook, Instagram and Whatsapp) and Amazon.
It also comes after legendary investors Warren Buffett and Charlie Munger, the Chairman and CEO and Vice chairman respectively of Berkshire Hathaway, spent hours this weekend at a shareholders’ meeting in which they expressed skepticism about AI.
“I am personally skeptical of some of the hype that is going into artificial intelligence. I think old-fashioned intelligence works pretty well,” Munger noted.
However, Nigel Green says: “Despite Buffett and Munger’s scepticism, Big Tech last week posted robust financial performance reports for first-quarter earnings. The pace of growth has picked up noticeably.
“But the real story was the tech giants’ seemingly relentless mania for AI. Most of corporate America clearly think that this is the future.
“The importance of this cannot be overstated considering that just five tech companies have made up two-thirds of the S&P 500’s gains so far this year.
“Besides guidance, which suggests how companies are positioned to manage an economic downturn, and data on how effective cost-cutting measures have been, the Big Tech earnings season was dominated by AI detail.
“The tech titans are fully aware of the enormous returns that could be secured when AI starts to radically change the way businesses work and consumers live their lives.
“We fully expect that the volume of chat around AI will ramp up in future earnings seasons.”
His belief is backed up by recent events. The AI chatbot ChatGPT became wildly popular in just a matter of weeks – and took off faster than social media platforms like TikTok or Instagram. Only two months after its launch in late November, it had 100 million monthly active users in January, according to reports.
It is because of the potential way that AI is expected to impact society and global business that Nigel Green now says that “AI stocks should have a place in most investors’ portfolios.”
Including AI exposure into an investment portfolio offers several possible benefits for investors, such as “potential strong returns, risk management, diversification possibilities, and future-proofing advantages because as the use of AI continues to grow and become more pervasive, those companies that fail to adopt this tech may be at a competitive disadvantage.”
The deVere CEO concludes: “We expect that companies that have substantial AI interests are likely to benefit from the growth of the industry and this could have potentially significant rewards for early investors.
“But, of course, like any investment strategy, including AI in a portfolio carries risks and requires careful consideration. Investors should seek professional advice before making any investment decisions.
“We believe that AI is the future, and we know from the past that early investors in innovative technologies often reap enormous rewards.”
About:
deVere Group is one of the world’s largest independent advisors of specialist global financial solutions to international, local mass affluent, and high-net-worth clients. It has a network of more than 70 offices across the world, over 80,000 clients and $12bn under advisement.
European shares flashed red on Thursday as investors digested the latest rate hike by the Federal Reserve (Fed) and prepared for the European Central Bank’s (ECB) policy decision later today.
As widely expected, the Fed raised interest rates by 25 basis points (bps) and hinted at a pause in further increases during its meeting on Wednesday. However, Fed Chair Jerome Powell left some doubt after stating that economic developments could require further tightening. This sent the S&P 500 tumbling toward the 4070-support level on the daily charts. Nevertheless, the index still remains trapped within a range with a breakout on the horizon.
Our focus this morning falls on the STOX50 Index which could be influenced by the ECB rate decision.
The central bank is expected to raise interest rates by 25 bps, which would mark a downshift from 50 bps hikes triggered at each of its previous three policy meetings. However, core inflation remains sticky at 5.6% in April, still close to the all-time high of 5.7%. If still-stubborn inflation encourages policymakers to signal more hikes into the summer, this could rekindle growth fears – especially when factoring in how the eurozone narrowly avoided recession in Q1 2023. Such a development may weigh on European shares – dragging the STOX50 lower.
A deep dive into the technical picture…
The STOX50 index on the D1 time frame was in an uptrend which made a last higher top at 4427.5 on 21 April, bears then saw an opening and started accumulating positions.
After the top at 4427.5, prices broke through the 15 and 34 Simple Moving Averages (SMA) and the Momentum Oscillator changed direction to the lower side, both further confirming the growing bearish sentiment in the market.
A possible critical support level might be forming near the 34 Simple Moving Average on 4 May at 4272.5. If the level holds and the bulls manage to push the price higher, then a resistance level that formed at a lower top on 27 April at 4398.8 will be a good risk management area.
If bears manage to break through the potential critical support level at 4272.5, three possible price targets can be projected from there. Attaching the Fibonacci tool to the bottom at 4272.5, and dragging it to the lower top at 4398.8, the following targets may be calculated. The first target can be estimated at 4194.4 (161.8%) which is located at a weekly support level. The second price target may be calculated at 4068.1 (261.8%) and if the price manages to break through yet another weekly support level, then the third and final target might be expected at 3863.8 (423.6%).
If the resistance level at 4398.8 is broken, the above scenario is no longer valid.
As long as the bears keep on pulling the price down, the outlook for STOX50 on the D1 time frame will remain bearish.
Revaluation of this Canadian software company depends on its accretive acquisitions and future growth, noted an Echelon Capital Markets report.
NowVertical Group Inc. (NOW:TSX.V; NOWVF:OTC), having achieved Q4/22 results in line with expectations, is “poised to deliver positive EBITDA and double-digit organic growth,” reported Echelon Capital Markets analyst Rob Goff in an April 21 data analytics note. This big data technology company provides industry-specific software and services to help entities affect vertically intelligent transformations.
“With demonstrated organic and inorganic growth, advancing scale and profitability, we look for an aggressive revaluation of the shares,” Goff wrote. “NowVertical’s track record and synergies warrant confidence that it will be successful.”
Attractive Potential Return
Accordingly, Echelon has a target price on NowVertical that projects a significant 224% possible return for investors. The target is CA$1.20 per share, whereas the Canadian software company’s current share price is about CA$0.37. NowVertical remains a Speculative Buy.
“Our bullish thesis looks for NowVertical to rapidly emerge as a midmarket-focused, fusion analytics firm leveraging its purpose-built solutions for high-value, data-driven decision-making with a focus on strategic verticals where it can build vertical intelligence and refined analytics capabilities,” explained Goff.
EBITDA Drain Trends Downward
During Q4/22, NowVertical generated US$8.4 million (US$8.4M) in revenue, near Echelon and the Street’s estimates of US$8.6M and US$8.9M, respectively, Goff reported.
Gross profit was US$3.9M, the same as Echelon’s estimate and higher than consensus’ US$3.7M forecast.
EBITDA was (US$0.1M) whereas Echelon and the Street both expected it to be US$0.
“We note the scaling impact behind NOW’s move to break even EBITDA on the quarter, having seen the EBITDA drain move from US$0.96M in Q1/22 to US$0.6M in Q2/22, with the drain at US$0.3M in Q3/22,” noted Goff.
NowVertical ended Q4/22 with US$3.8M in cash and net debt of US$11.7M. (These figures have since changed.)
Acquisitions Afford Growth
Between Q3/22 and now, April 2023, NowVertical acquired three companies: A10 Group, Acrotrend, and Smartlytics. Growth from its purchases is expected to reach about 20%, Goff wrote, once “revenue synergies from cross-selling gain traction.”
The Canadian software firm intends to continue with this growth strategy. It is targeting companies with US$10M-plus of revenue and acquisitions that are immediately positive free cash flow accretive, Goff pointed out.
“NowVertical’s recent moves to raise additional debt and equity capital leave [the company] positioned to execute against its mergers and acquisitions pipeline put at about US$90M,” wrote Goff.
Upcoming Catalysts
Goff reiterated the events that could move up NowVertical’s stock price. They are double-digit organic and backlog growth, positive EBITDA, and accretive acquisitions.
Disclosures: 1) Doresa Banning wrote this article for Streetwise Reports LLC and provides services to Streetwise Reports as an independent contractor. She or members of her household own securities of the following companies mentioned in the article: None. She or members of her household are paid by the following companies mentioned in this article: None.
2) The following companies mentioned in this article are billboard sponsors of Streetwise Reports: None. Click here for important disclosures about sponsor fees. As of the date of this article, an affiliate of Streetwise Reports has a consulting relationship with: None. Please click here for more information.
3) Comments and opinions expressed are those of the specific experts and not of Streetwise Reports or its officers. The information provided above is for informational purposes only and is not a recommendation to buy or sell any security.
4) The article does not constitute investment advice. Each reader is encouraged to consult with his or her individual financial professional and any action a reader takes as a result of information presented here is his or her own responsibility. By opening this page, each reader accepts and agrees to Streetwise Reports’ terms of use and full legal disclaimer. This article is not a solicitation for investment. Streetwise Reports does not render general or specific investment advice and the information on Streetwise Reports should not be considered a recommendation to buy or sell any security. Streetwise Reports does not endorse or recommend the business, products, services or securities of any company mentioned on Streetwise Reports.
5) From time to time, Streetwise Reports LLC and its directors, officers, employees or members of their families, as well as persons interviewed for articles and interviews on the site, may have a long or short position in securities mentioned. Directors, officers, employees or members of their immediate families are prohibited from making purchases and/or sales of those securities in the open market or otherwise from the time of the decision to publish an article until three business days after the publication of the article. The foregoing prohibition does not apply to articles that in substance only restate previously published company releases.
The number of tweets mentioning “SIVB,” the bank’s stock ticker, increased sharply on March 9 around 9 a.m EST. That was roughly two and a half hours before tweets mentioning “SVB” or “Silicon Valley Bank,” which were part of a more general-interest discussion, began.
That spike in investor tweets coincided with the rapid drop in the bank’s stock price on March 9, which continued in after-hours trading and before the market opened the next morning. Trades in SVB’s stock were halted on March 10, the day the bank collapsed.
Together with several other colleagues, we grouped U.S. banks by the number of tweets posted about them and by their vulnerability to a potential bank run. To measure vulnerability, we multiplied losses the banks incurred due to the string of interest rate increases that began in March 2022 by the proportion of their deposits that were below the Federal Deposit Insurance Corp.‘s insurance limit of $250,000 per account.
We found that shares of banks with a lot of Twitter activity in January and February incurred much larger declines in March. This effect was stronger for the group of banks with the most vulnerability. One of them was First Republic Bank, which subsequently failed on May 1.
When we looked at what happened to the stocks of all the banks with vulnerable balance sheets from March 6 to March 13, the one-third of banks with the most tweets experienced declines in their share prices on average about twice as large as the others.
Existing knowledge about bank runs comes mainly from banking distress during the Great Depression. Back then, word of mouth, media coverage and public signals, such as long lines outside of banks, spread panic among bank customers.
The breadth of the audience and the quick spread of ideas make social media distinct from newspapers and broadcast news since traditional media outlets mostly rely on one-way communication from official sources to the general public.
A report on SVB’s failure that the Federal Reserve released on April 28 underscored many of the points we made in our paper. It highlights poor risk management by SVB in combination with a large fraction of depositors concentrated in the Silicon Valley startup community, who are often very active and highly connected on social media.
Depositors who rapidy withdrew money from SVB also reportedly relied onprivate communication channels, such as group text messages, Slack and WhatsApp, as well as phone calls, to share their fears and concerns. But since there is no publicly available data, it is hard to find out what role those other less formal conversations played in precipitating the SVB bank run.


 Article by ForexTime