Archive for Stock Market News – Page 29

Week Ahead: SPX500_m set for rollercoaster ride

By ForexTime

Even as markets turn cautious ahead of the highly anticipated US jobs report later today (Friday, July 7), investors are bracing for more action in the week ahead thanks to another round of risk events.

It’s all about the incoming US inflation data, speeches from numerous Fed officials as well as earnings announcements by US banks which could inject fresh volatility into the S&P 500 over the coming week.

Monday, July 10 

  • CNH: China CPI, PPI
  • GBP: Bank of England Governor Andrew Bailey speech
  • USD: Fed speak – San Francisco Fed President Mary Daly, Cleveland Fed President Loretta Mester, Atlanta Fed President Raphael Bostic

Tuesday, July 11

  • AUD: Australia consumer confidence
  • EUR: Germany CPI & ZEW survey expectations
  • GBP: UK jobless claims, unemployment report
  • USD: St. Louis Fed President James Bullard speech

Wednesday, July 12 

  • CAD: Canada rate decision
  • NZD: New Zealand rate decision
  • JPY: Japan PPI
  • USD: US June CPI report, Cleveland Fed President Loretta Mester, Atlanta Fed President Raphael Bostic speech

Thursday, July 13 

  • CNH: China trade
  • EUR: Eurozone industrial production
  • GBP: UK industrial production
  • USD: US initial jobless claims, PPI

Friday, July 14

  • JPY: Japan industrial production
  • USD: University of Michigan consumer sentiment
  • SPX500_m: Bank earnings – Wells Fargo, JP Morgan and Citigroup

The June US Consumer price index (CPI) report published on Wednesday, July 12 will be one week after hawkish Fed minutes reinforced expectations around US rates staying higher for longer.

Given how the Fed remains data dependent, the strong ADP jobs report, pending NFP release this afternoon, and incoming US inflation data are likely to further influence Fed hike expectations.

Markets are forecasting: 

  • CPI year-on-year (June 2023 vs. June 2022) to cool 3.1% from 4.0% in the prior month.
  • Core CPI year-on-year to cool 5.0% from 5.3% seen in May.
  • CPI month-on-month (June 2023 vs May 2023) to rise 0.3% from 0.1% in the prior month.
  • Core CPI month-on-month to cool 0.3% from 0.4% seen in May.

Over the past few months, there has been evidence of inflationary pressures cooling in the world’s largest economy, but core inflation has remained sticky. Should June’s CPI report slow further, this could fuel hopes around the Fed pausing rate hikes beyond July’s policy meeting.

How might the US CPI data influence the SPX500_m?

US equity bulls have warmly welcomed signs of cooling inflationary pressures as this supports the argument over the Fed pausing and eventually cutting interest rates down the road. Given how the S&P 500 Index has a handful of tech stocks that remain sensitive to Fed hike expectations, the CPI data could trigger volatility. In a nutshell, tech stocks dislike higher interest rates because their value is based on earnings projected in the future.

  • The SPX500_m might find itself under renewed selling pressure if the inflation numbers exceed market expectations.
  • Should the inflation numbers print below market forecasts, this could push the SPX500_m higher as expectations swell over the Fed nearing the end of its hiking cycle.

Let’s talk about US earnings season.

It’s that time of the year again!

Second quarter earnings season kicks off on Friday 14th July led by banking giants JP Morgan, Wells Fargo, and Citigroup. The bank earnings will be closely scrutinized for fresh insight into the US economy. It is worth keeping in mind that back in June, these major banks all passed the Fed’s stress test – lifting optimism ahead of earnings. Higher interest rates are expected to support bank earnings in the second quarter of 2023 as the Fed waged war against inflation.

Ultimately, a positive set of bank earnings may boost appetite for risk – injecting equity bulls with renewed confidence. 

How might bank earnings impact the SPX500_m?

Given how financial stocks accounts for roughly 12.5% of the S&P 500, the market reaction to the earnings of these big banks on Friday could influence the index.

  • The SPX500_m could push higher if the bank earnings exceed market expectations.
  • If the earnings disappoint, the SPX500_m may trade lower.

Technical Outlook: Bulls vs Bears 

The SPX500_m could be thrown on a roller-coaster ride next week if bulls and bears wrestle for control on the daily charts. 

Even though prices are respecting a bullish channel on the D1 timeframe, bears are clearly in the vicinity and could ramp up their pressure if the index sinks back below 4332. Alternatively, bulls need to push prices beyond the 4463 resistance level to regain control of the steering wheel.

  • A solid breakout above 4463 could encourage an incline towards 4500 and 4580, respectively.
  • Should prices break down below 4332, this could encourage a decline to 4300, 4260, and 4200, respectively.


Forex-Time-LogoArticle by ForexTime

ForexTime Ltd (FXTM) is an award winning international online forex broker regulated by CySEC 185/12 www.forextime.com

Insights into This “Ultimate Harbinger” of the Bear Market

Enthusiasm for U.S. IPOs seems to be dramatically decreasing

By Elliott Wave International

Back in early 2021, many investors were chomping at the bits to invest in entities about which they knew next to nothing.

These entities are known as Special Purpose Acquisition Companies (SPACs), which may be described as shell companies which raise money through an initial public offering to acquire another company. Investors’ enthusiasm towards them has waned, but they are still around.

The amazing thing is that people who invest in SPACs don’t know the identity of the company to be acquired. Yet, they eagerly invest anyway.

It’s a reminder of Charles Mackay’s book, Extraordinary Popular Delusions and the Madness of Crowds, in which he described the extreme bullish sentiment way back in 1720:

“[A]n undertaking of great advantage came to market, but nobody is to know what it is.”

In March 2021, when several athlete- and celebrity-sponsored SPACs hit the market, the Elliott Wave Financial Forecast, a monthly publication which covers major U.S. financial markets, called it:

The ultimate harbinger of the next bear market.

Yes, the major stock indexes held up for another nine months or so — yet the IPO market had already started to show weakness.

Today, that weakness has morphed into an outright bear market. The June 2023 Elliott Wave Financial Forecast provides a review with this chart and commentary:

The chart shows the Renaissance IPO Index, which records the aftermarket performance of U.S. IPOs. The index peaked on February 16, 2021 and declined 69%. The total number of IPOs peaked a month later at 135, also an all-time high. For 2022 and the first four months of 2023, the average monthly total is only 15 U.S. IPOs.

As Barron’s stated back in March:

The Tech IPO Well Has Run Dry. It’s Likely to Stay That Way.

The diminishing number of IPOs is by no means the only warning sign for stock investors.

Elliott Wave International’s Financial Forecast Service discusses an array of indicators which may be of interest to you, as well as the message of the Elliott wave model.

An important point about the Elliott wave model is that it helps investors to identify turning points in the trends of financial markets.

Indeed, here’s a quote from Frost & Prechter’s Wall Street classic, Elliott Wave Principle: Key to Market Behavior:

When after a while the apparent jumble gels into a clear picture, the probability that a turning point is at hand can suddenly and excitingly rise to nearly 100%. It is a thrilling experience to pinpoint a turn, and the Wave Principle is the only approach that can occasionally provide the opportunity to do so.

Here’s the good news: You can access the entire online version of the book for free once you become a member of Club EWI, the world’s largest Elliott wave educational community.

Club EWI is free to join without any obligations and members enjoy free access to Elliott wave resources on financial markets and investing, including exclusive articles and interviews with Elliott Wave International’s analysts.

Click on the link to get started right away: Elliott Wave Principle: Key to Market Behaviorget free and instant access.

This article was syndicated by Elliott Wave International and was originally published under the headline Insights into This “Ultimate Harbinger” of the Bear Market. EWI is the world’s largest market forecasting firm. Its staff of full-time analysts led by Chartered Market Technician Robert Prechter provides 24-hour-a-day market analysis to institutional and private investors around the world.

Do NQ100_m bears have a chance as NFP looms?

By ForexTime

  • NQ100_m shaky ahead of Friday’s US NFP
  • Momentum Oscillator reveals a negative divergence
  • Prices could hit 3 possible targets if 14699.6 higher bottom is breached
  • Bearish outlook invalidated if resistance at 15294.0 is broken

The NQ100_m index has been dominated by bulls since April, but bears may have a chance to take over the reigns as a lower top has formed at a strong weekly resistance level. Hawkish minutes from the Federal Reserve’s June policy meeting could support Nasdaq bears further, especially after it reinforced expectations around US rates staying higher for longer.

On the technical front, the NQ100_m created a higher bottom on 26 June at 14699.6 and a higher top on 16 June at 15300.5. Interestingly, the Momentum Oscillator also reveals a negative divergence between points “a” and “b” when comparing the tops at 14673.9 and 15300.5. This may alert technical traders that a momentum change could be on the cards.

Further confirmation was the market breaking through the 15 Simple Moving Average and the Momentum Oscillator starting to drop closer to the 100 baseline in a downward wave pattern.

If bears manage to break through the support level formed by the last higher bottom at 14699.6, then three possible price targets might be realized from there. Attaching the Fibonacci tool to the higher bottom at 14699.6 and dragging it to the lower top at 15294.0, the following targets can be determined:

  • The first target can be estimated at 14332.3 (161.8%) if the price manages to break through a weekly support level at 14506.4.

  • The second price target can be expected at 13737.9 (261.8%) which is on a next weekly support level at 13757.8

  • The third and final target can be anticipated at 12776.1 (423.6%). 

If the resistance level at 15294.0 is broken, the current scenario is no longer valid. 

As long as bears keep pulling the market downwards they have a chance to cause an early stage of a new downtrend on the NQ100_m D1 time frame.


Forex-Time-LogoArticle by ForexTime

ForexTime Ltd (FXTM) is an award winning international online forex broker regulated by CySEC 185/12 www.forextime.com

3 Auto Giants Caught in Recall Chaos: Stocks at Stake!

By Ino.com

Benjamin Franklin once said, “If you fail to plan, you plan to fail.” While the thought has stood the test of time, with time, businesses have also realized that planning for accidental (yet inevitable) failure is also a failure to plan.

The National Highway Traffic Safety Administration (NHTSA) recently issued multiple recalls, with three auto giants scrambling for cover and damage limitation.
Ford Motor Company (F) is recalling 979,797 of its vehicles for not having instructions on adjusting or removing certain head restraints in the owner’s manual. These include certain 2018-2023 Expedition and Lincoln Navigator models that have third-row seating, 2019-2023 F-Super Duty F-250, F-350, F-450, F-550, and F-600 SuperCab vehicles along with three-passenger front bench seat regular cab models.

In addition, the company has also recalled 16,375 select 2022-2023 F-150 BEV vehicles for a rear lightbar issue in which the lightbar may have micro-cracks in its outer lens, allowing moisture to collect, which could result in out-of-order or flickering reverse lights.

Hyundai Motor Company (HYMTF) is recalling 322 of its 2023 Palisade vehicles for a potential issue in which the brake booster diaphragm may become misaligned and cause an internal vacuum leak in the vehicle, potentially leading to a loss of power brake assist.

Nissan Motor Co., Ltd. (NSANY) is recalling 230 2022 Sentra vehicles for a potential missing or improper seal in the driver’s side cowl area. This can allow water to leak inside the vehicle and corrode electrical components, which could lead to the failure of electrical systems and increase the risk of a crash and an electrical short-circuit, potentially increasing the risk of a fire.

In all three cases mentioned above of oversight, corrective actions are being taken by the concerned companies through their dealer networks free of additional cost to the customer.

However, since resources that could have been utilized to meet planned business objectives need to be diverted to execute these unplanned corrections, let’s understand the ever-growing incidents of product recall and their impact on businesses and (by extension) their stock prices.

A product recall is a process of retrieving and replacing defective goods, with the concerned company or manufacturer assuming the responsibility and absorbing the cost of replacing and fixing defective products or reimbursing affected consumers, as per consumer protection laws.

With the spread of globalization, businesses expanded and diversified their supply chains globally through offshoring and outsourcing to remain cost competitive, although often at the cost of the reliability or quality of their end products or services.

Moreover, an offering, or a component of the same, must comply with the regulations of both the country of its origin and the market in which it is supposed to be distributed. Hence, even if a product passes regulations in China, it might not be under U.S. laws. It would, therefore, have to be recalled.

Government agencies, such as the NHTSA, are responsible for testing products and recognizing faulty ones before they reach the market. With the increasing complexity of global supply chains and the frequency of tests, product recalls have also increased in frequency.

Since brand equity is built on trust and confidence, recalls can tarnish a company’s reputation, translating into financial losses and consequent erosion of market capitalization. Moreover, although insurance may cover a minimal amount to replace defective products, several recalls result in lawsuits that could further dent a company’s prospects.

By Ino.com – See our Trader Blog, INO TV Free & Market Analysis Alerts

Source: 3 Auto Giants Caught in Recall Chaos: Stocks at Stake!

Fed’s stress test to mess with WSt30_m?

By ForexTime 

  • Fed to release bank stress test results after US markets close today
  • 2023’s test comes after several US banks, including SVB, collapsed in March
  • WSt30_m index may be dragged lower on weaknesses uncovered/tighter capital rules for US banks


Investors and traders in US banking stocks are awaiting key news that could rock share prices over the coming days.

The Federal Reserve (US central bank) will unveil the results of its latest annual bank stress test later today.


What is this stress test?

The Fed has conducted this yearly test publicly since 2009, following the Global Financial Crisis – the worst since the Great Depression (1929-1941).

The aim is to find out if the US banking system can withstand hypothetical economic crises.

23 banks will undergo 2023’s stress test, fewer than the 34 banks tested in 2022.


Why is this important?

This stress test is an important part of the Fed’s key objective in promoting “a safe, sound and efficient banking system”.

This year’s test results also bear greater significance in light of the US banking crisis (three US banks collapsed, including Silicon Valley bank) in March 2023.

The bank failures earlier this year occurred despite all the tests in years past.

Hence, markets may be more sensitive to the latest stress test results, with the Fed also set to be more stringent in ensuring that US banks are more resilient following this year’s banking turmoil.


What’s being tested this year specifically?

The Fed’s stress test will want to check how well US banks will hold up under a hypothetical “severe recession” scenario, including:

  • US jobless rates peaking at 10% (latest data: US unemployment rate at 3.7% in May 2023).
  • US house prices plummeting by 38%/commercial properties see 40% drop
  • Recessions in the euro area, UK, developing Asia, and Japan
  • US dollar soars against all currencies, except for the Japanese Yen

And for the first time ever …

The Fed has added a “global market shock component”, aimed at testing global systemically important banks (G-SIBs) against more intense inflation and further rate hikes.

These G-SIBs include Wall Street giants such as Goldman Sachs and JPMorgan Chase.


When will the Fed release the results?

The Fed is set to announce the results of its latest stress test at 20:30hrs GMT on Wednesday, June 28th.

Then, two days later (perhaps Friday afternoon), the Fed is expected to unveil what each bank must specifically do/change in terms of its capital (how much money it has to set side to weather economic turbulence).


How are US banks expected to perform?

Overall, the big banks are expected to pass the Fed’s test.

However, markets are bracing for the Fed still requiring additional capital buffers out of some of the biggest US banks.

Note that, just last week, Fed Chair Jerome Powell told the US senate Banking Committee that the largest US banks may have to set aside 20% more capital as precaution.

That could mean less money that can be used for share buybacks or dividend payouts.

Investors in banking stocks are not going to like the sound of that.


What does all this mean for WSt30_m index?

Our WSt30_m index mirrors the benchmark Dow Jones index, which feature 30 industry leaders in the US economy.

Among that list of 30 include: Goldman Sachs and JPMorgan Chase, which together account for about 8.8% of the WSt30_m index.

In other words, how Goldman Sachs/JPM share prices react to the Fed’s stress test results is set to have large influence over the WSt30_m index.

NOTE: US banking stocks account for just under 3% of the S&P 500, which is tracked by the SPX500_m index.
Unless the bank stress test results permeate across stock markets, the SPX500_m is set to see a smaller impact from the stress test, rather than the WSt30-M.


Potential Scenarios:

  • WSt30_m index could be dragged lower if the stress test reveals bigger cracks in the banking system/requires larger capital buffers.
  • WSt30_m index may see some gains if the stress test proves that the March US banking crisis episode was an anomaly, with risks now mitigated and the US banking sector now in a healthy and robust state to weather any further economic/financial turbulence.

    However, noting that recession fears still abound across global stock markets, immediate upside for the WSt30_m may prove limited and temporary.


Key levels:

POTENTIAL SUPPORT:

  • 50-day simple moving average (SMA) (same area as the 78.6% Fibonacci level from WSt30_m’s October-December 2022 ascent.
  • 33,254 – 33,265 region
  • 33,200: upward lower trendline since March


POTENTIAL RESISTANCE:

  • 34,288: May 2023 cycle high
  • 34,399 – 34,530: Jan – Feb cycle highs
  • 34,614: latest cycle high


Forex-Time-LogoArticle by ForexTime

ForexTime Ltd (FXTM) is an award winning international online forex broker regulated by CySEC 185/12 www.forextime.com

Stocks and Junk Bonds: “This Divergence Appears Meaningful”

“Everything was aligned until February 2”

By Elliott Wave International

The trends of the junk bond and stock markets tend to be correlated.

The reason why is that junk bonds and stocks are closely affiliated in the pecking order of creditors in case of default. The rank of junk bonds is only slightly higher than equities because debt involves a contract.

Given these two markets are usually correlated, it’s worth paying attention when a divergence takes place. Indeed, a divergence is in the works now. In other words, while stocks have been holding up, the price of junk bonds have been trending lower for much of the year.

Here’s a headline from a few months ago (Reuters, March 16):

Investors shun high-yield bonds on recession, banking risks

At the same time, as mentioned, the S&P 500 and especially the NASDAQ has remained elevated.

The June 16 U.S. Short Term Update, which is a thrice weekly Elliott Wave International publication, discussed this divergence via this chart and commentary:

The graph shows that junk bonds diverged relative to stocks at the January 2022 peak, when stocks started their bear market. Both trends then came into alignment during the decline as well as the countertrend rallies that were interspersed in the selloff. Everything was aligned until February 2, which is when the yield on junk bonds made a low (shown as a high on the inverted chart). Yields then started to rise but instead of stocks declining, which would keep both trends side by side, equities continued to rally. This divergence appears meaningful.

The U.S. Short Term Update goes on to say that this divergence is not meant to be used for near-term market timing. But it is an indicator to keep in mind along with other indicators as well as the Elliott wave model.

If you’re unfamiliar with Elliott wave analysis or need to re-acquaint yourself, you are encouraged to delve into the definitive text on the subject, Elliott Wave Principle: Key to Market Behavior, by Frost & Prechter.

Here’s a quote from the book:

After you have acquired an Elliott “touch,” it will be forever with you, just as a child who learns to ride a bicycle never forgets. Thereafter, catching a turn becomes a fairly common experience and not really too difficult. Furthermore, by giving you a feeling of confidence as to where you are in the progress of the market, a knowledge of Elliott can prepare you psychologically for the fluctuating nature of price movement and free you from sharing the widely practiced analytical error of forever projecting today’s trends linearly into the future. Most important, the Wave Principle often indicates in advance the relative magnitude of the next period of market progress or regress. Living in harmony with those trends can make the difference between success and failure in financial affairs.

Here’s the good news: You can read the entire online version of the book for free once you become a Club EWI member.

Club EWI is the world’s largest Elliott wave educational community and is free to join. Moreover, members enjoy free access to a wealth of Elliott wave resources on investing and trading.

Get started by following this link: Elliott Wave Principle: Key to Market Behavior — get free and unlimited access now.

This article was syndicated by Elliott Wave International and was originally published under the headline Stocks and Junk Bonds: “This Divergence Appears Meaningful”. EWI is the world’s largest market forecasting firm. Its staff of full-time analysts led by Chartered Market Technician Robert Prechter provides 24-hour-a-day market analysis to institutional and private investors around the world.

Stocks cautious ahead of central bank pow-wow

By ForexTime 

  • NQ100_m attempts to stabilise around 21-day SMA after recent losses
  • Recession fears weigh on “expensive” US stocks
  • Talk of further rate hikes by central bankers this week may drag US stocks even lower

US stocks futures are trying to find a more solid footing after Monday’s declines.

The 21-day simple moving average is offering immediate support on the NQ100_m index at 14,751.

Further declines may call upon the following support levels to the fore:

  • The early-June cycle high at 14,673.9 may be the next area of interest for bears (those hoping prices will move lower)
  • Further south, the 61.8% Fibonacci level from its long term (November 2021 – October 2022) peak-to-trough price action, may offer stronger support around 14,351.
    (Note that this region had offers support for this index, which tracks the tech-heavy Nasdaq 100, on a couple of occasions since late May.)


US equities extend last week’s losses

On Monday, the benchmark S&P 500 lost 0.45% and the Nasdaq 100 finishing lower by 1.36%.

The tech sector underperformed with big losses in Meta, Nvidia and Alphabet while Tesla fell more than 6% after cautious commentary from investment bank, Goldman Sachs.

Interestingly, small caps were resilient with the Russell 2000 closing in the green amid gains in the regional banking sector.

Tech stocks have led markets strongly higher in the first two quarters of the year with moderating inflation and AI-led gains to the fore.

We’ve also seen narrow leadership from a handful of megacap, growth companies with the wider blue-chip S&P 500 up around 12.7% this year, while the tech-laden Nasdaq 100 index still boasts of a year-to-date advance of over 34%.

This has driven equities to more expensive levels with valuations above historic averages, which is starting to grab the headlines and offers a note of caution to some of these handsome gains.

READ MORE: (June 14) Can US share markets go up higher today?

Sintra on the market’s mind

This week sees the ECB annual forum on central banking which takes places at Sintra in Portugal.

The symposium is entitled “Macroeconomic stabilisation in a volatile inflation environment” with the key segment being the policy panel tomorrow featuring:

  • Fed Chair Powell
  • BoE Governor Bailey
  • BoJ Governor Ueda

Several ECB speakers are scheduled to appear today including ECB President Lagarde and Schnabel as well as members of the Bank of England’s MPC.

Central bankers as a whole remain relatively hawkish after changing gears slightly in recent weeks in their battle against sticky, core inflation.

But markets are fearing a recession even though they price in more rate hikes.

So any signs of a change in the hawkish policy drumbeat certainly might hit risk assets, including the US share market.

However, if risk-on sentiment can be restored should markets overcome recession fears, that may prompt the NQ100_m to revisit its recent high at the 15,300 mark.


Forex-Time-LogoArticle by ForexTime

ForexTime Ltd (FXTM) is an award winning international online forex broker regulated by CySEC 185/12 www.forextime.com

COT Stock Market Charts: Weekly Speculator Changes led by S&P500-Mini & VIX

By InvestMacro

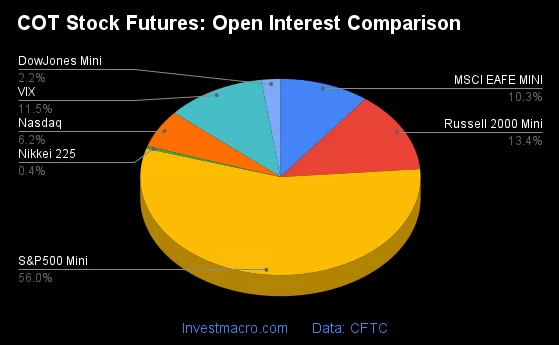
Here are the latest charts and statistics for the Commitment of Traders (COT) data published by the Commodities Futures Trading Commission (CFTC).

The latest COT data is updated through Tuesday June 20th and shows a quick view of how large traders (for-profit speculators and commercial entities) were positioned in the futures markets.

Weekly Speculator Changes led by S&P500-Mini & VIX

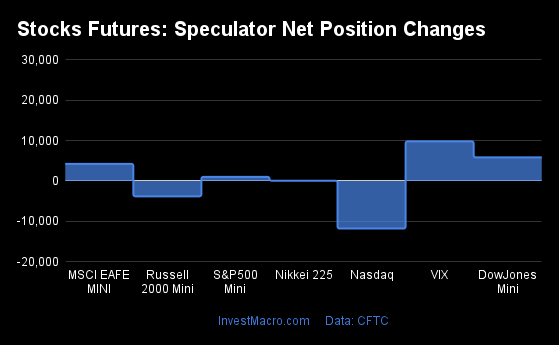
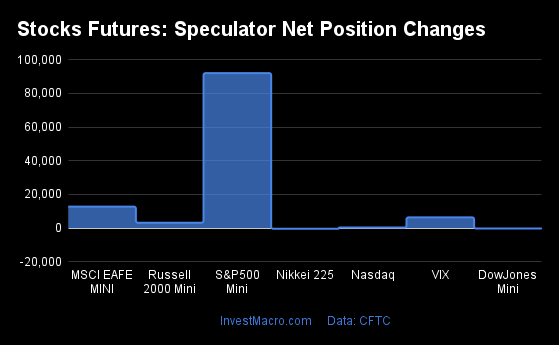
The COT stock markets speculator bets were higher this week as six out of the seven stock markets we cover had higher positioning while the other two markets had lower speculator contracts.

Leading the gains for the stock markets was S&P500-Mini (92,082 contracts) with MSCI EAFE-Mini (12,769 contracts), VIX (6,365 contracts), Nasdaq-Mini (313 contracts) and Russell-Mini (3,187 contracts) also showing positive weeks.

The markets with the declines in speculator bets this week were DowJones-Mini (-279 contracts) and Nikkei 225 (-421 contracts) also registering lower bets on the week.


Data Snapshot of Stock Market Traders | Columns Legend
Jun-20-2023OIOI-IndexSpec-NetSpec-IndexCom-NetCOM-IndexSmalls-NetSmalls-Index
S&P500-Mini2,223,81523-239,33129248,77974-9,44841
Nikkei 22516,78718-7,029235,392691,63749
Nasdaq-Mini247,5913515,99384-8,87221-7,12140
DowJones-Mini87,91143-15,8592916,45367-59441
VIX455,331100-61,0567560,9332012396
Nikkei 225 Yen55,2964512,4077213,25147-25,65824


Strength Scores led by Nasdaq-Mini & VIX
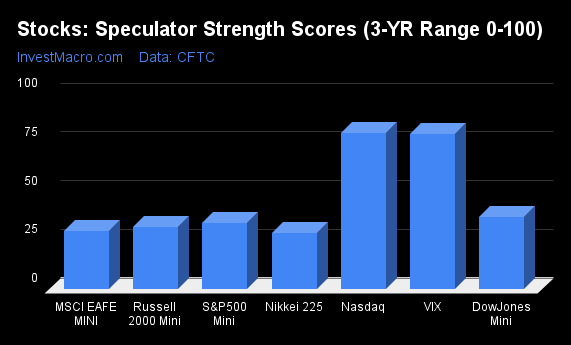
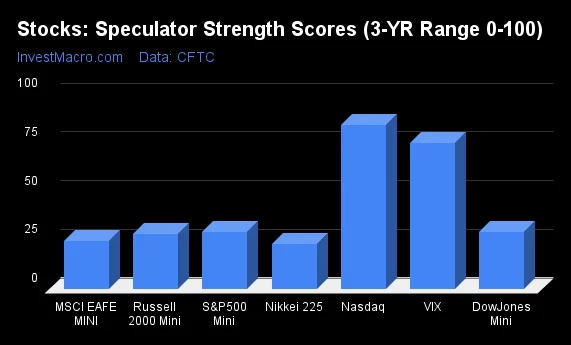
COT Strength Scores (a normalized measure of Speculator positions over a 3-Year range, from 0 to 100 where above 80 is Extreme-Bullish and below 20 is Extreme-Bearish) showed that the Nasdaq-Mini (84 percent) and the VIX (75 percent) lead the stock markets this week. The Nikkei 225 Yen (72 percent) comes in as the next highest in the weekly strength scores.

On the downside, the Nikkei 225 (23 percent) and MSCI EAFE-Mini (25 percent) come in at the lowest strength level currently.

Strength Statistics:
VIX (74.9 percent) vs VIX previous week (70.2 percent)
S&P500-Mini (29.1 percent) vs S&P500-Mini previous week (15.3 percent)
DowJones-Mini (29.0 percent) vs DowJones-Mini previous week (29.8 percent)
Nasdaq-Mini (84.0 percent) vs Nasdaq-Mini previous week (83.8 percent)
Russell2000-Mini (28.3 percent) vs Russell2000-Mini previous week (26.4 percent)
Nikkei USD (23.2 percent) vs Nikkei USD previous week (26.0 percent)
EAFE-Mini (24.8 percent) vs EAFE-Mini previous week (9.2 percent)


S&P500-Mini & DowJones-Mini top the 6-Week Strength Trends
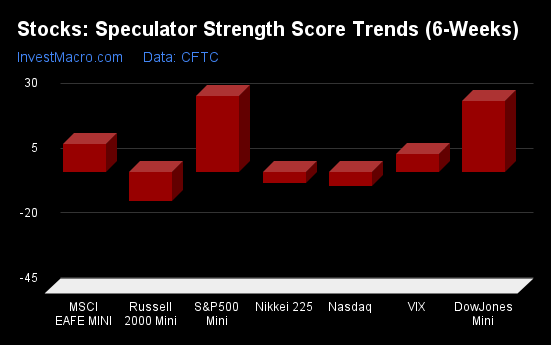
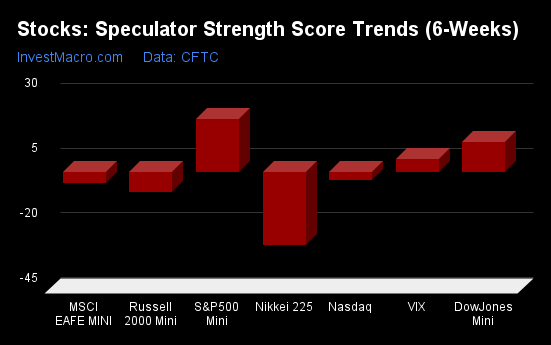
COT Strength Score Trends (or move index, calculates the 6-week changes in strength scores) showed that the S&P500-Mini (20 percent) leads the past six weeks trends for the stock markets. The DowJones-Mini (12 percent), the Nikkei 225 Yen (9 percent) and the VIX (5 percent) are the next highest positive movers in the latest trends data.

The Nikkei 225 (-28 percent) leads the downside trend scores currently with the Russell-Mini (-8 percent) coming in as the next market with lower trend scores.

Strength Trend Statistics:
VIX (5.0 percent) vs VIX previous week (9.2 percent)
S&P500-Mini (20.4 percent) vs S&P500-Mini previous week (3.6 percent)
DowJones-Mini (11.7 percent) vs DowJones-Mini previous week (15.3 percent)
Nasdaq-Mini (-3.0 percent) vs Nasdaq-Mini previous week (1.3 percent)
Russell2000-Mini (-7.8 percent) vs Russell2000-Mini previous week (-9.9 percent)
Nikkei USD (-28.3 percent) vs Nikkei USD previous week (-23.5 percent)
EAFE-Mini (-4.2 percent) vs EAFE-Mini previous week (-15.4 percent)


Individual Stock Market Charts:

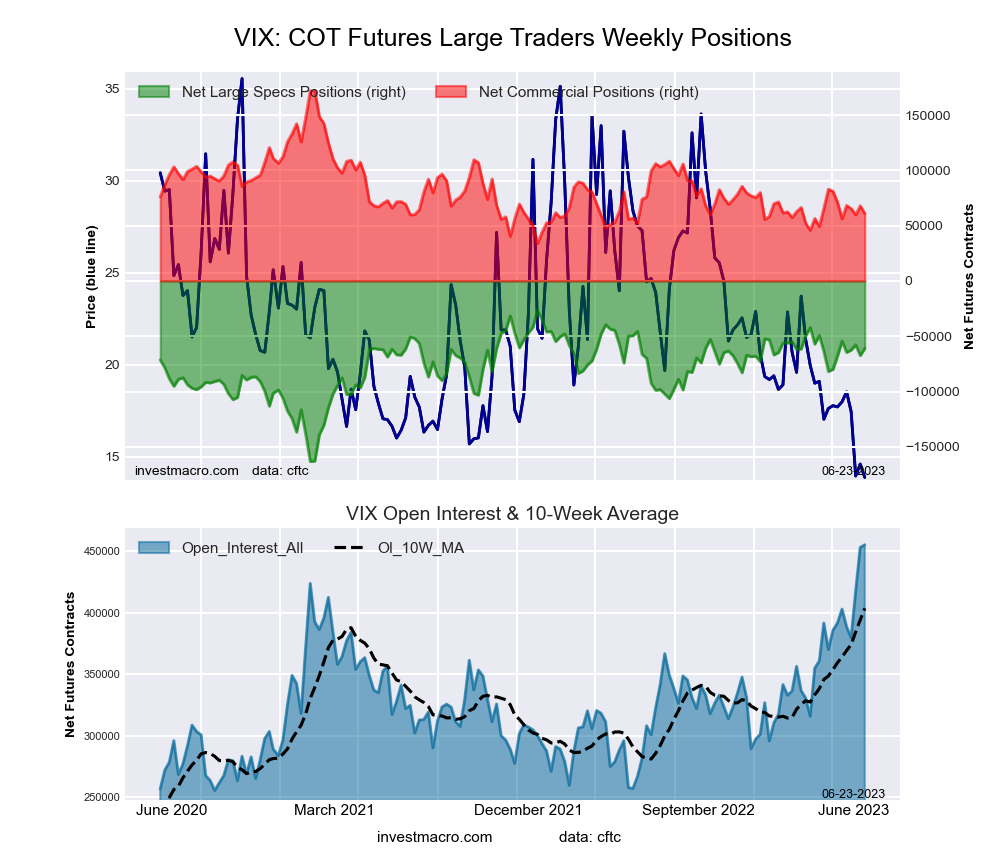
VIX Volatility Futures:
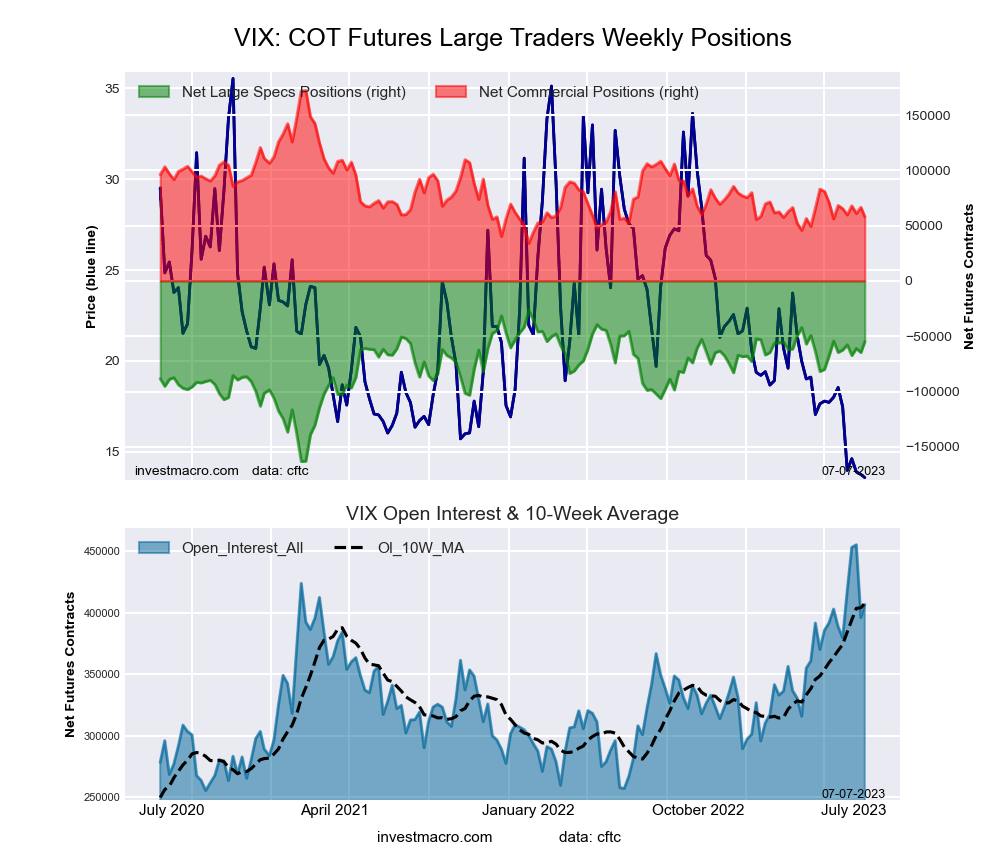
VIX Volatility Futures COT ChartThe VIX Volatility large speculator standing this week totaled a net position of -61,056 contracts in the data reported through Tuesday. This was a weekly increase of 6,365 contracts from the previous week which had a total of -67,421 net contracts.

This week’s current strength score (the trader positioning range over the past three years, measured from 0 to 100) shows the speculators are currently Bullish with a score of 74.9 percent. The commercials are Bearish-Extreme with a score of 19.6 percent and the small traders (not shown in chart) are Bullish-Extreme with a score of 96.4 percent.

Price Trend-Following Model: Strong Downtrend

Our weekly trend-following model classifies the current market price position as: Strong Downtrend. The current action for the model is considered to be: Hold – Maintain Short Position.

VIX Volatility Futures StatisticsSPECULATORSCOMMERCIALSSMALL TRADERS
– Percent of Open Interest Longs:22.351.76.8
– Percent of Open Interest Shorts:35.738.36.8
– Net Position:-61,05660,933123
– Gross Longs:101,721235,29031,096
– Gross Shorts:162,777174,35730,973
– Long to Short Ratio:0.6 to 11.3 to 11.0 to 1
NET POSITION TREND:
– Strength Index Score (3 Year Range Pct):74.919.696.4
– Strength Index Reading (3 Year Range):BullishBearish-ExtremeBullish-Extreme
NET POSITION MOVEMENT INDEX:
– 6-Week Change in Strength Index:5.0-7.216.3


S&P500 Mini Futures:

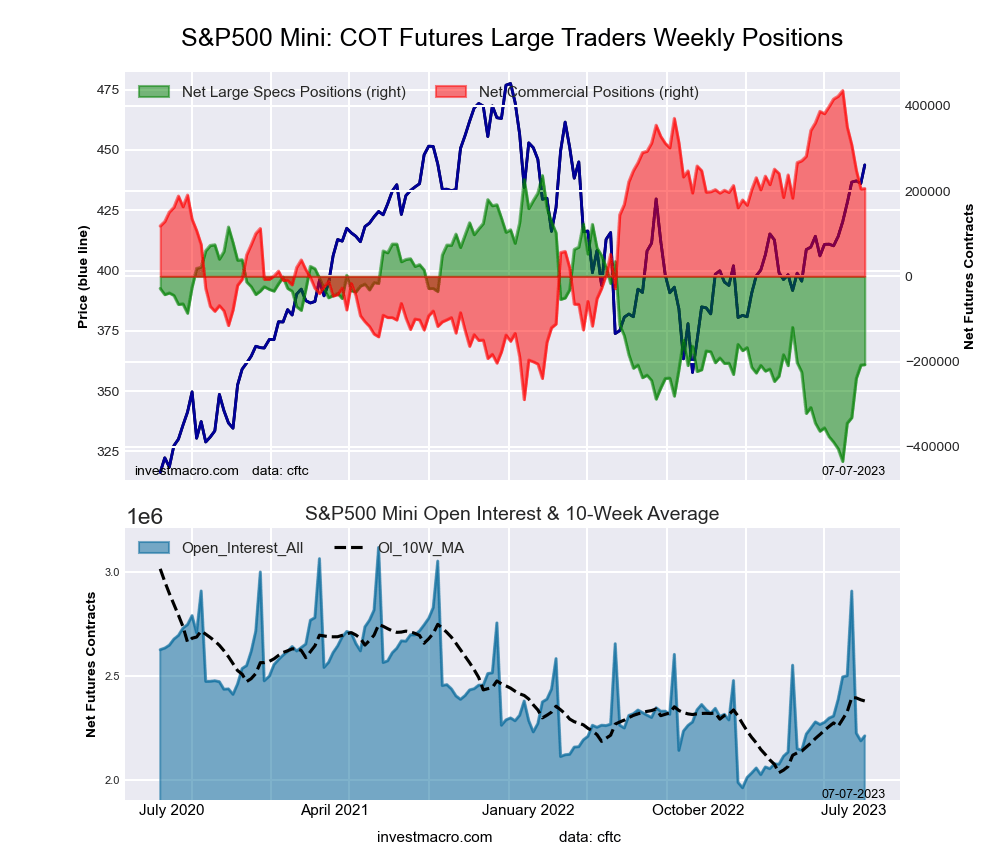
SP500 Mini Futures COT ChartThe S&P500 Mini large speculator standing this week totaled a net position of -239,331 contracts in the data reported through Tuesday. This was a weekly increase of 92,082 contracts from the previous week which had a total of -331,413 net contracts.

This week’s current strength score (the trader positioning range over the past three years, measured from 0 to 100) shows the speculators are currently Bearish with a score of 29.1 percent. The commercials are Bullish with a score of 74.2 percent and the small traders (not shown in chart) are Bearish with a score of 40.9 percent.

Price Trend-Following Model: Strong Uptrend

Our weekly trend-following model classifies the current market price position as: Strong Uptrend. The current action for the model is considered to be: Hold – Maintain Long Position.

S&P500 Mini Futures StatisticsSPECULATORSCOMMERCIALSSMALL TRADERS
– Percent of Open Interest Longs:9.577.210.9
– Percent of Open Interest Shorts:20.266.011.4
– Net Position:-239,331248,779-9,448
– Gross Longs:210,2301,716,868243,154
– Gross Shorts:449,5611,468,089252,602
– Long to Short Ratio:0.5 to 11.2 to 11.0 to 1
NET POSITION TREND:
– Strength Index Score (3 Year Range Pct):29.174.240.9
– Strength Index Reading (3 Year Range):BearishBullishBearish
NET POSITION MOVEMENT INDEX:
– 6-Week Change in Strength Index:20.4-20.64.4


Dow Jones Mini Futures:

Dow Jones Mini Futures COT ChartThe Dow Jones Mini large speculator standing this week totaled a net position of -15,859 contracts in the data reported through Tuesday. This was a weekly decline of -279 contracts from the previous week which had a total of -15,580 net contracts.

This week’s current strength score (the trader positioning range over the past three years, measured from 0 to 100) shows the speculators are currently Bearish with a score of 29.0 percent. The commercials are Bullish with a score of 67.2 percent and the small traders (not shown in chart) are Bearish with a score of 41.0 percent.

Price Trend-Following Model: Strong Uptrend

Our weekly trend-following model classifies the current market price position as: Strong Uptrend. The current action for the model is considered to be: Hold – Maintain Long Position.

Dow Jones Mini Futures StatisticsSPECULATORSCOMMERCIALSSMALL TRADERS
– Percent of Open Interest Longs:22.062.314.5
– Percent of Open Interest Shorts:40.043.615.1
– Net Position:-15,85916,453-594
– Gross Longs:19,33554,79812,713
– Gross Shorts:35,19438,34513,307
– Long to Short Ratio:0.5 to 11.4 to 11.0 to 1
NET POSITION TREND:
– Strength Index Score (3 Year Range Pct):29.067.241.0
– Strength Index Reading (3 Year Range):BearishBullishBearish
NET POSITION MOVEMENT INDEX:
– 6-Week Change in Strength Index:11.7-17.120.9


Nasdaq Mini Futures:

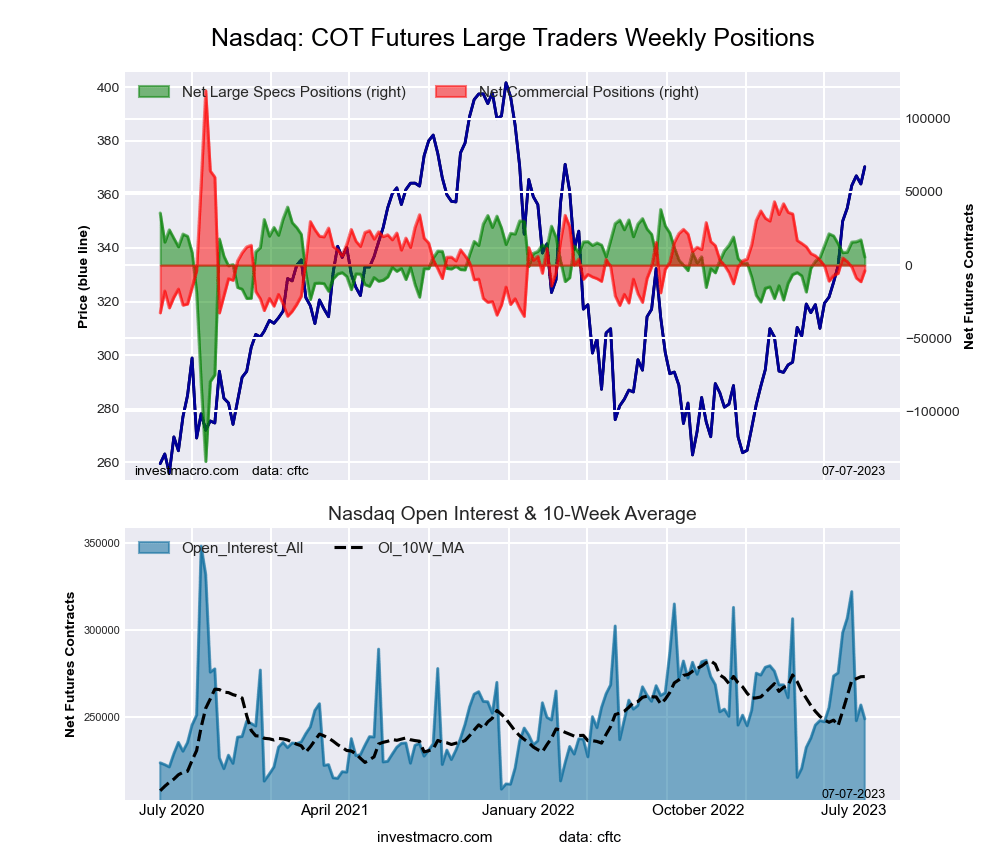
Nasdaq Mini Futures COT ChartThe Nasdaq Mini large speculator standing this week totaled a net position of 15,993 contracts in the data reported through Tuesday. This was a weekly advance of 313 contracts from the previous week which had a total of 15,680 net contracts.

This week’s current strength score (the trader positioning range over the past three years, measured from 0 to 100) shows the speculators are currently Bullish-Extreme with a score of 84.0 percent. The commercials are Bearish with a score of 21.0 percent and the small traders (not shown in chart) are Bearish with a score of 40.1 percent.

Price Trend-Following Model: Strong Uptrend

Our weekly trend-following model classifies the current market price position as: Strong Uptrend. The current action for the model is considered to be: Hold – Maintain Long Position.

Nasdaq Mini Futures StatisticsSPECULATORSCOMMERCIALSSMALL TRADERS
– Percent of Open Interest Longs:29.153.315.9
– Percent of Open Interest Shorts:22.656.918.8
– Net Position:15,993-8,872-7,121
– Gross Longs:71,956132,04039,361
– Gross Shorts:55,963140,91246,482
– Long to Short Ratio:1.3 to 10.9 to 10.8 to 1
NET POSITION TREND:
– Strength Index Score (3 Year Range Pct):84.021.040.1
– Strength Index Reading (3 Year Range):Bullish-ExtremeBearishBearish
NET POSITION MOVEMENT INDEX:
– 6-Week Change in Strength Index:-3.01.36.2


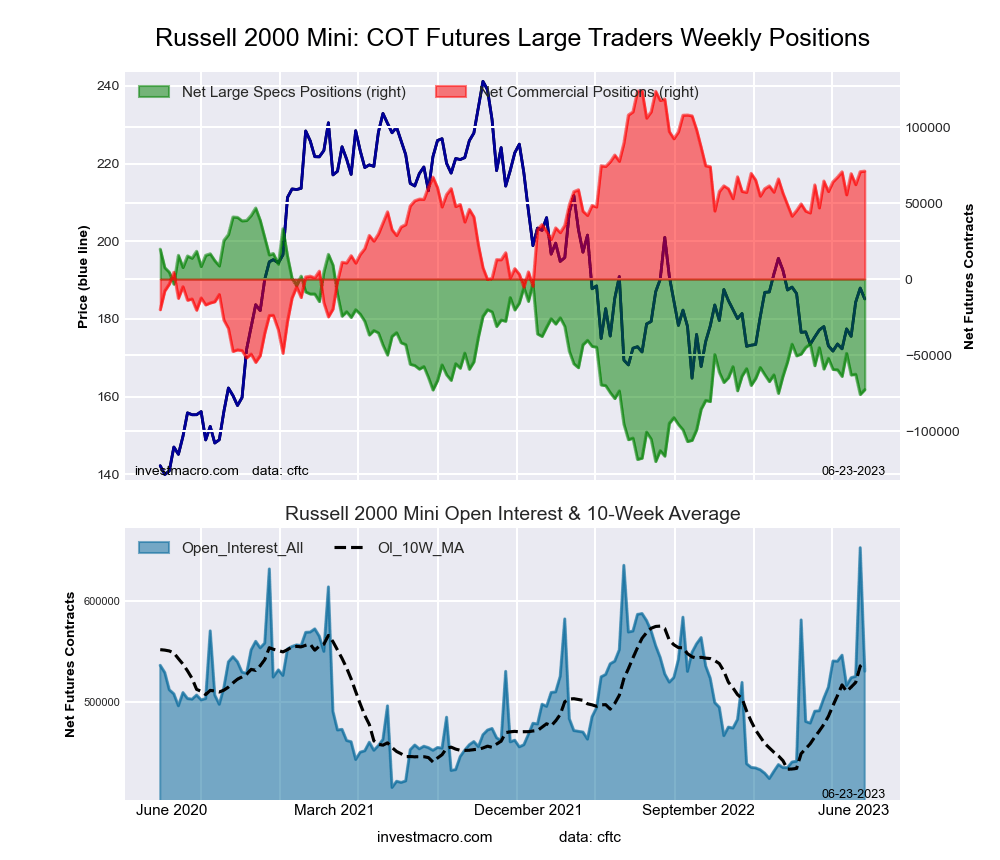
Russell 2000 Mini Futures:

Russell 2000 Mini Futures COT ChartThe Russell 2000 Mini large speculator standing this week totaled a net position of -72,709 contracts in the data reported through Tuesday. This was a weekly lift of 3,187 contracts from the previous week which had a total of -75,896 net contracts.

This week’s current strength score (the trader positioning range over the past three years, measured from 0 to 100) shows the speculators are currently Bearish with a score of 28.3 percent. The commercials are Bullish with a score of 70.3 percent and the small traders (not shown in chart) are Bearish with a score of 31.9 percent.

Price Trend-Following Model: Weak Downtrend

Our weekly trend-following model classifies the current market price position as: Weak Downtrend. The current action for the model is considered to be: Hold – Maintain Short Position.

Russell 2000 Mini Futures StatisticsSPECULATORSCOMMERCIALSSMALL TRADERS
– Percent of Open Interest Longs:9.684.64.5
– Percent of Open Interest Shorts:23.371.24.2
– Net Position:-72,70970,9941,715
– Gross Longs:51,027449,03324,098
– Gross Shorts:123,736378,03922,383
– Long to Short Ratio:0.4 to 11.2 to 11.1 to 1
NET POSITION TREND:
– Strength Index Score (3 Year Range Pct):28.370.331.9
– Strength Index Reading (3 Year Range):BearishBullishBearish
NET POSITION MOVEMENT INDEX:
– 6-Week Change in Strength Index:-7.82.228.0


Nikkei Stock Average (USD) Futures:

Nikkei Stock Average (USD) Futures COT ChartThe Nikkei Stock Average (USD) large speculator standing this week totaled a net position of -7,029 contracts in the data reported through Tuesday. This was a weekly decline of -421 contracts from the previous week which had a total of -6,608 net contracts.

This week’s current strength score (the trader positioning range over the past three years, measured from 0 to 100) shows the speculators are currently Bearish with a score of 23.2 percent. The commercials are Bullish with a score of 68.7 percent and the small traders (not shown in chart) are Bearish with a score of 48.9 percent.

Price Trend-Following Model: Strong Uptrend

Our weekly trend-following model classifies the current market price position as: Strong Uptrend. The current action for the model is considered to be: Hold – Maintain Long Position.

Nikkei Stock Average Futures StatisticsSPECULATORSCOMMERCIALSSMALL TRADERS
– Percent of Open Interest Longs:13.261.125.7
– Percent of Open Interest Shorts:55.129.016.0
– Net Position:-7,0295,3921,637
– Gross Longs:2,21410,2544,319
– Gross Shorts:9,2434,8622,682
– Long to Short Ratio:0.2 to 12.1 to 11.6 to 1
NET POSITION TREND:
– Strength Index Score (3 Year Range Pct):23.268.748.9
– Strength Index Reading (3 Year Range):BearishBullishBearish
NET POSITION MOVEMENT INDEX:
– 6-Week Change in Strength Index:-28.323.46.1


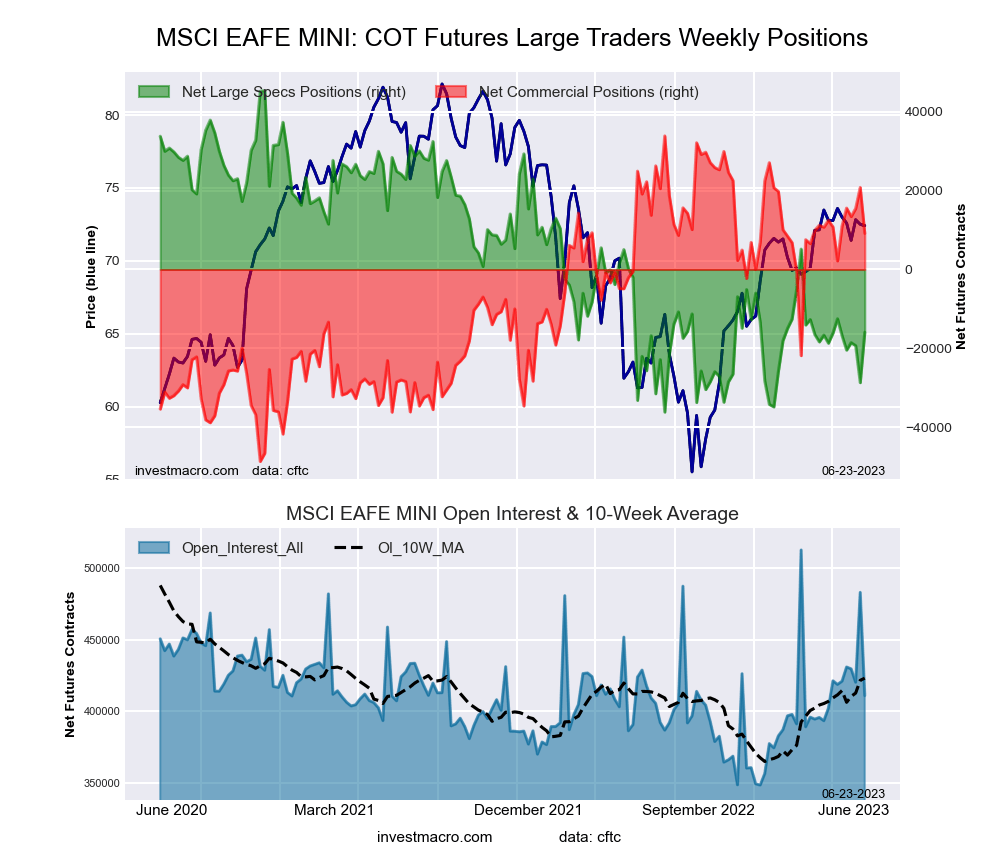
MSCI EAFE Mini Futures:

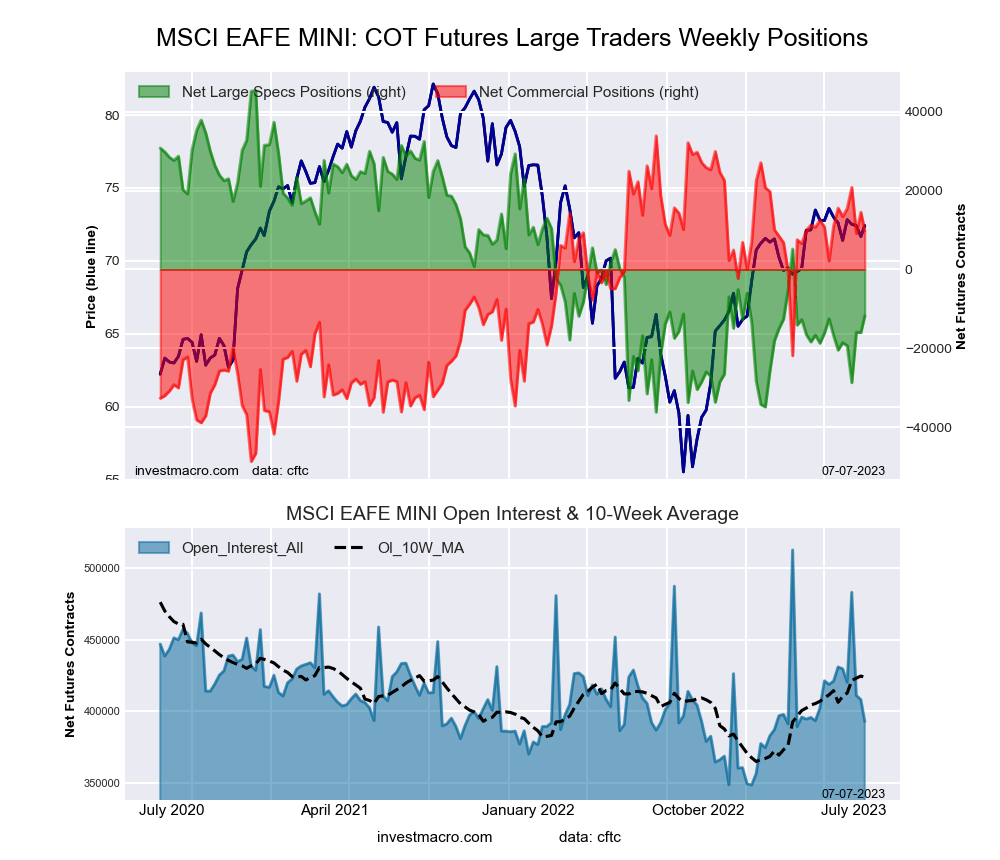
MSCI EAFE Mini Futures COT ChartThe MSCI EAFE Mini large speculator standing this week totaled a net position of -15,922 contracts in the data reported through Tuesday. This was a weekly boost of 12,769 contracts from the previous week which had a total of -28,691 net contracts.

This week’s current strength score (the trader positioning range over the past three years, measured from 0 to 100) shows the speculators are currently Bearish with a score of 24.8 percent. The commercials are Bullish with a score of 70.1 percent and the small traders (not shown in chart) are Bullish with a score of 50.8 percent.

Price Trend-Following Model: Uptrend

Our weekly trend-following model classifies the current market price position as: Uptrend. The current action for the model is considered to be: Hold – Maintain Long Position.

MSCI EAFE Mini Futures StatisticsSPECULATORSCOMMERCIALSSMALL TRADERS
– Percent of Open Interest Longs:5.790.72.9
– Percent of Open Interest Shorts:9.688.51.2
– Net Position:-15,9229,1456,777
– Gross Longs:23,336372,95311,738
– Gross Shorts:39,258363,8084,961
– Long to Short Ratio:0.6 to 11.0 to 12.4 to 1
NET POSITION TREND:
– Strength Index Score (3 Year Range Pct):24.870.150.8
– Strength Index Reading (3 Year Range):BearishBullishBullish
NET POSITION MOVEMENT INDEX:
– 6-Week Change in Strength Index:-4.28.4-17.6


Article By InvestMacroReceive our weekly COT Newsletter

*COT Report: The COT data, released weekly to the public each Friday, is updated through the most recent Tuesday (data is 3 days old) and shows a quick view of how large speculators or non-commercials (for-profit traders) were positioned in the futures markets.

The CFTC categorizes trader positions according to commercial hedgers (traders who use futures contracts for hedging as part of the business), non-commercials (large traders who speculate to realize trading profits) and nonreportable traders (usually small traders/speculators) as well as their open interest (contracts open in the market at time of reporting). See CFTC criteria here.


Caution: likely market correction, opportunity to invest in quality companies

By George Prior 

Stock markets are likely to fall this summer, which will provide investors a key buying opportunity to enhance their portfolios, says the CEO and founder of one of the world’s largest independent financial advisory, asset management and fintech organizations.

Nigel Green of deVere Group’s comments come as UK inflation exceeds expectations in May and as the US Federal Reserve Chair Jerome Powell confirms that interest rate hikes should be expected as inflation is “well above” where it should be.

Mr Powell stated: “Inflation pressures continue to run high, and the process of getting inflation back down to 2% has a long way to go.”

Meanwhile, UK inflation on Wednesday was higher than expected in May, as consumer prices climbed by an annual 8.7% – considerably higher than the Bank of England’s 2% target.

The deVere CEO observes: “Inflation remains high and sticky – surprisingly so – in most major developed economies.

“This puts fresh pressure on central banks to maintain interest rate hikes, or drop the pause in the case of the US Fed.”

Higher borrowing costs impact corporate profits as companies may face higher interest expenses on their existing debt or find it more expensive to finance new projects. This typically leads to a decrease in investor confidence and a decline in stock prices.

Interest rate jumps can discourage consumer borrowing and spending. When borrowing costs increase, individuals may be less willing to take on new loans for purchases such as homes, cars, or other consumer goods. This reduced consumer spending can negatively affect the earnings and profitability of businesses, leading to a decrease in stock prices.

In addition, rising interest rates make fixed-income investments, such as bonds, more attractive relative to stocks. As bond yields increase, investors may reallocate their investments from stocks to bonds, seeking higher returns with less risk.

“Therefore, investors should be cautious as we expect stock market corrections this summer,” says Nigel Green.

“This would present major buying opportunities for investors to enhance their portfolios with quality stocks at lower entry points.

“They’ll be speaking with financial advisors about potential winners and losers from such a fall.”

US stocks were down on Wednesday, with the S&P 500 and the Nasdaq dipping around 0.4%, while the Dow Jones shed 0.3%. In the UK, the benchmark FTSE 100 fell to a three-week low.

Against a backdrop of still sticky-high inflation, sectors that do well in a stagflationary environment should also be included in portfolios.

“These include commodities, such as oil, as their prices typically rise in response to inflation; consumer staples like food, and hygiene products, as demand is likely to remain relatively stable; healthcare, as it provides essential services that are less affected by economic cycles; and utilities, including electricity, gas, and water as demand will also be pretty consistent,” noted the deVere CEO recently.

“Investors should, as always, remain diversified across asset classes, sectors and regions in order to maximise returns per unit of risk (volatility) incurred.”

He concludes: “We expect further and intensifying market volatility this summer.  This will be used, as it always is, by investors to bolster their investment portfolios.

“This can prove to be an extremely effective strategy, but advice should be sought from a quality fund manager.”

About:

deVere Group is one of the world’s largest independent advisors of specialist global financial solutions to international, local mass affluent, and high-net-worth clients.  It has a network of more than 70 offices across the world, over 80,000 clients and $12bn under advisement.

Mid-Week Technical Outlook: Indices & Commodities

By ForexTime 

A sense of unease gripped financial markets on Wednesday as concerns over China’s growth outlook and sticky UK inflation data left investors on edge ahead of Jerome Powell’s testimony to Congress.

Market players are likely to adopt a guarded approach towards riskier assets amid the cautious mood, resulting in markets trading in tight ranges until a fresh catalyst is brought into the picture. As discussed throughout the week, Jerome Powell is widely expected to reiterate comments from his post-Fed meeting press conference, opening the doors to further rate hikes. If expectations match reality with fresh clues offered on rate hike timings, this could spark volatility across financial markets.

Here are some technical setups to keep an eye on this week:

SPX500_m under pressure

It has been a rough week for the SPX500_m thanks to the risk-off mood and overall caution. Bears seem to be on the prowl with prices slowly approaching the 4351 level. Although the trend still remains bullish on the daily charts, this outlook could be threatened if a solid breakdown and daily close below 4351 is achieved. Such a development could signal a further decline towards 4300. If prices are able to push beyond last week’s high of 4451.5, the next key level can be found at 4500.

NQ100_m breakout pending?

The NQ100_m remains in an uptrend on the daily charts. There have been consistently higher highs and higher lows while prices are trading above the 200-, 100- and 50-day SMA. The price action over the past few days suggests that the index could be waiting for a fresh fundamental spark before embarking on its next move. A solid breakout above 15300 could trigger an incline towards levels not seen since January 2022 around 15700. Should prices remain trapped below 15300, this may see the index sink towards 14670.

STOX50 capped below 4430?

It has been a choppy affair for the STOX50 with prices trapped within a wide range. Strong resistance can be found at 4430 while support can be seen at 4280 and 4230. Should bears switch into higher gear, this may drag prices back toward the 100-day SMA at 4280 and lower. Alternatively, a breakout above 4430 could propel prices to levels not seen since mid-2007 around 4500.

UK100 breakout on horizon…

The UK100 could be gearing up for a major breakout as prices bounce with a tightening range on the daily charts. Support can be found just above the 200-day SMA at 7550 and resistance around 7650. Should prices break above 7650, this could encourage an incline towards 7690 and 7740, where the 100-day SMA can be found. A breakdown below 7550 could see prices sink towards 7440.

Crude rangebound…

Oil prices remain trapped within a range on the daily charts with support at $67.00 and resistance at $74.40. A solid daily close below $67.00 may open the doors toward $64.50. Should prices push above $74.00, this could encourage an incline toward $76.80.

Calm before gold storm?

Gold prices remain under pressure ahead of Jerome Powell’s two-day hearings before Congress which kicks off today. Despite trading within a range on the daily timeframe, the scales of power seem to be swinging in favour of gold bears. A breakdown below $1932 could open a path toward $1893. Alternatively, a rebound back above $1959 may see prices retest the $1985 resistance. Should prices break above $1985, the next key level of interest can be found at $2000.


Forex-Time-LogoArticle by ForexTime

ForexTime Ltd (FXTM) is an award winning international online forex broker regulated by CySEC 185/12 www.forextime.com