Archive for Stock Market News – Page 28

Euro Stoxx 600: “Following the Script”

“If the 2007 analogue holds, the current rally [will] persist …”

By Elliott Wave International

On Oct. 24, 2022, Bloomberg said:

Forget about a Santa rally to rescue European stocks from their doldrums, say strategists from Goldman Sachs Group Inc. to Bank of America Corp.

A week and a half later, our November 2022 Global Market Perspective offered a different view:

If the 2007 analogue holds, the current rally [will] persist …

As it turned out, not only did the rally in the Euro Stoxx 600 persist through the holiday season, it carried well into 2023.

The just-published July Global Market Perspective, an Elliott Wave International publication which offers forecasts for 50-plus financial markets, provided an update with these charts and commentary [keep in mind that wave labels are available to subscribers]:

The charts bring the forecast up to date. In April and May, the Stoxx 600 briefly exceeded its 75% retracement level. On June 18, prices fell back below it and have yet to look back. The wave structure shows a complete zigzag at the May 19 high (see Elliott Wave Principle, p. 41, for the definition of a zigzag). A decline beneath the wave B low … will confirm the onset of [the next Elliott wave] down.

The July Global Market Perspective mentions that specific price level which will confirm the next sizeable leg down.

Do know that not all our forecasts work out so well. At the same time, the Elliott wave model is the best analytical tool of which we’re aware so we’ll continue to base our forecasts on the repetitive patterns of investor psychology.

As Frost & Prechter noted in Elliott Wave Principle: Key to Market Behavior:

The Wave Principle is governed by man’s social nature, and since he has such a nature, its expression generates forms. As the forms are repetitive, they have predictive value.

Check Out These 5 Elliott Wave Setups — That EVERY Investor Needs to See NOW

Elliott Wave International’s Waves in Europe event is underway!

Now through July 21, EWI’s resident global market experts, Brian Whitmer and Murray Gunn, will show you 5 compelling Elliott wave setups for Europe’s biggest markets — opportunities that may be floating under your radar.

Even if you don’t invest in Europe, we encourage you to join. Brian and Murray are among the very best Elliott wave forecasters in the world. If you care about the markets, you shouldn’t miss this.

FREE, join EWI’s Waves in Europe event (easily a $99 value) >>

This article was syndicated by Elliott Wave International and was originally published under the headline Euro Stoxx 600: “Following the Script”. EWI is the world’s largest market forecasting firm. Its staff of full-time analysts led by Chartered Market Technician Robert Prechter provides 24-hour-a-day market analysis to institutional and private investors around the world.

Robert Prechter Interview for the Ages: Quick Takes on Big Financial Trends

‘That’s not even the craziest indicator on this chart. Look at the bottom graph.’

By Elliott Wave International

Robert Prechter’s June 23 interview with GoldSeek.com, which is under 15 minutes, covers a variety of financial topics.

They include stocks with an emphasis on the technology sector (including artificial intelligence), bitcoin, gold and silver, corporate bonds and the prospects for deflation.

You can look below to learn how to listen to the entire interview for free.

But, first, let me share with you just one of the interview topics, and that’s the stock-market sentiment which was on display leading up to the January 2022 top in the blue-chip indexes.

Relatedly, in the GoldSeek interview, Robert said:

Sentiment indicators… can tell you the extent to which [people] are extremely optimistic or pessimistic. Well, 2021 was a year like no other. Finally, in December 2021, I put out an issue called “A Stock Market Top for the Ages.”

Here’s one of the sentiment charts that the December 2021 Elliott Wave Theorist showed along with the commentary (The Elliott Wave Theorist is a monthly publication which covers major financial and cultural trends):

NaryBear

The middle graph is the ratio between the amount of money that Rydex investors have put into bullish funds versus bearish funds. Look toward the left, and you’ll see the words “normal range.”

[Fifteen] years ago, the ratio was around 1:1 or 2:1… In general there was a bit more money in bull funds than in bear.

Investors have been going crazy in the last five years. On November 19, the ratio reached 62:1…

That’s not even the craziest indicator on this chart. Look at the bottom graph, which depicts the ratio of leveraged bullish funds versus leveraged bearish funds. It shows that there is 82 times as much money in the leveraged bullish funds as there is in the leveraged bearish funds.

So, it wasn’t surprising that the Dow Industrials and the S&P 500 index topped early in the very next month.

Getting back to the GoldSeek interview, learn how you can access it for free by following the link.

This article was syndicated by Elliott Wave International and was originally published under the headline Robert Prechter Interview for the Ages: Quick Takes on Big Financial Trends. EWI is the world’s largest market forecasting firm. Its staff of full-time analysts led by Chartered Market Technician Robert Prechter provides 24-hour-a-day market analysis to institutional and private investors around the world.

UK100_m soars on easing UK inflation

By ForexTime

  • UK100_m tracks FTSE 100 index which measures 100 largest UK stocks
  • Lower-than-expected UK inflation = lowered bets for BOE rate hikes = Pound falls
  • Weaker GBP improves earnings outlook for FTSE 100 companies, pushing UK100_m higher
  • Technical analysis points to 4 potential upside targets for UK100_m


The UK100_m has resurfaced above the psychologically-important 7500 level after today’s UK inflation data came in below market expectations.

Looking at the price charts, the UK100_m index ascent is significant, given that it’s gone above several notable price levels:

  • the upper bound of its downtrend since April (broken out of the multi-month downtrend)
  • a key Fibonacci level from its October 2022 – February 2023 ascent
  • its early-July cycle high of 7565.2

NOTE: The UK100_m tracks the FTSE 100 index (the benchmark used to measure the performance of blue-chip UK stocks).


Latest UK CPI: What you need to know

The UK’s consumer price index (CPI) measures headline inflation – the change in prices that UK consumers pay for goods and services.

The CPI rose by 7.9% in June 2023 compared to June 2022 (year-on-year).

This is the first time that the headline CPI number has dropped below the 8% mark since March 2022!

  • June’s 7.9% figure was also lower than the market’s forecast of 8.2%.
  • June’s CPI growth of 7.9% was also below May’s 8.7% year-on-year figure.

This shows that UK inflation is slowing noticeably, compared to the double-digit figures posted on most months between July 2022 till March 2023, a period when the CPI peaked at 11.1% last October.


What does the lower-than-expected CPI data mean for the BOE?

Markets have now greatly reduced their bets for future rate hikes by the Bank of England (BOE).

Note that the BOE has already raised its benchmark rate by 490 basis points since December 2021.

That’s the BOE’s most aggressive series of rate-hikes since the late-1980s: the same decade when UK CPI was also posting double-digit figures.

The aim for these rate hikes is to subdue UK inflation.

And judging by today’s data release, it appears to be working.


Looking ahead, here’s what markets are predicting at the time of writing as for the BOE’s next moves:

  • a less-than-even (43.8%) chance of a larger 50-basis point (bp) hike at the upcoming BOE rate decision due August 3rd.
  • a less-than-even (44.7%) chance that the BOE can even proceed with 100-bps in hikes before UK interest rates peak at around 5.8%.

Compare the above odds with what markets had predicted before today’s UK CPI data announcements:

  • 69% chance of a 50-bps hike by the BOE in early August
  • fully expected a total of 100-bps in hikes by the BOE by May 2024, with a 1-in-3 chance of the total remaining hikes being 125 basis points to send the benchmark rate above 6%!


Hence, with the slashing of the odds surrounding BOE rate hikes, no surprise that the British Pound is weaker today against all of its G10 peers, except for the Japanese Yen:

NOTE: A currency tends to weaken when markets expect that interest rates in that country won’t/can’t move much higher. 


GBPUSD has returned below the psychologically-important 1.300 mark.


How does the Pound affect the UK100_m?

Note that British Pound has an inverse relationship with the UK100_m.

That means that when GBP weakens, then the UK100_m tends to strengthen, and vice versa.

Consider this:

  • GBP is the second-best performing G10 currency against the US dollar so far in 2023.
    GBPUSD has a year-to-date advance of over 7%, even after today’s declines.
  • On the other hand, the FTSE 100 index is a clear laggard among benchmark stock indices in developed markets.
    The FTSE 100 has climbed a “mere” 8.7% so far this year, while the likes of the S&P 500, the Euro Stoxx 50, and the Nikkei 225 have all risen by double-digits so far this year!

Generally speaking, this inverse relationship between GBPUSD and the UK100_m has shown up 92% of the time on a 3-day rolling period over the past 30 years (according to Bloomberg’s correlation data).


This inverse relationship is due to the fact that companies listed on the FTSE 100 index gets more than 80% of their revenue collectively from outside of the UK, as of October 2022 according to FTSE Russell.

Hence, a weaker Sterling tends to translate into more earnings, in GBP terms, for these FTSE 100 companies.

No surprise then that the UK100_m is climbing higher as GBPUSD is falling.


Technical Perspective: What’s next for UK100_m?

With the forming of a new higher top today, four price targets can be calculated from there.

Attaching the Fibonacci tool to the top at 7565.3 price level and dragging it to a bottom that formed on 7 July at 7222.3, the following potential targets were established:

  • Potential Target 1: 7702.5
  • Potential Target 2: 7771.1
  • Potential Target 3: 7908.3
  • Potential Target 4: 8079.8

If the bearish momentum exceeds the bullish, this could cause the price to sharply depreciate below the critical support level that formed on 7 July at 7222.3, consequently invalidating the long setup and triggering a sell signal.

However, from a fundamental perspective, UK100_m bulls (those hoping prices will move higher) would need a drastically weakening GBP, perhaps by way of a shocking announcement by the BOE that its rate hikes are to be soon halted, in order for the UK100_m to attain the psychologically-important 8,000 mark.


The above scenario is based on the FXTM Signals that are posted twice a day (before the London and New York sessions) for all FXTM clients.

This can be accessed from the MyFXTM profile, within the Trading Services section (left-hand bar).


Forex-Time-LogoArticle by ForexTime

ForexTime Ltd (FXTM) is an award winning international online forex broker regulated by CySEC 185/12 www.forextime.com

Earnings from ‘Magnificent Seven’ will determine stock markets’ path for 2023

By George Prior 

All eyes are on ‘The Magnificent Seven’ in this earnings seasons, with Tesla reporting on Wednesday, as these stocks will determine the market’s performance for the rest of this year and into 2024.

This is the assessment of Nigel Green, CEO of deVere Group, one of the world’s largest independent financial advisory, asset management and fintech organizations, as Apple, Microsoft, Alphabet, Amazon, Nvidia, Tesla and Meta Platforms, all report Quarter 2 earnings in the next week or so.

He says: “Investors around the world will be pouring over the earnings and guidance reports of these major growth and tech names in the next few days.

“These mega cap companies’ values have jumped between 40% and 200% so far this year.

“These jumps have accounted for the bulk of the S&P 500’s 17% year-to-date advance and pushed-up the main stock market in the world’s largest economy to its highest level since April 2022.

“On the S&P 500, the seven stocks make up almost 30% of the index’s weight.

“Therefore, their earnings and guidance will, we expect, determine the market’s trajectory for the rest of this year and into 2024.”

The deVere CEO continues: “The Magnificent Seven are going to need robust earnings to explain their sky-high valuations.

“In addition, they will need the guidance to indicate future quarters to be higher than aniticpated for shareholders to receive additional gains. Should this not happen, we could see these stocks shed some of the advances.”

Tesla and Netflix will be the ones to watch on Wednesday. Microsoft and Meta are among those reporting next week.

Recently Nigel Green warned that the volume is “getting louder” and the “frenzy is reaching fever pitch” about the so-called Magnificent Seven stocks.

“This hype is dangerous as it could lead investors to assume that these stocks are a silver bullet to build long-term wealth – and they are not, at least not on their own.

“While I believe that exposure to these mega-cap tech stocks should be part of almost every investor’s portfolio, as they have robust fundamentals and are future-focused, especially in AI, they should not be exclusive.”

The deVere CEO concludes: “Such is their weight, the Magnificent Seven earnings we receive in the next week or so will set global investors’ portfolio positioning for the foreseeable future.”

About:

deVere Group is one of the world’s largest independent advisors of specialist global financial solutions to international, local mass affluent, and high-net-worth clients.  It has a network of more than 70 offices across the world, over 80,000 clients and $12bn under advisement.

Trade Of The Week: What Next For SPX500_m?

By ForexTime 

The S&P 500 has gained roughly 17% year-to-date, fuelled by the AI mania that magnetized investors toward a handful of big tech names.

After hitting a fresh 2023 high last week thanks to the cooler-than-expected US inflation data, US equity bulls are certainly in the building.

The strong earning results from big Wall Street banks last Friday could support upside gains, possibly pushing the S&P 500 higher. However, this is likely to be influenced by fresh fundamental and technical forces over the next few days. Taking a quick look at the technical picture, the index remains in a firm uptrend on the daily charts. The daily close above 4500 could encourage an incline towards 4580. Should prices slip back under 4500, bears could target 4463.

This could be another volatile week for the SPX500_m and here are 3 reasons why:

  1. US earnings season 

Earnings season is set to enter a busy week as the focus falls on large-cap companies. The likes of Bank of America, Morgan Stanley, Goldman Sachs, Netflix, and Tesla among others will announce their quarterly results. These results are likely to be closely scrutinized by investors for more insight into the health of the economy and corporate America. It may be wise to keep an eye on Tesla which is within the top 5 holdings in the S&P 500. The company is set to post its Q2 results on July 19 after the closing bell.

Ultimately, if the company earnings impress and stimulate risk appetite, this could propel the SPX500_m towards a fresh 2023 high beyond 4530. Alternatively, a set of disappointing earnings could see the index experience a decline back towards 4463 and potentially lower.

  1. Key US economic data

Some key US economic releases may influence the S&P 500 this week.

On Monday, the US Empire manufacturing will be in focus. Attention will be directed toward the key US retail sales and industrial production figures on Tuesday which could provide fresh insight into the health of the largest economy in the world. Thursday sees the US initial jobless claims which have the potential to impact Fed hike expectations.

  • If overall US economic data disappoints, this could fuel expectations around the Federal Reserve pausing rates beyond July – a development that will be welcomed by US equity bulls.
  • A solid set of economic reports could strengthen the argument around US rates remaining higher for longer – a scenario that may drag the SPX500_m lower.
  1. Technical forces

As highlighted earlier, the SPX500_m remains in a bullish trend on the daily timeframe. There have been consistently higher highs and higher lows while prices are trading above the 50, 100, and 200-day SMA. Should 4500 prove to be reliable support, this could springboard prices towards 4580 and 4640, respectively. Should prices slip back below 4500, bulls still have a chance to fight back if 4463 becomes a reliable support. A scenario where prices slip below 4463 may trigger a selloff towards 4390 and 4332, respectively.

Zooming out on the weekly timeframe, bulls seem to be building momentum after securing a weekly close above past resistance at 4332. Although prices are respecting a weekly bullish channel, the weekly Relative Strength Index (RSI) signals that prices are flirting around overbought levels. A solid breakout above 4500 may pave a path to higher levels with 4640 and 4800 acting as key points of interest. Alternatively, if 4500 proves to be a tough nut to crack, prices may slip back towards 4332 and lower.


Forex-Time-LogoArticle by ForexTime

ForexTime Ltd (FXTM) is an award winning international online forex broker regulated by CySEC 185/12 www.forextime.com

Tesla’s New Competition

Source: Ron Struthers  (7/12/23)

Ron Struthers has followed Tesla since its infancy and says hydrogen fuel cells and vehicles will be the next big rage, and he sees huge growth in green energy transportation. Struthers discusses one company that he believes has lined up all the ducks in order to benefit.

I have followed Tesla since the early days, suggesting to buy or sell the stock numerous times. My last suggestion was a buy In January around $113. See my January Seeking Alpha article here, called “A Perfect Storm Hits Tesla in 2022.” I think the stock will test $300 so around $295 I will probably suggest selling.

The battery driven EVs have been all the rage with the “climate change” narrative; however, they are not a good enough solution. They are fine for commuters and those driving low daily mileage, but where they fail big time is higher mileage like the transport industry, as an example. A friend had a recent discussion with an Uber driver in Vancouver, Canada, about why he was not driving an EV. He said they are not practical because of battery charge life and long wait and charge times, especially in the colder months when the efficiency of the EVs drops -50% and more.

I did an in-depth article on the charging of EVs, the costs and efficiency. You will be surprised, so here a few tidbits from that analysis.

  • The average price to charge a 60-kilowatt-hour Tesla Model 3 at home is US$6.83, while it’s $8.88 for Volvo XC40 Recharge with a a 78-kWh battery pack and $14.92 for a Ford F-150 Lightning with its larger 131 kWh battery;
  • A big catch is that price is based on US$0.11 per-KWh. Where I am in Ontario the average is around Cdn $0.20. California is high at US$0.29 and the U.S. state average is US$0.16;
  • It will take a week to charge your EV at home unless you fork out about $2,000 to install a level 2 charger in your garage that will charge overnight in 8 to 12 hours, depending on battery size;
  • High-speed charging at Electrify America, meanwhile, costs something on the order of US$0.41 per kWh. Some Tesla Superchargers are charging as much as US$0.50 per kWh. That would mean your $6.83 at- home Tesla Model 3 charge would instead cost US$30, while that $14.92 Lightning fill-up jumps to $53.71;
  • The EVs mileage sucks big time in cold weather, so for almost half the year in Canada and northern US. Car.com did a road test with a Tesla Model Y and the range dropped over 50% at 0 to 5 degrees Fahrenheit.

I compared the fueling costs of a Tesla Model 3 with two other comparable luxury sedans, BMW 3 and the Jaguar XE. I used the EPA [Environmental Protection Agency] ratings on these cars. Plus you will pay a higher price for the Tesla and I did not include the cost of a Level 2 charger, so charging cost is at charging stations. I used $3 per gallon gasoline as that is about the current going rate where I am in Florida at that time.

Car                               Summer                                  Winter
Tesla Model 3            11.2 cents/mile                  15.8 cents/mile
BMW 3 Series (gas)  10.4 cents/mile                  10.4 cents/mile
Jaguar XE (gas)        10.4 cents/mile                  10.4 cents/mile

The battery technology has a long way to go yet. Weight of the batteries is another issue. I have seen estimates that one-third of the payload of a transport truck would have to be the batteries to move it. Hydrogen is going to be a much better solution in many cases and it is in it’s infancy like Tesla and EVs in the early days. There are numerous hydrogen test vehicles doing trials and there are few hydrogen filling stations like there were few charging stations six or seven years ago. The U.S. had about 3,000 charging stations in 2016 and 22,000 in 2021.

There are very few hydrogen stations, but they are coming. I saw news this week that a new one is being built at Toronto Airport. Geazone, a British Columbia courier company, recently ordered 40 Toyota Mirais because they are well served by four strategically located hydrogen refueling stations. The British Columbia government has committed $10 million to build more. Meanwhile, there are now some 47 hydrogen refueling stations in California.

Let’s compare hydrogen to batteries.

A modern car battery can store 250 watt-hours of energy for every kilogram of lithium-ion. A kilogram of hydrogen, meanwhile, has 33,200 of those watt-hour things per kilo. Yes, hydrogen is more than 100 times as energy-dense as a li-ion battery. The batteries will improve some but that won’t be much of a factor in this regard. Hydrogen vehicles will be far lighter than the battery-loaded EVs as well.

Hydrogen is only about 38% efficient versus 80% for lithium batteries The difference is in how the two process electricity. For hydrogen to be as emissions-free as a battery-powered car, you need to electrolyze the water — splitting H2O into, well, H2 and O — with clean wind, solar, or nuclear power. This electrolysis is not nearly as efficient as simply charging a battery. Similarly, in the fuel cell itself, the H2 and O must be recombined to generate electricity. This process, again, is not nearly as efficient as a battery dumping its electrons.

The newer electric cars are capable of achieving an 80% charge in around 30 minutes. However a fuel cell EV (FCEV) is like filling a gasoline car being fueled in under four minutes and can travel around 300 miles on a single tank. Hydrogen is a big winner here!

There are longer term environmental problems with EVs. Thousands of new mines will have to be built for battery metals. ln the Salar de Uyuni – the world’s largest salt flat and an enormous lithium reserve located in southwest Bolivia – mining is threatening to destroy the ecosystem and drain the water supply. Indeed, extracting just a tonne of lithium requires up to 2 million liters of water.

The sourcing of metals for lithium batteries can result in profound environmental damage and can produce as much as 16 tons of carbon emissions. For hydrogen it will be a matter of building green electrical plants to make the hydrogen. A lot of these will have to be built.

Currently less than 5% of EV batteries are being recycled; there is a substantial risk of environmental contamination relating to spent battery disposal. According to recent estimates, by 2030, the number of EV batteries requiring disposal will roughly equal the number currently produced annually. Most EV batteries have a 10-year warranty so that is an approximate lifespan. A hydrogen fuel cell will typically last the life of the vehicle and only require one small battery.

Summary

The biggest advantage for EVs is a lot more infrastructure is available while FCEV infrastructure is in its infancy. The EV electrical use is more efficient than FCEV but the recharging/fueling is a clear winner for FCEV. EVs have a lot of excess weight with batteries so the lighter FCEV could make up on its comparable electrical deficiency. The long-term environmental aspects of EVs have not been considered or have been ignored. FCEVs will play a big part in long haul transportation, taxis, service fleets, and last mile delivery.

The green hydrogen market was valued at US$676 million in 2022 and is projected to reach US$7,314 million by 2027, growing at a compound annual growth rate of 61% from 2022 to 2027. The market’s growth is attributed to the lowering cost of producing renewable energy by all sources, the development of electrolysis technologies, and high demand from FCEVs.

A recent report from the EIA [Energy Information Agency] shows very strong growth for hydrogen in FCEVs. Currently they are consuming less than 1% of the hydrogen market with the current big users being ammonia production and the others being methanol and steel production.

Hydrogen demand in road transport increases 60% in 2021 from 2020.
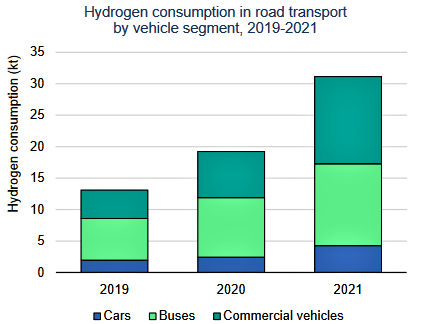
 

Heavy-duty hydrogen trucks increased significantly in 2021 (up over 60-fold from 2020).
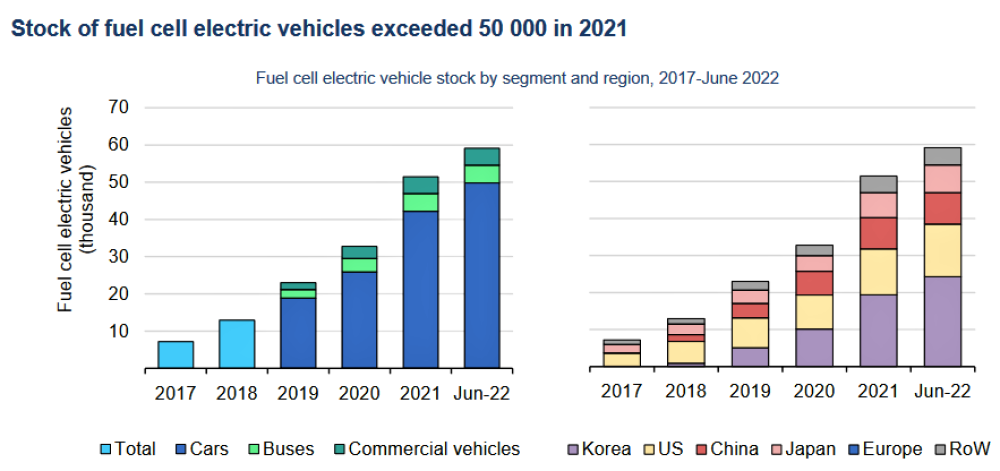
I have talked about the technology “S curve” numerous times in the past. Once a technology reaches acceptance, and that is where FCEVs have just arrived, you have the strongest growth in the market. For example if the new technology has 5% of the market, the growth to 50% is a 1,000% increase. Currently FCEVs have less than 5% of the EV market.

A company I see as very well positioned for the development of hydrogen and FCEVs is:

First Hydrogen Corp. (FHYD:TSX; FHYDF:OTC; FIT:FSE) TSXV:FHYD OTC:FHYDF

Shares outstanding – 70 million approx.

First Hydrogen is based in Vancouver and London, UK, focused on zero-emission vehicles, green hydrogen production and distribution, and super-critical carbon dioxide extractor systems. The company has designed and built hydrogen-fuel-cell-powered light commercial demonstrator vehicles (LCV) under two agreements with AML Powertrain and Ballard Power Systems Inc. This graphic on their home page shows the FCEV and some bullet points.

 

These vehicles are currently being trialed with an initial 16 fleet operators in the United Kingdom.

On June 26, First Hydrogen’s FCEV was delivered to U.K. utility SSE PLC. The FCEV will begin real-world trials at SSE’s operational site at Aberdeen, Scotland, and surrounding areas, which features some of the U.K.’s best hydrogen infrastructure. This infrastructure will enable SSE to experience easy and fast refuelling within five to seven minutes, showcasing a significant advantage of the company’s FCEV over battery electric vehicles (BEV), which typically take hours to recharge.

The FCEV has some good reviews/praise such as in May from award-winning fleet management provider Rivus for its smooth and pleasant driving experience. Rivus drivers noted the capability to manage greater ranges and refuel much faster than battery electric vehicles, which will help fleets using this vehicle class to switch to meet zero emissions targets. Following initial journeys on roads in Birmingham, the West Midlands, and South Yorkshire, Rivus’ drivers have complimented the vehicle for its “effortless” and “comfortable” driving. Drivers were particularly impressed with the automatic transmission, which they appraised as “easier than a petrol or diesel van to operate” as it does not require gear changes and the vehicle is much quieter to run. Rivus, which manages approximately 120,000 vehicles, including approximately 85,000 LCVs, is the first fleet management company to test drive the first-of-its-kind hydrogen vehicle on U.K. roads.

The company has a very experienced and strong management team. FHYD is led by Malraj Mann, chairman and CEO, who has 40+ years of experience in corporate finance, acquisitions, and financial reporting for both private and public companies.

Rob Campbell is CEO-Energy with 40+ years engineering, commercial, and executive experience, including Chief Commercial Officer at Ballard Power Systems. He has held various previous leadership roles in energy and technology space (including solar and hydrogen).

Steve Gill is CEO- Automotive with 30+ years in automotive, with 20 years with Ford Motor Company (final role: Director, Powertrain Engineering at Ford of Europe); Board Director Ford Technologies; 11 years with Perkins Engines; (final role: Chief Engineer).

Allan Rushforth is CCO-Mobility with 30+ years in automotive and mobility. He has held senior leadership roles in automotive sales, distribution and service, including Marque Group, Lookers, Nissan, Hyundai and Volkswagen/Audi. International experience includes Japan, Korea, and Germany.

First Hydrogen is also active in Canada and has finalized land option agreements with the City of Shawinigan, Quebec. Next they signed a feasibility study agreement with Sacre-Davey for the development of a 35-megawatt green hydrogen production facility and vehicle assembly factory in Shawinigan. The purpose of the feasibility study is to establish the technical and market analysis, engineering review, analysis of grid and water constraints, permitting requirements, environmental constraints, and a review of distribution and operations. The overarching theme throughout the study is to recognize the combined aim to create a zero-emission hydrogen ecosystem.

The production facility will use advanced electrolysis and supply the company’s hydrogen-fuel-cell-powered vehicles (FCEV), as well as support other hydrogen-fueled vehicles and applications in the Montreal-Quebec City region. The company’s planned FCEV assembly factory will be designed for annual production of 25,000 vehicles per year when at full capacity and will represent a major boost to green technology jobs in the region. The distribution of First Hydrogen’s FCEV, throughout North America, will be in combination with the company’s hydrogen-as-a-service product offering.

It is very early days for First Hydrogen but it will have a far easier path than Tesla did. Tesla was met with much skepticism and doubt as North America’s first EV producer. Now governments and large investment funds are pouring oodles of money into the EV and hydrogen markets.

So far First Hydrogen’s FCEV has accumulated 6,000 kilometers on United Kingdom roads, including mileage around London’s M25 motorway. The data logging supports vehicle range simulations, which exceed a 500-kilometer range. The vehicle is currently performing with excellent efficiency, including both urban, extraurban (which includes driving at higher speeds), and highway operations. First Hydrogen’s LCV fuel consumption figures seen in many driving scenarios are under two kilograms per 100 km, and in mostly urban driving this is 1.5 kg/100 km.

Conclusion

First Hydrogen is at the very beginning of its growth cycle. It will have revenues from selling FCEVs that have now reached acceptance and I expect will soon see major purchase orders. The company has partnered with the Quebec University and numerous other government, investor, and industry partners in the sector. It is not doing this alone. First Hydrogen will also make revenues producing and selling hydrogen.

There is enormous government support for hydrogen in Western countries. In Canada’s recent budget, programs supporting First Hydrogen include investment tax credits for clean hydrogen ($17.7 billion) and zero-emission technology manufacturing ($11.1 billion), as well as lower tax rates for zero-emission technology manufactures ($1.3 billion). The federal incentives are in addition to incentive programs offered by the province of Quebec, which the company has picked for its first green hydrogen eco-system.

The stock ran up last year with good news from the company and Canada officially getting behind hydrogen. PM Justin Trudeau and German Chancellor Olaf Scholz met in Newfoundland, Canada, creating an alliance between Canada and Germany. The joint declaration of intent to invest in hydrogen and establish a transatlantic Canada-Germany supply corridor will be the start of establishing Canada as a significant hydrogen producer and advancing on its decarbonization path.

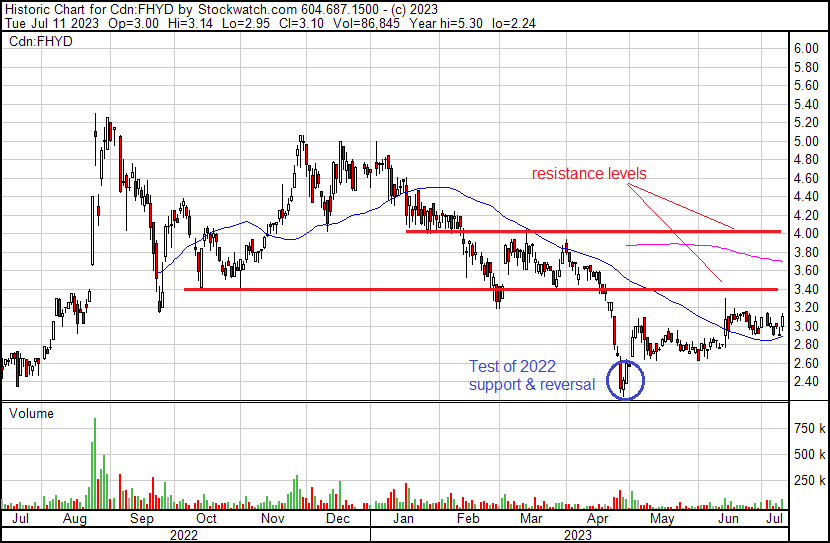
The stock has come down after what now looks like too much hype in the sector, but has put in a bottom and current prices look like an attractive entry point. There is not much resistance until around $3.40 and the the $4.00 area.
 

Important Disclosures:

  1. First Hydrogen has a consulting relationship with an affiliate of Streetwise Reports, and pays a monthly consulting fee between US$8,000 and US$20,000.
  2. As of the date of this article, officers and/or employees of Streetwise Reports LLC (including members of their household) own securities of First Hydrogen.
  3. Ron Struthers: I, or members of my immediate household or family, does not own securities of First Hydrogen. My company does not have a financial relationship with First Hydrogen. I determined which companies would be included in this article based on my research and understanding of the sector.
  4. Statements and opinions expressed are the opinions of the author and not of Streetwise Reports or its officers. The author is wholly responsible for the validity of the statements. The author was not paid by Streetwise Reports for this article. Streetwise Reports was not paid by the author to publish or syndicate this article. Streetwise Reports requires contributing authors to disclose any shareholdings in, or economic relationships with, companies that they write about. Streetwise Reports relies upon the authors to accurately provide this information and Streetwise Reports has no means of verifying its accuracy.
  5.  This article does not constitute investment advice. Each reader is encouraged to consult with his or her individual financial professional. By opening this page, each reader accepts and agrees to Streetwise Reports’ terms of use and full legal disclaimer. This article is not a solicitation for investment. Streetwise Reports does not render general or specific investment advice and the information on Streetwise Reports should not be considered a recommendation to buy or sell any security. Streetwise Reports does not endorse or recommend the business, products, services or securities of any company.

For additional disclosures, please click here.

Struthers Resource Stock Report Disclosures

All forecasts and recommendations are based on opinion. Markets change direction with consensus beliefs, which may change at any time and without notice. The author/publisher of this publication has taken every precaution to provide the most accurate information possible. The information & data were obtained from sources believed to be reliable, but because the information & data source are beyond the author’s control, no representation or guarantee is made that it is complete or accurate. The reader accepts information on the condition that errors or omissions shall not be made the basis for any claim, demand or cause for action. Because of the ever-changing nature of information & statistics the author/publisher strongly encourages the reader to communicate directly with the company and/or with their personal investment adviser to obtain up to date information. Past results are not necessarily indicative of future results. Any statements non-factual in nature constitute only current opinions, which are subject to change. The author/publisher may or may not have a position in the securities and/or options relating thereto, & may make purchases and/or sales of these securities relating thereto from time to time in the open market or otherwise. Neither the information, nor opinions expressed, shall be construed as a solicitation to buy or sell any stock, futures or options contract mentioned herein. The author/publisher of this letter is not a qualified financial adviser & is not acting as such in this publication.

Stock Market Speculator Changes led by Nasdaq-Mini & the VIX

By InvestMacro

Here are the latest charts and statistics for the Commitment of Traders (COT) data published by the Commodities Futures Trading Commission (CFTC).

The latest COT data is updated through Tuesday July 11th and shows a quick view of how large traders (for-profit speculators and commercial entities) were positioned in the futures markets.

Weekly Speculator Changes led by Nasdaq-Mini & the VIX

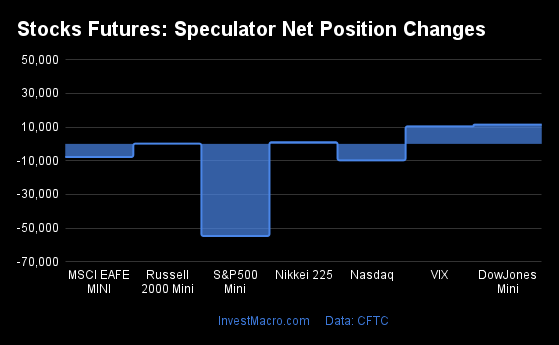
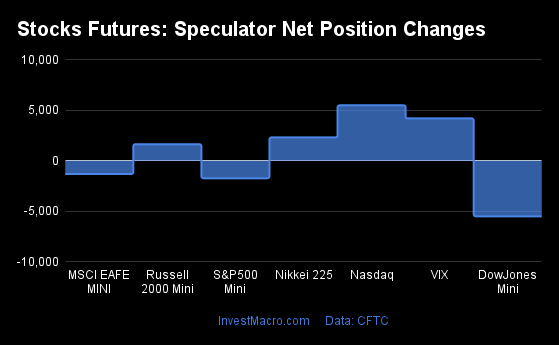
The COT stock markets speculator bets were higher this week as four out of the seven stock markets we cover had higher positioning while the other three markets had lower speculator contracts.

Leading the gains for the stock markets was the Nasdaq-Mini (5,490 contracts) with the VIX (4,191 contracts), the Nikkei 225 (2,314 contracts) and the Russell-Mini (1,637 contracts) also showing positive weeks.

The markets with the declines in speculator bets this week were with DowJones-Mini (-5,503 contracts), the MSCI EAFE-Mini (-1,318 contracts) and the S&P500-Mini (-1,740 contracts) also registering lower bets on the week.


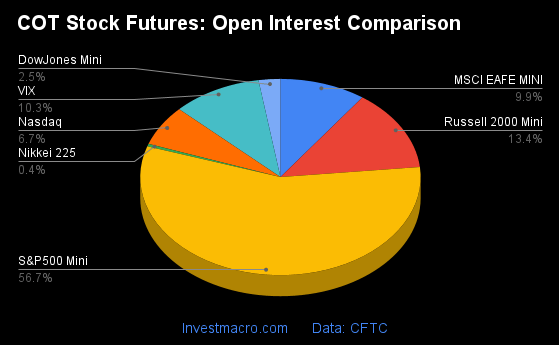
Data Snapshot of Stock Market Traders | Columns Legend
Jul-11-2023OIOI-IndexSpec-NetSpec-IndexCom-NetCOM-IndexSmalls-NetSmalls-Index
S&P500-Mini2,209,60721-208,97934202,437686,54247
Nikkei 22516,33817-3,871441,916481,95553
Nasdaq-Mini259,4913710,94883-8,01318-2,93548
DowJones-Mini97,78260-18,5852121,32577-2,74031
VIX403,07274-50,7338252,12713-1,39489
Nikkei 225 Yen53,8284311,8367112,92046-24,75627


Strength Scores led by Nasdaq-Mini & VIX

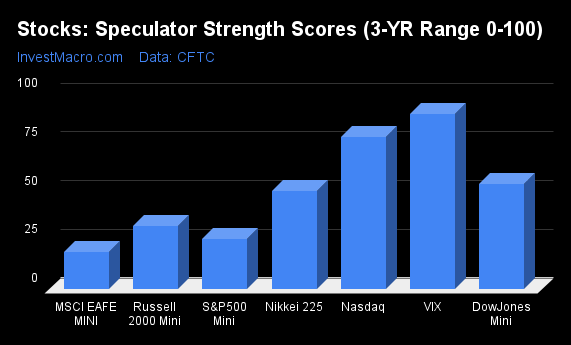
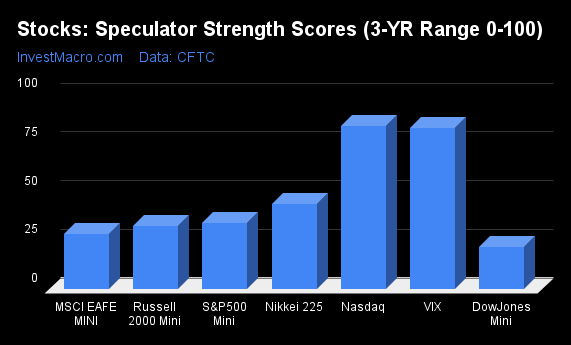
COT Strength Scores (a normalized measure of Speculator positions over a 3-Year range, from 0 to 100 where above 80 is Extreme-Bullish and below 20 is Extreme-Bearish) showed that the Nasdaq-Mini (83 percent) and the VIX (82 percent) lead the stock markets this week. The Nikkei 225 Yen (71 percent) and Nikkei 225 (44 percent) come in as the next highest in the weekly strength scores.

On the downside, the DowJones-Mini (21 percent) comes in at the lowest strength level currently. The next lowest strength score is the MSCI EAFE-Mini (28 percent).

Strength Statistics:
VIX (82.4 percent) vs VIX previous week (79.4 percent)
S&P500-Mini (33.6 percent) vs S&P500-Mini previous week (33.8 percent)
DowJones-Mini (21.3 percent) vs DowJones-Mini previous week (36.9 percent)
Nasdaq-Mini (83.5 percent) vs Nasdaq-Mini previous week (80.3 percent)
Russell2000-Mini (32.4 percent) vs Russell2000-Mini previous week (31.5 percent)
Nikkei USD (43.8 percent) vs Nikkei USD previous week (28.7 percent)
EAFE-Mini (28.3 percent) vs EAFE-Mini previous week (29.9 percent)


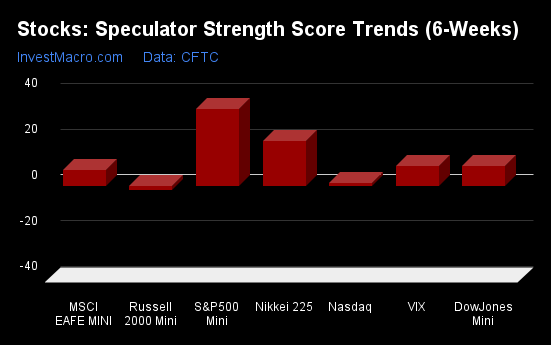
S&P500-Mini & Nikkei 225 top the 6-Week Strength Trends

COT Strength Score Trends (or move index, calculates the 6-week changes in strength scores) showed that the S&P500-Mini (34 percent) leads the past six weeks trends for the stock markets. The Nikkei 225 (20 percent), the VIX (9 percent) and the DowJones-Mini (9 percent) are the next highest positive movers in the latest trends data.

The Russell-Mini (-2 percent) leads the downside trend scores currently.

Strength Trend Statistics:
VIX (8.6 percent) vs VIX previous week (7.1 percent)
S&P500-Mini (33.6 percent) vs S&P500-Mini previous week (29.4 percent)
DowJones-Mini (8.5 percent) vs DowJones-Mini previous week (27.3 percent)
Nasdaq-Mini (1.4 percent) vs Nasdaq-Mini previous week (-5.2 percent)
Russell2000-Mini (-1.7 percent) vs Russell2000-Mini previous week (-11.2 percent)
Nikkei USD (19.7 percent) vs Nikkei USD previous week (-4.4 percent)
EAFE-Mini (6.7 percent) vs EAFE-Mini previous week (10.7 percent)


Individual Stock Market Charts:

VIX Volatility Futures:

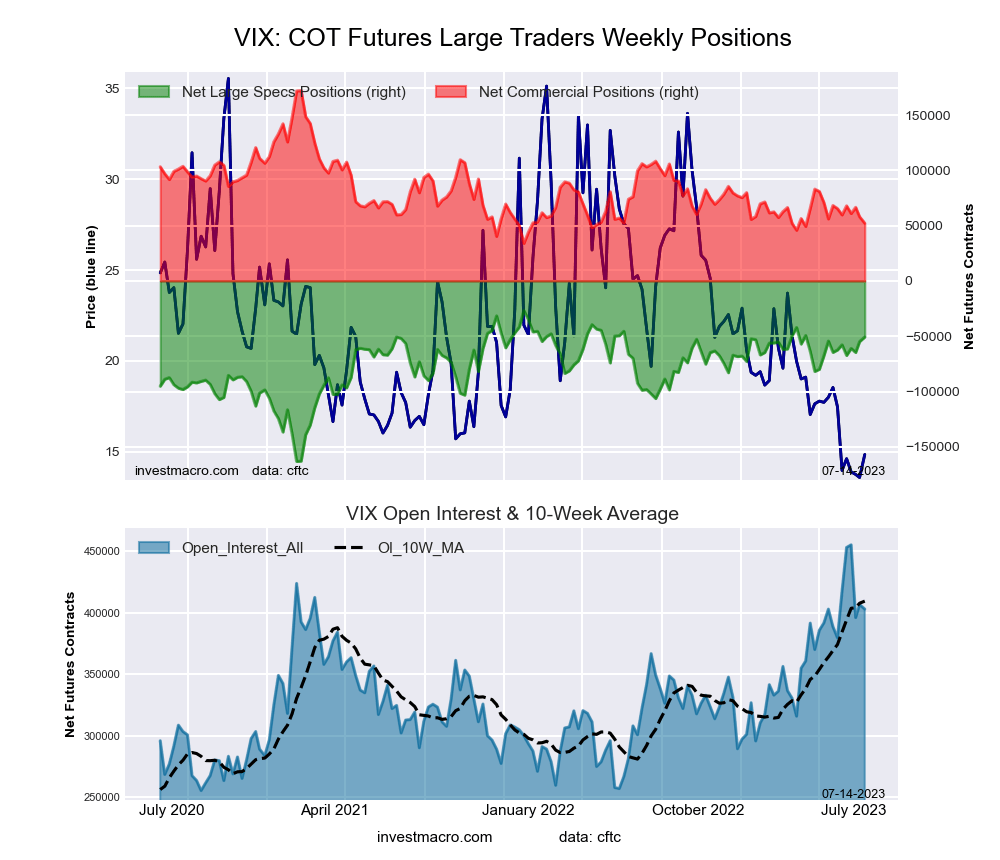
VIX Volatility Futures COT ChartThe VIX Volatility large speculator standing this week resulted in a net position of -50,733 contracts in the data reported through Tuesday. This was a weekly boost of 4,191 contracts from the previous week which had a total of -54,924 net contracts.

This week’s current strength score (the trader positioning range over the past three years, measured from 0 to 100) shows the speculators are currently Bullish-Extreme with a score of 82.4 percent. The commercials are Bearish-Extreme with a score of 13.2 percent and the small traders (not shown in chart) are Bullish-Extreme with a score of 88.7 percent.

Price Trend-Following Model: Downtrend

Our weekly trend-following model classifies the current market price position as: Downtrend. The current action for the model is considered to be: Hold – Maintain Short Position.

VIX Volatility Futures StatisticsSPECULATORSCOMMERCIALSSMALL TRADERS
– Percent of Open Interest Longs:23.348.96.4
– Percent of Open Interest Shorts:35.936.06.7
– Net Position:-50,73352,127-1,394
– Gross Longs:93,879197,28225,734
– Gross Shorts:144,612145,15527,128
– Long to Short Ratio:0.6 to 11.4 to 10.9 to 1
NET POSITION TREND:
– Strength Index Score (3 Year Range Pct):82.413.288.7
– Strength Index Reading (3 Year Range):Bullish-ExtremeBearish-ExtremeBullish-Extreme
NET POSITION MOVEMENT INDEX:
– 6-Week Change in Strength Index:8.6-9.67.5


S&P500 Mini Futures:

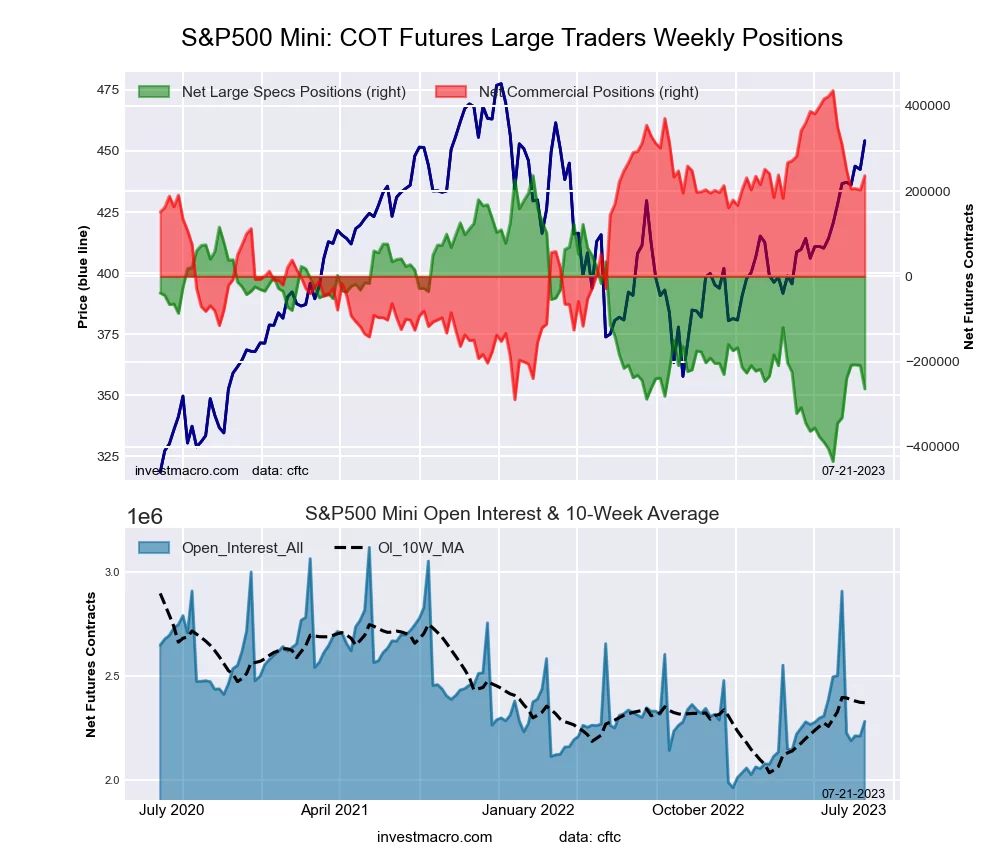
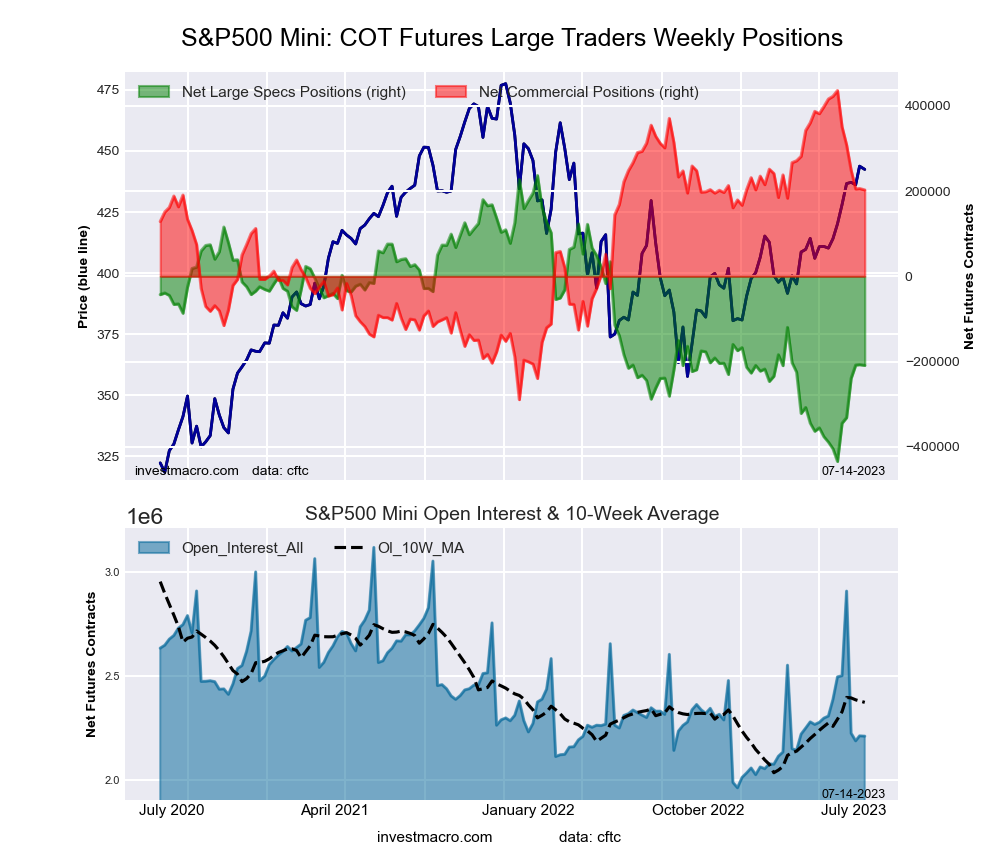
SP500 Mini Futures COT ChartThe S&P500 Mini large speculator standing this week resulted in a net position of -208,979 contracts in the data reported through Tuesday. This was a weekly reduction of -1,740 contracts from the previous week which had a total of -207,239 net contracts.

This week’s current strength score (the trader positioning range over the past three years, measured from 0 to 100) shows the speculators are currently Bearish with a score of 33.6 percent. The commercials are Bullish with a score of 67.8 percent and the small traders (not shown in chart) are Bearish with a score of 46.5 percent.

Price Trend-Following Model: Strong Uptrend

Our weekly trend-following model classifies the current market price position as: Strong Uptrend. The current action for the model is considered to be: Hold – Maintain Long Position.

S&P500 Mini Futures StatisticsSPECULATORSCOMMERCIALSSMALL TRADERS
– Percent of Open Interest Longs:10.276.211.3
– Percent of Open Interest Shorts:19.667.011.0
– Net Position:-208,979202,4376,542
– Gross Longs:224,5541,683,791249,227
– Gross Shorts:433,5331,481,354242,685
– Long to Short Ratio:0.5 to 11.1 to 11.0 to 1
NET POSITION TREND:
– Strength Index Score (3 Year Range Pct):33.667.846.5
– Strength Index Reading (3 Year Range):BearishBullishBearish
NET POSITION MOVEMENT INDEX:
– 6-Week Change in Strength Index:33.6-32.22.8


Dow Jones Mini Futures:

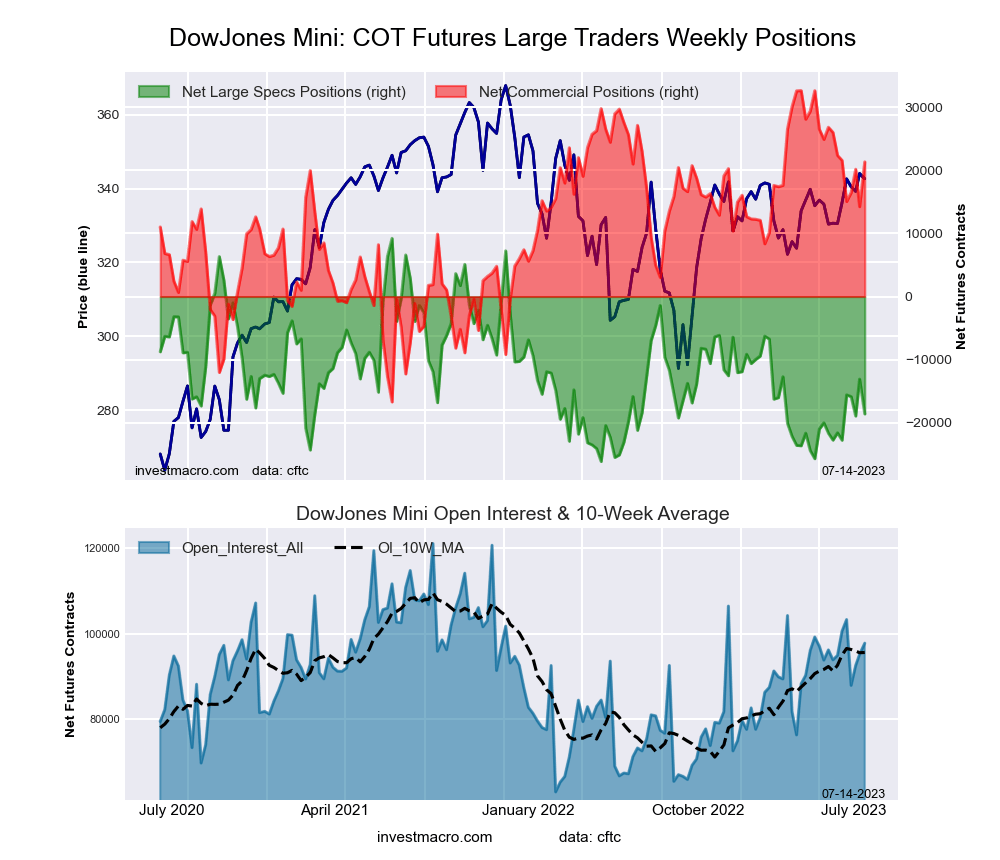
Dow Jones Mini Futures COT ChartThe Dow Jones Mini large speculator standing this week resulted in a net position of -18,585 contracts in the data reported through Tuesday. This was a weekly decrease of -5,503 contracts from the previous week which had a total of -13,082 net contracts.

This week’s current strength score (the trader positioning range over the past three years, measured from 0 to 100) shows the speculators are currently Bearish with a score of 21.3 percent. The commercials are Bullish with a score of 77.1 percent and the small traders (not shown in chart) are Bearish with a score of 30.5 percent.

Price Trend-Following Model: Strong Uptrend

Our weekly trend-following model classifies the current market price position as: Strong Uptrend. The current action for the model is considered to be: Hold – Maintain Long Position.

Dow Jones Mini Futures StatisticsSPECULATORSCOMMERCIALSSMALL TRADERS
– Percent of Open Interest Longs:23.763.112.2
– Percent of Open Interest Shorts:42.741.215.0
– Net Position:-18,58521,325-2,740
– Gross Longs:23,20561,65811,959
– Gross Shorts:41,79040,33314,699
– Long to Short Ratio:0.6 to 11.5 to 10.8 to 1
NET POSITION TREND:
– Strength Index Score (3 Year Range Pct):21.377.130.5
– Strength Index Reading (3 Year Range):BearishBullishBearish
NET POSITION MOVEMENT INDEX:
– 6-Week Change in Strength Index:8.5-2.1-9.6


Nasdaq Mini Futures:

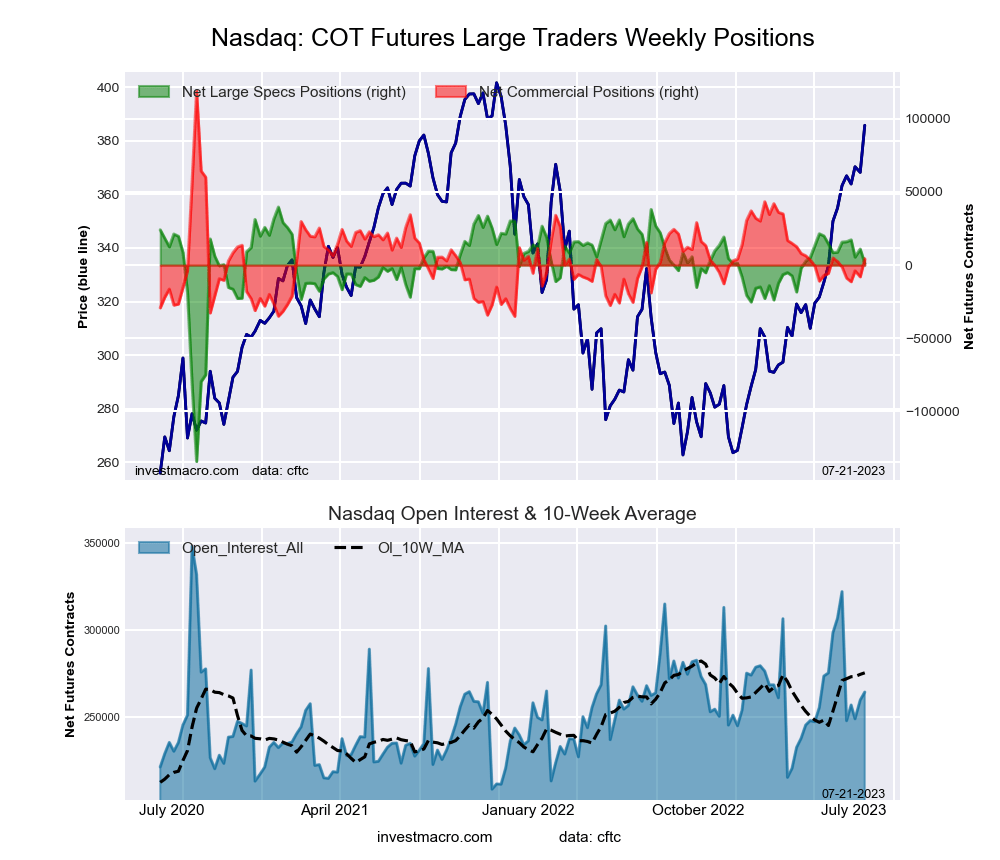
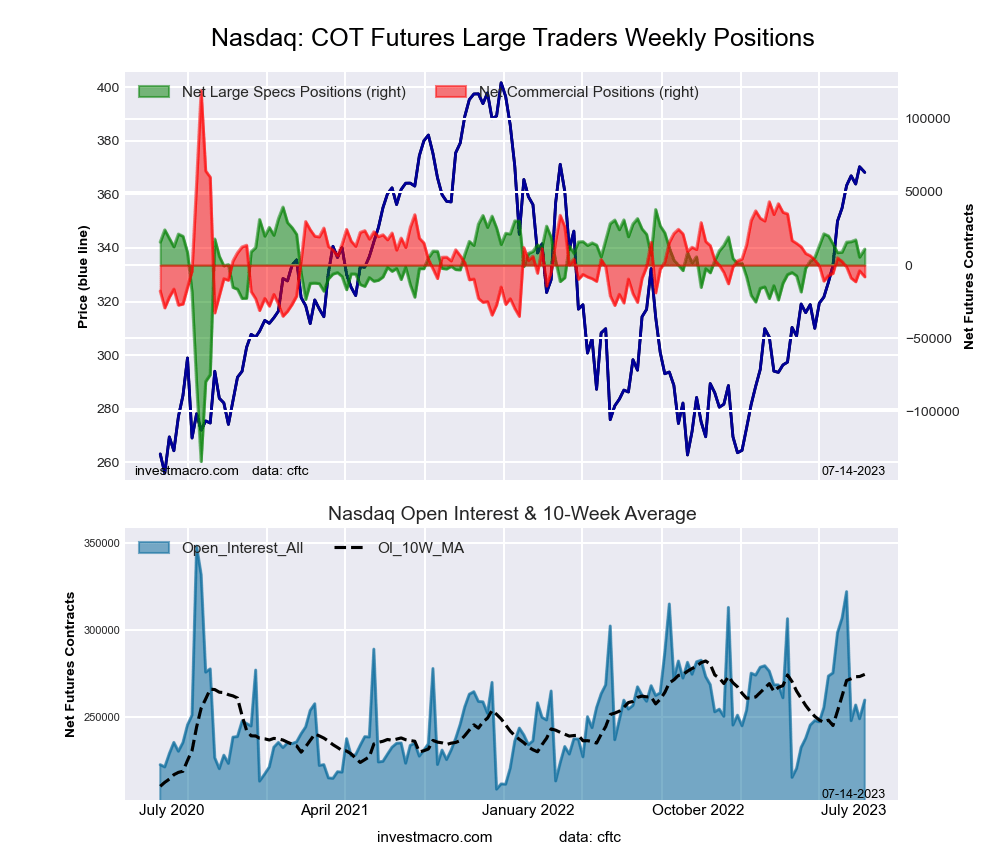
Nasdaq Mini Futures COT ChartThe Nasdaq Mini large speculator standing this week resulted in a net position of 10,948 contracts in the data reported through Tuesday. This was a weekly increase of 5,490 contracts from the previous week which had a total of 5,458 net contracts.

This week’s current strength score (the trader positioning range over the past three years, measured from 0 to 100) shows the speculators are currently Bullish-Extreme with a score of 83.5 percent. The commercials are Bearish-Extreme with a score of 17.5 percent and the small traders (not shown in chart) are Bearish with a score of 47.9 percent.

Price Trend-Following Model: Strong Uptrend

Our weekly trend-following model classifies the current market price position as: Strong Uptrend. The current action for the model is considered to be: Hold – Maintain Long Position.

Nasdaq Mini Futures StatisticsSPECULATORSCOMMERCIALSSMALL TRADERS
– Percent of Open Interest Longs:29.152.715.5
– Percent of Open Interest Shorts:24.955.816.6
– Net Position:10,948-8,013-2,935
– Gross Longs:75,622136,66840,206
– Gross Shorts:64,674144,68143,141
– Long to Short Ratio:1.2 to 10.9 to 10.9 to 1
NET POSITION TREND:
– Strength Index Score (3 Year Range Pct):83.517.547.9
– Strength Index Reading (3 Year Range):Bullish-ExtremeBearish-ExtremeBearish
NET POSITION MOVEMENT INDEX:
– 6-Week Change in Strength Index:1.4-8.419.5


Russell 2000 Mini Futures:

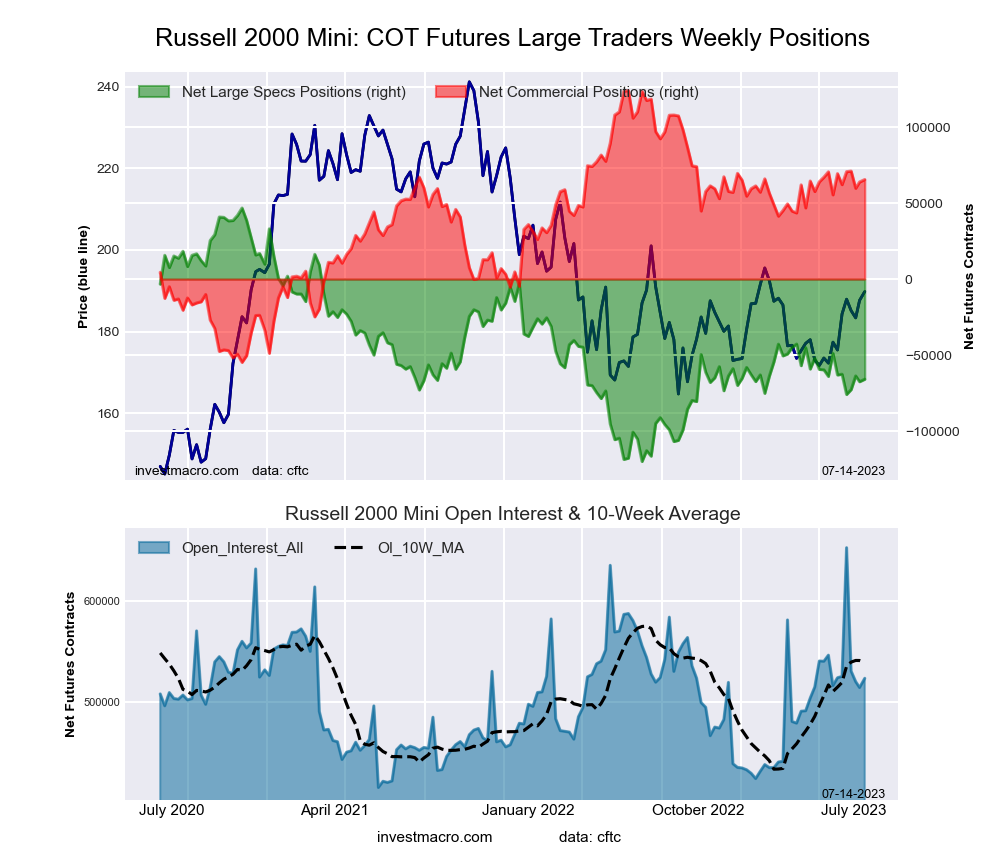
Russell 2000 Mini Futures COT ChartThe Russell 2000 Mini large speculator standing this week resulted in a net position of -65,873 contracts in the data reported through Tuesday. This was a weekly boost of 1,637 contracts from the previous week which had a total of -67,510 net contracts.

This week’s current strength score (the trader positioning range over the past three years, measured from 0 to 100) shows the speculators are currently Bearish with a score of 32.4 percent. The commercials are Bullish with a score of 67.3 percent and the small traders (not shown in chart) are Bearish with a score of 27.8 percent.

Price Trend-Following Model: Strong Uptrend

Our weekly trend-following model classifies the current market price position as: Strong Uptrend. The current action for the model is considered to be: Hold – Maintain Long Position.

Russell 2000 Mini Futures StatisticsSPECULATORSCOMMERCIALSSMALL TRADERS
– Percent of Open Interest Longs:10.283.84.6
– Percent of Open Interest Shorts:22.871.34.5
– Net Position:-65,87365,463410
– Gross Longs:53,492438,84324,054
– Gross Shorts:119,365373,38023,644
– Long to Short Ratio:0.4 to 11.2 to 11.0 to 1
NET POSITION TREND:
– Strength Index Score (3 Year Range Pct):32.467.327.8
– Strength Index Reading (3 Year Range):BearishBullishBearish
NET POSITION MOVEMENT INDEX:
– 6-Week Change in Strength Index:-1.7-2.220.7


Nikkei Stock Average (USD) Futures:

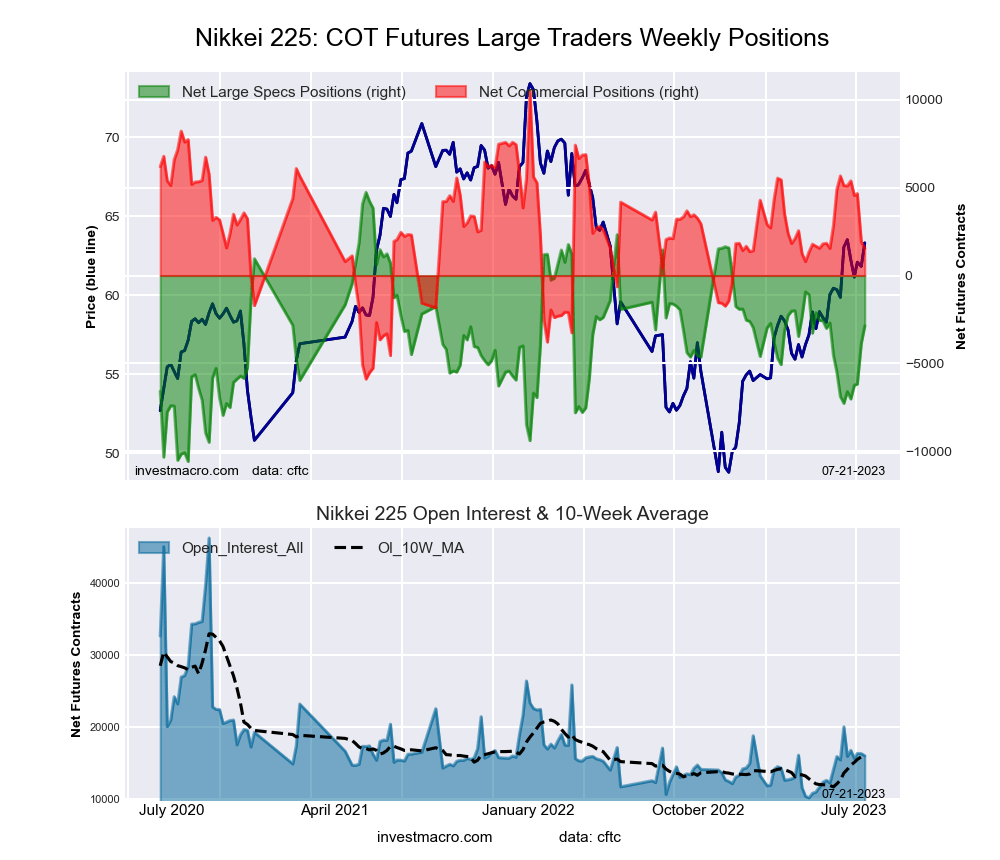
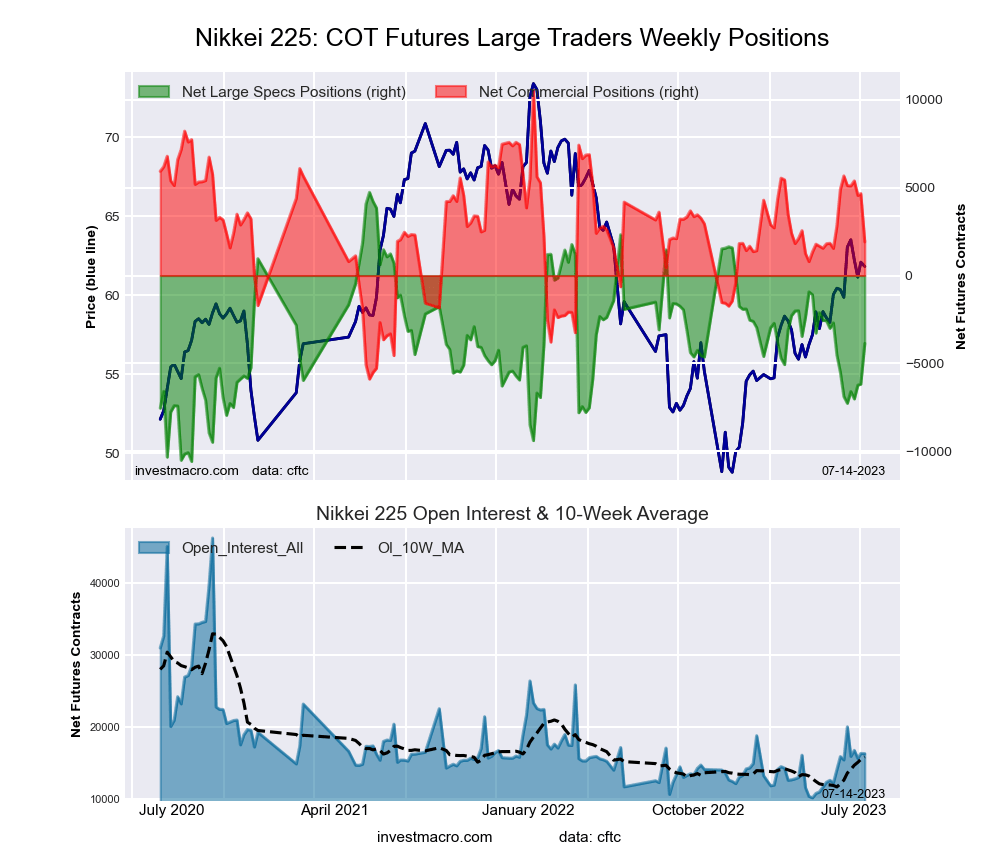
Nikkei Stock Average (USD) Futures COT ChartThe Nikkei Stock Average (USD) large speculator standing this week resulted in a net position of -3,871 contracts in the data reported through Tuesday. This was a weekly lift of 2,314 contracts from the previous week which had a total of -6,185 net contracts.

This week’s current strength score (the trader positioning range over the past three years, measured from 0 to 100) shows the speculators are currently Bearish with a score of 43.8 percent. The commercials are Bearish with a score of 47.5 percent and the small traders (not shown in chart) are Bullish with a score of 52.9 percent.

Price Trend-Following Model: Strong Uptrend

Our weekly trend-following model classifies the current market price position as: Strong Uptrend. The current action for the model is considered to be: Hold – Maintain Long Position.

Nikkei Stock Average Futures StatisticsSPECULATORSCOMMERCIALSSMALL TRADERS
– Percent of Open Interest Longs:8.862.828.4
– Percent of Open Interest Shorts:32.551.016.4
– Net Position:-3,8711,9161,955
– Gross Longs:1,44510,2544,639
– Gross Shorts:5,3168,3382,684
– Long to Short Ratio:0.3 to 11.2 to 11.7 to 1
NET POSITION TREND:
– Strength Index Score (3 Year Range Pct):43.847.552.9
– Strength Index Reading (3 Year Range):BearishBearishBullish
NET POSITION MOVEMENT INDEX:
– 6-Week Change in Strength Index:19.7-22.99.3


MSCI EAFE Mini Futures:

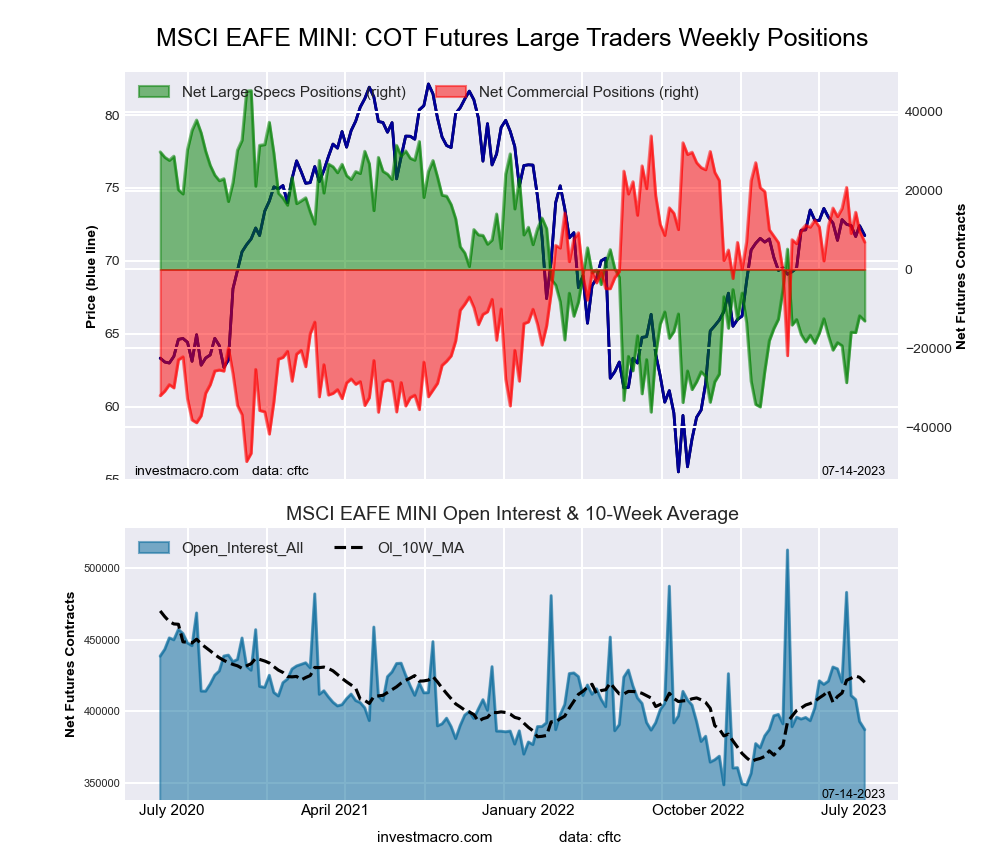
MSCI EAFE Mini Futures COT ChartThe MSCI EAFE Mini large speculator standing this week resulted in a net position of -13,061 contracts in the data reported through Tuesday. This was a weekly fall of -1,318 contracts from the previous week which had a total of -11,743 net contracts.

This week’s current strength score (the trader positioning range over the past three years, measured from 0 to 100) shows the speculators are currently Bearish with a score of 28.3 percent. The commercials are Bullish with a score of 67.4 percent and the small traders (not shown in chart) are Bearish with a score of 47.6 percent.

Price Trend-Following Model: Strong Uptrend

Our weekly trend-following model classifies the current market price position as: Strong Uptrend. The current action for the model is considered to be: Hold – Maintain Long Position.

MSCI EAFE Mini Futures StatisticsSPECULATORSCOMMERCIALSSMALL TRADERS
– Percent of Open Interest Longs:7.189.32.9
– Percent of Open Interest Shorts:10.587.51.3
– Net Position:-13,0616,9266,135
– Gross Longs:27,415345,86311,243
– Gross Shorts:40,476338,9375,108
– Long to Short Ratio:0.7 to 11.0 to 12.2 to 1
NET POSITION TREND:
– Strength Index Score (3 Year Range Pct):28.367.447.6
– Strength Index Reading (3 Year Range):BearishBullishBearish
NET POSITION MOVEMENT INDEX:
– 6-Week Change in Strength Index:6.7-7.94.9


Article By InvestMacroReceive our weekly COT Newsletter

*COT Report: The COT data, released weekly to the public each Friday, is updated through the most recent Tuesday (data is 3 days old) and shows a quick view of how large speculators or non-commercials (for-profit traders) were positioned in the futures markets.

The CFTC categorizes trader positions according to commercial hedgers (traders who use futures contracts for hedging as part of the business), non-commercials (large traders who speculate to realize trading profits) and nonreportable traders (usually small traders/speculators) as well as their open interest (contracts open in the market at time of reporting). See CFTC criteria here.

Two potential targets for WSt30m_index

By ForexTime 

  • WSt30_m index posted new 2023 intraday high on Wednesday
  • Markets cheered yesterday’s lower-than-expected US inflation data
  • JPMorgan and other big US banks to unofficially kick off US earnings season on Friday
  • WSt30_m bulls may next aim for 335374 and 36470, as long as risk-on sentiment holds


US stock markets cheered the US inflation data released yesterday (Wednesday, July 12th). The consumer price indexes out of the world’s largest economy came in below market expectations.

Such data has raised hopes that the Fed will soon call time on its rate hikes that began over a year ago, and the thought of peak US rates being close at hand was a cause for rejoicing for risk assets.

The WSt30_m index, which tracks the benchmark Dow Jones Industrial average index, joined in Wednesday’s party by posting its highest intraday price so far this year.


However, traders and investors will be bracing for another key event ahead.

Tomorrow (Friday, July 14th), the US earnings season will unofficially kick off with the latest quarterly financial results out of Wall Street banking titans, namely JPMorgan, Citigroup, and Wells Fargo.

Note that JPMorgan alone comprises almost 3% of the Dow Jones Industrial Average index (tracked by WSt30_m).

And the Dow index contains two banking heavyweights in the form of JPMorgan and also Goldman Sachs, which combined account for 9.1% of the benchmark index which tracks 30 industry leaders within the US economy.

With all that in mind, the WSt30_m index is set to be heavily influenced by how markets react to the latest earnings results out of JPMorgan and its peers over the coming days.


Looking at the price charts …

The WSt30_m index has been oscillating between a weekly support and resistance level since the beginning of June.

The battle between the bulls and bears has not been decided yet, but the bulls seem poised for a retest of the weekly resistance level that happened on 12 July.  

This possible scenario is confirmed by the fact that the price is above the 15 and 34 Simple Moving Average with the Momentum Oscillator adding its weight as well when it broke above the 100-base line into bullish terrain.

If the bulls can drive the price above the weekly resistance level and specifically a critical resistance that formed on 12 July at 34627, then two possible targets become possible from there.


Potential opportunities

Attaching the Fibonacci tool to the top 34627 and dragging it to a bottom that formed on 26 June at 33631, the following potential targets can be established:

  • Potential Target 1: 335374
    (situated just before a weekly resistance level at 35569).
  • Potential Target 2: 36470
    (just before another weekly resistance level at 36667)

If the support level at 33631 is broken, this scenario is no longer valid and must be reassessed.

As long as bulls can keep up the momentum with demand overcoming supply, the market outlook for the WSt30_m index on the Daily time frame should have bullish potential.


Forex-Time-LogoArticle by ForexTime

ForexTime Ltd (FXTM) is an award winning international online forex broker regulated by CySEC 185/12 www.forextime.com
Markets brace for volatility ahead of Q2 earnings season

By George Prior 

Stock markets are braced for a “bout of heightened volatility” as the second-quarter earnings season kicks off this week, giving an insight in the health of corporate America.

The warning from Nigel Green, CEO of deVere Group, one of the world’s largest independent financial advisory, asset management and fintech organizations, comes ahead of earnings reports from the likes of BlackRock, JPMorgan Chase, Wells Fargo, and Citi.

This will be followed the week after by Tesla, Netflix, IBM, Bank of America, Goldman Sachs, Morgan Stanley, Johnson & Johnson, and United Airlines, amongst others.

The deVere Group chief executive says: “Markets are bracing for what could be the worst reporting season since the end of the pandemic.

“In the last quarterly earnings, there was a lot of negative guidance from companies. We’re likely to see this having turned out to be correct amid the brewing of a perfect storm of several major economic headwinds.

“These include the persisting challenge of inflation, meaning central banks will need to continue with, or resume, interest rate rises to bring inflation back to target; and that developed markets will experience the lag effect of monetary policy tightening during the second half of 2023.

“As companies’ costs exceed their sales, as is currently the case for many corporates, earnings take a hit.”

He continues: “With earnings being less than stellar – with some analysts saying they could be the worst since Q2 2020 – we expect a bout of heightened market volatility as investors assess the health of corporate America.

One of the main aspects of the reports that investors will be looking for this season is guidance.
“Guidance will be critical as indicators show the economy is headed for a downturn and investors will be eager to know which companies are best-positioned to manage this. Guidance helps evaluate a company’s past performance in light of its future prospects.”

Nigel Green comments: “When costs are going up, investors should increasingly be looking at a company’s and a sector’s ability to maintain margin.

“Investors should be paying close attention to margin because it can indicate how well a company is managing costs and competing in its industry.

“It can also impact a corporation’s ability to invest in growth opportunities or pay dividends to shareholders.”

Previously, he has suggested that these include energy, healthcare, luxury goods, and agriculture.

“We’ll look at energy because there’s already a shortage of energy in the world right now.

“Healthcare is a robust sector as people will always need to stay healthy – this has come into focus more than ever since the pandemic. Also, despite wider market volatility, there’s strong earnings potential due to ageing populations and other demographic changes. Plus, healthcare is becoming increasingly tech-driven, which offers fresh opportunities.”

He goes on to say: “Luxury goods can maintain margin due to the inherent aspirational ‘elite and exclusive’ aspect of the sector.

“Agriculture is another one as populations in emerging markets around the world are eating more meat. As they eat more meat, there needs to be more grain produced.”

He concludes: “The earnings reports are a critical test for the stock market rally. Investors should buckle up.”

About:

deVere Group is one of the world’s largest independent advisors of specialist global financial solutions to international, local mass affluent, and high-net-worth clients.  It has a network of more than 70 offices across the world, over 80,000 clients and $12bn under advisement.

COT Stock Market Charts: Weekly Speculator Changes led by VIX & DowJones-Mini

By InvestMacro

Here are the latest charts and statistics for the Commitment of Traders (COT) data published by the Commodities Futures Trading Commission (CFTC).

The latest COT data is updated through Monday July 3rd and shows a quick view of how large traders (for-profit speculators and commercial entities) were positioned in the futures markets.

Weekly Speculator Changes led by VIX & DowJones-Mini

The COT stock markets speculator bets were higher this week as five out of the seven stock markets we cover had higher positioning while the other three markets had lower speculator contracts.

Leading the gains for the stock markets was VIX (9,797 contracts) with the DowJones-Mini (5,840 contracts), the MSCI EAFE-Mini (4,241 contracts), the S&P500-Mini (1,011 contracts) and the Nikkei 225 (61 contracts) also showing positive weeks.

The markets with the declines in speculator bets this week were with the Nasdaq-Mini (-11,784 contracts) and the Russell-Mini (-3,810 contracts) also registering lower bets on the week.


Data Snapshot of Stock Market Traders | Columns Legend
Jul-03-2023OIOI-IndexSpec-NetSpec-IndexCom-NetCOM-IndexSmalls-NetSmalls-Index
S&P500-Mini2,211,00422-207,23934205,791681,44845
Nikkei 22516,35917-6,185294,671641,51447
Nasdaq-Mini248,698295,45880-3,88320-1,57550
DowJones-Mini95,16155-13,0823714,23663-1,15438
VIX406,80576-54,9247958,02217-3,09880
Nikkei 225 Yen57,3184910,9656815,89654-26,86120


Strength Scores led by Nasdaq-Mini & VIX

COT Strength Scores (a normalized measure of Speculator positions over a 3-Year range, from 0 to 100 where above 80 is Extreme-Bullish and below 20 is Extreme-Bearish) showed that the Nasdaq-Mini (80 percent) and the VIX (79 percent) lead the stock markets this week. The Nikkei 225 Yen (68 percent) and DowJones-Mini (37 percent) come in as the next highest in the weekly strength scores.

On the downside, the Nikkei 225 (29 percent) comes in at the lowest strength level currently with the next lowest strength score being the MSCI EAFE-Mini (30 percent).

Strength Statistics:
VIX (79.4 percent) vs VIX previous week (72.2 percent)
S&P500-Mini (33.8 percent) vs S&P500-Mini previous week (33.7 percent)
DowJones-Mini (36.9 percent) vs DowJones-Mini previous week (20.4 percent)
Nasdaq-Mini (80.3 percent) vs Nasdaq-Mini previous week (87.1 percent)
Russell2000-Mini (31.5 percent) vs Russell2000-Mini previous week (33.8 percent)
Nikkei USD (28.7 percent) vs Nikkei USD previous week (28.3 percent)
EAFE-Mini (29.9 percent) vs EAFE-Mini previous week (24.7 percent)


S&P500-Mini & DowJones-Mini top the 6-Week Strength Trends

COT Strength Score Trends (or move index, calculates the 6-week changes in strength scores) showed that the S&P500-Mini (29 percent) leads the past six weeks trends for the stock markets. The DowJones-Mini (27 percent), the MSCI EAFE-Mini (11 percent) and the VIX (7 percent) are the next highest positive movers in the latest trends data.

The Russell-Mini (-11 percent) leads the downside trend scores currently with the Nasdaq-Mini (-5 percent) coming in as the next market with lower trend scores.

Strength Trend Statistics:
VIX (7.1 percent) vs VIX previous week (-7.6 percent)
S&P500-Mini (29.4 percent) vs S&P500-Mini previous week (26.9 percent)
DowJones-Mini (27.3 percent) vs DowJones-Mini previous week (7.7 percent)
Nasdaq-Mini (-5.2 percent) vs Nasdaq-Mini previous week (-1.6 percent)
Russell2000-Mini (-11.2 percent) vs Russell2000-Mini previous week (0.2 percent)
Nikkei USD (-4.4 percent) vs Nikkei USD previous week (-11.2 percent)
EAFE-Mini (10.7 percent) vs EAFE-Mini previous week (1.0 percent)


Individual Stock Market Charts:

VIX Volatility Futures:

VIX Volatility Futures COT ChartThe VIX Volatility large speculator standing this week reached a net position of -54,924 contracts in the data reported through Tuesday. This was a weekly increase of 9,797 contracts from the previous week which had a total of -64,721 net contracts.

This week’s current strength score (the trader positioning range over the past three years, measured from 0 to 100) shows the speculators are currently Bullish with a score of 79.4 percent. The commercials are Bearish-Extreme with a score of 17.5 percent and the small traders (not shown in chart) are Bullish-Extreme with a score of 80.1 percent.

Price Trend-Following Model: Downtrend

Our weekly trend-following model classifies the current market price position as: Downtrend. The current action for the model is considered to be: Hold – Maintain Short Position.

VIX Volatility Futures StatisticsSPECULATORSCOMMERCIALSSMALL TRADERS
– Percent of Open Interest Longs:23.250.26.4
– Percent of Open Interest Shorts:36.735.97.2
– Net Position:-54,92458,022-3,098
– Gross Longs:94,274204,07126,095
– Gross Shorts:149,198146,04929,193
– Long to Short Ratio:0.6 to 11.4 to 10.9 to 1
NET POSITION TREND:
– Strength Index Score (3 Year Range Pct):79.417.580.1
– Strength Index Reading (3 Year Range):BullishBearish-ExtremeBullish-Extreme
NET POSITION MOVEMENT INDEX:
– 6-Week Change in Strength Index:7.1-7.32.2


S&P500 Mini Futures:

SP500 Mini Futures COT ChartThe S&P500 Mini large speculator standing this week reached a net position of -207,239 contracts in the data reported through Tuesday. This was a weekly lift of 1,011 contracts from the previous week which had a total of -208,250 net contracts.

This week’s current strength score (the trader positioning range over the past three years, measured from 0 to 100) shows the speculators are currently Bearish with a score of 33.8 percent. The commercials are Bullish with a score of 68.3 percent and the small traders (not shown in chart) are Bearish with a score of 44.7 percent.

Price Trend-Following Model: Strong Uptrend

Our weekly trend-following model classifies the current market price position as: Strong Uptrend. The current action for the model is considered to be: Hold – Maintain Long Position.

S&P500 Mini Futures StatisticsSPECULATORSCOMMERCIALSSMALL TRADERS
– Percent of Open Interest Longs:10.176.411.1
– Percent of Open Interest Shorts:19.567.111.1
– Net Position:-207,239205,7911,448
– Gross Longs:223,3581,688,344245,999
– Gross Shorts:430,5971,482,553244,551
– Long to Short Ratio:0.5 to 11.1 to 11.0 to 1
NET POSITION TREND:
– Strength Index Score (3 Year Range Pct):33.868.344.7
– Strength Index Reading (3 Year Range):BearishBullishBearish
NET POSITION MOVEMENT INDEX:
– 6-Week Change in Strength Index:29.4-29.86.8


Dow Jones Mini Futures:

Dow Jones Mini Futures COT ChartThe Dow Jones Mini large speculator standing this week reached a net position of -13,082 contracts in the data reported through Tuesday. This was a weekly boost of 5,840 contracts from the previous week which had a total of -18,922 net contracts.

This week’s current strength score (the trader positioning range over the past three years, measured from 0 to 100) shows the speculators are currently Bearish with a score of 36.9 percent. The commercials are Bullish with a score of 62.7 percent and the small traders (not shown in chart) are Bearish with a score of 38.3 percent.

Price Trend-Following Model: Uptrend

Our weekly trend-following model classifies the current market price position as: Uptrend. The current action for the model is considered to be: Hold – Maintain Long Position.

Dow Jones Mini Futures StatisticsSPECULATORSCOMMERCIALSSMALL TRADERS
– Percent of Open Interest Longs:25.560.313.4
– Percent of Open Interest Shorts:39.245.414.7
– Net Position:-13,08214,236-1,154
– Gross Longs:24,23357,40312,794
– Gross Shorts:37,31543,16713,948
– Long to Short Ratio:0.6 to 11.3 to 10.9 to 1
NET POSITION TREND:
– Strength Index Score (3 Year Range Pct):36.962.738.3
– Strength Index Reading (3 Year Range):BearishBullishBearish
NET POSITION MOVEMENT INDEX:
– 6-Week Change in Strength Index:27.3-23.810.3


Nasdaq Mini Futures:

Nasdaq Mini Futures COT ChartThe Nasdaq Mini large speculator standing this week reached a net position of 5,458 contracts in the data reported through Tuesday. This was a weekly decline of -11,784 contracts from the previous week which had a total of 17,242 net contracts.

This week’s current strength score (the trader positioning range over the past three years, measured from 0 to 100) shows the speculators are currently Bullish-Extreme with a score of 80.3 percent. The commercials are Bearish with a score of 20.2 percent and the small traders (not shown in chart) are Bullish with a score of 50.4 percent.

Price Trend-Following Model: Uptrend

Our weekly trend-following model classifies the current market price position as: Uptrend. The current action for the model is considered to be: Hold – Maintain Long Position.

Nasdaq Mini Futures StatisticsSPECULATORSCOMMERCIALSSMALL TRADERS
– Percent of Open Interest Longs:28.452.816.1
– Percent of Open Interest Shorts:26.254.316.7
– Net Position:5,458-3,883-1,575
– Gross Longs:70,707131,22340,005
– Gross Shorts:65,249135,10641,580
– Long to Short Ratio:1.1 to 11.0 to 11.0 to 1
NET POSITION TREND:
– Strength Index Score (3 Year Range Pct):80.320.250.4
– Strength Index Reading (3 Year Range):Bullish-ExtremeBearishBullish
NET POSITION MOVEMENT INDEX:
– 6-Week Change in Strength Index:-5.21.213.6


Russell 2000 Mini Futures:

Russell 2000 Mini Futures COT ChartThe Russell 2000 Mini large speculator standing this week reached a net position of -67,510 contracts in the data reported through Tuesday. This was a weekly decline of -3,810 contracts from the previous week which had a total of -63,700 net contracts.

This week’s current strength score (the trader positioning range over the past three years, measured from 0 to 100) shows the speculators are currently Bearish with a score of 31.5 percent. The commercials are Bullish with a score of 66.4 percent and the small traders (not shown in chart) are Bearish with a score of 37.9 percent.

Price Trend-Following Model: Strong Uptrend

Our weekly trend-following model classifies the current market price position as: Strong Uptrend. The current action for the model is considered to be: New Buy – Long Position.

Russell 2000 Mini Futures StatisticsSPECULATORSCOMMERCIALSSMALL TRADERS
– Percent of Open Interest Longs:10.383.54.7
– Percent of Open Interest Shorts:23.471.14.0
– Net Position:-67,51063,8563,654
– Gross Longs:52,926429,65624,280
– Gross Shorts:120,436365,80020,626
– Long to Short Ratio:0.4 to 11.2 to 11.2 to 1
NET POSITION TREND:
– Strength Index Score (3 Year Range Pct):31.566.437.9
– Strength Index Reading (3 Year Range):BearishBullishBearish
NET POSITION MOVEMENT INDEX:
– 6-Week Change in Strength Index:-11.24.731.4


Nikkei Stock Average (USD) Futures:

Nikkei Stock Average (USD) Futures COT ChartThe Nikkei Stock Average (USD) large speculator standing this week reached a net position of -6,185 contracts in the data reported through Tuesday. This was a weekly gain of 61 contracts from the previous week which had a total of -6,246 net contracts.

This week’s current strength score (the trader positioning range over the past three years, measured from 0 to 100) shows the speculators are currently Bearish with a score of 28.7 percent. The commercials are Bullish with a score of 64.3 percent and the small traders (not shown in chart) are Bearish with a score of 47.3 percent.

Price Trend-Following Model: Uptrend

Our weekly trend-following model classifies the current market price position as: Uptrend. The current action for the model is considered to be: Hold – Maintain Long Position.

Nikkei Stock Average Futures StatisticsSPECULATORSCOMMERCIALSSMALL TRADERS
– Percent of Open Interest Longs:8.963.627.5
– Percent of Open Interest Shorts:46.735.118.2
– Net Position:-6,1854,6711,514
– Gross Longs:1,46010,4074,492
– Gross Shorts:7,6455,7362,978
– Long to Short Ratio:0.2 to 11.8 to 11.5 to 1
NET POSITION TREND:
– Strength Index Score (3 Year Range Pct):28.764.347.3
– Strength Index Reading (3 Year Range):BearishBullishBearish
NET POSITION MOVEMENT INDEX:
– 6-Week Change in Strength Index:-4.4-1.411.4


MSCI EAFE Mini Futures:

MSCI EAFE Mini Futures COT ChartThe MSCI EAFE Mini large speculator standing this week reached a net position of -11,743 contracts in the data reported through Tuesday. This was a weekly rise of 4,241 contracts from the previous week which had a total of -15,984 net contracts.

This week’s current strength score (the trader positioning range over the past three years, measured from 0 to 100) shows the speculators are currently Bearish with a score of 29.9 percent. The commercials are Bullish with a score of 70.8 percent and the small traders (not shown in chart) are Bearish with a score of 26.9 percent.

Price Trend-Following Model: Weak Uptrend

Our weekly trend-following model classifies the current market price position as: Weak Uptrend. The current action for the model is considered to be: Hold – Maintain Long Position.

MSCI EAFE Mini Futures StatisticsSPECULATORSCOMMERCIALSSMALL TRADERS
– Percent of Open Interest Longs:6.590.72.1
– Percent of Open Interest Shorts:9.588.21.6
– Net Position:-11,7439,7691,974
– Gross Longs:25,587356,5048,292
– Gross Shorts:37,330346,7356,318
– Long to Short Ratio:0.7 to 11.0 to 11.3 to 1
NET POSITION TREND:
– Strength Index Score (3 Year Range Pct):29.970.826.9
– Strength Index Reading (3 Year Range):BearishBullishBearish
NET POSITION MOVEMENT INDEX:
– 6-Week Change in Strength Index:10.7-7.0-14.4


Article By InvestMacroReceive our weekly COT Newsletter

*COT Report: The COT data, released weekly to the public each Friday, is updated through the most recent Tuesday (data is 3 days old) and shows a quick view of how large speculators or non-commercials (for-profit traders) were positioned in the futures markets.

The CFTC categorizes trader positions according to commercial hedgers (traders who use futures contracts for hedging as part of the business), non-commercials (large traders who speculate to realize trading profits) and nonreportable traders (usually small traders/speculators) as well as their open interest (contracts open in the market at time of reporting). See CFTC criteria here.