Stock markets are likely to fall this summer, which will provide investors a key buying opportunity to enhance their portfolios, says the CEO and founder of one of the world’s largest independent financial advisory, asset management and fintech organizations.
Nigel Green of deVere Group’s comments come as UK inflation exceeds expectations in May and as the US Federal Reserve Chair Jerome Powell confirms that interest rate hikes should be expected as inflation is “well above” where it should be.
Mr Powell stated: “Inflation pressures continue to run high, and the process of getting inflation back down to 2% has a long way to go.”
Meanwhile, UK inflation on Wednesday was higher than expected in May, as consumer prices climbed by an annual 8.7% – considerably higher than the Bank of England’s 2% target.
The deVere CEO observes: “Inflation remains high and sticky – surprisingly so – in most major developed economies.
“This puts fresh pressure on central banks to maintain interest rate hikes, or drop the pause in the case of the US Fed.”
Higher borrowing costs impact corporate profits as companies may face higher interest expenses on their existing debt or find it more expensive to finance new projects. This typically leads to a decrease in investor confidence and a decline in stock prices.
Interest rate jumps can discourage consumer borrowing and spending. When borrowing costs increase, individuals may be less willing to take on new loans for purchases such as homes, cars, or other consumer goods. This reduced consumer spending can negatively affect the earnings and profitability of businesses, leading to a decrease in stock prices.
In addition, rising interest rates make fixed-income investments, such as bonds, more attractive relative to stocks. As bond yields increase, investors may reallocate their investments from stocks to bonds, seeking higher returns with less risk.
“Therefore, investors should be cautious as we expect stock market corrections this summer,” says Nigel Green.
“This would present major buying opportunities for investors to enhance their portfolios with quality stocks at lower entry points.
“They’ll be speaking with financial advisors about potential winners and losers from such a fall.”
US stocks were down on Wednesday, with the S&P 500 and the Nasdaq dipping around 0.4%, while the Dow Jones shed 0.3%. In the UK, the benchmark FTSE 100 fell to a three-week low.
Against a backdrop of still sticky-high inflation, sectors that do well in a stagflationary environment should also be included in portfolios.
“These include commodities, such as oil, as their prices typically rise in response to inflation; consumer staples like food, and hygiene products, as demand is likely to remain relatively stable; healthcare, as it provides essential services that are less affected by economic cycles; and utilities, including electricity, gas, and water as demand will also be pretty consistent,” noted the deVere CEO recently.
“Investors should, as always, remain diversified across asset classes, sectors and regions in order to maximise returns per unit of risk (volatility) incurred.”
He concludes: “We expect further and intensifying market volatility this summer. This will be used, as it always is, by investors to bolster their investment portfolios.
“This can prove to be an extremely effective strategy, but advice should be sought from a quality fund manager.”
About:
deVere Group is one of the world’s largest independent advisors of specialist global financial solutions to international, local mass affluent, and high-net-worth clients. It has a network of more than 70 offices across the world, over 80,000 clients and $12bn under advisement.
A sense of unease gripped financial markets on Wednesday as concerns over China’s growth outlook and sticky UK inflation data left investors on edge ahead of Jerome Powell’s testimony to Congress.
Market players are likely to adopt a guarded approach towards riskier assets amid the cautious mood, resulting in markets trading in tight ranges until a fresh catalyst is brought into the picture. As discussed throughout the week, Jerome Powell is widely expected to reiterate comments from his post-Fed meeting press conference, opening the doors to further rate hikes. If expectations match reality with fresh clues offered on rate hike timings, this could spark volatility across financial markets.
Here are some technical setups to keep an eye on this week:
SPX500_m under pressure
It has been a rough week for the SPX500_m thanks to the risk-off mood and overall caution. Bears seem to be on the prowl with prices slowly approaching the 4351 level. Although the trend still remains bullish on the daily charts, this outlook could be threatened if a solid breakdown and daily close below 4351 is achieved. Such a development could signal a further decline towards 4300. If prices are able to push beyond last week’s high of 4451.5, the next key level can be found at 4500.
NQ100_m breakout pending?
The NQ100_m remains in an uptrend on the daily charts. There have been consistently higher highs and higher lows while prices are trading above the 200-, 100- and 50-day SMA. The price action over the past few days suggests that the index could be waiting for a fresh fundamental spark before embarking on its next move. A solid breakout above 15300 could trigger an incline towards levels not seen since January 2022 around 15700. Should prices remain trapped below 15300, this may see the index sink towards 14670.
STOX50 capped below 4430?
It has been a choppy affair for the STOX50 with prices trapped within a wide range. Strong resistance can be found at 4430 while support can be seen at 4280 and 4230. Should bears switch into higher gear, this may drag prices back toward the 100-day SMA at 4280 and lower. Alternatively, a breakout above 4430 could propel prices to levels not seen since mid-2007 around 4500.
UK100 breakout on horizon…
The UK100 could be gearing up for a major breakout as prices bounce with a tightening range on the daily charts. Support can be found just above the 200-day SMA at 7550 and resistance around 7650. Should prices break above 7650, this could encourage an incline towards 7690 and 7740, where the 100-day SMA can be found. A breakdown below 7550 could see prices sink towards 7440.
Crude rangebound…
Oil prices remain trapped within a range on the daily charts with support at $67.00 and resistance at $74.40. A solid daily close below $67.00 may open the doors toward $64.50. Should prices push above $74.00, this could encourage an incline toward $76.80.
Calm before gold storm?
Gold prices remain under pressure ahead of Jerome Powell’s two-day hearings before Congress which kicks off today. Despite trading within a range on the daily timeframe, the scales of power seem to be swinging in favour of gold bears. A breakdown below $1932 could open a path toward $1893. Alternatively, a rebound back above $1959 may see prices retest the $1985 resistance. Should prices break above $1985, the next key level of interest can be found at $2000.
“I became panicky and covered at a considerable loss…”
By Elliott Wave International
The reason price patterns tend to repeat in the stock market is that investor psychology never changes.
The Elliott wave model directly reflects these largely predictable swings in investor psychology. That’s what the Elliott wave principle is all about.
One of those price moves which has historically fooled investors is the first big rally in a bear market.
These rallies are characterized by an “aggressive euphoria,” as Frost & Prechter’s Wall Street classic book, Elliott Wave Principle: Key to Market Behavior, states.
Why? Because many investors are convinced that the bull market is back.
In Robert Rhea’s 1934 book, The Story of the Averages, he described what was going on regarding the rally in the early months of 1930:
I became panicky and covered [my short position] at a considerable loss. … Nearly everyone was proclaiming a new bull market. Services were extremely bullish.
As you know, the 1929-1932 bear market turned out to be brutal.
A more recent example is what took place during the 2007-2009 bear market. This chart is from a past Elliott Wave Theorist, a monthly publication which covers major financial and cultural trends:
The black arrow indicates the October 2007 top. After the initial leg down, notice that sizeable rally around March 2008. A lot of investors plowed a lot of money into the market at precisely the wrong time. As you can see, the worst of the 2007-2009 bear market was ahead.
These two historic examples of bear market rallies do not mean that we’re on the verge of an exact replica.
But we do see striking similarities between those periods of price history and how the market is behaving here in 2023.
Those similarities include the stock market’s Elliott wave pattern. Frost & Prechter’s Elliott Wave Principle: Key to Market Behavior was referenced earlier. Here’s another quote from this definitive text on the Wave Principle:
Without Elliott, there appear to be an infinite number of possibilities for market action. What the Wave Principle provides is a means of first limiting the possibilities and then ordering the relative probabilities of possible future market paths. Elliott’s highly specific rules reduce the number of valid alternatives to a minimum. Among those, the best interpretation, sometimes called the “preferred count,” is the one that satisfies the largest number of guidelines. Other interpretations are ordered accordingly.
If you’d like to read the entire online version of the book, you may do so for free once you become a member of Club EWI, the world’s largest Elliott wave educational community.
A Club EWI membership is also free and allows for free access to a wealth of Elliott wave resources on investing and trading.
This article was syndicated by Elliott Wave International and was originally published under the headline Stocks: Possible Replay of an Ominous Price Pattern. EWI is the world’s largest market forecasting firm. Its staff of full-time analysts led by Chartered Market Technician Robert Prechter provides 24-hour-a-day market analysis to institutional and private investors around the world.
The European Union filed an antitrust case against Google on June 14, 2023, charging that the company abused its power in the online advertising market to disadvantage its competition. The U.S. Department of Justice filed a similar civil antitrust suit against Google on Jan. 24, 2023.
The online ad ecosystem is largely built around “programmatic advertising,” a system for placing advertisements from millions of advertisers on millions of websites. The system uses computers to automate bidding by advertisers on available ad spaces, often with transactions occurring faster than would be possible manually. Google runs the dominant advertising platform and has 28% market share of global advertising revenue.
Most websites outsource the task of selling ads to a complex network of advertising tech companies that do the work of figuring out which ads are shown to each particular person. Programmatic advertising is also a powerful tool that allows advertisers to target and reach people on a huge range of websites.
As a postdoctoral researcher in computer science, I study these technologies and companies, including how sketchy ads, like those for miracle weight-loss pills and suspicious-looking software, sometimes appear on legitimate, well-regarded websites.
Programmatic advertising, explained
The modern online advertising marketplace is meant to solve one problem: match the high volume of advertisements with the large number of ad spaces. The websites want to keep their ad spaces full and at the best prices, and the advertisers want to target their ads to relevant sites and users.
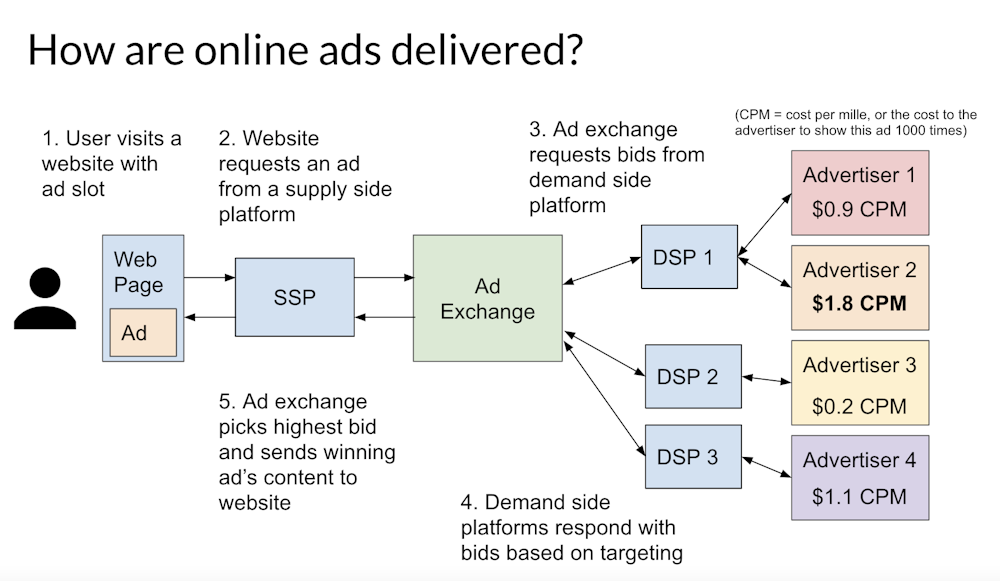
Rather than each website and advertiser pairing up to run ads together, advertisers work with demand-side platforms – tech companies that let advertisers buy ads. Websites work with supply-side platforms – tech companies that pay sites to put ads on their page. These companies handle the details of figuring out which websites and users should be matched with specific ads.
Most of the time, ad tech companies decide which ads to show through a real-time bidding auction. Whenever a person loads a website, and the website has a space for an ad, the website’s supply-side platform will request bids for ads from demand-side platforms through an auction system called an ad exchange. The demand-side platform will decide which ad in their inventory best targets the particular user, based on any information they’ve collected about the user’s interests and web history from tracking users’ browsing, and then submit a bid. The winner of this auction gets to place their ad in front of the user. This all happens in an instant.
When you see an ad on a web page, behind the scenes an ad network has just automatically conducted an auction to decide which advertiser won the right to present their ad to you. Eric Zeng, CC BY-ND
Google runs a supply-side platform, demand-side platform and an exchange. These three components make up an ad network. Google’s control of these three components sets the stage for the company to manipulate the market, as the EU and Justice Department allege the company has done. A variety of smaller companies such as Criteo, Pubmatic, Rubicon and AppNexus also operate in the online advertising market.
This system allows an advertiser to run ads to potentially millions of users, across millions of websites, without needing to know the details of how that happens. And it allows websites to solicit ads from countless potential advertisers without needing to contact or reach an agreement with any of them.
Screening out bad ads
Malicious advertisers, like any other advertiser, can take advantage of the scale and reach of programmatic advertising to send scams and links to malware to potentially millions of users on any website. I study how malicious online advertisers take advantage of this system. This means that online advertising companies have a big responsibility to prevent harmful ads from reaching users, but they sometimes fall short.
There are some checks against bad ads at multiple levels. Ad networks, supply-side platforms and demand-side platforms typically have content policies restricting harmful ads. For example, Google Ads has an extensive content policy that forbids illegal and dangerous products, inappropriate and offensive content, and a long list of deceptive techniques, such as phishing, clickbait, false advertising and doctored imagery.
However, other ad networks have less stringent policies. For example, MGID, a native advertising network my colleagues and I examined for a study and found to run many lower-quality ads, has a much shorter content policy that prohibits illegal, offensive and malicious ads, and a single line about “misleading, inaccurate or deceitful information.” Native advertising is designed to imitate the look and feel of the website that it appears on, and is typically responsible for the sketchy looking ads at the bottom of news articles. Another native ad network, content.ad, has no content policy on their website at all.
These political ads from the 2020 election are examples of potentially misleading techniques to get you to click on them. The ad on the left uses Donald Trump’s name and a clickbait headline promising money. The ad in the center claims to be a thank-you card for Dr. Anthony Fauci but in reality is intended to collect email addresses for political mailing lists. The ad on the right presents itself as an opinion poll but links to a page selling a product. Screenshots by Eric Zeng
Websites can block specific advertisers and categories of ads. For example, a site could block a particular advertiser that has been running scammy ads on their page, or specific ad networks that have been serving low-quality ads.
However, these policies are only as good as the enforcement. Ad networks typically use a combination of manual content moderators and automated tools to check that each ad campaign complies with their policies. How effective these are is unclear, but a report by Confiant, a firm that tracks malware in advertising, suggests that between 0.14% and 1.29% of ads served by various supply-side platforms in the third quarter of 2020 were low quality.
Malicious advertisers adapt to countermeasures and figure out ways to evade automated or manual auditing of their ads, or exploit gray areas in content policies. For example, in a study my colleagues and I conducted on deceptive political ads during the 2020 U.S. elections, we found many examples of fake political polls, which purported to be public opinion polls but asked for an email address to vote. Voting in the poll signed the user up for political email lists. Despite this deception, ads like these may not have violated Google’s content policies for political content, data collection or misrepresentation, or were simply missed in the review process.
Bad ads by design
Lastly, some examples of “bad” ads are intentionally designed to be misleading and deceptive, by both the website and ad network. Native ads are a prime example. They apparently are effective because native advertising companies claim higher clickthrough rates and revenue for sites. Studieshaveshown that this is likely because users have difficulty telling the difference between native ads and the website’s content.
These are examples of native ads found on news websites. They imitate the look and feel of links to news articles and often contain clickbait, scams and questionable products. Screenshot by Eric Zeng
You may have seen native ads on many news and media websites, including on major sites like CNN, USA Today and Vox. If you scroll to the bottom of a news article, there may be a section called “sponsored content” or “around the web,” containing what look like news articles. However, all of these are paid content. My colleagues and I conducted a study on native advertising on news and misinformation websites and found that these native ads disproportionately contained potentially deceptive and misleading content, such as ads for unregulated health supplements, deceptively written advertorials, investment pitches and material from content farms.
This highlights an unfortunate situation. Even reputable news and media websites are struggling to earn revenue, and turn to running deceptive and misleading ads on their sites to earn more income, despite the risks it poses to their users and the cost to their reputations.
This is an updated version of an article originally published on April 13, 2022.
S&P 500 and Nasdaq 100 have seen double-digit gains respectively so far in 2023
AI-mania and hopes for Fed rate cuts in 2024 have boosted US tech stocks
Fed rate decision today could trigger big moves across the share market
In case you missed it, the US stock market has been soaring.
Consider the recent gains for these two benchmark equity indexes, used to measure how groups of US stocks are performing:
The S&P 500 has climbed by 13.8% so far this year.
The S&P 500 is an index which measures the overall share price performance of 500 leading US companies across various industries.
The Nasdaq 100 has surged by 36.2% year-to-date.
The Nasdaq 100 is an index that tracks the performance of 100 of the largest US non-financial stocks listed on the Nasdaq exchange.
Why have US stocks climbed?
1) AI-mania
“Artificial intelligence” is all the rage across stock markets now.
Despite the term “AI” having been coined since the 1950s, this latest craze was triggered by OpenAI’s November 2022 release of ChatGPT.
Bloomberg Intelligence predicts that Generative AI could generate US$ 1.3 trillion (that’s $1,300,000,000,000) in revenue for the tech industry in 10 years.
Bank of America’s recent survey shows that 40% of the polled 247 fund managers, who manage over US$700 billion in assets, believe that “widespread adoption of AI” will increase company profits within the next two years.
Nvidia is the best-performing stock on both the S&P 500 and the Nasdaq 100 so far in 2023!
Such feverish expectations have sent the likes of Nvidia soaring by 180% so far this year.
This company is now valued at over US$1 trillion (market cap), joining other Big Tech titans such as Apple, Microsoft, Alphabet (Google’s parent company), and Amazon in the Trillion-dollar club. Even Apple’s share price posted a new record high this past Monday, June 12th.
Hence, as the share prices of these huge companies soar, it boosts stock indexes such as the S&P 500 and the Nasdaq 100 (which is made up heavily of these tech stocks) along the way.
2) Federal Reserve may soon be done with interest rate hikes
First, note that markets are “forward looking” in nature. That means that today’s share price reflects tomorrow’s hopes.
Second, US stock markets generally fear the thought of US interest rates moving higher. Recall that US tech stocks in particular suffered a brutal 2022 as the Fed aggressively raised interest rates to cool down the highest inflation since the 80s.
Today, markets sense that the Federal Reserve a.k.a. the Fed (the US central bank) is almost done with its rate hikes, with a 71% chance given for one more 25-basis point hike in July.
On top of that, markets now think there’s a one-in-three chance that the Fed could CUT interest rates in early 2024.
Even FOMC members themselves (Fed officials on a special committee who vote on where to move interest rates) had projected back in March 2023 that there could be up to 75-basis points in rate cuts in 2024.
Hence, the share market (and tech stocks in particular) are rejoicing at the prospects of US interest rates being lowered (or at least not moving much higher from here) and are enjoying a brisk recovery after 2022’s massive selloff.
Can the likes of the S&P 500 and the Nasdaq 100 climb even higher?
It’s possible. At least Wall Street analysts believe so.
Over the next 12 months:
The Nasdaq 100 is forecasted to reach 15,726, which is about 5.5% higher from current levels.
The S&P 500 is forecasted to reach 4,784, which is about 5% higher from current levels.
However, these crucial factors need to remain in place through year-end and into 2024:
The AI-mania must continue attracting suitors who keep buying up US tech stocks
The Fed doesn’t keep raising interest rates much higher from here
Which brings us to the critical event for today (Wednesday, June 14th):
The Fed is due to announce its policy decision at 6:00PM GMT today.
Then 30 minutes later, Fed Chair Jerome Powell is set to answer live questions from journalists.
What to expect from today’s Fed decision?
The Fed is widely expected to hit the pause button today on its rate hike campaign that began in March 2022.
After this week, the US central bank is expected to trigger one final rate hike of 25-basis points perhaps in July.
An unexpected rate hike today would shock markets!
Ultimately, markets will be laser-focused on the Fed’s signals about future policy moves as contained within the FOMC policy statement, dot plot, and Chair Powell’s press conference.
For reference, here’s the Fed’s previous “dot plot” from March 2023, featuring FOMC members’ forecasts for US interest rates:
Here’s how the Fed could rock US stock markets today:
1) If the Fed suggests that rate hikes are almost over, that could see the S&P 500 and the Nasdaq 100 hop even higher.
The NQ100_m (which reflects the underlying Nasdaq 100 index) may then be pushed well above the psychologically-important 15,000 mark, and closer to the March 2022 peak of 15,274.
The SPX500_m (which reflects the underlying S&P 500 index) may then be pushed past the psychologically-important 4,400 mark.
2) If the Fed suggests that interest rates have to move even higher than 5.5% (from 5% currently), that could force the stock market to pull back lower.
The NQ100_m may then test support at the previous cycle high on the daily charts around 14,674.
The SPX500_m may then unwind recent gains to test the 4,312.9 line, which is the 61.8% Fibonacci level from its 2022 peak-to-trough drop.
Beware of potential technical pullback
Note from the two charts above, both the SPX500_m (daily chart) and the NQ100_m (weekly chart) are both well into “overbought” territory.
The 14-day/week relative strength index (RSI) on the respective charts have broken above the 70 threshold.
This typically sends a signal that both the prices of these indices may see a temporary drop, at least to clear some froth after its latest surge.
Yet, from a fundamental perspective, all eyes still remain on the Fed’s incoming policy signals later today.
Open your MT4/5 charts and notice how the NQ100_m and the SPX500_m are little changed on the daily charts so far today.
After all, traders and investors worldwide are on tenterhooks ahead of such a pivotal event that could sway trillions of dollars across global financial markets.
What the Fed does/doesn’t say or do in just a few hours from now is set to have a massive influence on how much higher US share markets can keep climbing over the near-term.
Global stock markets are likely to experience a wide boost this week – not just the mega cap tech stocks – as the US Federal Reserve is expected to pause interest rate hikes, says the CEO and founder of one of the world’s largest independent financial advisory, asset management and fintech organizations.
The bullish analysis from Nigel Green of deVere Group comes as investors worldwide wait for the latest inflation data Tuesday when the consumer price index report for the world’s largest economy is released. On Wednesday, the US central bank will issue its latest monetary policy decision.
He says: “Mega cap tech stocks – namely Apple, Microsoft, Nvidia, Amazon, Meta, Tesla and Alphabet – have made up around 90% of gains on Walls Street’s S&P 500 this year.
“But we expect that other sectors which have been outperformed so far in 2023 are likely to get a boost should the Fed, as we anticipate, pause rate hikes this week.”
The deVere CEO continues: “Despite a stubbornly robust labor market and still too-sticky inflation, the markets now expect the world’s most influential central bank to pause its interest hike agenda this month.
“This will firmly signal that progress is being made in the battle to cool inflation and this will buoy investors across the board, finally providing a boost to sectors which have been unloved so far this year.”
Last week, Nigel Green warned investors against exclusively buying into the hype of the tech titans, or so-called Magnificent Seven.
“The volume is getting louder and the frenzy is reaching fever pitch. This hype is dangerous as it could lead investors to assume that these stocks are a silver bullet to build long-term wealth – and they are not, at least not on their own,” he noted.
“While I believe that exposure to these mega-cap tech stocks should be part of almost every investor’s portfolio, as they have robust fundamentals and are future-focused, especially in AI, they should not be exclusive.”
Easing inflation – as would be indicated by a Fed pause this week – would, says the CEO, stimulate a “wider global stock market rally” that would be “positive across a broad sweep of asset classes, sectors and regions.”
Diversification, as Nigel Green stresses, remains investors’ best tool for long-term financial success. As a strategy it has been proven to reduce risk, smooth-out volatility, exploit differing market conditions, maximise long-term returns and protect against unforeseen external events.
The comments about a fresh rally come as stocks rose just enough last Thursday for Wall Street to run into a new bull market as the S&P 500 keeps rallying off its low from last autumn.
The index rose 0.6% to carry it 20% above a bottom hit in October. This means Wall Street’s main measure has climbed out of a challenging bear market, which saw it drop 25.4% over roughly nine months.
Meanwhile, the Dow Jones Industrial Average added 168 points, or 0.5%. The Nasdaq composite, meanwhile, led the market with a 1% rise.
He concludes: “Investors should be speaking to an advisor about the possibility of an opportunity-packed new rally if the Fed, as is expected, pauses rate hikes this week.”
About:
deVere Group is one of the world’s largest independent advisors of specialist global financial solutions to international, local mass affluent, and high-net-worth clients. It has a network of more than 70 offices across the world, over 80,000 clients and $12bn under advisement.
Semiconductors, or chips, should be included in your investment portfolio if you’re serious about growing your wealth over the next decade, says the CEO and founder of one of the world’s largest independent financial advisory, asset management and fintech organizations.
The observation from Nigel Green of deVere Group comes against an escalating, trillion-dollar chip battle between geopolitical superpower rivals, the US and China.
It also follows this week the Japanese government overhauling its chip strategy to triple sales of domestically produced semiconductors to over $108 billion by 2030; as France confirms it is to plough $3.1 billion of public money into a factory to make microchips; and as Europe and the United States have both passed so-called Chips Acts.
In addition, chipmaker Nvidia this week briefly broke into the club of companies with a $1 trillion market cap.
The deVere CEO says: “Semiconductors are tiny, but these mighty chips power our world. They are fuelling this current industrial revolution.
“Semiconductors are at the forefront of technological progress. As our reliance on electronic devices continues to grow, the demand for semiconductors is skyrocketing – and will continue to do.
“From smartphones and computers to automobiles and advanced infrastructure, semiconductors are indispensable in powering our daily lives. This ever-increasing demand has created a fiercely competitive market, with companies vying to capture larger market shares and gain technological superiority.”
He continues: “Beyond their technological significance, semiconductors have also become critical strategic assets. They are vital for national security, defense applications, and emerging technologies such as artificial intelligence, 5G, and the Internet of Things (IoT).
“The ability to control semiconductor manufacturing and develop cutting-edge chip designs has become a matter of top level strategic importance for countries and companies alike.”
Against this backdrop, Nigel Green says that investors looking to create and build wealth for the long-term should include exposure to chips in their portfolios.
“Their far-reaching – and growing – impact on our lives makes it a no-brainer for almost everyone to have semiconductors within a well-diversified portfolio.”
However, his bullish approach does come with a warning.
“But, with every boom, there will be winners and losers. A good fund manager will be critical in helping you make informed decisions.”
Seeking advice, it could be reasonably argued, is perhaps particularly important considering that semiconductors have become entangled in geopolitical tensions and economic considerations.
Major powers such as the US and China are engaged in a race for technological supremacy, with semiconductors at the forefront.
Concerns about intellectual property theft, national security risks, and economic dominance through control over semiconductor technology have prompted trade restrictions, export controls, and investment scrutiny, further fuelling the battleground.
“Semiconductors will remain a fiercely contested battleground for market dominance and technological advancements.
“Their strategic importance is what makes them such an attractive, a potentially hugely rewarding, proposition. Savvy investors keen to build wealth over the next decade will pile in,” concludes the deVere Group CEO.
About:
deVere Group is one of the world’s largest independent advisors of specialist global financial solutions to international, local mass affluent, and high-net-worth clients. It has a network of more than 70 offices across the world, over 80,000 clients and $12bn under advisement.
The SPX500_m index seems to be in a sturdy uptrend on the H4 timeframe with prices making a higher top at 4301.6 on Monday 5th June.
However, bears could be making an appearance after prices hit the weekly resistance level as sellers start coming into the market in more numbers. After hitting 4301.6, prices broke through the 15 Simple Moving Average (SMA) and the Momentum Oscillator altered course to the lower side, both confirming the intensified bearish action in the market.
After some initial bearish action and then a bit of flat lining, bulls re-tested the weekly resistance level but were not successful with a lower top forming on 7 June at 4301.3. Bears then gathered in more numbers with a possible critical support level forming when a lower bottom was recorded at 4259.9 on 8 June.
If the bears manage to break through the critical support level at 4259.9, then three possible price targets can be projected from there. Attaching the Fibonacci tool to the lower bottom at 4259.9, and dragging it to the lower top at 4301.3, the following targets may be calculated.
The first target can be estimated at 4234.3 (161.8%).
The second price target may be calculated at 4192.9 (261.8%).
If the price has enough momentum to reach the next weekly support level, the third and final target may be expected at 4125.9 (423.6%).
Alternatively, should the resistance level at 4301.3 is broken, the above scenario is cancelled and must be re-assessed.
As long as the bears keep building momentum, the outlook for SPX500_m on the H4 time frame will remain to the downside.
RoboMarkets is thrilled to announce that it was honoured with the prestigious “Best Stocks Broker” award at the Global Forex Awards 2022 – B2B. This marks the fourth consecutive year that RoboMarkets is recognised as the leading stocks broker, as the trader community highly values its products and services for trading in the stock market.
RoboMarkets offers its clients access to a wide selection of US Stocks and ETFs with a total of over 3,000 instruments to trade and invest in. One of the company’s worthy innovations is the R StocksTrader platform. It combines a modern design with a user-friendly interface while enabling exclusive access to trading around 1,000 stocks with 0% commission and without any hidden costs. High-quality service is a priority for RoboMarkets. This is why the company invests in the three pillars of a trusted brokerage firm: execution quality, security, and customer service.
The Global Forex Awards 2022 – B2B brings together the industry’s top companies that have made significant contributions to the development of trading solutions and innovations in financial markets. The awards recognise excellence in areas such as liquidity provision, client services, order execution, affiliate conditions, platforms and performance, and other crucial aspects of the Forex B2B market. Winners are determined through open voting by clients of forex companies worldwide.
About RoboMarkets
RoboMarkets is a financial brokerage company operating under CySEC licence No. 191/13. RoboMarkets offers investment services in many European countries and provides traders working in financial markets with access to its proprietary platforms. Visit www.robomarkets.com to find out more about the Company’s products and activities.
The ‘Magnificent Seven’ stocks that account for around 90% of gains on Walls Street’s S&P 500 this year are impressive, but not a silver bullet for investors, warns the CEO and founder of one of the world’s largest independent financial advisory, asset management and fintech organizations.
The warning from Nigel Green comes as high-profile market commentators among others flag the rewards across influential media outlets for investors for having exposure to seven big name companies.
The stocks being promoted are Apple, Microsoft, Nvidia, Amazon, Meta, Tesla and Alphabet.
He comments: “The volume is getting louder and the frenzy is reaching fever pitch about the so-called Magnificent Seven stocks.
“This hype is dangerous as it could lead investors to assume that these stocks are a silver bullet to build long-term wealth – and they are not, at least not on their own.
“While I believe that exposure to these mega-cap tech stocks should be part of almost every investor’s portfolio, as they have robust fundamentals and are future-focused, especially in AI, they should not be exclusive.”
The deVere CEO continues: “The prospect of a less aggressive Federal Reserve has fueled the surge in these stocks.
“But it must be remembered that the Fed is almost certainly not done yet with interest rate hikes, especially following Friday’s robust jobs report. Even if the central bank takes a pause this month, we do expect further rate rises are on their way before they bring their hiking program to an end. This could potentially hit these powerhouse stocks.”
Against a backdrop of cooling but still sticky-high inflation and fears of a recession, sectors that do well in a stagflationary environment should also be included in portfolios.
“These include commodities, such as oil, as their prices typically rise in response to inflation; consumer staples like food, and hygiene products, as demand is likely to remain relatively stable; healthcare, as it provides essential services that are less affected by economic cycles; and utilities, including electricity, gas, and water as demand will also be pretty consistent,” notes Nigel Green.
“Investors should, as always, remain diversified across asset classes, sectors and regions in order to maximise returns per unit of risk (volatility) incurred.”
Diversification remains investors’ best tool for long-term financial success. As a strategy it has been proven to reduce risk, smooth-out volatility, exploit differing market conditions, maximise long-term returns and protect against unforeseen external events.
He concludes: “The Magnificent Seven are incredibly important, of course, but they’re not a panacea. I fear some investors will get burned unless some of the heat is turned down.”
About:
deVere Group is one of the world’s largest independent advisors of specialist global financial solutions to international, local mass affluent, and high-net-worth clients. It has a network of more than 70 offices across the world, over 80,000 clients and $12bn under advisement.




 Article by