By InvestMacro
Here are the latest charts and statistics for the Commitment of Traders (COT) data published by the Commodities Futures Trading Commission (CFTC).
The latest COT data is updated through Tuesday September 26th and shows a quick view of how large traders (for-profit speculators and commercial entities) were positioned in the futures markets.
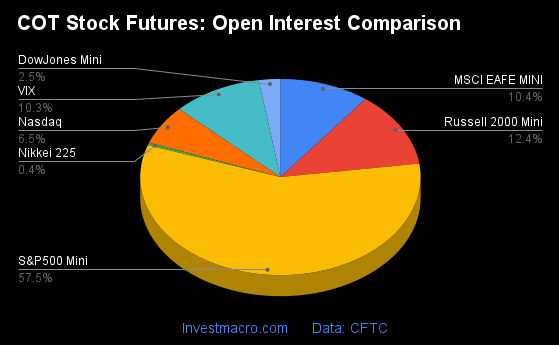
Weekly Speculator Changes led by S&P500-Mini & MSCI EAFE-Mini

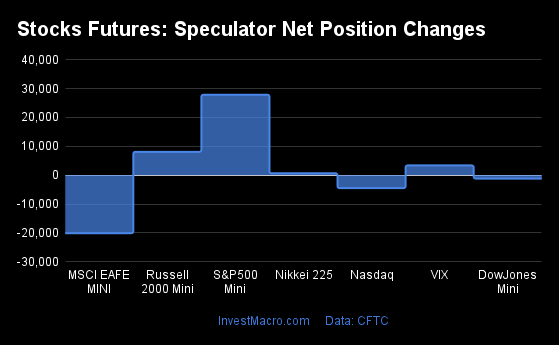
The COT stock markets speculator bets were lower this week as three out of the seven stock markets we cover had higher positioning while the other four markets had lower speculator contracts.
Leading the gains for the stock markets was the S&P500-Mini (49,710 contracts) with the MSCI EAFE-Mini (4,923 contracts) and the Russell-Mini (1,959 contracts) also showing positive weeks.
The markets with the declines in speculator bets this week were the VIX (-24,019 contracts) with the DowJones-Mini (-3,849 contracts), the Nasdaq-Mini (-2,348 contracts) and the Nikkei 225 (-196 contracts) also registering lower bets on the week.
| Sep-26-2023 | OI | OI-Index | Spec-Net | Spec-Index | Com-Net | COM-Index | Smalls-Net | Smalls-Index |
|---|
| S&P500-Mini | 2,137,648 | 15 | -89,281 | 51 | 65,622 | 49 | 23,659 | 47 |
| Nikkei 225 | 15,483 | 15 | -610 | 62 | -1,200 | 29 | 1,810 | 51 |
| Nasdaq-Mini | 241,018 | 29 | 846 | 66 | -992 | 36 | 146 | 66 |
| DowJones-Mini | 92,551 | 51 | -21,618 | 13 | 19,472 | 73 | 2,146 | 54 |
| VIX | 384,930 | 64 | -52,835 | 80 | 58,631 | 19 | -5,796 | 66 |
| Nikkei 225 Yen | 53,690 | 42 | 10,779 | 67 | 7,032 | 30 | -17,811 | 49 |
Strength Scores led by VIX & Nasdaq-Mini
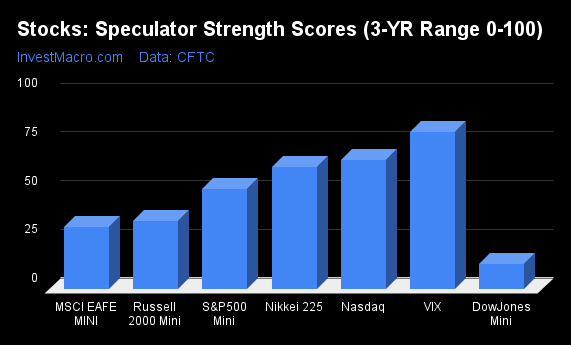
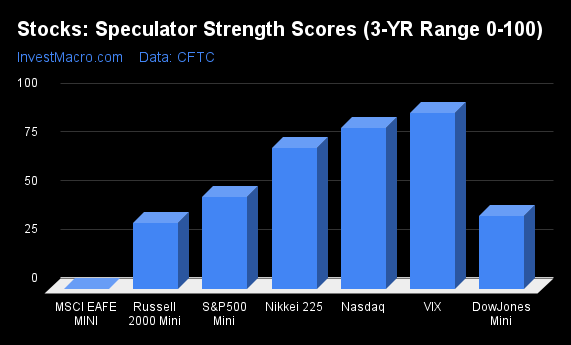
COT Strength Scores (a normalized measure of Speculator positions over a 3-Year range, from 0 to 100 where above 80 is Extreme-Bullish and below 20 is Extreme-Bearish) showed that the VIX (80 percent) currently leads the stock markets this week and is in Extreme-Bullish territory (above 80 percent). The Nasdaq-Mini (66 percent) and Nikkei 225 (62 percent) come in as the next highest in the weekly strength scores.
On the downside, the DowJones-Mini (13 percent) comes in at the lowest strength level currently and is in Extreme-Bearish territory (below 20 percent). The next lowest strength score is the MSCI EAFE-Mini (32 percent).
Strength Statistics:
VIX (80.4 percent) vs VIX previous week (97.9 percent)
S&P500-Mini (51.4 percent) vs S&P500-Mini previous week (44.0 percent)
DowJones-Mini (12.7 percent) vs DowJones-Mini previous week (23.6 percent)
Nasdaq-Mini (66.2 percent) vs Nasdaq-Mini previous week (68.2 percent)
Russell2000-Mini (35.0 percent) vs Russell2000-Mini previous week (33.8 percent)
Nikkei USD (62.4 percent) vs Nikkei USD previous week (63.8 percent)
EAFE-Mini (31.7 percent) vs EAFE-Mini previous week (27.0 percent)
Russell-Mini tops the 6-Week Strength Trends
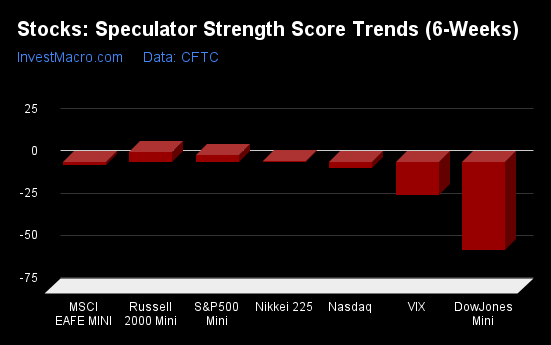
COT Strength Score Trends (or move index, calculates the 6-week changes in strength scores) showed that the Russell-Mini (6 percent) leads the past six weeks trends for the stock markets. The S&P500-Mini (4 percent) and the Nikkei 225 (1 percent) are the next highest positive movers in the latest trends data.
The DowJones-Mini (-52 percent) leads the downside trend scores currently with the VIX (-20 percent) coming in as the next market with lower trend scores.
Strength Trend Statistics:
VIX (-19.6 percent) vs VIX previous week (11.4 percent)
S&P500-Mini (4.3 percent) vs S&P500-Mini previous week (3.1 percent)
DowJones-Mini (-52.1 percent) vs DowJones-Mini previous week (-61.7 percent)
Nasdaq-Mini (-3.8 percent) vs Nasdaq-Mini previous week (12.3 percent)
Russell2000-Mini (5.8 percent) vs Russell2000-Mini previous week (0.6 percent)
Nikkei USD (0.6 percent) vs Nikkei USD previous week (1.8 percent)
EAFE-Mini (-1.8 percent) vs EAFE-Mini previous week (-7.1 percent)
Individual Stock Market Charts:
VIX Volatility Futures:
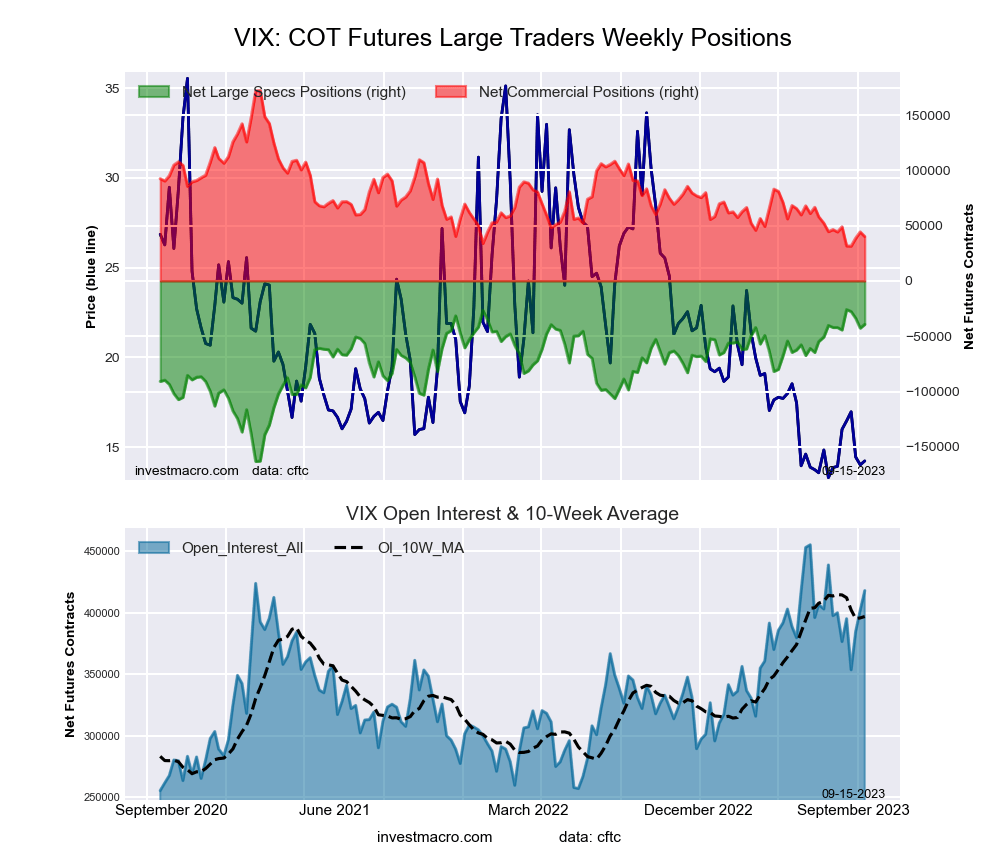
 The VIX Volatility large speculator standing this week reached a net position of -52,835 contracts in the data reported through Tuesday. This was a weekly lowering of -24,019 contracts from the previous week which had a total of -28,816 net contracts.
This week’s current strength score (the trader positioning range over the past three years, measured from 0 to 100) shows the speculators are currently Bullish-Extreme with a score of 80.4 percent. The commercials are Bearish-Extreme with a score of 19.3 percent and the small traders (not shown in chart) are Bullish with a score of 66.4 percent.
Price Trend-Following Model: Strong Uptrend
Our weekly trend-following model classifies the current market price position as: Strong Uptrend. The current action for the model is considered to be: New Buy – Long Position.
| VIX Volatility Futures Statistics | SPECULATORS | COMMERCIALS | SMALL TRADERS |
| – Percent of Open Interest Longs: | 22.4 | 47.2 | 6.4 |
| – Percent of Open Interest Shorts: | 36.2 | 32.0 | 7.9 |
| – Net Position: | -52,835 | 58,631 | -5,796 |
| – Gross Longs: | 86,408 | 181,651 | 24,727 |
| – Gross Shorts: | 139,243 | 123,020 | 30,523 |
| – Long to Short Ratio: | 0.6 to 1 | 1.5 to 1 | 0.8 to 1 |
| NET POSITION TREND: | | | |
| – Strength Index Score (3 Year Range Pct): | 80.4 | 19.3 | 66.4 |
| – Strength Index Reading (3 Year Range): | Bullish-Extreme | Bearish-Extreme | Bullish |
| NET POSITION MOVEMENT INDEX: | | | |
| – 6-Week Change in Strength Index: | -19.6 | 19.2 | -0.9 |
S&P500 Mini Futures:
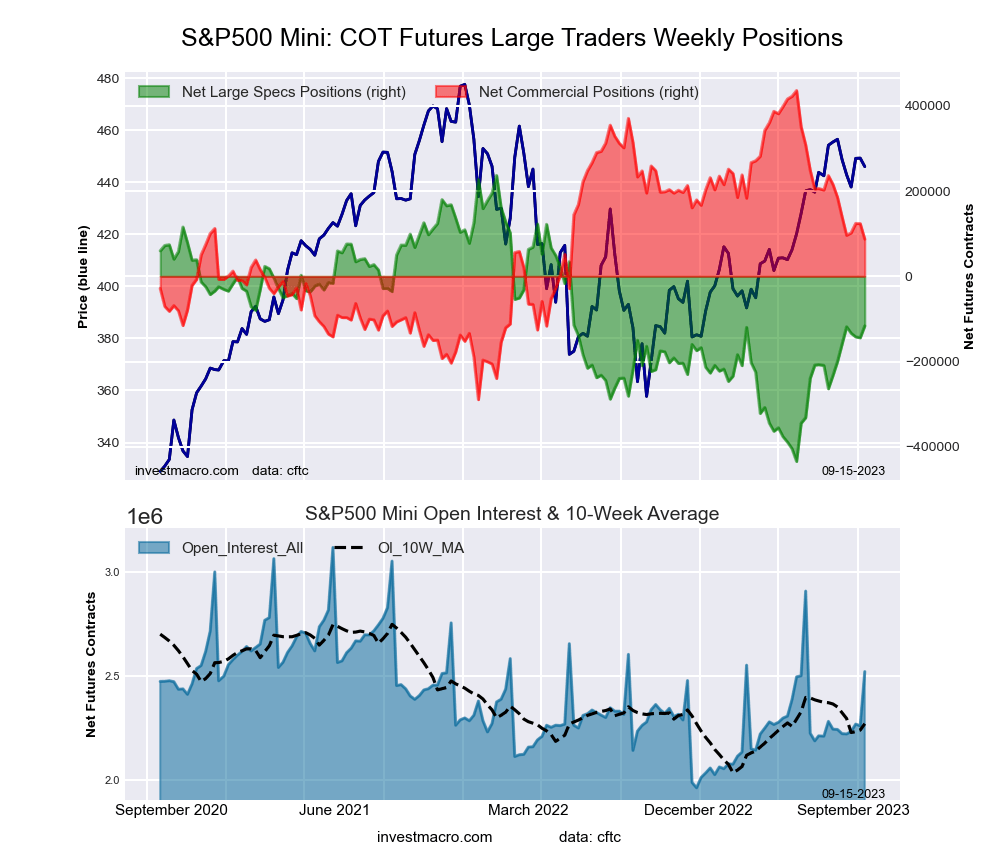
 The S&P500 Mini large speculator standing this week reached a net position of -89,281 contracts in the data reported through Tuesday. This was a weekly lift of 49,710 contracts from the previous week which had a total of -138,991 net contracts.
This week’s current strength score (the trader positioning range over the past three years, measured from 0 to 100) shows the speculators are currently Bullish with a score of 51.4 percent. The commercials are Bearish with a score of 49.0 percent and the small traders (not shown in chart) are Bearish with a score of 46.6 percent.
Price Trend-Following Model: Weak Uptrend
Our weekly trend-following model classifies the current market price position as: Weak Uptrend. The current action for the model is considered to be: Hold – Maintain Long Position.
| S&P500 Mini Futures Statistics | SPECULATORS | COMMERCIALS | SMALL TRADERS |
| – Percent of Open Interest Longs: | 12.4 | 73.0 | 11.8 |
| – Percent of Open Interest Shorts: | 16.6 | 69.9 | 10.7 |
| – Net Position: | -89,281 | 65,622 | 23,659 |
| – Gross Longs: | 266,095 | 1,560,014 | 251,580 |
| – Gross Shorts: | 355,376 | 1,494,392 | 227,921 |
| – Long to Short Ratio: | 0.7 to 1 | 1.0 to 1 | 1.1 to 1 |
| NET POSITION TREND: | | | |
| – Strength Index Score (3 Year Range Pct): | 51.4 | 49.0 | 46.6 |
| – Strength Index Reading (3 Year Range): | Bullish | Bearish | Bearish |
| NET POSITION MOVEMENT INDEX: | | | |
| – 6-Week Change in Strength Index: | 4.3 | -4.2 | 0.6 |
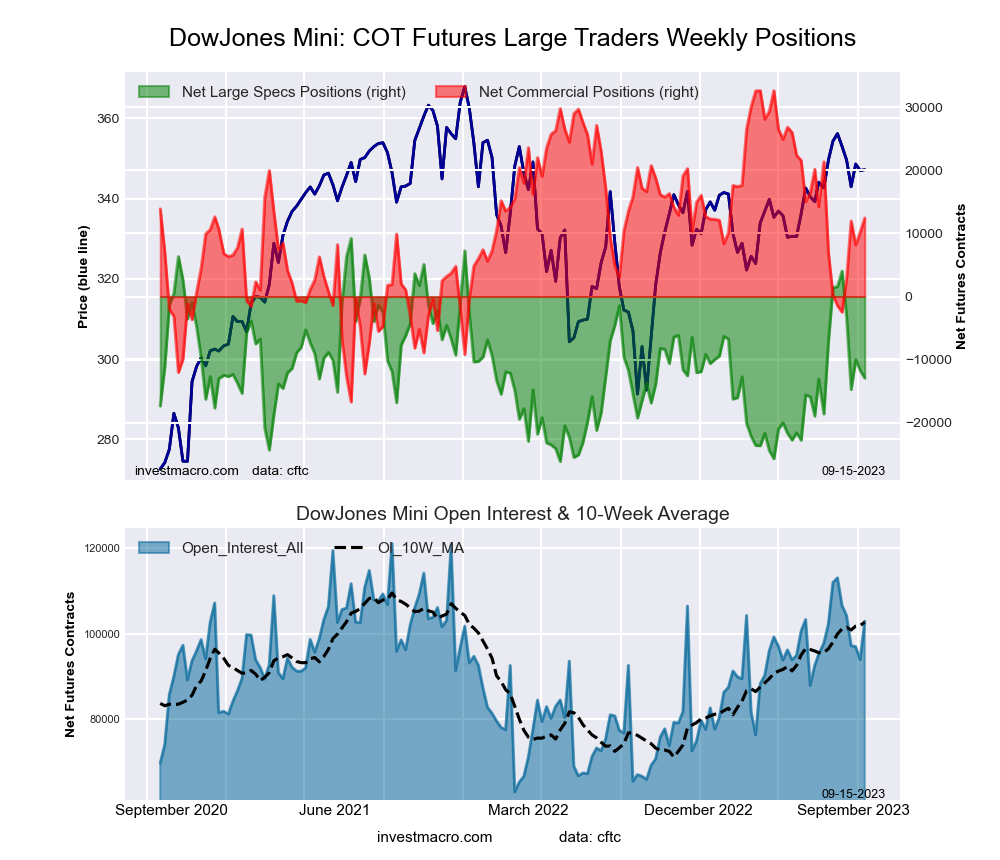
Dow Jones Mini Futures:
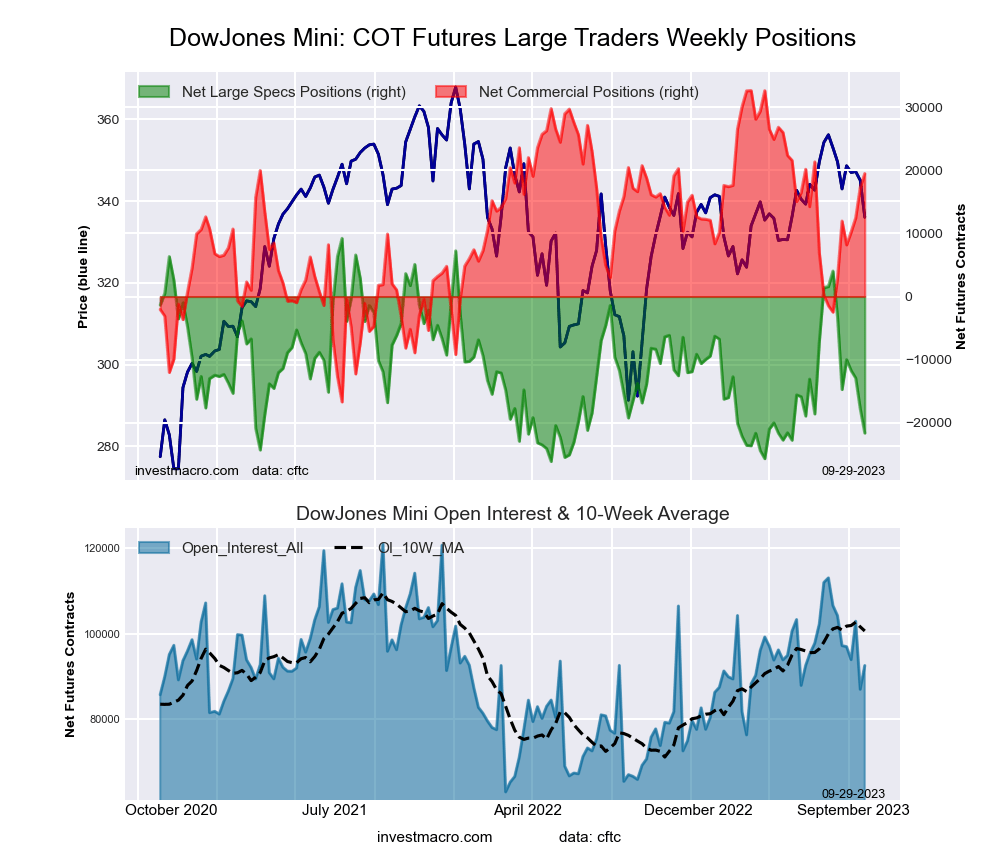 The Dow Jones Mini large speculator standing this week reached a net position of -21,618 contracts in the data reported through Tuesday. This was a weekly lowering of -3,849 contracts from the previous week which had a total of -17,769 net contracts.
This week’s current strength score (the trader positioning range over the past three years, measured from 0 to 100) shows the speculators are currently Bearish-Extreme with a score of 12.7 percent. The commercials are Bullish with a score of 73.3 percent and the small traders (not shown in chart) are Bullish with a score of 54.4 percent.
Price Trend-Following Model: Weak Uptrend
Our weekly trend-following model classifies the current market price position as: Weak Uptrend. The current action for the model is considered to be: Hold – Maintain Long Position.
| Dow Jones Mini Futures Statistics | SPECULATORS | COMMERCIALS | SMALL TRADERS |
| – Percent of Open Interest Longs: | 19.7 | 62.3 | 15.7 |
| – Percent of Open Interest Shorts: | 43.1 | 41.3 | 13.4 |
| – Net Position: | -21,618 | 19,472 | 2,146 |
| – Gross Longs: | 18,237 | 57,681 | 14,570 |
| – Gross Shorts: | 39,855 | 38,209 | 12,424 |
| – Long to Short Ratio: | 0.5 to 1 | 1.5 to 1 | 1.2 to 1 |
| NET POSITION TREND: | | | |
| – Strength Index Score (3 Year Range Pct): | 12.7 | 73.3 | 54.4 |
| – Strength Index Reading (3 Year Range): | Bearish-Extreme | Bullish | Bullish |
| NET POSITION MOVEMENT INDEX: | | | |
| – 6-Week Change in Strength Index: | -52.1 | 33.7 | 8.8 |
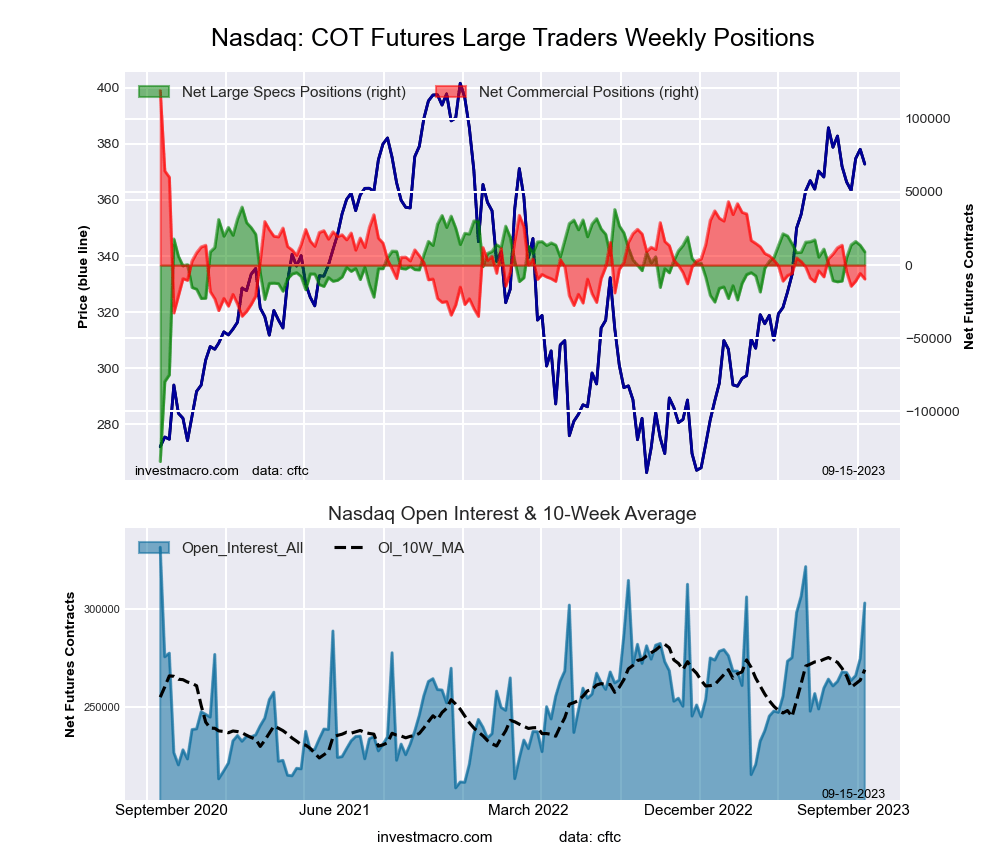
Nasdaq Mini Futures:
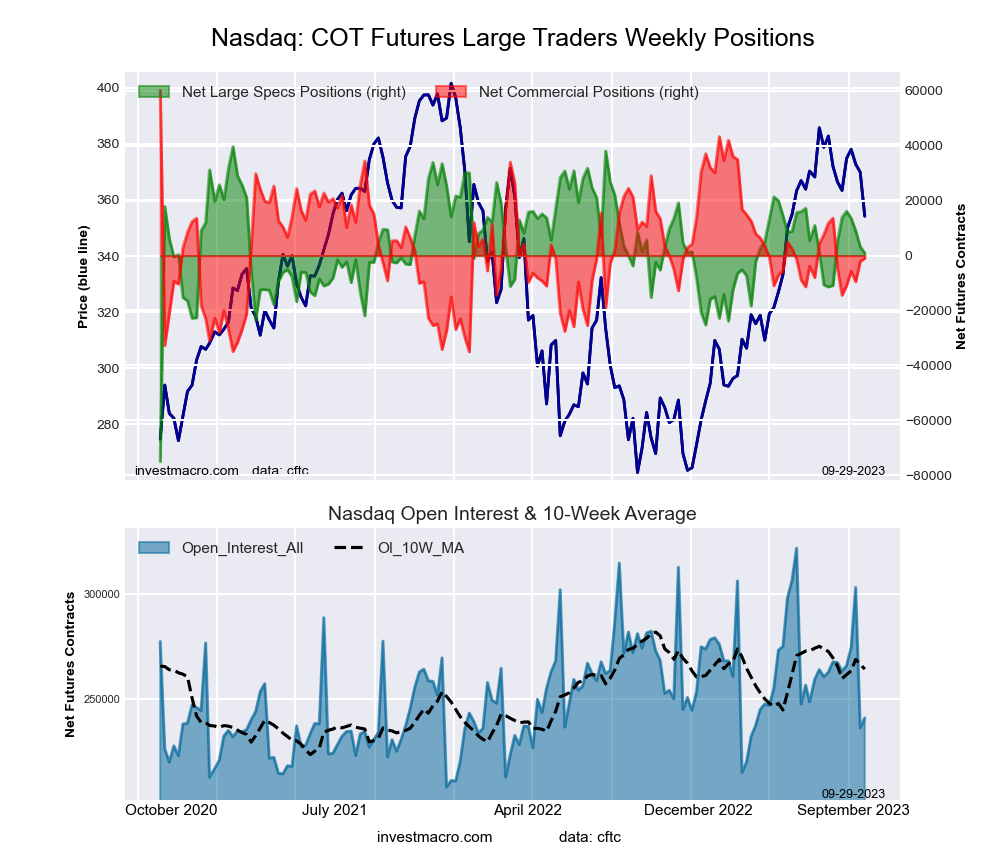 The Nasdaq Mini large speculator standing this week reached a net position of 846 contracts in the data reported through Tuesday. This was a weekly decline of -2,348 contracts from the previous week which had a total of 3,194 net contracts.
This week’s current strength score (the trader positioning range over the past three years, measured from 0 to 100) shows the speculators are currently Bullish with a score of 66.2 percent. The commercials are Bearish with a score of 35.8 percent and the small traders (not shown in chart) are Bullish with a score of 66.0 percent.
Price Trend-Following Model: Weak Uptrend
Our weekly trend-following model classifies the current market price position as: Weak Uptrend. The current action for the model is considered to be: Hold – Maintain Long Position.
| Nasdaq Mini Futures Statistics | SPECULATORS | COMMERCIALS | SMALL TRADERS |
| – Percent of Open Interest Longs: | 24.2 | 58.2 | 16.6 |
| – Percent of Open Interest Shorts: | 23.8 | 58.6 | 16.5 |
| – Net Position: | 846 | -992 | 146 |
| – Gross Longs: | 58,307 | 140,156 | 39,946 |
| – Gross Shorts: | 57,461 | 141,148 | 39,800 |
| – Long to Short Ratio: | 1.0 to 1 | 1.0 to 1 | 1.0 to 1 |
| NET POSITION TREND: | | | |
| – Strength Index Score (3 Year Range Pct): | 66.2 | 35.8 | 66.0 |
| – Strength Index Reading (3 Year Range): | Bullish | Bearish | Bullish |
| NET POSITION MOVEMENT INDEX: | | | |
| – 6-Week Change in Strength Index: | -3.8 | 3.9 | 1.4 |
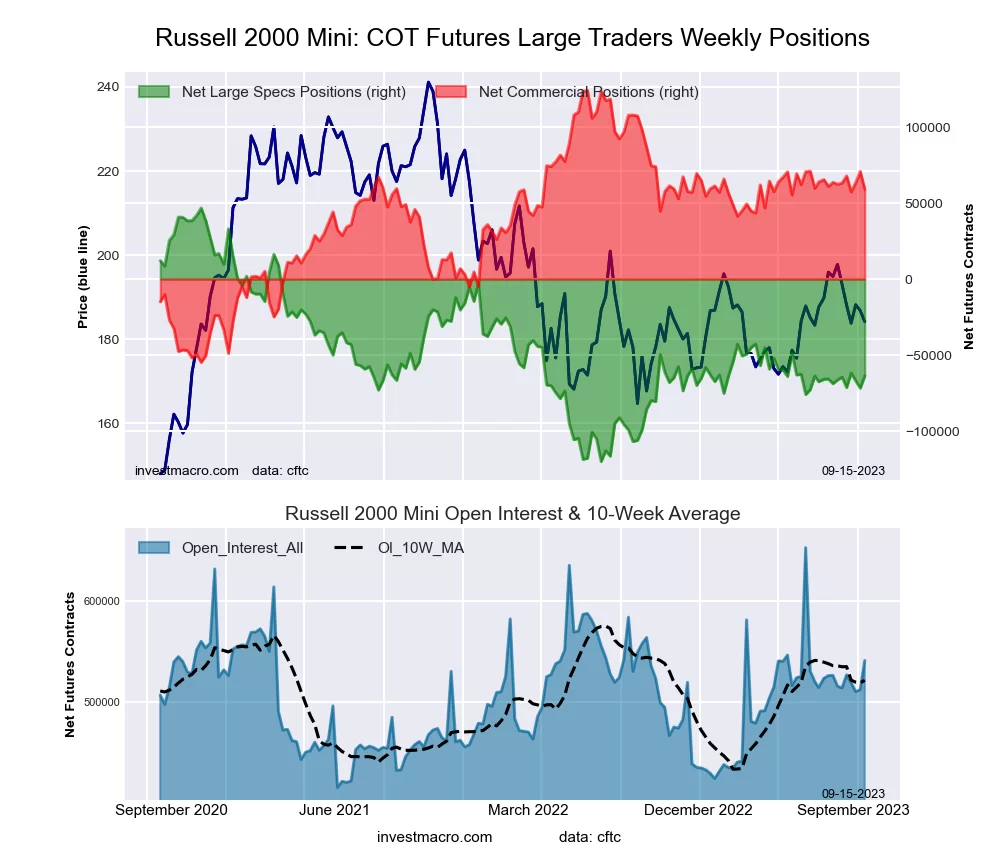
Russell 2000 Mini Futures:
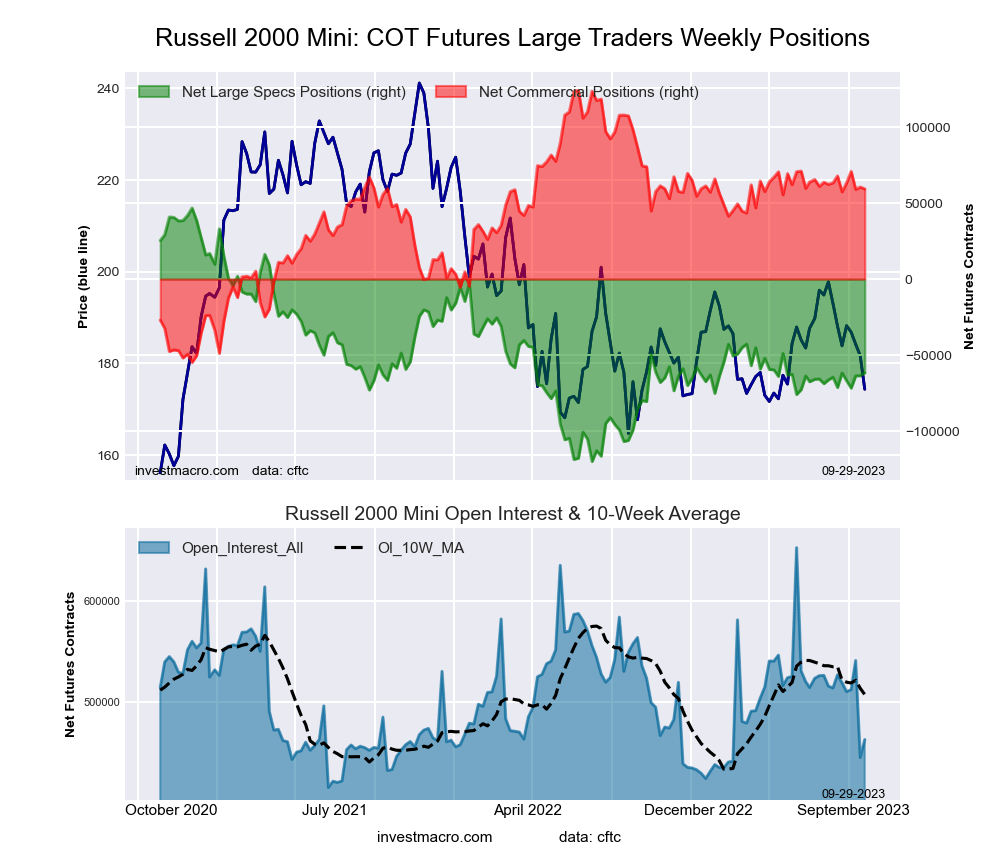 The Russell 2000 Mini large speculator standing this week reached a net position of -61,602 contracts in the data reported through Tuesday. This was a weekly rise of 1,959 contracts from the previous week which had a total of -63,561 net contracts.
This week’s current strength score (the trader positioning range over the past three years, measured from 0 to 100) shows the speculators are currently Bearish with a score of 35.0 percent. The commercials are Bullish with a score of 63.8 percent and the small traders (not shown in chart) are Bearish with a score of 33.8 percent.
Price Trend-Following Model: Weak Uptrend
Our weekly trend-following model classifies the current market price position as: Weak Uptrend. The current action for the model is considered to be: Hold – Maintain Long Position.
| Russell 2000 Mini Futures Statistics | SPECULATORS | COMMERCIALS | SMALL TRADERS |
| – Percent of Open Interest Longs: | 7.7 | 85.2 | 5.4 |
| – Percent of Open Interest Shorts: | 21.0 | 72.4 | 4.9 |
| – Net Position: | -61,602 | 59,276 | 2,326 |
| – Gross Longs: | 35,566 | 393,907 | 24,965 |
| – Gross Shorts: | 97,168 | 334,631 | 22,639 |
| – Long to Short Ratio: | 0.4 to 1 | 1.2 to 1 | 1.1 to 1 |
| NET POSITION TREND: | | | |
| – Strength Index Score (3 Year Range Pct): | 35.0 | 63.8 | 33.8 |
| – Strength Index Reading (3 Year Range): | Bearish | Bullish | Bearish |
| NET POSITION MOVEMENT INDEX: | | | |
| – 6-Week Change in Strength Index: | 5.8 | -4.8 | -3.5 |
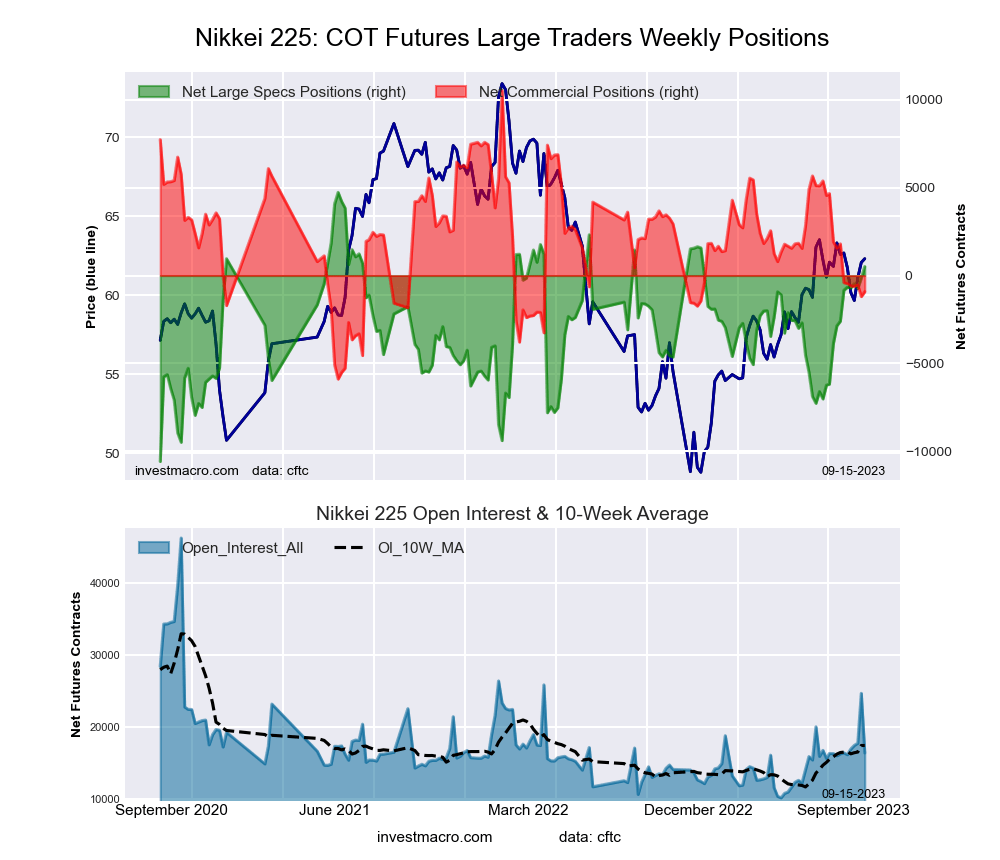
Nikkei Stock Average (USD) Futures:
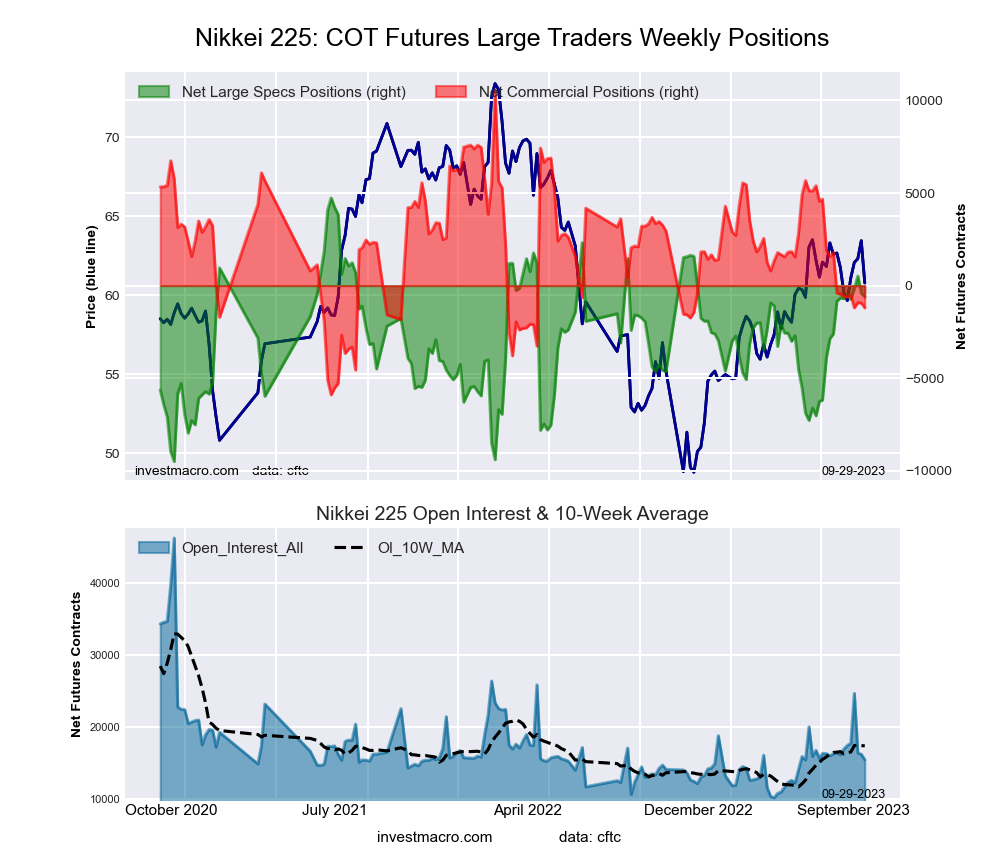 The Nikkei Stock Average (USD) large speculator standing this week reached a net position of -610 contracts in the data reported through Tuesday. This was a weekly reduction of -196 contracts from the previous week which had a total of -414 net contracts.
This week’s current strength score (the trader positioning range over the past three years, measured from 0 to 100) shows the speculators are currently Bullish with a score of 62.4 percent. The commercials are Bearish with a score of 28.6 percent and the small traders (not shown in chart) are Bullish with a score of 51.1 percent.
Price Trend-Following Model: Weak Uptrend
Our weekly trend-following model classifies the current market price position as: Weak Uptrend. The current action for the model is considered to be: Hold – Maintain Long Position.
| Nikkei Stock Average Futures Statistics | SPECULATORS | COMMERCIALS | SMALL TRADERS |
| – Percent of Open Interest Longs: | 8.6 | 67.1 | 24.4 |
| – Percent of Open Interest Shorts: | 12.5 | 74.8 | 12.7 |
| – Net Position: | -610 | -1,200 | 1,810 |
| – Gross Longs: | 1,325 | 10,385 | 3,773 |
| – Gross Shorts: | 1,935 | 11,585 | 1,963 |
| – Long to Short Ratio: | 0.7 to 1 | 0.9 to 1 | 1.9 to 1 |
| NET POSITION TREND: | | | |
| – Strength Index Score (3 Year Range Pct): | 62.4 | 28.6 | 51.1 |
| – Strength Index Reading (3 Year Range): | Bullish | Bearish | Bullish |
| NET POSITION MOVEMENT INDEX: | | | |
| – 6-Week Change in Strength Index: | 0.6 | -3.7 | 6.5 |
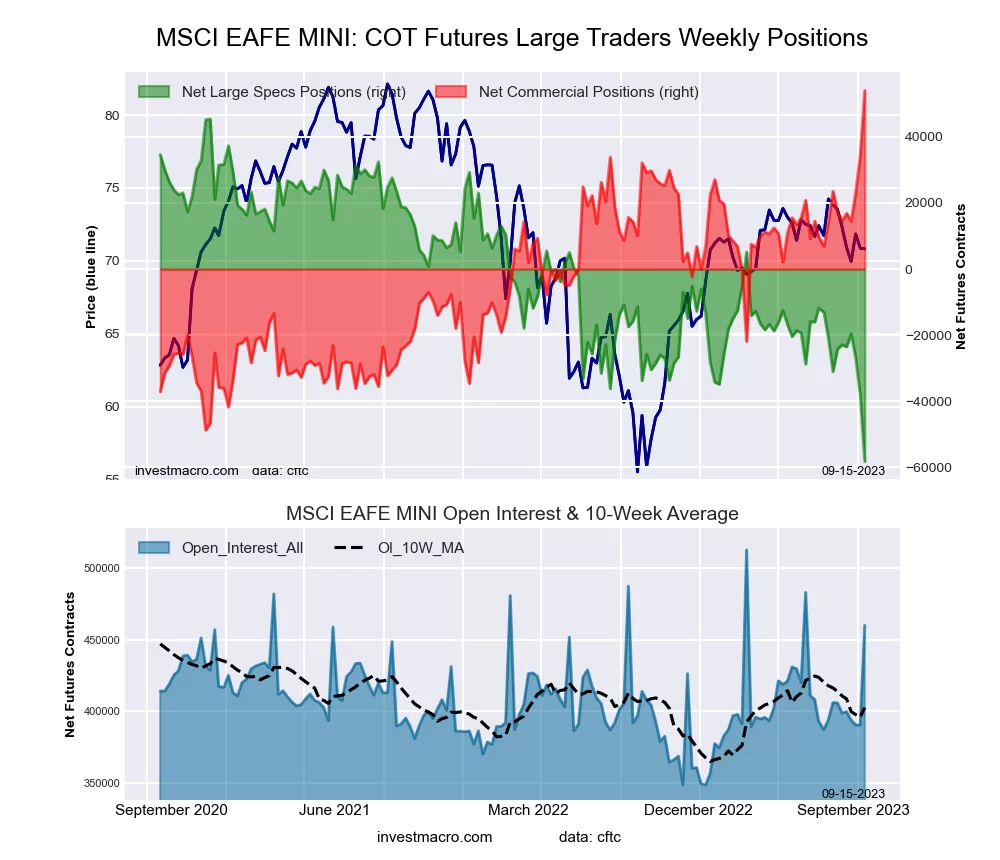
MSCI EAFE Mini Futures:
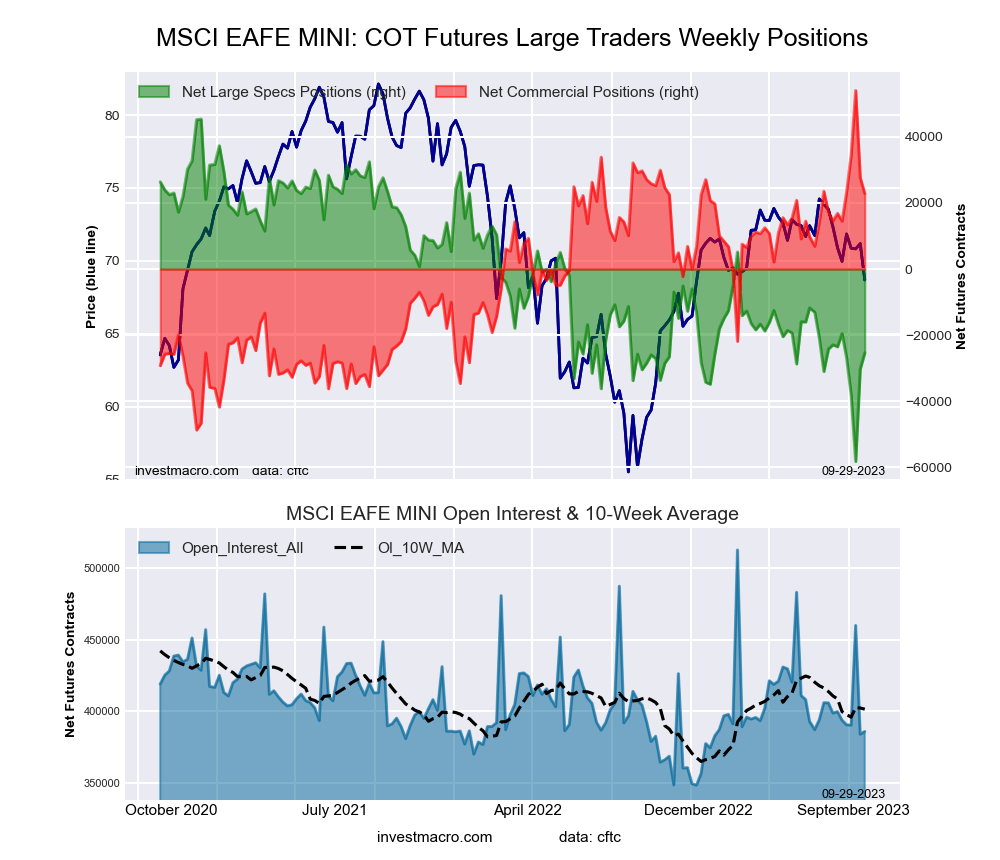 The MSCI EAFE Mini large speculator standing this week reached a net position of -25,328 contracts in the data reported through Tuesday. This was a weekly gain of 4,923 contracts from the previous week which had a total of -30,251 net contracts.
This week’s current strength score (the trader positioning range over the past three years, measured from 0 to 100) shows the speculators are currently Bearish with a score of 31.7 percent. The commercials are Bullish with a score of 69.6 percent and the small traders (not shown in chart) are Bearish with a score of 29.5 percent.
Price Trend-Following Model: Strong Downtrend
Our weekly trend-following model classifies the current market price position as: Strong Downtrend. The current action for the model is considered to be: Hold – Maintain Short Position.
| MSCI EAFE Mini Futures Statistics | SPECULATORS | COMMERCIALS | SMALL TRADERS |
| – Percent of Open Interest Longs: | 7.5 | 89.4 | 2.2 |
| – Percent of Open Interest Shorts: | 14.1 | 83.5 | 1.6 |
| – Net Position: | -25,328 | 22,834 | 2,494 |
| – Gross Longs: | 29,019 | 344,909 | 8,675 |
| – Gross Shorts: | 54,347 | 322,075 | 6,181 |
| – Long to Short Ratio: | 0.5 to 1 | 1.1 to 1 | 1.4 to 1 |
| NET POSITION TREND: | | | |
| – Strength Index Score (3 Year Range Pct): | 31.7 | 69.6 | 29.5 |
| – Strength Index Reading (3 Year Range): | Bearish | Bullish | Bearish |
| NET POSITION MOVEMENT INDEX: | | | |
| – 6-Week Change in Strength Index: | -1.8 | 5.8 | -20.7 |
Article By InvestMacro – Receive our weekly COT Newsletter
See our Weekly Trend Model Readings and Actions for each COT Futures Market and Category. All information contained in this data are for general informational purposes only and do not constitute investment advice.
*COT Report: The COT data, released weekly to the public each Friday, is updated through the most recent Tuesday (data is 3 days old) and shows a quick view of how large speculators or non-commercials (for-profit traders) were positioned in the futures markets.
The CFTC categorizes trader positions according to commercial hedgers (traders who use futures contracts for hedging as part of the business), non-commercials (large traders who speculate to realize trading profits) and nonreportable traders (usually small traders/speculators) as well as their open interest (contracts open in the market at time of reporting). See CFTC criteria here.


