Archive for Stock Market News – Page 24

Nasdaq correction: Is tech sell-off an opportunity?

By George Prior 

Shrewd investors will use the tech sell-off as a buying opportunity as Wall Street’s tech-heavy Nasdaq Composite Index fell into correction territory, affirms the CEO of one of the world’s largest independent financial advisory and asset management organizations.

The analysis from Nigel Green of deVere Group comes as the Nasdaq, alongside the other main US and global indexes, comes under pressure from disappointing third-quarter results from Big Tech companies, high Treasury yields, higher-for-longer interest rates, and recession fears.

A correction happens when an index falls more than 10%, but less than 20%, from its most recent closing high.

He notes: “This dramatic sell-off is largely focused on the Nasdaq and tech stocks, which investors feel would be hit hardest by spiking interest rates.

“The Nasdaq, currently down more than 12% from its 2023 high, meaning it’s firmly in correction territory, has also been impacted by disappointing earnings recently out from the Big Tech titans.”

Last week, Meta slid 3.7% on Thursday after the Facebook parent company reported that advertising revenue had been weak.

Google-parent Alphabet also slid, falling by 9.5%, after the company fell short in its cloud business. It’s the largest decline for the stock since March 2020. Shares fell another 2.7% on Thursday morning.

Meanwhile, Apple fell by 2.5%. Amazon, despite reporting strong results, was down 1.5%.

The tech sell-off is spooking some, while some “shrewd investors will be actively using this as an important buying opportunity” for three main reasons.

“First, the AI Race is intensifying, as firms are racing to lead in the development, deployment, and utilisation of artificial intelligence technologies.

“It is going to reshape whole industries, create new ones, and fuel innovation beyond what we can currently imagine.

“All this AI needs enormous amounts of computing power, which is a path that leads companies directly to the likes of Microsoft, Google and Amazon,” says Nigel Green.

“Second, tech companies are known for their ability to pivot and adapt to changing market conditions. They’re well-equipped to weather the storm of rising interest rates and adjust their strategies to maintain profitability and relevance.

“Third, the market fears are presenting opportunities to purchase high-quality tech companies at a lower cost, allowing investors to potentially benefit from capital appreciation when the market rebounds.”

As ever, a well-balanced investment portfolio should be diversified across various asset classes, including tech stocks. Diversification helps spread risk and can provide a buffer against the impact of sell-offs in specific sectors.

The deVere CEO concludes: “Like those which have gone before it, this tech sell-off will provide an opportunity for investors to selectively acquire tech stocks with solid fundamentals and growth potential.”

About:

deVere Group is one of the world’s largest independent advisors of specialist global financial solutions to international, local mass affluent, and high-net-worth clients.  It has a network of offices across the world, over 80,000 clients and $12bn under advisement.

Trade of the Week: Can SPX500_m recover from technical correction?

By ForexTime

  • S&P 500 is now 10% below its end-July peak; set for third straight monthly drop
  • Relief for equity bulls may depend on 4 key events in first 3 days of November
  • Events watchlist: US Treasury announcement, FOMC decision, Apple earnings, US jobs report
  • Current technical pullback may be short-lived; bulls need fundamental boost
  • S&P 500 may see third consecutive weekly move of over 2%


The S&P 500 has entered a technical correction, which is when an asset’s price falls by over 10% from a recent peak.

Note that the SPX500_m posted a closing price on Friday (October 27th) that was 10.3% lower than its closing price registered on July 31st (its year-to-date high).

Furthermore, the SPX500_m is set to post a third straight month of declines – something not seen since Q1 2020 at the onset of the pandemic.

Here’s how this blue-chip stock index has fared recently:

  • August: down 1.77%
  • September: down 4.87%
  • October so far (as of market’s close on Friday, October 27th): down 4%


Amidst such a gloomy backdrop, hopes for an SPX500_m rebound this week are set to rest on these 4 major events:


1) Wednesday, November 1st: US Treasury quarterly refunding announcement

This is when the US government reveals how much new debt it has to sell to markets to keeping funding its budget.

To underscores the sheer importance of this upcoming announcement for global markets, note how the prior quarterly refunding announcement on August 2nd sparked a rout in US bond markets, setting 10-year US Treasury yields on the way to hitting 5% for the first time since 2007!

NOTE: Yields rise with bond prices fall.

At the same time, the S&P 500 has been on a steady decline since that last announcement in early August.

This is because, higher yields on US Treasuries (deemed to be the “safest” investment in the world) makes riskier assets, such as stocks, less appealing.

For this week’s announcement, markets expect US$114 billion worth of securities to be outlined for sale by the US Treasury.

POTENTIAL SCENARIOS:

  • A higher-than-expected figure (US Treasury intends to sell more bonds than markets expect) could translate into another leg up for US Treasury yields, and perhaps extend the drop seen in the SPX500_m.
  • A lower-than-$114 billion number revealed by the US Treasury, or efforts to subdue its refunding costs, may offer some relief for SPX500_m.


2) Wednesday, November 1st: FOMC rate decision

To be clear, the Fed is roundly expected to leave its benchmark rates unchanged this week.

Furthermore, Fed Chair Jerome Powell is also set to reiterate his “higher for longer” message, which is something that markets are fully aware of.
POTENTIAL SCENARIOS:

  • If Chair Powell can strike a more hawkish tone, perhaps going into more detail as to just how much “longer” the Fed will keep its benchmark rates elevated, that could spark more declines for the SPX500_m.
  • However, if Chair Powell were to close the door on any further rate hikes, or perhaps even concede that the first Fed rate cut may actually arrive sooner than expected (markets currently predict it’ll happen in June 2024), that could help the SPX500_m recover.


3) Thursday, November 2nd (after US markets close): Apple earnings

Apple has a market cap of US$2.63 trillion, making it the world’s most valuable company.

Apple alone accounts for about 7% of the total S&P 500, making it the largest stock on this benchmark index that is tracked by our SPX500_m.

Given Apple’s sheer size, how markets react to its earnings would have a large influence over how the S&P 500 performs.

Keep in mind that Apple is facing its longest sales slump in over 20 years, and is now facing slowing sales of its iPhone 15 in China.

NOTE: China accounts for about 20% of Apple’s total revenues.

Hence, both its backward-looking Q4FY23 numbers, as well as forward-looking statements especially around Chinese sales, could dictate how Apple’s share prices react.

Also, Apple’s share price is expected to move by 3.77%, either upwards or downwards, on Friday, November 3rd – the day after the company unveils its financial results for the July-September period (the fourth quarter of the company’s 2023 fiscal year).
POTENTIAL SCENARIOS:

  • Better-than-expected earnings out of Apple, or if the company sounds optimistic about a turnaround in China, could help pull the SPX500_m out of a technical correction.
  • Disappointing Apple earnings and/or more concerns about a prolonged sales slump, could push the SPX500_m deeper into a technical correction.


4) Friday, November 3rd: US jobs report

As is the case on the first Friday of most months, markets are eagerly anticipating the tier-one US nonfarm payrolls report.

Here are the current forecasts for some of October’s key figures:

  • Headline NFP number: 190,000 new jobs added to the US labour market in October
    (this would be its lowest tally since June 2023’s 105,000 figure)
  • Unemployment rate: 3.8%
    (this would match September’s unemployment rate)
  • Average hourly earnings: 4% year-on-year (October 2023 vs. October 2022)
    (this would be slightly lower than September’s 4.2% year-on-year number)
  • Average hourly earnings: 0.3% month-on-month (October 2023 vs. September 2023)
    (this would be slightly faster than September’s 0.2% month-on-month number)


POTENTIAL SCENARIOS:

  • Evidence of a stronger-than-expected US jobs report may indeed allow the Fed to maintain its benchmark rates “higher for longer”, or perhaps even pave the way for one more 25-basis point hike in this cycle.

    Such expectations could heap more downward pressure on the SPX500_m.

  • Cracks showing in the US labour market, suggesting that the world’s largest economy is bearing the brunt of all those Fed rate hikes since last year, may seal the door shut on a further Fed rate hike, and potentially pave the way for a sooner-than-expected Fed rate cut,

    Such expectations may spark joy among SPX500_m bulls (those hoping prices will go up).


From a technical perspective …

At the time of writing, the SPX500_m is seeing a technical rebound, as its 14-day relative strength index attempts to recover from the 30 line which denotes “oversold” conditions.

However, this technical rebound may prove short-lived, and bulls would need a fundamental catalyst to push the SPX500_m higher going into November.


POTENTIAL RESISTANCE:

  • 4152.2: lower bound of downtrend since July
  • 4200: psychologically-important level which had repelled bulls on several occasions in 1H23
    (also, 38.2 Fibonacci retracement level from October 2022- July 2023 ascent)
  • 200-day simple moving average (SMA)


POTENTIAL SUPPORT:

  • 4106: intraday low on Friday, October 27th
  • 4052.2: mid-way (50 Fibonacci retracement level) from October 2022- July 2023 ascent


Forex-Time-LogoArticle by ForexTime

ForexTime Ltd (FXTM) is an award winning international online forex broker regulated by CySEC 185/12 www.forextime.com

COT Stock Market Charts: Weekly Speculator Bets led by S&P500-Mini & VIX

By InvestMacro | COT | Data Tables | COT Leaders | Downloads | COT Newsletter
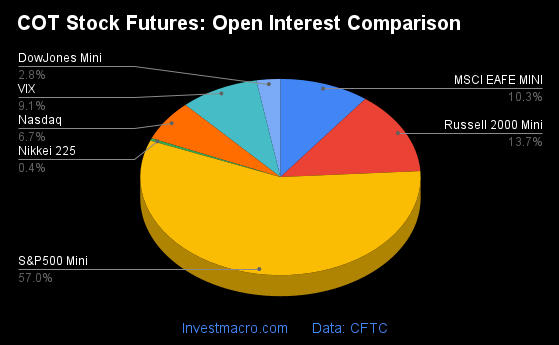
Here are the latest charts and statistics for the Commitment of Traders (COT) data published by the Commodities Futures Trading Commission (CFTC).

The latest COT data is updated through Tuesday October 24th and shows a quick view of how large traders (for-profit speculators and commercial entities) were positioned in the futures markets.

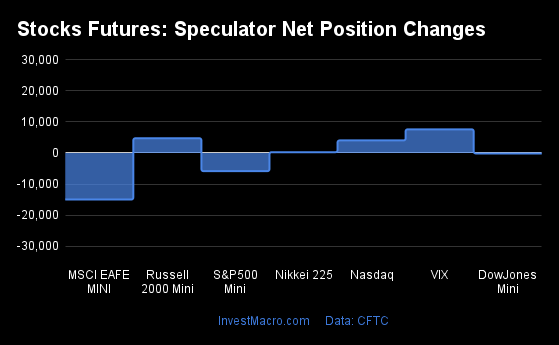
Weekly Speculator Changes led by S&P500-Mini & the VIX

The COT stock markets speculator bets were slightly higher this week as four out of the seven stock markets we cover had higher positioning while the other three markets had lower speculator contracts.

Leading the gains for the stock markets was a big jump by the S&P500-Mini (73,363 contracts) with the VIX (1,351 contracts), the Russell-Mini (1,301 contracts) and the Nikkei 225 (127 contracts) also showing positive weeks.

The markets with the declines in speculator bets were led this week by the Nasdaq-Mini (-11,651 contracts), the MSCI EAFE-Mini (-2,280 contracts) and the DowJones-Mini (-749 contracts) also registering lower bets on the week.


Data Snapshot of Stock Market Traders | Columns Legend
Oct-24-2023OIOI-IndexSpec-NetSpec-IndexCom-NetCOM-IndexSmalls-NetSmalls-Index
S&P500-Mini2,158,4521710,18566-34,7363524,55147
Nikkei 22515,32614-2,12852695401,43346
Nasdaq-Mini253,055392,69743-4,366391,66974
DowJones-Mini104,58172-35,960039,64999-3,68926
VIX344,31844-21,5949526,0583-4,46474
Nikkei 225 Yen53,712427,280579,59937-16,87953


Strength Scores led by VIX & S&P500-Mini
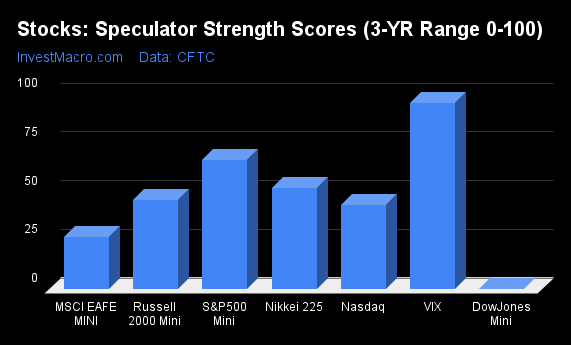
COT Strength Scores (a normalized measure of Speculator positions over a 3-Year range, from 0 to 100 where above 80 is Extreme-Bullish and below 20 is Extreme-Bearish) showed that the VIX (95 percent) and the S&P500-Mini (66 percent) were the leaders for the stock markets this week. The Nikkei 225 (52 percent) came in as the next highest in the weekly strength scores.

On the downside, the DowJones-Mini (0 percent) was at the lowest strength level and is in Extreme-Bearish territory (below 20 percent). The next lowest strength score is the MSCI EAFE-Mini (27 percent).

Strength Statistics:
VIX (95.3 percent) vs VIX previous week (94.4 percent)
S&P500-Mini (66.3 percent) vs S&P500-Mini previous week (55.3 percent)
DowJones-Mini (0.0 percent) vs DowJones-Mini previous week (1.7 percent)
Nasdaq-Mini (43.1 percent) vs Nasdaq-Mini previous week (61.0 percent)
Russell2000-Mini (45.5 percent) vs Russell2000-Mini previous week (44.7 percent)
Nikkei USD (51.8 percent) vs Nikkei USD previous week (50.9 percent)
EAFE-Mini (26.7 percent) vs EAFE-Mini previous week (28.9 percent)


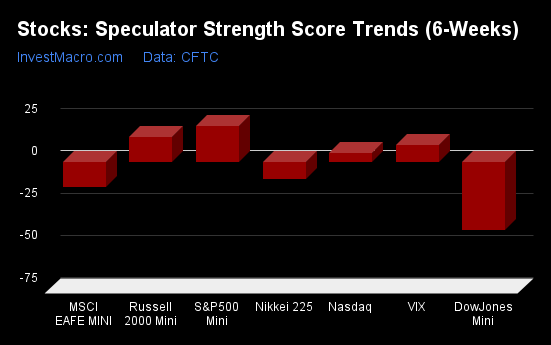
MSCI EAFE-Mini & S&P500-Mini top the 6-Week Strength Trends
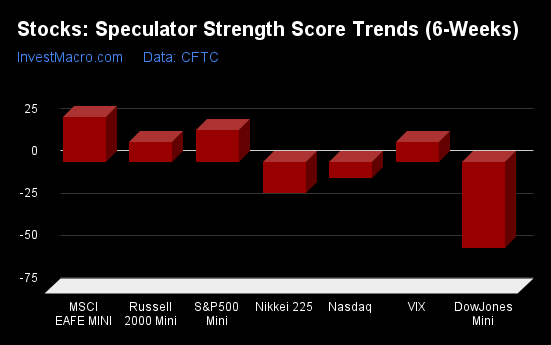
COT Strength Score Trends (or move index, calculates the 6-week changes in strength scores) showed that the MSCI EAFE-Mini (27 percent) leads the past six weeks trends for the stock markets. The S&P500-Mini (19 percent), the VIX (12 percent) and the Russell-Mini (12 percent) are the next highest positive movers in the latest trends data.

The DowJones-Mini (-51 percent) leads the downside trend scores currently with the Nikkei 225 (-19 percent) coming in as the next lowest market.

Strength Trend Statistics:
VIX (11.9 percent) vs VIX previous week (13.3 percent)
S&P500-Mini (18.9 percent) vs S&P500-Mini previous week (12.1 percent)
DowJones-Mini (-51.1 percent) vs DowJones-Mini previous week (-52.0 percent)
Nasdaq-Mini (-9.8 percent) vs Nasdaq-Mini previous week (1.2 percent)
Russell2000-Mini (11.7 percent) vs Russell2000-Mini previous week (15.7 percent)
Nikkei USD (-18.6 percent) vs Nikkei USD previous week (-14.8 percent)
EAFE-Mini (26.7 percent) vs EAFE-Mini previous week (9.5 percent)


Individual Stock Market Charts:

VIX Volatility Futures:

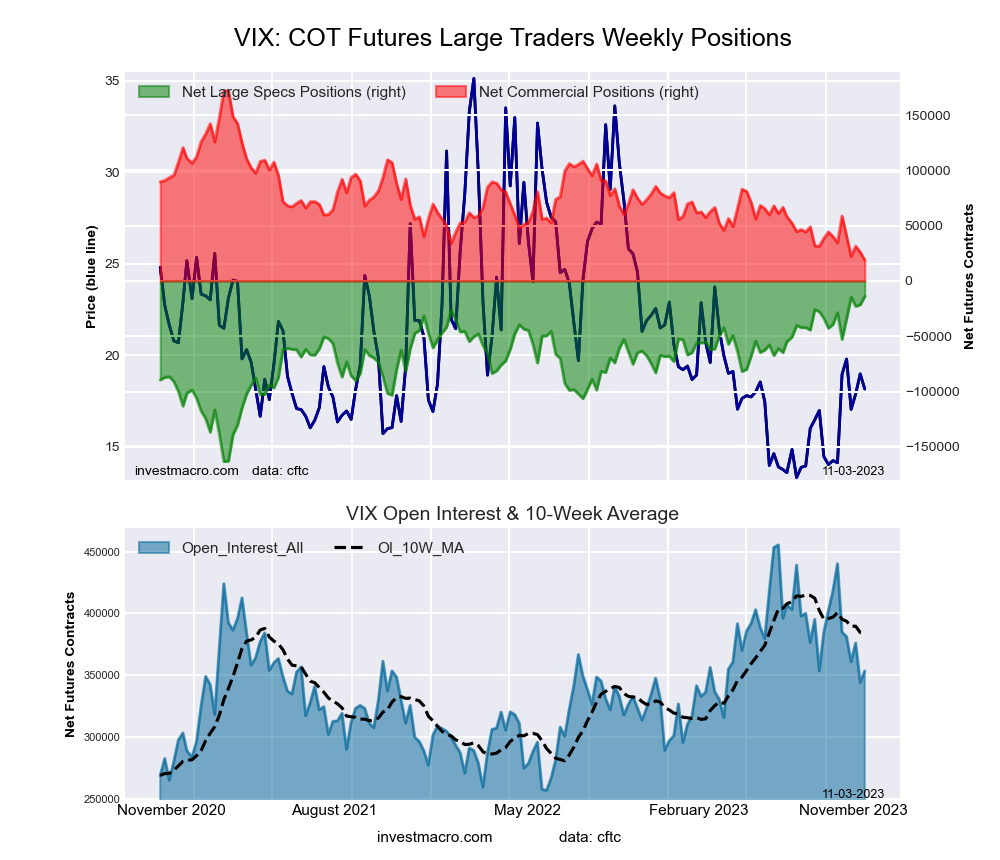
VIX Volatility Futures COT ChartThe VIX Volatility large speculator standing this week was a net position of -21,594 contracts in the data reported through Tuesday. This was a weekly lift of 1,351 contracts from the previous week which had a total of -22,945 net contracts.

This week’s current strength score (the trader positioning range over the past three years, measured from 0 to 100) shows the speculators are currently Bullish-Extreme with a score of 95.3 percent. The commercials are Bearish-Extreme with a score of 2.5 percent and the small traders (not shown in chart) are Bullish with a score of 73.7 percent.

Price Trend-Following Model: Strong Uptrend

Our weekly trend-following model classifies the current market price position as: Strong Uptrend. The current action for the model is considered to be: Hold – Maintain Long Position.

VIX Volatility Futures StatisticsSPECULATORSCOMMERCIALSSMALL TRADERS
– Percent of Open Interest Longs:25.747.57.2
– Percent of Open Interest Shorts:32.040.08.5
– Net Position:-21,59426,058-4,464
– Gross Longs:88,500163,68224,682
– Gross Shorts:110,094137,62429,146
– Long to Short Ratio:0.8 to 11.2 to 10.8 to 1
NET POSITION TREND:
– Strength Index Score (3 Year Range Pct):95.32.573.7
– Strength Index Reading (3 Year Range):Bullish-ExtremeBearish-ExtremeBullish
NET POSITION MOVEMENT INDEX:
– 6-Week Change in Strength Index:11.9-9.4-18.9


S&P500 Mini Futures:

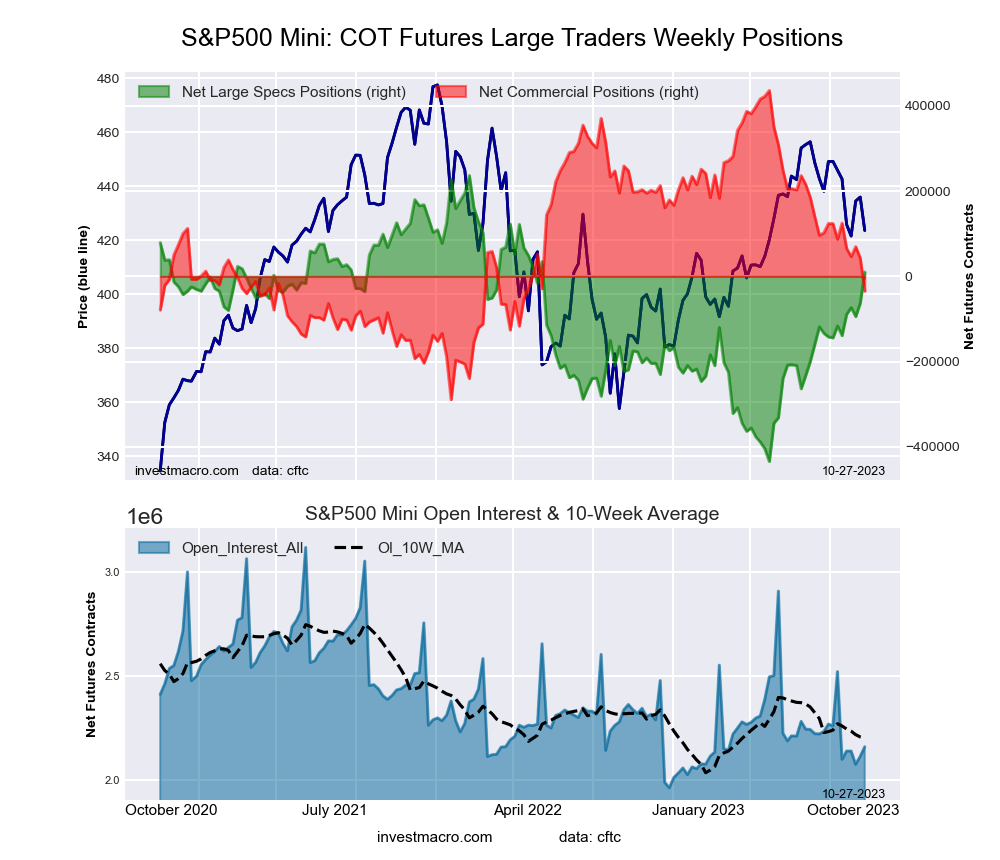
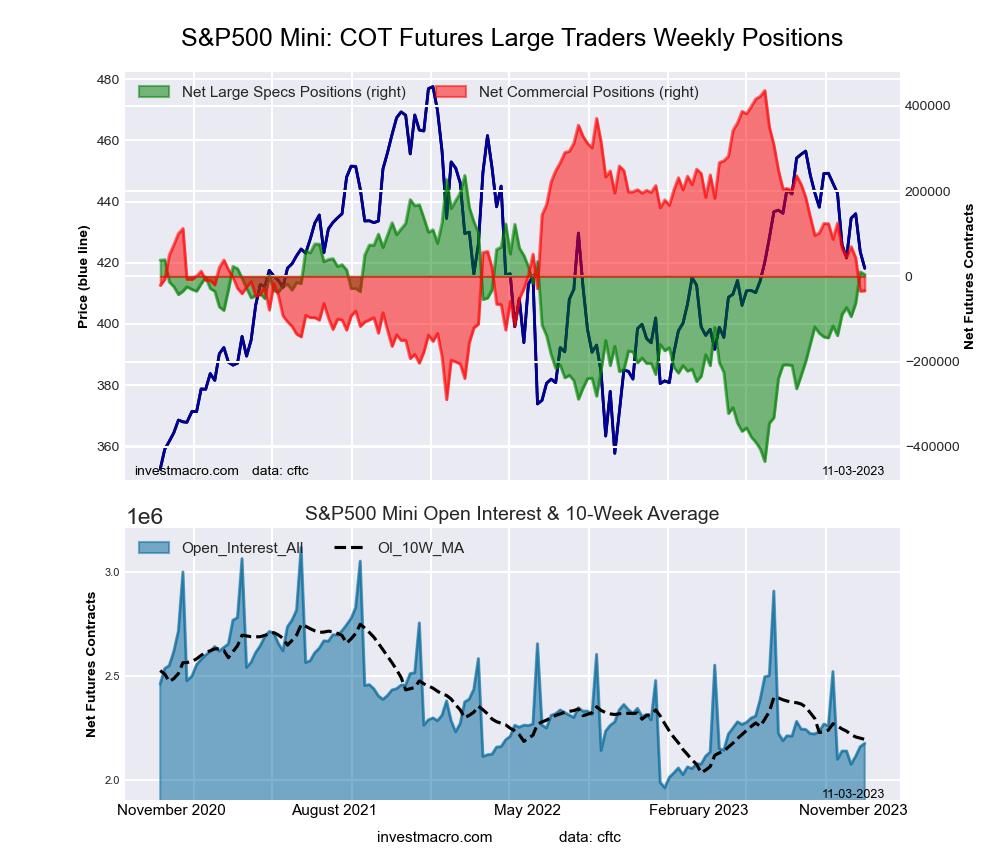
SP500 Mini Futures COT ChartThe S&P500 Mini large speculator standing this week was a net position of 10,185 contracts in the data reported through Tuesday. This was a weekly rise of 73,363 contracts from the previous week which had a total of -63,178 net contracts.

This week’s current strength score (the trader positioning range over the past three years, measured from 0 to 100) shows the speculators are currently Bullish with a score of 66.3 percent. The commercials are Bearish with a score of 35.1 percent and the small traders (not shown in chart) are Bearish with a score of 47.0 percent.

Price Trend-Following Model: Strong Downtrend

Our weekly trend-following model classifies the current market price position as: Strong Downtrend. The current action for the model is considered to be: Hold – Maintain Short Position.

S&P500 Mini Futures StatisticsSPECULATORSCOMMERCIALSSMALL TRADERS
– Percent of Open Interest Longs:13.172.411.5
– Percent of Open Interest Shorts:12.674.010.4
– Net Position:10,185-34,73624,551
– Gross Longs:282,6041,562,074248,407
– Gross Shorts:272,4191,596,810223,856
– Long to Short Ratio:1.0 to 11.0 to 11.1 to 1
NET POSITION TREND:
– Strength Index Score (3 Year Range Pct):66.335.147.0
– Strength Index Reading (3 Year Range):BullishBearishBearish
NET POSITION MOVEMENT INDEX:
– 6-Week Change in Strength Index:18.9-16.8-1.9


Dow Jones Mini Futures:

Dow Jones Mini Futures COT ChartThe Dow Jones Mini large speculator standing this week was a net position of -35,960 contracts in the data reported through Tuesday. This was a weekly reduction of -749 contracts from the previous week which had a total of -35,211 net contracts.

This week’s current strength score (the trader positioning range over the past three years, measured from 0 to 100) shows the speculators are currently Bearish-Extreme with a score of 0.0 percent. The commercials are Bullish-Extreme with a score of 98.9 percent and the small traders (not shown in chart) are Bearish with a score of 25.9 percent.

Price Trend-Following Model: Strong Downtrend

Our weekly trend-following model classifies the current market price position as: Strong Downtrend. The current action for the model is considered to be: Hold – Maintain Short Position.

Dow Jones Mini Futures StatisticsSPECULATORSCOMMERCIALSSMALL TRADERS
– Percent of Open Interest Longs:24.165.110.4
– Percent of Open Interest Shorts:58.427.113.9
– Net Position:-35,96039,649-3,689
– Gross Longs:25,15968,03410,893
– Gross Shorts:61,11928,38514,582
– Long to Short Ratio:0.4 to 12.4 to 10.7 to 1
NET POSITION TREND:
– Strength Index Score (3 Year Range Pct):0.098.925.9
– Strength Index Reading (3 Year Range):Bearish-ExtremeBullish-ExtremeBearish
NET POSITION MOVEMENT INDEX:
– 6-Week Change in Strength Index:-51.147.8-20.2


Nasdaq Mini Futures:

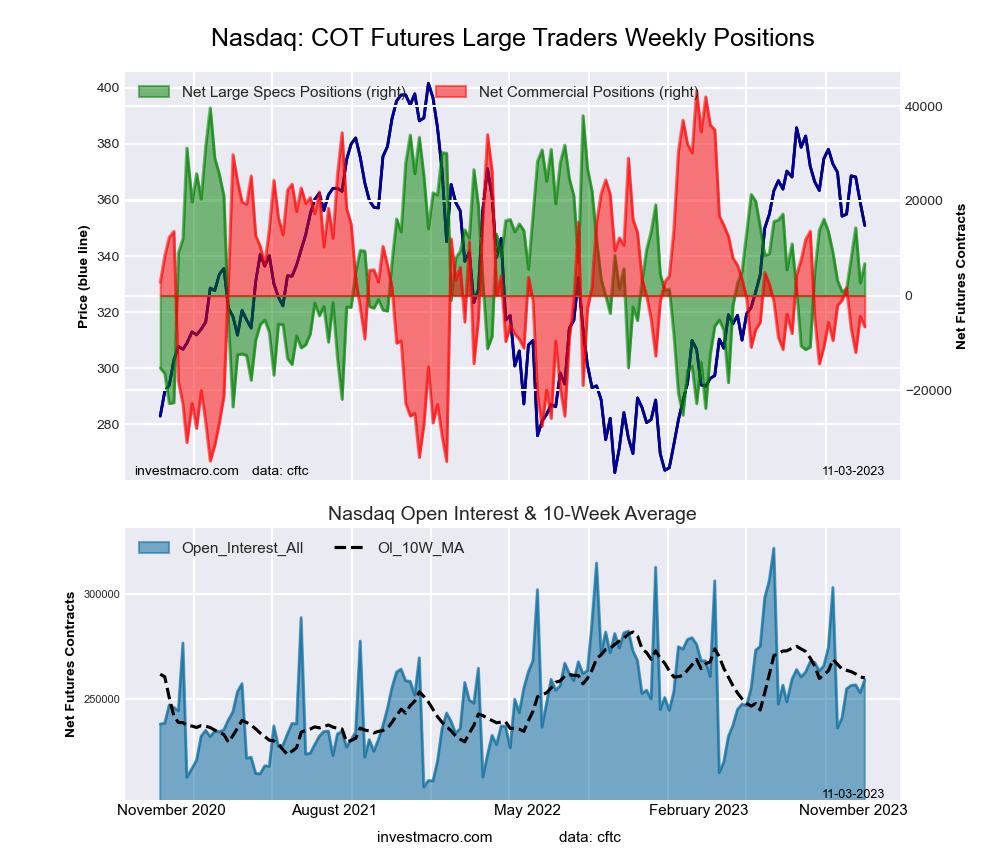
Nasdaq Mini Futures COT ChartThe Nasdaq Mini large speculator standing this week was a net position of 2,697 contracts in the data reported through Tuesday. This was a weekly fall of -11,651 contracts from the previous week which had a total of 14,348 net contracts.

This week’s current strength score (the trader positioning range over the past three years, measured from 0 to 100) shows the speculators are currently Bearish with a score of 43.1 percent. The commercials are Bearish with a score of 39.1 percent and the small traders (not shown in chart) are Bullish with a score of 73.7 percent.

Price Trend-Following Model: Strong Downtrend

Our weekly trend-following model classifies the current market price position as: Strong Downtrend. The current action for the model is considered to be: Hold – Maintain Short Position.

Nasdaq Mini Futures StatisticsSPECULATORSCOMMERCIALSSMALL TRADERS
– Percent of Open Interest Longs:27.356.015.0
– Percent of Open Interest Shorts:26.257.714.3
– Net Position:2,697-4,3661,669
– Gross Longs:69,019141,58937,947
– Gross Shorts:66,322145,95536,278
– Long to Short Ratio:1.0 to 11.0 to 11.0 to 1
NET POSITION TREND:
– Strength Index Score (3 Year Range Pct):43.139.173.7
– Strength Index Reading (3 Year Range):BearishBearishBullish
NET POSITION MOVEMENT INDEX:
– 6-Week Change in Strength Index:-9.86.63.0


Russell 2000 Mini Futures:

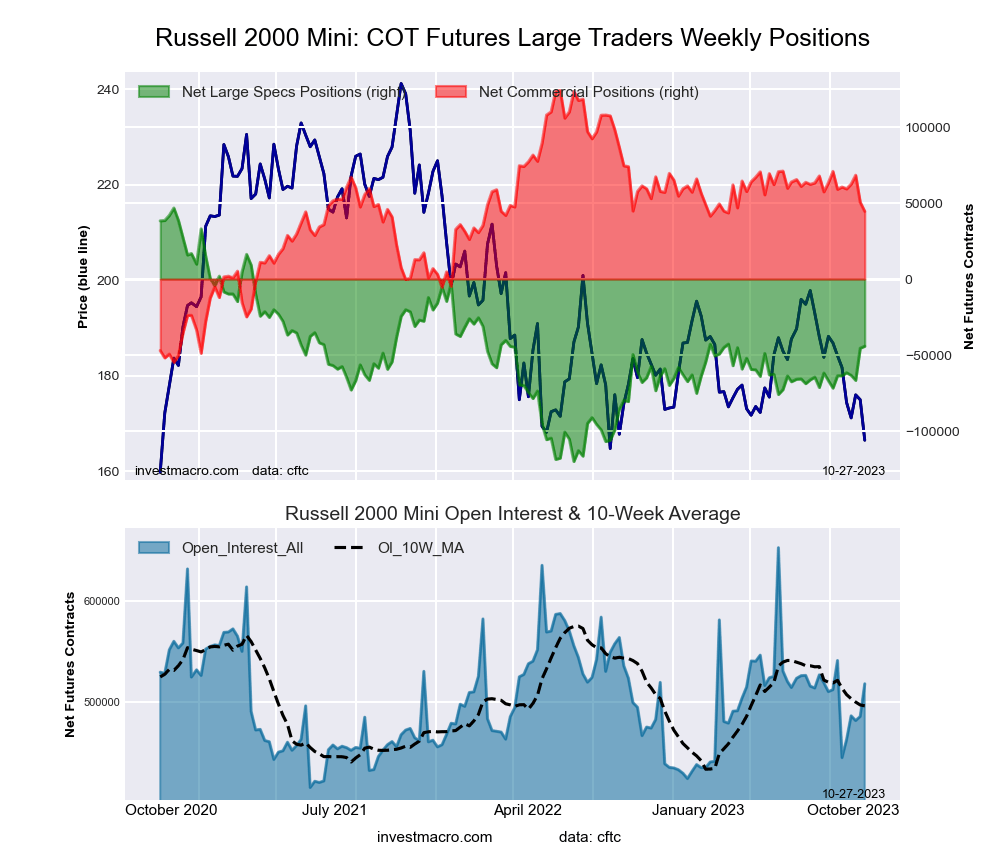
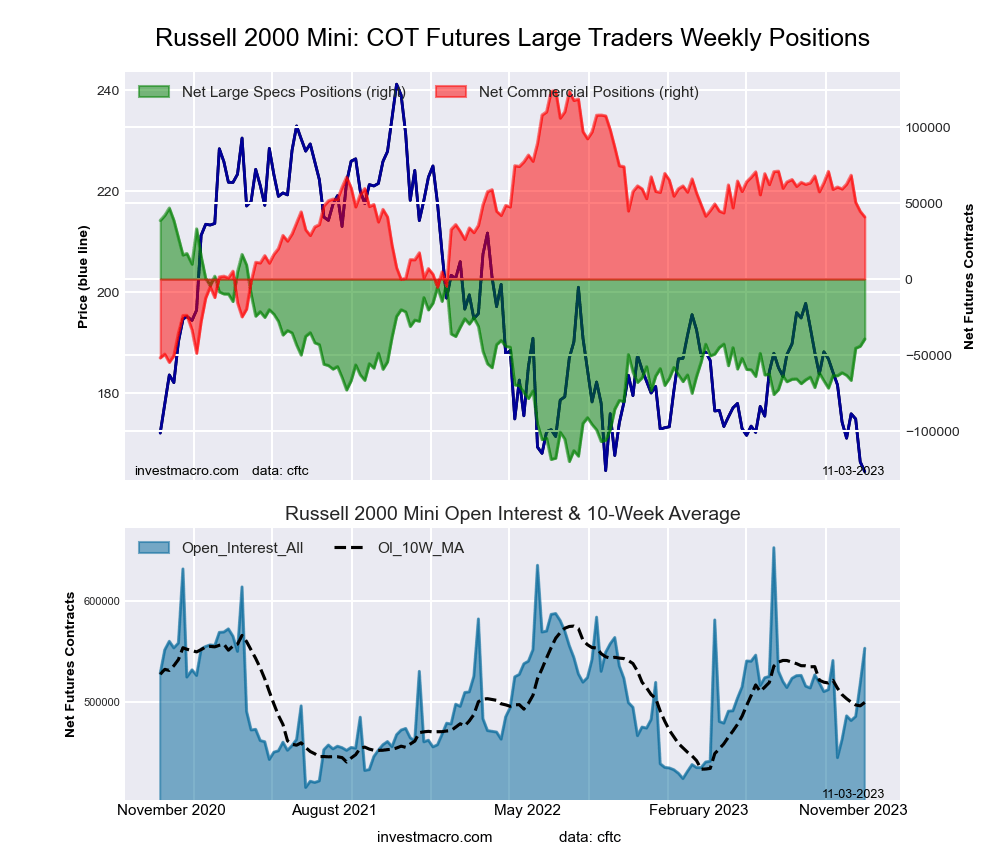
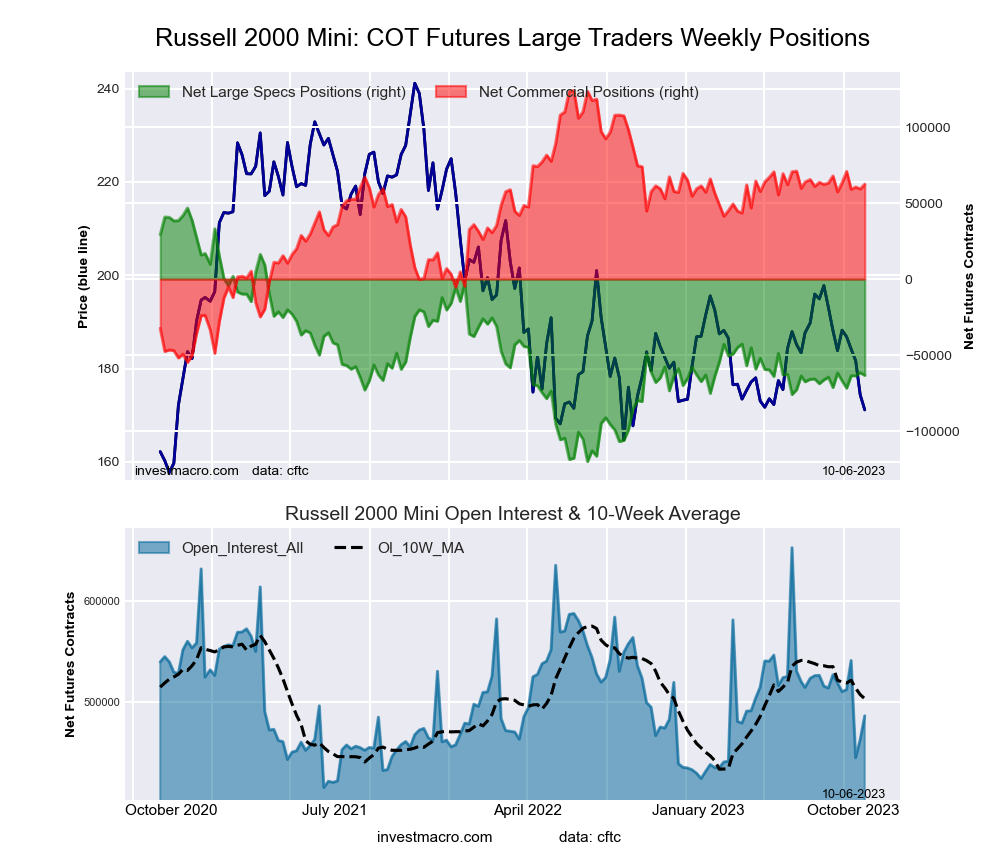
Russell 2000 Mini Futures COT ChartThe Russell 2000 Mini large speculator standing this week was a net position of -44,171 contracts in the data reported through Tuesday. This was a weekly rise of 1,301 contracts from the previous week which had a total of -45,472 net contracts.

This week’s current strength score (the trader positioning range over the past three years, measured from 0 to 100) shows the speculators are currently Bearish with a score of 45.5 percent. The commercials are Bullish with a score of 55.5 percent and the small traders (not shown in chart) are Bearish with a score of 25.4 percent.

Price Trend-Following Model: Strong Downtrend

Our weekly trend-following model classifies the current market price position as: Strong Downtrend. The current action for the model is considered to be: Hold – Maintain Short Position.

Russell 2000 Mini Futures StatisticsSPECULATORSCOMMERCIALSSMALL TRADERS
– Percent of Open Interest Longs:14.079.84.6
– Percent of Open Interest Shorts:22.571.24.6
– Net Position:-44,17144,537-366
– Gross Longs:72,617413,48123,620
– Gross Shorts:116,788368,94423,986
– Long to Short Ratio:0.6 to 11.1 to 11.0 to 1
NET POSITION TREND:
– Strength Index Score (3 Year Range Pct):45.555.525.4
– Strength Index Reading (3 Year Range):BearishBullishBearish
NET POSITION MOVEMENT INDEX:
– 6-Week Change in Strength Index:11.7-8.1-15.3


Nikkei Stock Average (USD) Futures:

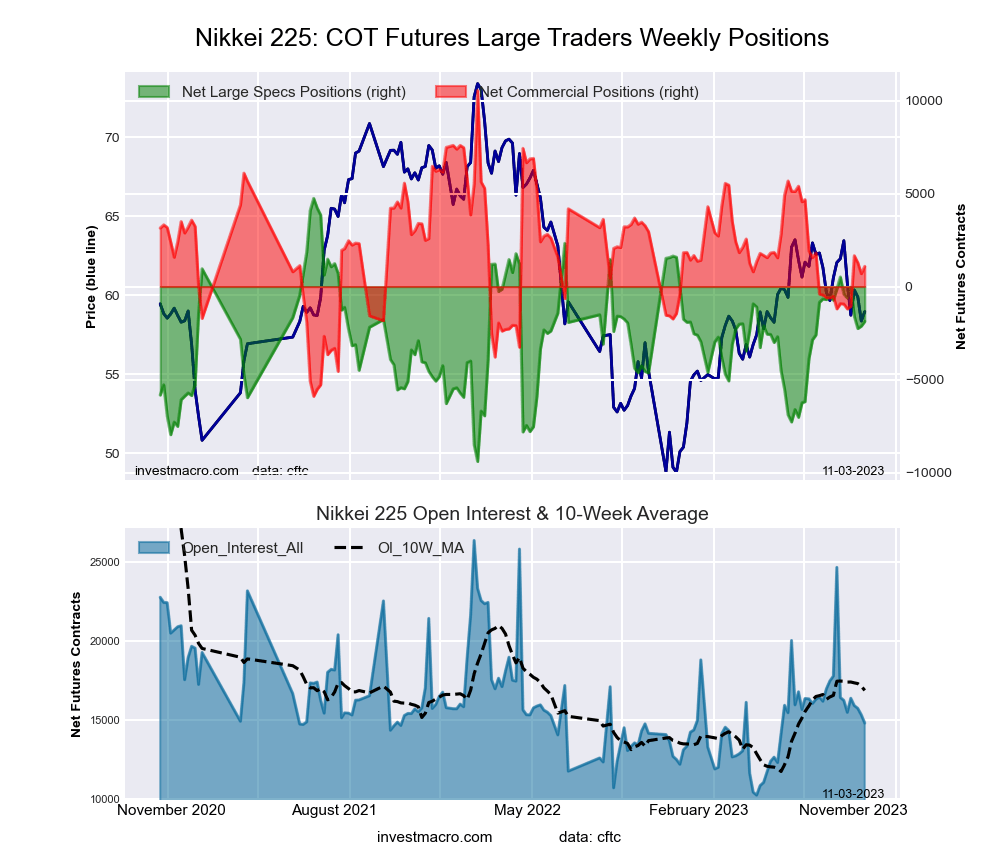
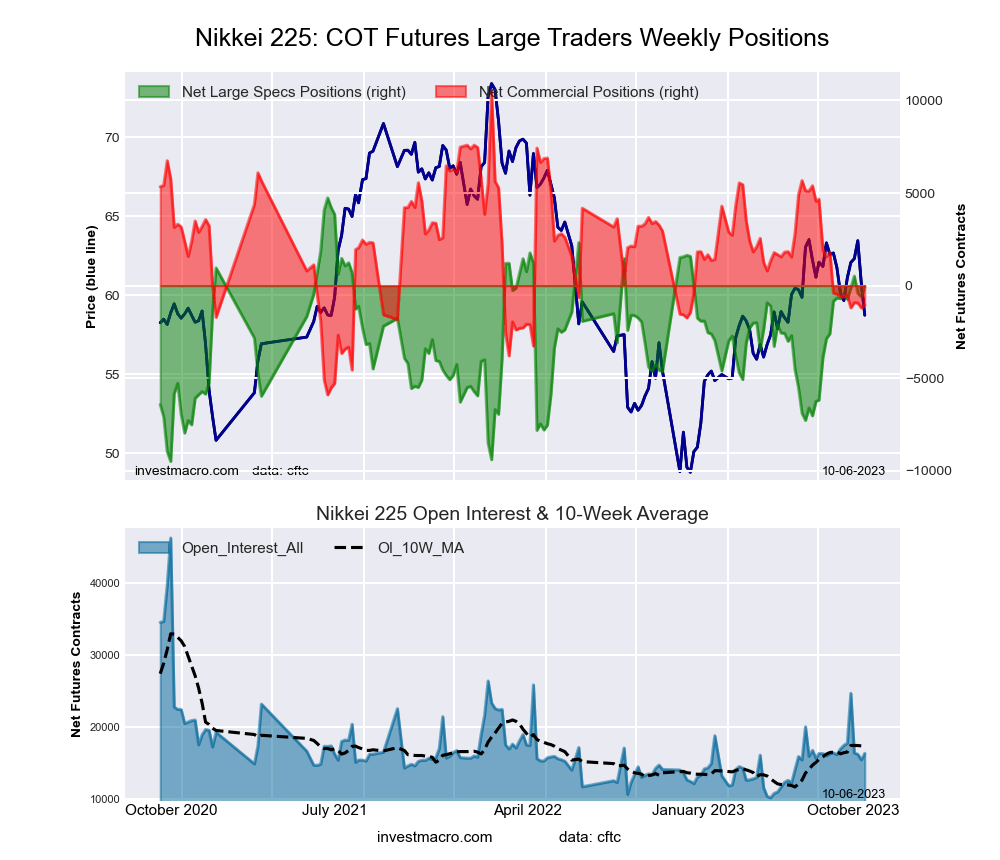
Nikkei Stock Average (USD) Futures COT ChartThe Nikkei Stock Average (USD) large speculator standing this week was a net position of -2,128 contracts in the data reported through Tuesday. This was a weekly rise of 127 contracts from the previous week which had a total of -2,255 net contracts.

This week’s current strength score (the trader positioning range over the past three years, measured from 0 to 100) shows the speculators are currently Bullish with a score of 51.8 percent. The commercials are Bearish with a score of 40.1 percent and the small traders (not shown in chart) are Bearish with a score of 46.3 percent.

Price Trend-Following Model: Strong Downtrend

Our weekly trend-following model classifies the current market price position as: Strong Downtrend. The current action for the model is considered to be: Hold – Maintain Short Position.

Nikkei Stock Average Futures StatisticsSPECULATORSCOMMERCIALSSMALL TRADERS
– Percent of Open Interest Longs:5.870.224.1
– Percent of Open Interest Shorts:19.765.614.7
– Net Position:-2,1286951,433
– Gross Longs:88410,7543,688
– Gross Shorts:3,01210,0592,255
– Long to Short Ratio:0.3 to 11.1 to 11.6 to 1
NET POSITION TREND:
– Strength Index Score (3 Year Range Pct):51.840.146.3
– Strength Index Reading (3 Year Range):BullishBearishBearish
NET POSITION MOVEMENT INDEX:
– 6-Week Change in Strength Index:-18.69.812.9


MSCI EAFE Mini Futures:

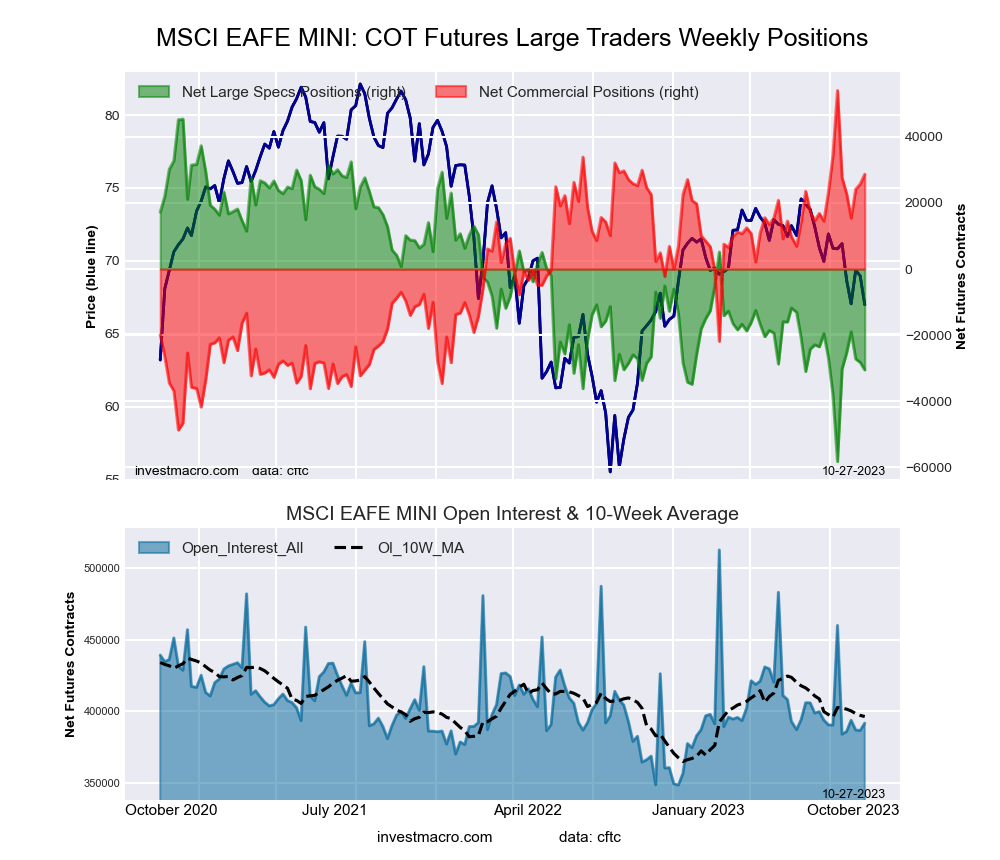
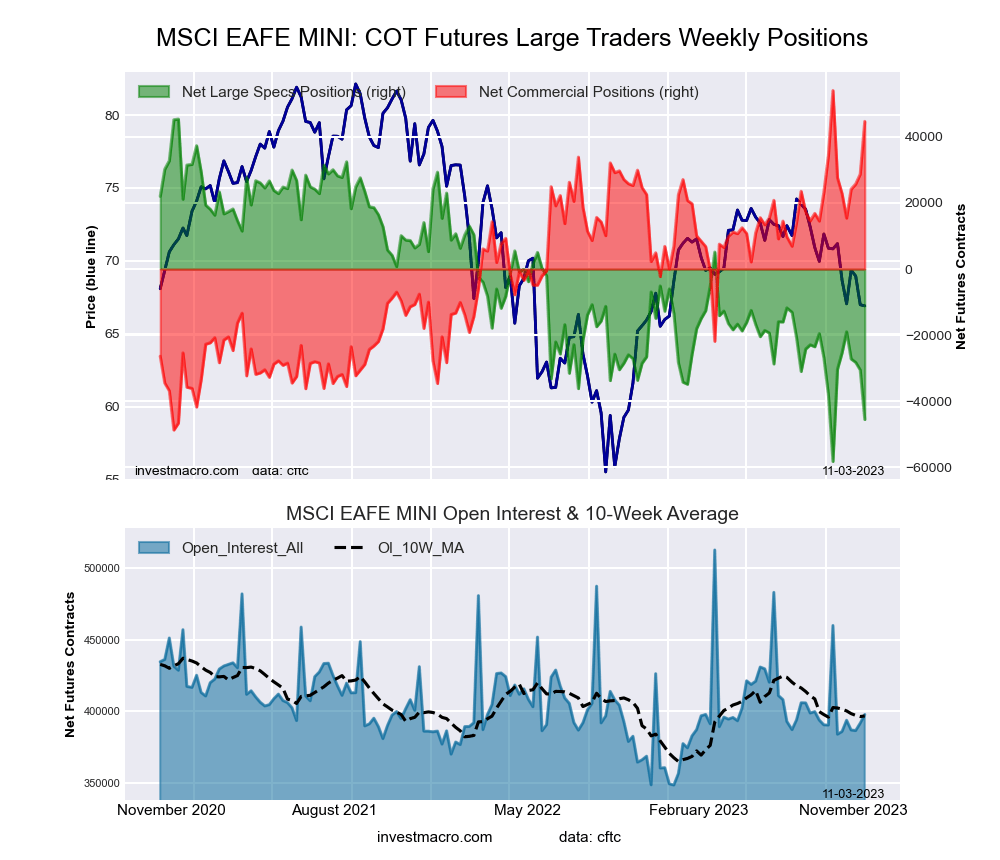
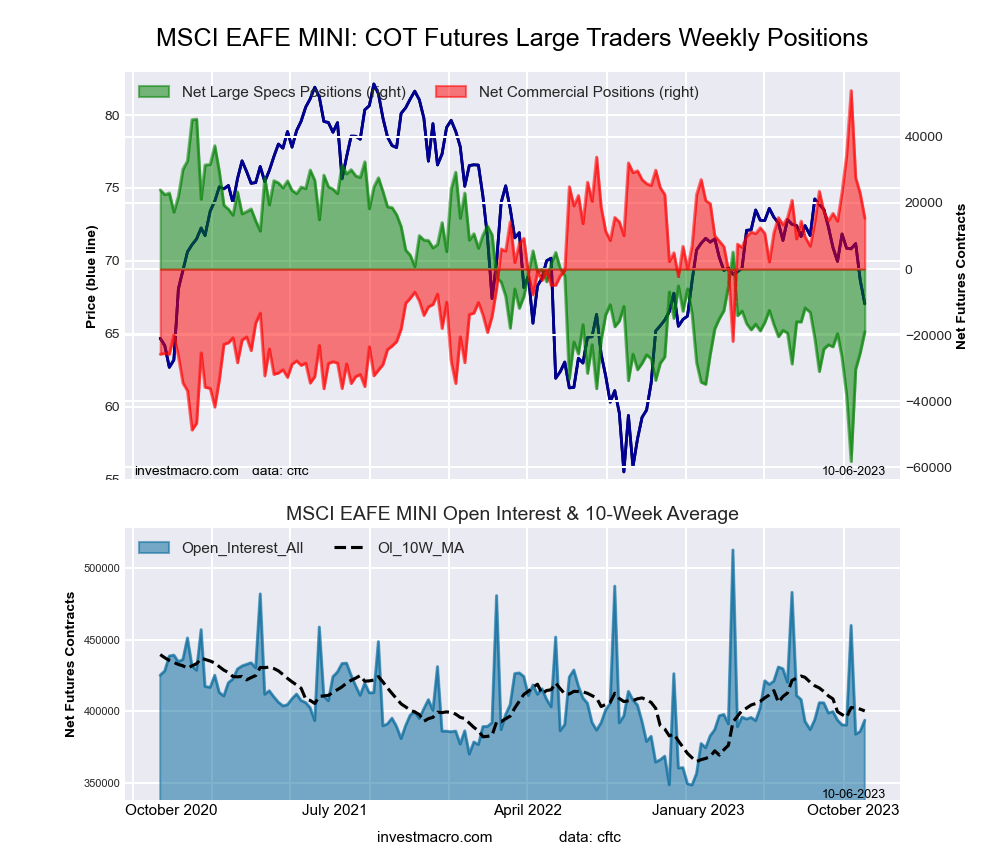
MSCI EAFE Mini Futures COT ChartThe MSCI EAFE Mini large speculator standing this week was a net position of -30,499 contracts in the data reported through Tuesday. This was a weekly decrease of -2,280 contracts from the previous week which had a total of -28,219 net contracts.

This week’s current strength score (the trader positioning range over the past three years, measured from 0 to 100) shows the speculators are currently Bearish with a score of 26.7 percent. The commercials are Bullish with a score of 75.4 percent and the small traders (not shown in chart) are Bearish with a score of 26.0 percent.

Price Trend-Following Model: Strong Downtrend

Our weekly trend-following model classifies the current market price position as: Strong Downtrend. The current action for the model is considered to be: Hold – Maintain Short Position.

MSCI EAFE Mini Futures StatisticsSPECULATORSCOMMERCIALSSMALL TRADERS
– Percent of Open Interest Longs:6.590.02.6
– Percent of Open Interest Shorts:14.382.72.2
– Net Position:-30,49928,7001,799
– Gross Longs:25,471352,59410,247
– Gross Shorts:55,970323,8948,448
– Long to Short Ratio:0.5 to 11.1 to 11.2 to 1
NET POSITION TREND:
– Strength Index Score (3 Year Range Pct):26.775.426.0
– Strength Index Reading (3 Year Range):BearishBullishBearish
NET POSITION MOVEMENT INDEX:
– 6-Week Change in Strength Index:26.7-24.6-11.8


Article By InvestMacroReceive our weekly COT Reports by Email

*COT Report: The COT data, released weekly to the public each Friday, is updated through the most recent Tuesday (data is 3 days old) and shows a quick view of how large speculators or non-commercials (for-profit traders) were positioned in the futures markets.

The CFTC categorizes trader positions according to commercial hedgers (traders who use futures contracts for hedging as part of the business), non-commercials (large traders who speculate to realize trading profits) and nonreportable traders (usually small traders/speculators) as well as their open interest (contracts open in the market at time of reporting).See CFTC criteria here.

All information and opinions on this website and contained in this article are for general informational purposes only and do not constitute investment advice.

RoboMarkets Integrates Acuity Trading’s Advanced AI Technologies to Enhance Client Offerings

October 26, 2023

Limassol, Cyprus

RoboMarkets, a European brokerage company, has announced a strategic partnership with Acuity Trading, renowned for its advanced AI-driven trading technologies. This alliance emphasises RoboMarkets’ commitment to offering its retail and professional clients refined, alternative perspectives on the financial market, ensuring they maintain a competitive edge in their trading endeavours.

In its effort to empower its traders with augmented trading experiences, RoboMarkets is poised to integrate Acuity’s innovative AI-driven tools, including the Economic Calendar, AnalysisIQ, and AssetIQ. This collaboration enriches the decision-making capabilities of RoboMarkets’ traders and underscores the Company’s commitment to offering a comprehensive perspective on the financial market.

RoboMarkets’ traders will gain access to advanced tools including:

  • Acuity’s AI-Powered Economic Calendar: this tool offers real-time insights. It equips traders to navigate market volatilities and uncertainties with AI-enhanced filtering and vivid indicators, transforming these challenges into actionable trading opportunities.
  • Acuity’s AnalysisIQ: this technology, originating from Signal Centre and acquired by Acuity in 2021, operates under FCA regulation. It provides traders with professional, dependable market research and trade signals, bolstering their trading strategies and decision-making processes.
  • AssetIQ: this robust research tool provides traders with a comprehensive, unified view of global market assets, ensuring that the latest and most relevant data is always available to assist them in making informed trading decisions.

RoboMarkets has consistently aimed to continually enhance its offerings and provide clients with innovative tools based on the latest technological breakthroughs. The partnership with Acuity Trading underscores RoboMarkets’ commitment to continuously refining its offerings with cutting-edge tools.

As a CySEC-regulated entity, RoboMarkets remains steadfast in prioritising the evolving needs of its traders. With a diverse range of over 3,000 instruments, including US Stocks and ETFs, available for trading and investment, the Company reinforces its dedication to maintaining a leading position in the trading industry by integrating with Acuity Trading’s innovative tools.

About RoboMarkets

RoboMarkets is a financial brokerage company operating under CySEC license No. 191/13. RoboMarkets offers investment services in many European countries and provides traders working in financial markets with access to its proprietary platforms. Visit www.robomarkets.com to find out more about the Company’s products.

About Acuity Trading

Acuity Trading revolutionised the online trading experience for millions of investors with the introduction of visual news and sentiment tools in 2013. Today, Acuity continues to lead the fintech market with alpha generating alternative data and highly engaging trading tools using the latest in AI research and technology. Acuity’s team of academics, scientists, news, and market professionals are dedicated to delivering highly effective data products that bring value to investors of all levels and experience. Flexible delivery options include APIs, MT4/5, plug and play widgets and third-party automation services.

“Risk Warning: CFDs are complex instruments and come with a high risk of losing money rapidly due to leverage. 69.88% of retail investor accounts lose money when trading CFDs with this provider. You should consider whether you understand how CFDs work and whether you can afford to take the high risk of losing your money.”

Can SPX500_m bears keep up their momentum?

By ForexTime 

  • SPX500_m flirts above weekly resistance ahead of US CPI
  • Bears in control on weekly timeframe
  • Three potential targets identified.
  • Bearish scenario invalidated If 4401.1 price level is broken
  • Will key US inflation report support SPX500_m bulls or bears?

The SPX500_m seems to be in the process of a technical bounce on the daily charts with prices flirting above key weekly resistance ahead of the US CPI report later today. Nevertheless, bears remain in firm control on the weekly charts. Even though the current correction wave is strong – it is approaching a point of possible resistance at the trend line.

On the daily timeframe, prices are at a weekly resistance turned support level and the bullish strength is undeniable with an extended correction wave in the current down trend clearly visible. This leaves the field open for either bullish continuation or a bearish intervention and the possible start of a new impulse wave in the down trend. Since both the weekly and the daily trend is downwards, a more detailed bearish opportunity is discussed on the H4 chart.

The H4 chart reveals more details with a strong bullish trend in progress. As mentioned above the higher time frames as well as the effect on traders based on the CPI news event might cause the bears to take over again.

Attaching a modified Fibonacci tool to a trigger level near a last bottom at 4343.3 and dragging it to a stop loss just above a last proper swing at 4401.1, three possible targets can be established:

  • The first possible target at 4314.3 (Target 1) with risk management in sight.

  • The second potential price target at 4273.9 (Target 2) – located just before weekly support level.

  • The third and last price target is feasible at 4236.3 (Target 3) if bears can break through the weekly support level.

If the price at 4401.1 is broken, this scenario is no longer applicable.


Forex-Time-LogoArticle by ForexTime

ForexTime Ltd (FXTM) is an award winning international online forex broker regulated by CySEC 185/12 www.forextime.com

COT Stock Market Charts: Speculator Bets led by VIX & S&P500

By InvestMacro

Here are the latest charts and statistics for the Commitment of Traders (COT) data published by the Commodities Futures Trading Commission (CFTC).

The latest COT data is updated through Tuesday October 3rd and shows a quick view of how large traders (for-profit speculators and commercial entities) were positioned in the futures markets.

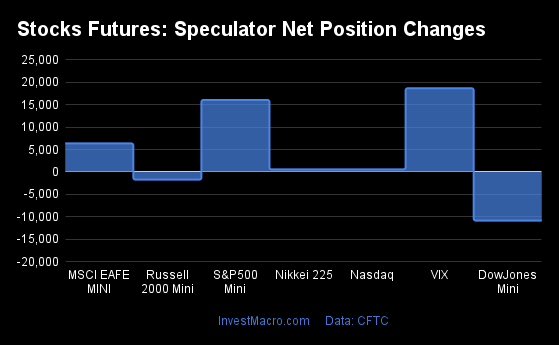
Weekly Speculator Changes led by VIX & S&P500-Mini

The COT stock markets speculator bets were higher this week as five out of the seven stock markets we cover had higher positioning while the other three markets had lower speculator contracts.

Leading the gains for the stock markets was the VIX (18,642 contracts) with the S&P500-Mini (16,046 contracts), the MSCI EAFE-Mini (6,365 contracts), the Nasdaq-Mini (589 contracts) and the Nikkei 225 (567 contracts) also showing positive weeks.

The leading market with the declines in speculator bets this week was the DowJones-Mini (-10,829 contracts) with the Russell-Mini (-1,706 contracts) also recording lower bets on the week.


Data Snapshot of Stock Market Traders | Columns Legend
Oct-03-2023OIOI-IndexSpec-NetSpec-IndexCom-NetCOM-IndexSmalls-NetSmalls-Index
S&P500-Mini2,138,03415-73,2355446,1154627,12048
Nikkei 22516,37617-4366-1,058291,10142
Nasdaq-Mini254,924411,435411,64647-3,08159
DowJones-Mini100,82365-32,447029,549942,89858
VIX381,16263-34,1939440,5336-6,34064
Nikkei 225 Yen52,277403,042438,41834-11,46070


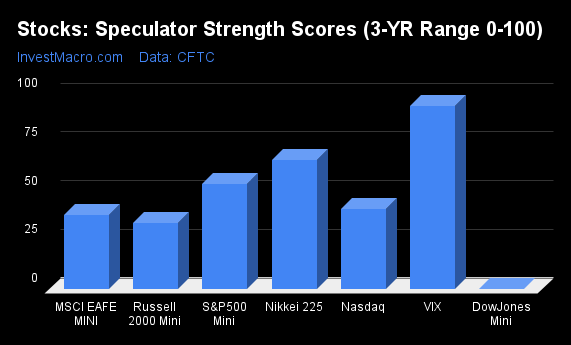
Strength Scores led by VIX & Nikkei 225

COT Strength Scores (a normalized measure of Speculator positions over a 3-Year range, from 0 to 100 where above 80 is Extreme-Bullish and below 20 is Extreme-Bearish) showed that the VIX (94 percent) and the Nikkei 225 (66 percent) lead the stock markets this week. The S&P500-Mini (54 percent) and Nikkei 225 Yen (43 percent) come in as the next highest in the weekly strength scores.

On the downside, the DowJones-Mini (0 percent) comes in at the lowest strength level currently and is in Extreme-Bearish territory (below 20 percent). The next lowest strength score is the Russell-Mini (34 percent).

Strength Statistics:
VIX (94.0 percent) vs VIX previous week (80.4 percent)
S&P500-Mini (53.8 percent) vs S&P500-Mini previous week (51.4 percent)
DowJones-Mini (0.0 percent) vs DowJones-Mini previous week (26.0 percent)
Nasdaq-Mini (41.1 percent) vs Nasdaq-Mini previous week (40.2 percent)
Russell2000-Mini (34.0 percent) vs Russell2000-Mini previous week (35.0 percent)
Nikkei USD (66.4 percent) vs Nikkei USD previous week (62.4 percent)
EAFE-Mini (37.9 percent) vs EAFE-Mini previous week (31.7 percent)


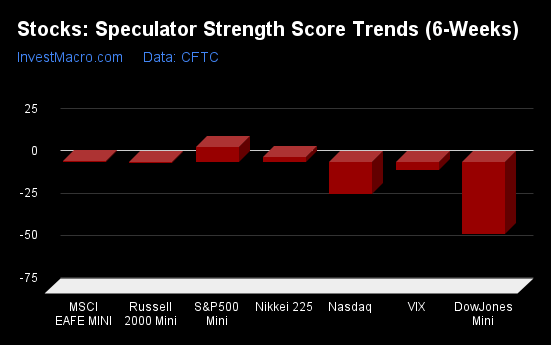
S&P500-Mini & Nikkei 225 top the 6-Week Strength Trends

COT Strength Score Trends (or move index, calculates the 6-week changes in strength scores) showed that the S&P500-Mini (9 percent) leads the past six weeks trends for the stock markets. The Nikkei 225 (3 percent) and the MSCI EAFE-Mini (1 percent) are the next highest positive movers in the latest trends data.

The DowJones-Mini (-43 percent) leads the downside trend scores currently with the Nasdaq-Mini (-19 percent) coming in as the next market with lower trend scores.

Strength Trend Statistics:
VIX (-4.7 percent) vs VIX previous week (-19.6 percent)
S&P500-Mini (9.0 percent) vs S&P500-Mini previous week (4.3 percent)
DowJones-Mini (-42.6 percent) vs DowJones-Mini previous week (-44.2 percent)
Nasdaq-Mini (-19.1 percent) vs Nasdaq-Mini previous week (-6.7 percent)
Russell2000-Mini (-0.9 percent) vs Russell2000-Mini previous week (5.8 percent)
Nikkei USD (3.0 percent) vs Nikkei USD previous week (0.6 percent)
EAFE-Mini (0.5 percent) vs EAFE-Mini previous week (-1.8 percent)


Individual Stock Market Charts:

VIX Volatility Futures:

VIX Volatility Futures COT ChartThe VIX Volatility large speculator standing this week resulted in a net position of -34,193 contracts in the data reported through Tuesday. This was a weekly rise of 18,642 contracts from the previous week which had a total of -52,835 net contracts.

This week’s current strength score (the trader positioning range over the past three years, measured from 0 to 100) shows the speculators are currently Bullish-Extreme with a score of 94.0 percent. The commercials are Bearish-Extreme with a score of 6.5 percent and the small traders (not shown in chart) are Bullish with a score of 63.6 percent.

Price Trend-Following Model: Strong Uptrend

Our weekly trend-following model classifies the current market price position as: Strong Uptrend. The current action for the model is considered to be: Hold – Maintain Long Position.

VIX Volatility Futures StatisticsSPECULATORSCOMMERCIALSSMALL TRADERS
– Percent of Open Interest Longs:24.946.76.4
– Percent of Open Interest Shorts:33.836.18.1
– Net Position:-34,19340,533-6,340
– Gross Longs:94,830178,11224,423
– Gross Shorts:129,023137,57930,763
– Long to Short Ratio:0.7 to 11.3 to 10.8 to 1
NET POSITION TREND:
– Strength Index Score (3 Year Range Pct):94.06.563.6
– Strength Index Reading (3 Year Range):Bullish-ExtremeBearish-ExtremeBullish
NET POSITION MOVEMENT INDEX:
– 6-Week Change in Strength Index:-4.76.5-13.3


S&P500 Mini Futures:

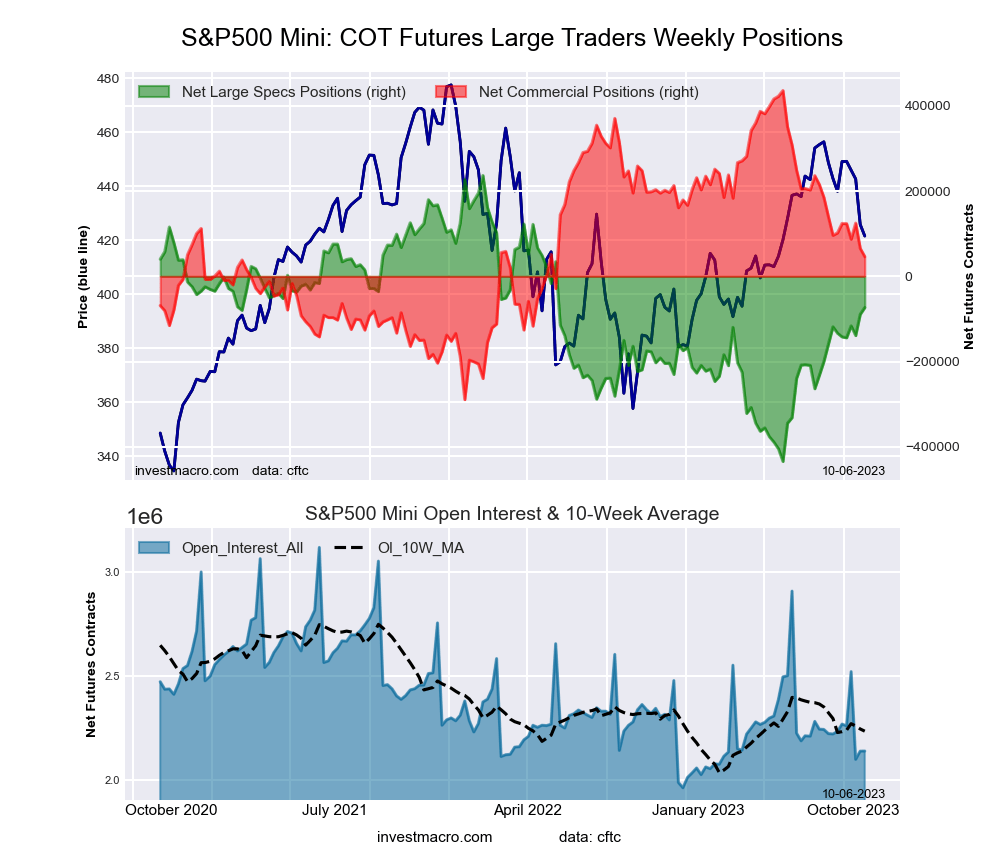
SP500 Mini Futures COT ChartThe S&P500 Mini large speculator standing this week resulted in a net position of -73,235 contracts in the data reported through Tuesday. This was a weekly gain of 16,046 contracts from the previous week which had a total of -89,281 net contracts.

This week’s current strength score (the trader positioning range over the past three years, measured from 0 to 100) shows the speculators are currently Bullish with a score of 53.8 percent. The commercials are Bearish with a score of 46.3 percent and the small traders (not shown in chart) are Bearish with a score of 48.0 percent.

Price Trend-Following Model: Weak Uptrend

Our weekly trend-following model classifies the current market price position as: Weak Uptrend. The current action for the model is considered to be: Hold – Maintain Long Position.

S&P500 Mini Futures StatisticsSPECULATORSCOMMERCIALSSMALL TRADERS
– Percent of Open Interest Longs:11.274.011.8
– Percent of Open Interest Shorts:14.671.810.5
– Net Position:-73,23546,11527,120
– Gross Longs:239,4421,582,012252,547
– Gross Shorts:312,6771,535,897225,427
– Long to Short Ratio:0.8 to 11.0 to 11.1 to 1
NET POSITION TREND:
– Strength Index Score (3 Year Range Pct):53.846.348.0
– Strength Index Reading (3 Year Range):BullishBearishBearish
NET POSITION MOVEMENT INDEX:
– 6-Week Change in Strength Index:9.0-7.7-1.8


Dow Jones Mini Futures:

Dow Jones Mini Futures COT ChartThe Dow Jones Mini large speculator standing this week resulted in a net position of -32,447 contracts in the data reported through Tuesday. This was a weekly decline of -10,829 contracts from the previous week which had a total of -21,618 net contracts.

This week’s current strength score (the trader positioning range over the past three years, measured from 0 to 100) shows the speculators are currently Bearish-Extreme with a score of 0.0 percent. The commercials are Bullish-Extreme with a score of 93.8 percent and the small traders (not shown in chart) are Bullish with a score of 58.0 percent.

Price Trend-Following Model: Weak Uptrend

Our weekly trend-following model classifies the current market price position as: Weak Uptrend. The current action for the model is considered to be: Hold – Maintain Long Position.

Dow Jones Mini Futures StatisticsSPECULATORSCOMMERCIALSSMALL TRADERS
– Percent of Open Interest Longs:19.364.714.9
– Percent of Open Interest Shorts:51.535.412.0
– Net Position:-32,44729,5492,898
– Gross Longs:19,48065,20015,041
– Gross Shorts:51,92735,65112,143
– Long to Short Ratio:0.4 to 11.8 to 11.2 to 1
NET POSITION TREND:
– Strength Index Score (3 Year Range Pct):0.093.858.0
– Strength Index Reading (3 Year Range):Bearish-ExtremeBullish-ExtremeBullish
NET POSITION MOVEMENT INDEX:
– 6-Week Change in Strength Index:-42.635.70.6


Nasdaq Mini Futures:

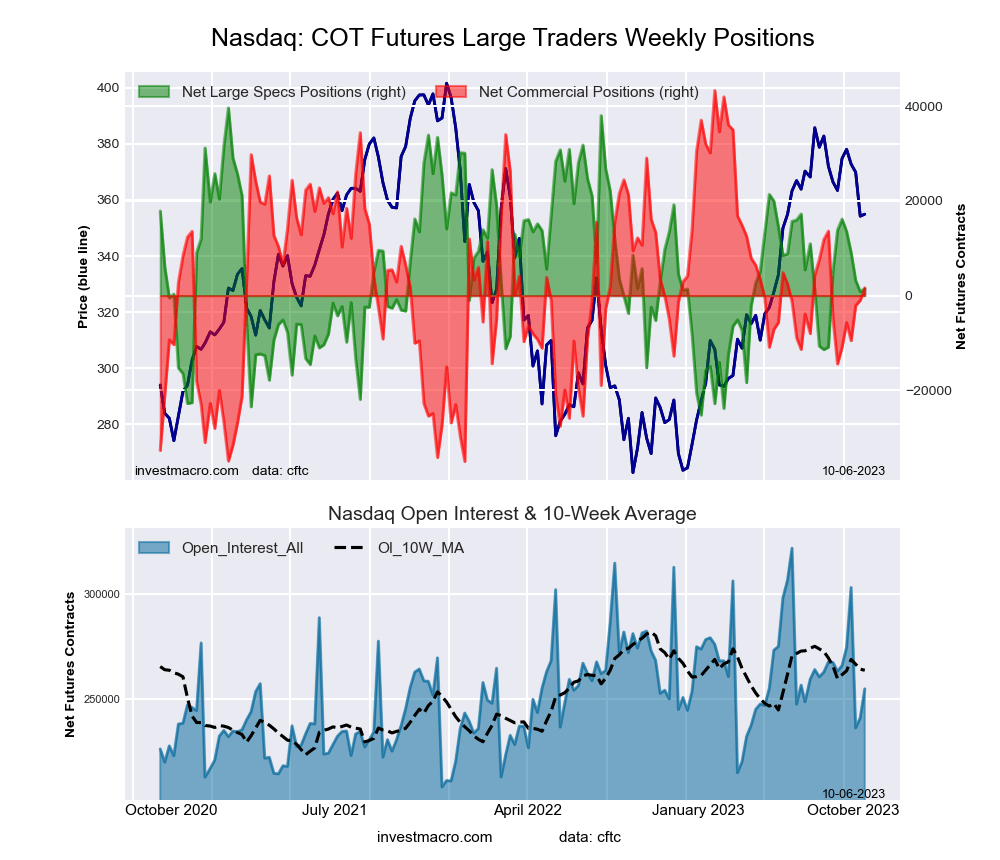
Nasdaq Mini Futures COT ChartThe Nasdaq Mini large speculator standing this week resulted in a net position of 1,435 contracts in the data reported through Tuesday. This was a weekly boost of 589 contracts from the previous week which had a total of 846 net contracts.

This week’s current strength score (the trader positioning range over the past three years, measured from 0 to 100) shows the speculators are currently Bearish with a score of 41.1 percent. The commercials are Bearish with a score of 46.8 percent and the small traders (not shown in chart) are Bullish with a score of 58.6 percent.

Price Trend-Following Model: Weak Uptrend

Our weekly trend-following model classifies the current market price position as: Weak Uptrend. The current action for the model is considered to be: Hold – Maintain Long Position.

Nasdaq Mini Futures StatisticsSPECULATORSCOMMERCIALSSMALL TRADERS
– Percent of Open Interest Longs:25.957.915.1
– Percent of Open Interest Shorts:25.457.216.3
– Net Position:1,4351,646-3,081
– Gross Longs:66,087147,54438,421
– Gross Shorts:64,652145,89841,502
– Long to Short Ratio:1.0 to 11.0 to 10.9 to 1
NET POSITION TREND:
– Strength Index Score (3 Year Range Pct):41.146.858.6
– Strength Index Reading (3 Year Range):BearishBearishBullish
NET POSITION MOVEMENT INDEX:
– 6-Week Change in Strength Index:-19.120.5-8.5


Russell 2000 Mini Futures:

Russell 2000 Mini Futures COT ChartThe Russell 2000 Mini large speculator standing this week resulted in a net position of -63,308 contracts in the data reported through Tuesday. This was a weekly decrease of -1,706 contracts from the previous week which had a total of -61,602 net contracts.

This week’s current strength score (the trader positioning range over the past three years, measured from 0 to 100) shows the speculators are currently Bearish with a score of 34.0 percent. The commercials are Bullish with a score of 65.6 percent and the small traders (not shown in chart) are Bearish with a score of 29.3 percent.

Price Trend-Following Model: Strong Downtrend

Our weekly trend-following model classifies the current market price position as: Strong Downtrend. The current action for the model is considered to be: New Sell – Short Position.

Russell 2000 Mini Futures StatisticsSPECULATORSCOMMERCIALSSMALL TRADERS
– Percent of Open Interest Longs:9.583.75.3
– Percent of Open Interest Shorts:22.570.85.1
– Net Position:-63,30862,415893
– Gross Longs:46,209406,77525,724
– Gross Shorts:109,517344,36024,831
– Long to Short Ratio:0.4 to 11.2 to 11.0 to 1
NET POSITION TREND:
– Strength Index Score (3 Year Range Pct):34.065.629.3
– Strength Index Reading (3 Year Range):BearishBullishBearish
NET POSITION MOVEMENT INDEX:
– 6-Week Change in Strength Index:-0.92.8-10.9


Nikkei Stock Average (USD) Futures:

Nikkei Stock Average (USD) Futures COT ChartThe Nikkei Stock Average (USD) large speculator standing this week resulted in a net position of -43 contracts in the data reported through Tuesday. This was a weekly rise of 567 contracts from the previous week which had a total of -610 net contracts.

This week’s current strength score (the trader positioning range over the past three years, measured from 0 to 100) shows the speculators are currently Bullish with a score of 66.4 percent. The commercials are Bearish with a score of 29.4 percent and the small traders (not shown in chart) are Bearish with a score of 42.2 percent.

Price Trend-Following Model: Strong Downtrend

Our weekly trend-following model classifies the current market price position as: Strong Downtrend. The current action for the model is considered to be: Hold – Maintain Short Position.

Nikkei Stock Average Futures StatisticsSPECULATORSCOMMERCIALSSMALL TRADERS
– Percent of Open Interest Longs:14.562.223.3
– Percent of Open Interest Shorts:14.868.716.6
– Net Position:-43-1,0581,101
– Gross Longs:2,37310,1853,818
– Gross Shorts:2,41611,2432,717
– Long to Short Ratio:1.0 to 10.9 to 11.4 to 1
NET POSITION TREND:
– Strength Index Score (3 Year Range Pct):66.429.442.2
– Strength Index Reading (3 Year Range):BullishBearishBearish
NET POSITION MOVEMENT INDEX:
– 6-Week Change in Strength Index:3.0-2.70.3


MSCI EAFE Mini Futures:

MSCI EAFE Mini Futures COT ChartThe MSCI EAFE Mini large speculator standing this week resulted in a net position of -18,963 contracts in the data reported through Tuesday. This was a weekly boost of 6,365 contracts from the previous week which had a total of -25,328 net contracts.

This week’s current strength score (the trader positioning range over the past three years, measured from 0 to 100) shows the speculators are currently Bearish with a score of 37.9 percent. The commercials are Bullish with a score of 62.4 percent and the small traders (not shown in chart) are Bearish with a score of 34.7 percent.

Price Trend-Following Model: Strong Downtrend

Our weekly trend-following model classifies the current market price position as: Strong Downtrend. The current action for the model is considered to be: Hold – Maintain Short Position.

MSCI EAFE Mini Futures StatisticsSPECULATORSCOMMERCIALSSMALL TRADERS
– Percent of Open Interest Longs:8.787.92.9
– Percent of Open Interest Shorts:13.683.92.0
– Net Position:-18,96315,4183,545
– Gross Longs:34,410345,96611,231
– Gross Shorts:53,373330,5487,686
– Long to Short Ratio:0.6 to 11.0 to 11.5 to 1
NET POSITION TREND:
– Strength Index Score (3 Year Range Pct):37.962.434.7
– Strength Index Reading (3 Year Range):BearishBullishBearish
NET POSITION MOVEMENT INDEX:
– 6-Week Change in Strength Index:0.50.9-7.2


Article By InvestMacroReceive our weekly COT Newsletter

*COT Report: The COT data, released weekly to the public each Friday, is updated through the most recent Tuesday (data is 3 days old) and shows a quick view of how large speculators or non-commercials (for-profit traders) were positioned in the futures markets.

The CFTC categorizes trader positions according to commercial hedgers (traders who use futures contracts for hedging as part of the business), non-commercials (large traders who speculate to realize trading profits) and nonreportable traders (usually small traders/speculators) as well as their open interest (contracts open in the market at time of reporting). See CFTC criteria here.

Week Ahead: SPX500_m primed for heavy event week

By ForexTime 

  • Big week for SPX500_m thanks to host of key risk events
  • Watch out for US CPI, Fed speeches & big bank earnings
  • SPX500_m bearish but RSI flirting around oversold territory
  • Fresh fundamental spark could trigger big move
  • Keep eye on strong support above 200-day SMA

Even as the countdown looms to the highly anticipated US jobs report this afternoon (Friday 6th October), investors are bracing for even more market volatility in the week ahead!

The incoming US inflation data, speeches from various Fed officials, FOMC minutes as well as earnings announcements by US banks could rock the S&P 500 next week.

Monday, October 9

  • CNH: China aggregate financing, money supply, new yuan loans
  • EUR: Germany industrial production
  • USD: Fed Vice Chair Michael Barr, Dallas Fed President Lorie Logan, Fed Governor Philip Jefferson speech
  • World Bank-IMF annual meetings open in Marrakech

Tuesday, October 10  

  • AUD: Australia Westpac consumer confidence
  • JPY: Japan balance of payments
  • NZD: New Zealand home sales
  • USD: Atlantic Fed President Raphael Bostic, Fed Governor Christopher Waller,  Minneapolis Fed President Neel Kashkari, San Francisco Fed President Mary Daly speech
  • IMF issues its latest world economic outlook

Wednesday, October 11

  • EUR: Germany CPI
  • USD: FOMC minutes, PPI, Fed Governor Michelle Bowman, Atlanta Fed President Raphael Bostic speech

Thursday, October 12

  • JPY: Japan machinery orders, PPI
  • EUR: ECB September meeting minutes
  • NZD: New Zealand food prices
  • GBP: UK industrial production
  • USD: US September CPI report, initial jobless claims, Atlanta Fed President Raphael Bostic speech

Friday, October 13

  • CAD: Canada existing home sales
  • CNH: China CPI, PPI, trade
  • EUR: Eurozone industrial production
  • USD: US University of Michigan consumer sentiment
  • SPX500_m: Citigroup, JPMorgan, Wells Fargo, BlackRock results

The September US Consumer Price Index (CPI) report published on Thursday, October 12 will most likely influence expectations around whether the Fed hikes rates one more time in 2023.

Markets are forecasting:

  • CPI year-on-year (September 2023 vs. September 2022) to cool 3.6% from 3.7% in the prior month.
  • Core CPI year-on-year to cool 4.1% from 4.3% seen in August.
  • CPI month-on-month (September 2023 vs August 2023) to cool 0.3% from 0.6% in the prior month.
  • Core CPI month-on-month to remain unchanged at 0.3% from 0.3% seen in August.

Back in August, US headline inflation accelerated thanks to higher oil prices, but core inflation fell to the lowest level since September 2021. Should September’s CPI report show evidence of cooling prices, this is likely to boost bets around the Fed pausing hikes for the rest of 2023.

US CPI report may rock the SPX500_m…

The S&P 500 has a handful of tech stocks that remain sensitive to Fed hike expectations.

Given how tech stocks account for roughly 28% of the index’s value, the incoming CPI report could trigger volatility.

In a nutshell, tech stocks are pressured by higher interest rates because their value is based on earnings forecasted in the future.

  • The SPX500_m is likely to trade lower if the inflation numbers are hot and sticky.
  • Should the CPI report print below market forecasts, the SPX500_m may receive a boost higher.

US earnings season kicks off…

Third quarter earnings season kicks off on Friday 13th October, led by US banking giants JPMorgan, Citigroup, Wells Fargo and BlackRock. Investors will comb through the earnings for fresh insight into the health of US banks which can be used to gauge the health of the US economy.

When considering how financial stocks account for around 12.7% of the S&P 500, the market reaction to these big bank earnings on Friday is likely to impact the index.

  • The SPX500_m could push higher if the bank earnings exceed forecasts.
  • If the earnings disappoint, this could drag the SPX500_m lower

Conflicting technical signals 

The SPX500_m remains in a bearish trend on the daily charts as there have been consistently lower lows and lower highs. However, strong support can be found just above the 200-day SMA with the Relative Strength Index (RSI) flirting around oversold territory – suggesting a potential pullback down the road. These conflicting signals may keep the SPX500_m trapped within a range until a fresh fundamental catalyst triggers a breakout. In the meantime, support can be found at 4210 and resistance at 4332.

  • A solid breakout above 4332 could open a path towards 4410 where the 100-day SMA resides.
  • Should prices break below 4210, this could encourage a decline towards levels not seen since May at 4130.


Forex-Time-LogoArticle by ForexTime

ForexTime Ltd (FXTM) is an award winning international online forex broker regulated by CySEC 185/12 www.forextime.com
Big 3 Automaker Stellantis Invests $90M in Lithium Triangle Explorer

Source: Streetwise Reports  (10/4/23)

Shares of this lithium explorer jumped after an announcement that big-three automaker Stellantis is investing US$90 million in the company. One analyst said other major companies are watching.

Shares of lithium explorer Argentina Lithium & Energy Corp. (LIT:TSX.V; PNXLF:OTC; OAY3:FSE) jumped 111% after it announced that big-three automaker Stellantis (formerly Chrysler) had invested US$90 million to acquire shares in the company.

The Stellantis umbrella includes iconic brands like Chrysler, Alfa Romeo, Citroen, Dodge, Fiat, Jeep, Maserati, and Peugeot. Under the agreement, Peugeot Citroen Argentina SA, a Stellantis subsidiary, will own 19.9% of the company’s issued and outstanding shares, and Argentina Lithium will own 80.1%.

Argentina Lithium President and Chief Executive Officer Nikolaos Cacos said it highlights the shortage approaching for the metal needed for electric vehicle (EV) batteries.

Stellantis is reaching down to exploration companies like Argentina Lithium to make sure they have the lithium needed “for the electric vehicle transition, which is coming fast and furious,” Cacos said in an interview with Proactive Investors.

Research Corp. analyst Sid Rajeev rated the stock a Buy with a fair value target price of CA$0.52.

The lithium market is expected to grow globally from US$37.8 billion in 2022 to US$89.9 billion in 2030, according to a report by Fortune Business Insights.

“The growing adoption of hybrid and electric vehicles (EVs), high-drain portable electronics, and energy storage systems has had a huge impact on the growth of the overall market,” the report said.

LIT’s share price went from CA$0.23 to CA$0.485 on the day of the announcement.

The news is also bound to attract the attention of other major companies.

“As LIT’s projects are close to well-known projects held by majors, the company can be subject to M&A events if it is able to delineate a resource in one or more of its assets,” noted Fundamental Research Corp. analyst Sid Rajeev while initiating coverage on the company in July.

Rajeev rated the stock a Buy with a fair value target price of CA$0.52.

After an advance late in September 2022, Technical Analyst Clive Maund noted that “something is going on” with the stock and that it should see a larger move.

The Catalyst: Fueling the New Green Economy

Cacos said having a partner like Stellantis validates the projects and the exploration work that Argentina Lithium has done so far in the Lithium Triangle to find the battery metal that could fuel the new green economy.

The company has acquired resource properties across the Americas, with a considerable focus on Argentina and the Lithium Triangle. Its current projects include Rincon West, Antofalla North, Pocitos, and Incahuasi.

After an advance late in September 2022, Technical Analyst Clive Maund noted that “something is going on” with the stock and that it should see a larger move.

The Rincon West Project includes three mining concessions covering 3,742 hectares at the Rincon Salar, west and north of Rio Tinto Plc’s (RIO:NYSE; RIO:ASX; RIO:LSE; RTPPF:OTCPK) adjacent Rincon Project.

At its Antofalla North site, the firm controls 10,050 hectares 25 kilometers west of Salar de Hombre Muerto, the “Salt Pan of the Dead Man.”

The Pocitos property includes 26,000 hectares, the company said, and the company’s Incahuasi Project involves a 100% interest in 25,000 hectares of granted mineral rights properties in the Incahuasi Salar basin in Catamarca Province, Argentina.

Funding to Advance All Projects

Stellantis’ investment “allows us to not think about funding anymore as an exploration company,” Cacos said. “I think we can advance all our projects over the next three years, right up to the announcement, define resources and pre-feasibility studies just before, … (and) announcing making a decision or going forward and commercial production.”

After the issuance of exchange shares and at the close of the transaction, on or about October 4, Stellantis will own at most 19.9% of the common shares (on an undiluted basis) of Argentina Lithium, the company said.

The exchange agreement also provides Stellantis with observer rights to attend Argentina Lithium’s board meetings for as long as Stellantis owns at least 10% of the company and allows it to nominate one director to the Board of Directors.

The companies will enter into a lithium offtake agreement in which Stellantis will buy up to 15,000 tonnes per year of lithium produced by LIT over a seven-year period. The agreement may be extended by the companies.

The supply obligation of the agreement is conditional on the start of commercial lithium production at one or more of Argentina Lithium’s projects, as well as other terms, including Stellantis having a first right of first refusal on the sale of lithium products to third parties after production starts.

North American Demand to Drive Lithium Shortfalls

Lithium is a major component of EV batteries, where it is used as a cathode and electrolyte. The soft, silvery metal with highly reactive and flammable properties is also used to strengthen alloys, as a high-temperature lubricant, and as a drug to treat bipolar disorder.

Analysts from Eight Capital predicted that lithium market deficits will widen this decade, and the shortfalls will be driven by demand in North America.

The United States’ EV penetration of 6% lags China’s 26% and Europe’s 20%, analysts Anoop Prihar and Alex Riazanov of Eight Capital wrote in a recent research note. But President Joe Biden’s administration has committed to a target of 50% of new vehicle sales being EVs by 2030

“We estimate North American lithium nameplate production capacity will be 262,900 LCE (million tonnes lithium carbonate) in 2026 based on projects that currently have completed a Definitive Feasibility Study (DFS),” Prihar and Riazanov wrote.

Retail: 63%
Strategic Investors: 37%
63%
37%
*Share Structure as of 9/29/2023


“Although this is a significant increase from the current North American production capacity of 6,000 tonnes LCE, it’s still more than 128,000 tonnes short of what we anticipate will be required by the battery plants. As such, we anticipate the fundamentals underlying lithium demand to remain robust.”

Ownership and Share Structure

The company doesn’t officially share any information regarding management or institutional ownership, but Reuters reported that about 37% was owned by strategic institutions in the most recent reporting.

Its largest shareholders are Lithium Investment Partners LP with 17.68%, Jack Yetiv with 15.24%, Joseph J. Grosso with 3.05%, and the CEO Cacos with 1.04%, according to Reuters.

Its market cap is CA$59.83 million, with 130 million shares outstanding. It trades in a 52-week range of CA$0.60 and CA$0.19.


Important Disclosures:

  1. As of the date of this article, officers and/or employees of Streetwise Reports LLC (including members of their household) own securities of Argentina Lithium & Energy Corp.
  2. Steve Sobek wrote this article for Streetwise Reports LLC and provides services to Streetwise Reports as an employee.
  3. The article does not constitute investment advice. Each reader is encouraged to consult with his or her individual financial professional. By opening this page, each reader accepts and agrees to Streetwise Reports’ terms of use and full legal disclaimer. This article is not a solicitation for investment. Streetwise Reports does not render general or specific investment advice and the information on Streetwise Reports should not be considered a recommendation to buy or sell any security. Streetwise Reports does not endorse or recommend the business, products, services or securities of any company mentioned on Streetwise Reports.

For additional disclosures, please click here.

Global bond rout: complacency could hit your wealth

By George Prior 

Investors need to pay attention to the dramatic global bond market rout to safeguard their wealth despite the sell-off stablising, warns the CEO and founder of one of the world’s largest independent financial advisory organizations.

The warning from deVere Group’s Nigel Green comes as the US, European, and Japanese bond rout deepens.

US bonds maturing in 10 years or more have fallen 46% since peaking in March 2020, according to Bloomberg.

European bonds are following in the footsteps of the US rout, with yields on Germany’s 10-year debt rising above 3% for the first time since 2011, earlier this week. Meanwhile, Japan’s 10-year yield, rose to a decade high, despite the Bank of Japan being prepared to buy $4.5 billion worth of bonds.

Also surging this week have been Australian, Canadian and British government bond yields.

Nigel Green says: “The sell-off began after the US Federal Reserve insisted that interest rates would be kept higher for longer.

“Investors need to be ‘on it’ when it comes to the global bond market rout as it could have far-reaching consequences, impacting various asset classes and investment portfolios, despite the situation having stabilised somewhat for the time being.”

He continues: “Diversification is a cornerstone of a sound investment strategy. However, bond market turbulence can challenge this diversification by affecting both the bond and equity parts of a portfolio.

“When bond prices fall and yields rise, investors can experience losses in their fixed-income holdings.

“At the same time, the shift in investor preferences towards higher-yielding bonds can influence stock markets, potentially leading to equity market declines.

“As such, the bond market’s trajectory may require investors to adjust their asset allocation to mitigate potential losses.”

Many investors turn to bonds for stability and income generation. However, during a bond market rout, even traditionally safe investments, such as government and corporate bonds, can face significant price declines.

“Investors who rely on these bonds for capital preservation and regular income should closely monitor their bond holdings with their financial advisor and perhaps consider diversifying into other assets, such as dividend-paying stocks or alternative investments,” observes the deVere CEO.

Some alternative investments to consider could include precious metal; real assets, such as real estate and infrastructure investments; commodities like oil, natural gas, or agricultural products, and Structured products, such as structured notes which can be customised to offer capital protection or enhanced returns based on specific market conditions.

“To grow and protect their money, I would urge investors to avoid complacency over the global bond rout as we doubt this is the end to the turbulence,” concludes the deVere Group CEO.

About:

deVere Group is one of the world’s largest independent advisors of specialist global financial solutions to international, local mass affluent, and high-net-worth clients.  It has a network of offices across the world, over 80,000 clients and $12bn under advisement.

Investing: What You Can Learn from Mom and Pop

“The highest commitment to stocks since the record levels of early 2000”

By Elliott Wave International

We all love Mom and Pop and cherish the valuable lessons about life they’ve given us along the way.

Yet, when it comes to investing, Mom and Pop may need to learn some lessons of their own.

Keep in mind that the American Association of Individual Investors’ (AAII) weekly survey is said to be representative of “Mom and Pop” investors, well-known for being quite cautious.

The August 2021 Elliott Wave Financial Forecast, a publication which provides analysis of major U.S. financial markets, discussed their behavior as the stock market was staging a significant rally:

In July [2021], the five-month average AAII stock allocation increased to 70.6%, a high level for this normally skittish cohort of investors. … This is the highest commitment to stocks since the record levels of early 2000.

This sentiment indicator is not meant for precision market timing, and, indeed, it seemed like these normally cautious investors had made the right decision. The rally persisted for the remainder of 2021. But, by early January 2022, the Dow Industrials and S&P 500 hit their all-time highs and have traded lower since.

What does this have to do with today?

Here’s an interesting chart and commentary from the August 2023 Elliott Wave Financial Forecast:

This chart shows a jump in the AAII bullish percentage to 59.5% on July 21. … These mom-and-pop investors are traditionally cautious, so big moves and extreme readings generally reflect important capitulations.

Let me emphasize again that sentiment indicators are important yet you may not want to use them for market timing.

That said, when you combine time-tested sentiment indicators with Elliott wave analysis, you get a much clearer picture.

If you’re unfamiliar with Elliott wave analysis, read Frost & Prechter’s Wall Street classic, Elliott Wave Principle: Key to Market Behavior. Here’s a quote from the book:

When after a while the apparent jumble gels into a clear picture, the probability that a turning point is at hand can suddenly and excitingly rise to nearly 100%. It is a thrilling experience to pinpoint a turn, and the Wave Principle is the only approach that can occasionally provide the opportunity to do so.

Our friends at Elliott Wave International are sharing with you a special free report ($80 value).

Using 5 must-see charts, “Are Bulls Headed for a Rude Awakening? 5 Market Warning Signs — Revealed” focuses your readers’ attention on 5 key sentiment areas:

  1. Foreign stock buyers’ behavior: a red flag
  2. See what the crowd’s attitude towards tech stocks shows
  3. Tech stocks vs broad equities: What’s the message here?
  4. Corporate insiders — are they buying or selling?
  5. Artificial intelligence: See what previous technology fevers signaled

Read “5 Market Warning Signs — Revealed” now, FREE ($80 value) >>

P.S. From the inverted U.S. Treasury yield curve to the second-largest U.S. bank failure in history (care of the March Silicon Valley bank collapse) — 2023 has been a year of eerie callbacks to the 2008 financial crisis. See what the rest of the year is likely to bring via our special report >>

This article was syndicated by Elliott Wave International and was originally published under the headline Investing: What You Can Learn from Mom and Pop. EWI is the world’s largest market forecasting firm. Its staff of full-time analysts led by Chartered Market Technician Robert Prechter provides 24-hour-a-day market analysis to institutional and private investors around the world.