­

Archive for Stock Market News – Page 17

Mid-Week Technical Outlook: SPX500_m eyes 2023 high

By ForexTime 

  • SPX500_m up roughly 9% in November
  • Key US data and Powell speech may rock index
  • Prices trending higher with bulls eyeing 2023 high
  • Watch out for RSI which remains in overbought territory

The SPX500_m is on track for its biggest monthly gain since July 2022 and fourth-best month in the last 10 years!

November has been a stellar month for the stock index which is currently up roughly 9% as of writing.

Equity bulls remain empowered by growing speculation around the Fed cutting interest rates in 2024. With the upside momentum in full swing after prices blasted through a previous resistance level, the next key level of interest may be the 2023 high.

Should economic data and dovish remarks from Fed officials reinforce bets around Fed cuts next year, this could keep SPX500_m bulls in a position of power.

Taking a look at the technical picture, prices are firmly bullish on the daily charts. There have been consistently higher highs and higher lows while prices are trading above the 50, 100 and 200-day SMA.

It is a similar story on the weekly timeframe with prices approaching the 4600 resistance level. Beyond this point, the next key level of interest can be found at 4820 – a level not seen since January 2022.

One key thing that stands out in the daily timeframe is the Relative Strength Index (RSI) which remains around 70. With prices deep in overbought territory, a technical throwback could be around the corner before prices push higher.

  • Bulls remain in control above the 4525 level with the next key point of interest at 4611.

  • Should prices slip back under 4525, this may trigger a decline toward 4500 and 4470, respectively.


Forex-Time-LogoArticle by ForexTime

ForexTime Ltd (FXTM) is an award winning international online forex broker regulated by CySEC 185/12 www.forextime.com

Analysts: Apple Stock Still Has Room To Grow

Source: Streetwise Reports  (11/17/23)

Some analysts say the stock of tech giant Apple Inc., the world’s most valuable company with a US$2.95 trillion market cap, still has room to grow.

Tech giant Apple Inc. (AAPL:NASDAQ), the world’s most valuable company with a US$2.95 trillion market cap, met some Wall Street expectations with its recent fourth-quarter results but missed others. However, some analysts agree there is still room to grow with the stock.

AAPL earlier this month posted revenue of US$89.5 billion for the fourth quarter ending Sept. 30, down 1% over the same quarter in 2022, and quarterly earnings per diluted share of US$1.46, up 13% YoY.

While Apple’s revenue has slipped in the last few quarters compared with 2022, its gross margins are expanding, Bernstein analyst Toni Sacconaghi wrote, according to Barrons.

“Fundamentally, it has been an improvement in product gross margins, which have grown an average of ~170 bps per year since 2020, vs. declining ~140 bps per year between 2015 and 2020,” wrote Sacconaghi about basis points, or hundredths of a percentage point.

The analyst has a Market Perform rating on Apple’s stock with a target of US$195 per share.

The company’s Q4 FY2023 iPhone revenue went up 3% to US$43.8 billion YoY, which is in line with Wall Street predictions.

The Catalyst: Services Growth Beats Estimates

While the revenue for some of Apple’s product categories declined — wearables were down 3%, iPad revenue was down 10%, and Mac revenue was down 33% — some analysts pointed to the strong performance of the company’s Services segment as a bright spot. The division includes the App Store, AppleCare, iCloud data storage, Apple Pay, Apple Music, and Apple TV+.

“Fundamentally, it has been an improvement in product gross margins, which have grown an average of ~170 bps per year since 2020, vs. declining ~140 bps per year between 2015 and 2020,” wrote Sacconaghi.

That segment was up 16% YoY to US$22.3 billion and beat analysts’ estimates.

“Underlying iPhone and Services growth looks relatively healthy in the holiday quarter and generally in line with whisper numbers,” wrote Wedbush analyst Dan Ives, according to Benzinga. Ives rated the stock Outperform with a price target of US$240 per share.

Goldman Sachs analyst Michael Ng, who has a Buy rating with a price target of US$227 per share on AAPL, agreed.

“iPhone installed base continues to compound, with the iPhone active installed base reaching a record F4Q23 and benefitting from a record number of switchers in F2023 driven in part by expansion into emerging markets and a growing installed base in Apple Watch, Mac, and iPad,” Ng said.

Personal Computer Pioneer

Apple started in 1976, and its Apple II became one of the first mass-produced microcomputers. Its Macintosh computer, released in 1984, pioneered a graphical-user interface that directly influenced how we use our computers even now.

Goldman Sachs analyst Michael Ng, who has a Buy rating with a price target of US$227 per share on AAPL, agreed.

The company’s software now provides a connected ecosystem across several platforms – Macs, iPhones, iPads, Apple Watches, and Apple TVs. In 2018, it became the first publicly traded U.S. company to be valued at more than US$1 trillion, and its market capitalization rose to over US$3 trillion earlier this year. Its other products include AirPods wireless headphones and HomePod Mini smart speakers.

This year, Apple introduced its much-anticipated new virtual reality headset, Vision Pro, which is scheduled for availability early next year at US$3,499.

“Apple is pleased to report a September quarter revenue record for iPhone and an all-time revenue record in Services,” Apple Chief Executive Office Tim Cook said on the release of the figures. “We now have our strongest lineup of products ever heading into the holiday season, including the iPhone 15 lineup and our first carbon-neutral Apple Watch models, a major milestone in our efforts to make all Apple products carbon neutral by 2030.”

China Fears ‘Overblown,’ Analysts Say

Some analysts also agreed that fears of Apple losing iPhone market share in China could be overstated. Oppenheimer analyst Martin Yang rates Apple Outperform with a US$200 per share price target.

“Fears of iPhone’s share loss in Mainland China to Huawei seem overblown when iPhone likely gained share in F4Q,” Yang wrote, according to Benzinga. “We expect investor concerns over China share loss to mostly dissolve heading into FY24.”

Yang said Apple’s financial results were solid given a “very tough macro backdrop,” Barrons reported.

Oppenheimer analyst Martin Yang rates Apple Outperform with a US$200 per share price target.

“We continue to favor its long-term growth potential and unchallenged market positioning,” Yang wrote.

Wedbush analyst Ives said iPhone 15 demand in China was a highlight of Apple’s results.

“While overall, China revenues missed the Street in the September quarter, this was due to softer Mac/iPad sales, which marks the underlying growth the Street is truly focused on,” Ives said.

Apple’s numbers should cause analysts to “breathe a sea of relief,” he said.

“Underlying iPhone and Services growth looks relatively healthy in the holiday quarter and generally in line with whisper numbers,” he said, adding that iPhone China demand concerns were “a great fictional story by the bears.”

Heading Into the Holiday Season

Bernstein’s Sacconaghi said, Apple’s “guided below consensus revenues for the December quarter, (are) largely driven by a weak iPhone cycle. The December quarter typically sets the tone for the year.”

The analyst said he sees the stock’s quality as holding, but encourages investors to “‘be like Buffett’ and buy on dips.”

Raymond James analyst Srini Pajjuri agreed with Sacconaghi that Apple is seeing higher margins, the China numbers were encouraging.

“iPhone was in line and more importantly, China was an area of strength, which should help allay recent slowdown concerns,” Pajjuri said.

Pajjuri rates APPL Outperform with a price target of US$200 to US$195.

Apple recently filled in its holiday lineup with the new iPhone 15 and Apple Watch Series 9 smartwatches, plus new MacBook Pro and iMac computers that run on the company’s new M3 family of chips, which are based on a smaller and more efficient 3-nanometer process.

Services: Next Big Growth Driver?

Writing for Investor’s Business Daily, Patrick Seitz also noted that the Services division may be

AAPL’s next big growth driver.

“On Oct. 25, Apple raised prices for multiple subscription services, including Apple TV+ and its Apple One bundles,” Seitz wrote.

Investor’s Business Daily gave AAPL a Composite Rating of 90 out of 99. The rating combines “five separate proprietary ratings of fundamental and technical performance,” with the best growth stocks having a rating of 90 or better. It also gave the stock a Relative Strength Rating, looking at how the stock performs against others in the last year, of 90 out of 99.

“Wall Street sees the iPhone maker returning to growth in the December quarter,” Seitz wrote.

Streetwise Ownership Overview*

Apple Inc. (AAPL:NASDAQ)

Institutional: 54%
Retail: 45%
Insiders & Management: 0%
54%
46%
*Share Structure as of 11/16/2023


The company’s next earnings report is due in late January and could be a catalyst for the stock, he said.

Ownership and Share Structure

About 54% of Apple is owned by institutions and about 0.06% by insiders, according to Yahoo! Finance. The rest, about 46%, is in retail.

Top shareholders include The Vanguard Group Inc. with 8.32% or 1.32 billion shares, Berkshire Hathaway Inc. with 5.89% or 916 million shares, BlackRock Institutional Trust Co. with 4.32% or 672 million shares, State Street Global Advisors (US) with 3.66% or 569 million shares, and Geode Capital Management LLC with 1.9% or 296 million shares.

Top individual shareholders include Arthur D. Levinson with 0.03% or 4.59 million shares, CEO Cook with 0.02% or 3.28 million shares, Jeffrey E. Williams with 0% 560,000 shares, and former Vice President Al Gore with 0% or 470,000 shares.

Apple’s market cap is US$2.95 trillion, with 15.55 billion shares outstanding, 15.54 of them free-floating. It trades in a 52-week range of US$198.23 and US$124.17.


Important Disclosures:

  1. As of the date of this article, officers and/or employees of Streetwise Reports LLC (including members of their household) own securities of Apple Inc.
  2. Steve Sobek wrote this article for Streetwise Reports LLC and provides services to Streetwise Reports as an employee.
  3. The article does not constitute investment advice. Each reader is encouraged to consult with his or her individual financial professional. By opening this page, each reader accepts and agrees to Streetwise Reports’ terms of use and full legal disclaimer. This article is not a solicitation for investment. Streetwise Reports does not render general or specific investment advice and the information on Streetwise Reports should not be considered a recommendation to buy or sell any security. Streetwise Reports does not endorse or recommend the business, products, services or securities of any company mentioned on Streetwise Reports.

For additional disclosures, please click here.

Nvidia’s Q3 earnings: challenges ahead for chipmaker giant

By George Prior 

Nvidia’s third quarter earnings when they are revealed on Tuesday will be impressive and the guidance positive, but the company faces challenges ahead, yet almost every investor needs exposure to semiconductors.

This is the prediction from Nigel Green, CEO and founder of deVere Group, one of the world’s largest independent financial advisory, asset management and fintech organizations, ahead of the chip maker’s report this week.

All eyes are on the tech giant after a strong second quarter performance that saw revenues soar to $13.5bn.

The deVere CEO says: “Nvidia’s second-quarter, epic, shock-and-awe-esque earnings report still looms large in the minds of investors around the world.  Now all eyes are on the semiconductor titan’s revenues on Tuesday.

“While we expect the revenue growth to still be hugely impressive and the company’s stellar rise will undoubtedly continue, its trajectory also faces challenges ahead.”

He continues: “There is growing and intensifying competition in the semiconductor market and this will threaten Nvidia’s market share and, therefore, margins over the longer term.

“In addition, the 170% surge in the second quarter mainly came from data centre revenues and Nvidia is very exposed to China.

“With China tightening regulations and cracking down on various industries, including technology, the company may face headwinds in this critical market. Regulatory uncertainties and geopolitical tensions could impact Nvidia’s ability to sustain its mighty results, especially if there are disruptions to its business operations in China.”

Despite the potential challenges on the horizon, the overarching theme remains—semiconductors are a cornerstone of the contemporary tech-driven world.

“Almost every investor should recognise the strategic importance of semiconductor stocks in their portfolios,” notes Nigel Green.

“As the backbone of the digital era, semiconductors power a vast array of technologies, from consumer electronics to advanced computing systems.”

The semiconductor industry’s continued growth is propelled by the increasing demand for smart devices, the expansion of 5G networks, and the rapid development of artificial intelligence and machine learning.

Including semiconductor stocks in a diversified portfolio offers investors exposure to a sector with long-term growth potential. The sector’s resilience, adaptability, and its role in driving technological innovation make it an attractive choice for those seeking stability amid market uncertainties.

“Nvidia’s upcoming earnings report is a pivotal moment for investors to assess the company’s standing in the dynamic semiconductor landscape.

“Investors, recognizing the critical role of semiconductors now and in the future, are likely to find value.

“Your future self will thank you for maintaining or establishing positions in this key sector,” concludes the deVere CEO.

About:

deVere Group is one of the world’s largest independent advisors of specialist global financial solutions to international, local mass affluent, and high-net-worth clients.  It has a network of more than 70 offices across the world, over 80,000 clients and $12bn under advisement.


Trade Of The Week: UK100_m knocks on major resistance

By ForexTime 

  • UK100_m trapped in wide range
  • Index could be rocked by political and economic forces
  • Keep eye on UK Autumn Statement
  • Key levels of interest at 7605, 7500 and 7370
  • Possible breakout on the horizon?

Over the past few months, it has felt like the same old story for the UK100_m as it’s traded within a wide range. Significant support can be found at 7240 and resistance at 7730.

Note: The UK100_m tracks the underlying FTSE100 

The index has been influenced by various forces ranging from the pound’s performance to Bank of England (BoE) hike expectations and quarterly earnings from UK companies.

Note: The FTSE100 has a strong international focus with 75% of revenues from FTSE100 companies coming from outside the UK.

With prices flirting around the 50 and 100-day SMA ahead of a big week for the UK economy, a potential breakout may be on the horizon.

Here are 3 things to keep an eye on:

  1. UK Autumn Statement 

On Wednesday, Chancellor of the Exchequer Jeremy Hunt will present the Autumn Statement to Parliament.

Although this event swings more towards politics, investors will be paying close attention to key updates on the country’s finances and the government’s plan for tax and public spending. Confidence towards the UK economy has improved over the past two weeks as the country not only avoided a contraction in Q3 but inflation fell to its lowest rate since October 2021 at 4.6%. It will be interesting to see how this development impacts the Autumn Statement and whether bold steps are taken to boost the UK economy. This political event could impact sentiment towards the UK economy and the British pound, influencing the UK100_m as a result.

Note: The UK100_m has an inverse relationship with the British pound. When the pound appreciates, it translates to lower revenues for FTSE100 companies that acquire revenues from overseas, pulling the index lower as a result. The same is true vice versa. 

  • The UK100_m may trade lower if the Autumn budget boosts optimism over the UK economy and strengthens the pound as a result.
  • Should the Autumn budget disappoint and weaken sterling, this could push the UK100_m higher.
  1. Key UK economic data 

A day after the Autumn Statement, the focus shifts back to economic data with the Gfk consumer confidence and PMIs in focus. Sentiment remains shaky despite the good news from the UK over the past two weeks. Should the Gfk consumer sentiment confidence and manufacturing along with other PMIs paint a gloomy picture, this could hit confidence and fortify expectations around the BoE being done with rate hikes with the next move a cut.

As of writing, traders are currently pricing in a 55% probability of a 25-basis-point rate cut by May 2024.

  • The UK100_m could receive a boost if disappointing UK data weakens the pound and boosts bets around a BoE rate cut.
  • If UK data beats forecasts and the pound strengthens as a result, the UK100_m may trade lower.
  1. Technical forces 

The UK100_m remains in a wide range on the daily charts with prices flirting around the key 7500 level as of writing. 

  • Another daily close beyond the 7500 point could open a path toward the 200-day SMA at 7605 and major resistance at 7730.
  • Should prices remain capped below 7500, this could trigger a decline towards the 7370 and major support at 7240.


Forex-Time-LogoArticle by ForexTime

ForexTime Ltd (FXTM) is an award winning international online forex broker regulated by CySEC 185/12 www.forextime.com

COT Stock Market Charts: Speculator Bets led by Russell-Mini & S&P500-Mini

By InvestMacro

Here are the latest charts and statistics for the Commitment of Traders (COT) data published by the Commodities Futures Trading Commission (CFTC).

The latest COT data is updated through Tuesday November 14th and shows a quick view of how large traders (for-profit speculators and commercial entities) were positioned in the futures markets.

Weekly Speculator Changes led by Russell-Mini & S&P500-Mini

The COT stock markets speculator bets were lower this week as three out of the seven stock markets we cover had higher positioning while the other four markets had lower speculator contracts.

Leading the gains for the stock markets was the Russell-Mini (7,001 contracts) with the S&P500-Mini (588 contracts) and the DowJones-Mini (563 contracts) also having a positive week.

The markets with the declines in speculator bets this week were the Nasdaq-Mini (-15,980 contracts), the VIX (-9,879 contracts), the MSCI EAFE-Mini (-5,972 contracts) and the Nikkei 225 (-29 contracts) also seeing lower bets on the week.


Data Snapshot of Stock Market Traders | Columns Legend
Nov-14-2023
OI
OI-Index
Spec-Net
Spec-Index
Com-Net
COM-Index
Smalls-Net
Smalls-Index
S&P500-Mini2,192,89920-52,8335711,0574141,77654
VIX415,12480-42,9288146,62718-3,69978
Nasdaq-Mini273,7875831539-2,032421,71777
DowJones-Mini101,03065-36,513141,79699-5,28318
Nikkei 225 Yen66,7366715,047816,44529-21,49238
Nikkei 22516,21037-2,587481,8904769737


Strength Scores led by VIX & S&P500-Mini

COT Strength Scores (a normalized measure of Speculator positions over a 3-Year range, from 0 to 100 where above 80 is Extreme-Bullish and below 20 is Extreme-Bearish) showed that the VIX (81 percent) and the S&P500-Mini (57 percent) lead the stock markets this week. The Nikkei 225 (48 percent) comes in as the next highest in the weekly strength scores.

On the downside, the MSCI EAFE-Mini (0 percent) and the DowJones-Mini (1 percent) come in at the lowest strength level currently and are in Extreme-Bearish territory (below 20 percent).

Strength Statistics:
VIX (80.6 percent) vs VIX previous week (87.2 percent)
S&P500-Mini (56.9 percent) vs S&P500-Mini previous week (56.8 percent)
DowJones-Mini (1.2 percent) vs DowJones-Mini previous week (0.0 percent)
Nasdaq-Mini (39.4 percent) vs Nasdaq-Mini previous week (64.0 percent)
Russell2000-Mini (32.6 percent) vs Russell2000-Mini previous week (28.4 percent)
Nikkei USD (48.2 percent) vs Nikkei USD previous week (48.4 percent)
EAFE-Mini (0.0 percent) vs EAFE-Mini previous week (5.5 percent)


S&P500-Mini tops the 6-Week Strength Trends

COT Strength Score Trends (or move index, calculates the 6-week changes in strength scores) showed that the S&P500-Mini (3 percent) leads the past six weeks trends for the stock markets.

The MSCI EAFE-Mini (-41 percent) leads the downside trend scores currently with the Nikkei 225 (-18 percent) coming in as the next market with lower trend scores.

Strength Trend Statistics:
VIX (-5.9 percent) vs VIX previous week (13.3 percent)
S&P500-Mini (3.0 percent) vs S&P500-Mini previous week (5.3 percent)
DowJones-Mini (-8.8 percent) vs DowJones-Mini previous week (-33.4 percent)
Nasdaq-Mini (-1.7 percent) vs Nasdaq-Mini previous week (23.8 percent)
Russell2000-Mini (-1.4 percent) vs Russell2000-Mini previous week (-6.6 percent)
Nikkei USD (-18.0 percent) vs Nikkei USD previous week (-13.8 percent)
EAFE-Mini (-41.3 percent) vs EAFE-Mini previous week (-30.0 percent)


Individual Stock Market Charts:

VIX Volatility Futures:

VIX Volatility Futures COT ChartThe VIX Volatility large speculator standing this week recorded a net position of -42,928 contracts in the data reported through Tuesday. This was a weekly decline of -9,879 contracts from the previous week which had a total of -33,049 net contracts.

This week’s current strength score (the trader positioning range over the past three years, measured from 0 to 100) shows the speculators are currently Bullish-Extreme with a score of 80.6 percent. The commercials are Bearish-Extreme with a score of 18.2 percent and the small traders (not shown in chart) are Bullish with a score of 77.6 percent.

Price Trend-Following Model: Weak Uptrend

Our weekly trend-following model classifies the current market price position as: Weak Uptrend. The current action for the model is considered to be: Hold – Maintain Long Position.

VIX Volatility Futures StatisticsSPECULATORSCOMMERCIALSSMALL TRADERS
– Percent of Open Interest Longs:22.750.15.5
– Percent of Open Interest Shorts:33.138.86.4
– Net Position:-42,92846,627-3,699
– Gross Longs:94,375207,84722,934
– Gross Shorts:137,303161,22026,633
– Long to Short Ratio:0.7 to 11.3 to 10.9 to 1
NET POSITION TREND:
– Strength Index Score (3 Year Range Pct):80.618.277.6
– Strength Index Reading (3 Year Range):Bullish-ExtremeBearish-ExtremeBullish
NET POSITION MOVEMENT INDEX:
– 6-Week Change in Strength Index:-5.94.013.5


S&P500 Mini Futures:

SP500 Mini Futures COT ChartThe S&P500 Mini large speculator standing this week recorded a net position of -52,833 contracts in the data reported through Tuesday. This was a weekly advance of 588 contracts from the previous week which had a total of -53,421 net contracts.

This week’s current strength score (the trader positioning range over the past three years, measured from 0 to 100) shows the speculators are currently Bullish with a score of 56.9 percent. The commercials are Bearish with a score of 41.4 percent and the small traders (not shown in chart) are Bullish with a score of 53.8 percent.

Price Trend-Following Model: Weak Downtrend

Our weekly trend-following model classifies the current market price position as: Weak Downtrend. The current action for the model is considered to be: Hold – Maintain Short Position.

S&P500 Mini Futures StatisticsSPECULATORSCOMMERCIALSSMALL TRADERS
– Percent of Open Interest Longs:12.572.712.0
– Percent of Open Interest Shorts:14.972.210.1
– Net Position:-52,83311,05741,776
– Gross Longs:274,3481,593,850262,981
– Gross Shorts:327,1811,582,793221,205
– Long to Short Ratio:0.8 to 11.0 to 11.2 to 1
NET POSITION TREND:
– Strength Index Score (3 Year Range Pct):56.941.453.8
– Strength Index Reading (3 Year Range):BullishBearishBullish
NET POSITION MOVEMENT INDEX:
– 6-Week Change in Strength Index:3.0-4.85.8


Dow Jones Mini Futures:

Dow Jones Mini Futures COT ChartThe Dow Jones Mini large speculator standing this week recorded a net position of -36,513 contracts in the data reported through Tuesday. This was a weekly advance of 563 contracts from the previous week which had a total of -37,076 net contracts.

This week’s current strength score (the trader positioning range over the past three years, measured from 0 to 100) shows the speculators are currently Bearish-Extreme with a score of 1.2 percent. The commercials are Bullish-Extreme with a score of 98.7 percent and the small traders (not shown in chart) are Bearish-Extreme with a score of 18.1 percent.

Price Trend-Following Model: Weak Downtrend

Our weekly trend-following model classifies the current market price position as: Weak Downtrend. The current action for the model is considered to be: Hold – Maintain Short Position.

Dow Jones Mini Futures StatisticsSPECULATORSCOMMERCIALSSMALL TRADERS
– Percent of Open Interest Longs:20.766.710.7
– Percent of Open Interest Shorts:56.825.315.9
– Net Position:-36,51341,796-5,283
– Gross Longs:20,91467,38110,795
– Gross Shorts:57,42725,58516,078
– Long to Short Ratio:0.4 to 12.6 to 10.7 to 1
NET POSITION TREND:
– Strength Index Score (3 Year Range Pct):1.298.718.1
– Strength Index Reading (3 Year Range):Bearish-ExtremeBullish-ExtremeBearish-Extreme
NET POSITION MOVEMENT INDEX:
– 6-Week Change in Strength Index:-8.820.7-39.9


Nasdaq Mini Futures:

Nasdaq Mini Futures COT ChartThe Nasdaq Mini large speculator standing this week recorded a net position of 315 contracts in the data reported through Tuesday. This was a weekly reduction of -15,980 contracts from the previous week which had a total of 16,295 net contracts.

This week’s current strength score (the trader positioning range over the past three years, measured from 0 to 100) shows the speculators are currently Bearish with a score of 39.4 percent. The commercials are Bearish with a score of 42.1 percent and the small traders (not shown in chart) are Bullish with a score of 76.6 percent.

Price Trend-Following Model: Weak Downtrend

Our weekly trend-following model classifies the current market price position as: Weak Downtrend. The current action for the model is considered to be: Hold – Maintain Short Position.

Nasdaq Mini Futures StatisticsSPECULATORSCOMMERCIALSSMALL TRADERS
– Percent of Open Interest Longs:25.457.714.5
– Percent of Open Interest Shorts:25.358.513.8
– Net Position:315-2,0321,717
– Gross Longs:69,502158,03939,612
– Gross Shorts:69,187160,07137,895
– Long to Short Ratio:1.0 to 11.0 to 11.0 to 1
NET POSITION TREND:
– Strength Index Score (3 Year Range Pct):39.442.176.6
– Strength Index Reading (3 Year Range):BearishBearishBullish
NET POSITION MOVEMENT INDEX:
– 6-Week Change in Strength Index:-1.7-4.712.1


Russell 2000 Mini Futures:

Russell 2000 Mini Futures COT ChartThe Russell 2000 Mini large speculator standing this week recorded a net position of -65,566 contracts in the data reported through Tuesday. This was a weekly lift of 7,001 contracts from the previous week which had a total of -72,567 net contracts.

This week’s current strength score (the trader positioning range over the past three years, measured from 0 to 100) shows the speculators are currently Bearish with a score of 32.6 percent. The commercials are Bullish with a score of 69.1 percent and the small traders (not shown in chart) are Bearish-Extreme with a score of 16.5 percent.

Price Trend-Following Model: Downtrend

Our weekly trend-following model classifies the current market price position as: Downtrend. The current action for the model is considered to be: Hold – Maintain Short Position.

Russell 2000 Mini Futures StatisticsSPECULATORSCOMMERCIALSSMALL TRADERS
– Percent of Open Interest Longs:14.180.74.1
– Percent of Open Interest Shorts:25.968.24.7
– Net Position:-65,56668,821-3,255
– Gross Longs:77,725445,80422,861
– Gross Shorts:143,291376,98326,116
– Long to Short Ratio:0.5 to 11.2 to 10.9 to 1
NET POSITION TREND:
– Strength Index Score (3 Year Range Pct):32.669.116.5
– Strength Index Reading (3 Year Range):BearishBullishBearish-Extreme
NET POSITION MOVEMENT INDEX:
– 6-Week Change in Strength Index:-1.43.6-12.8


Nikkei Stock Average (USD) Futures:

Nikkei Stock Average (USD) Futures COT ChartThe Nikkei Stock Average (USD) large speculator standing this week recorded a net position of -2,587 contracts in the data reported through Tuesday. This was a weekly decrease of -29 contracts from the previous week which had a total of -2,558 net contracts.

This week’s current strength score (the trader positioning range over the past three years, measured from 0 to 100) shows the speculators are currently Bearish with a score of 48.2 percent. The commercials are Bearish with a score of 47.4 percent and the small traders (not shown in chart) are Bearish with a score of 37.1 percent.

Price Trend-Following Model: Weak Downtrend

Our weekly trend-following model classifies the current market price position as: Weak Downtrend. The current action for the model is considered to be: Hold – Maintain Short Position.

Nikkei Stock Average Futures StatisticsSPECULATORSCOMMERCIALSSMALL TRADERS
– Percent of Open Interest Longs:7.968.922.9
– Percent of Open Interest Shorts:23.957.218.6
– Net Position:-2,5871,890697
– Gross Longs:1,28711,1623,716
– Gross Shorts:3,8749,2723,019
– Long to Short Ratio:0.3 to 11.2 to 11.2 to 1
NET POSITION TREND:
– Strength Index Score (3 Year Range Pct):48.247.437.1
– Strength Index Reading (3 Year Range):BearishBearishBearish
NET POSITION MOVEMENT INDEX:
– 6-Week Change in Strength Index:-18.017.9-5.1


MSCI EAFE Mini Futures:

MSCI EAFE Mini Futures COT ChartThe MSCI EAFE Mini large speculator standing this week recorded a net position of -64,174 contracts in the data reported through Tuesday. This was a weekly reduction of -5,972 contracts from the previous week which had a total of -58,202 net contracts.

This week’s current strength score (the trader positioning range over the past three years, measured from 0 to 100) shows the speculators are currently Bearish-Extreme with a score of 0.0 percent. The commercials are Bullish-Extreme with a score of 100.0 percent and the small traders (not shown in chart) are Bearish with a score of 30.8 percent.

Price Trend-Following Model: Weak Downtrend

Our weekly trend-following model classifies the current market price position as: Weak Downtrend. The current action for the model is considered to be: Hold – Maintain Short Position.

MSCI EAFE Mini Futures StatisticsSPECULATORSCOMMERCIALSSMALL TRADERS
– Percent of Open Interest Longs:4.991.92.5
– Percent of Open Interest Shorts:21.176.31.8
– Net Position:-64,17461,4122,762
– Gross Longs:19,177362,5759,791
– Gross Shorts:83,351301,1637,029
– Long to Short Ratio:0.2 to 11.2 to 11.4 to 1
NET POSITION TREND:
– Strength Index Score (3 Year Range Pct):0.0100.030.8
– Strength Index Reading (3 Year Range):Bearish-ExtremeBullish-ExtremeBearish
NET POSITION MOVEMENT INDEX:
– 6-Week Change in Strength Index:-41.341.8-3.9


Article By InvestMacroReceive our weekly COT Newsletter

*COT Report: The COT data, released weekly to the public each Friday, is updated through the most recent Tuesday (data is 3 days old) and shows a quick view of how large speculators or non-commercials (for-profit traders) were positioned in the futures markets.

The CFTC categorizes trader positions according to commercial hedgers (traders who use futures contracts for hedging as part of the business), non-commercials (large traders who speculate to realize trading profits) and nonreportable traders (usually small traders/speculators) as well as their open interest (contracts open in the market at time of reporting). See CFTC criteria here.

Massachusetts Biotech Advances Novel Cytokine Therapies

Source: Dr. Robert Driscoll  (11/15/23)

Wedbush sees over 300% upside for Werewolf stock based on early clinical success for its PREDATOR platform and pipeline, according to a WedBush research note.

Cambridge, Massachusetts-based Werewolf Therapeutics Inc. (HOWL:NASDAQ) reported Q3 2023 results and progress for its pipeline of INDUKINE product candidates, noted Wedbush analyst Dr. Robert Driscoll in a November 15 research report.

The analysts have an Outperform rating and US$9 price target on Werewolf Therapeutics.

Early Efficacy Signals Seen for Lead Candidate

According to the analysts, Werewolf’s WTX-124 INDUKINE therapy has shown initial proof-of-concept with a differentiated safety profile compared to standard high-dose IL-2 and evidence of antitumor activity in early studies.

At the 12 mg dose, WTX-124 yielded a partial response in a melanoma patient and disease control in lung cancer patients. The company is now testing an 18 mg dose cohort.

The analysts believe this data validates Werewolf’s novel INDUKINE approach to conditionally activating cytokines within tumors while limiting systemic toxicity.

Advancing Broad Pipeline

Beyond WTX-124, Werewolf is evaluating the second INDUKINE candidate, WTX-330, in dose escalation and plans to share preclinical data on WTX-518 in 2024.

The company is also progressing IL-21 INDUKINE WTX-712 towards the clinic based on encouraging preclinical results.

Significant Upside from Current Levels

Wedbush maintains an Outperform rating on Werewolf Therapeutics and a US$9 price target, seeing over 300% upside for the shares.

The firm’s valuation is based on projected 2031 sales for WTX-124 applied to standard revenue multiples.

In summary, the analysts see Werewolf’s INDUKINE platform and early WTX-124 efficacy as validating the company’s novel approach to cytokine therapies in oncology. With multiple clinical catalysts upcoming, they view the risk/reward as favorable.


Important Disclosures:

  1. The article does not constitute investment advice. Each reader is encouraged to consult with his or her individual financial professional and any action a reader takes as a result of information presented here is his or her own responsibility. By opening this page, each reader accepts and agrees to Streetwise Reports’ terms of use and full legal disclaimer. This article is not a solicitation for investment. Streetwise Reports does not render general or specific investment advice and the information on Streetwise Reports should not be considered a recommendation to buy or sell any security. Streetwise Reports does not endorse or recommend the business, products, services or securities of any company mentioned on Streetwise Reports.
  2. This article does not constitute medical advice. Officers, employees and contributors to Streetwise Reports are not licensed medical professionals. Readers should always contact their healthcare professionals for medical advice.

For additional disclosures, please click here.

Disclosures for Wedbush, Werewolf Therapeutics, November 15, 2023


Analyst Certification We, Robert Driscoll, Ritika Das and Sam Ravina, certify that the views expressed in this report accurately reflect our personal opinions and that we have not and will not, directly or indirectly, receive compensation or other payments in connection with our specific recommendations or views contained in this report.

Company Specific Disclosures This information is subject to change at any time. 1. WS makes a market in the securities of Werewolf Therapeutics.

OTHER DISCLOSURES The information herein is based on sources that we consider reliable, but its accuracy is not guaranteed. The information contained herein is not a representation by this corporation, nor is any recommendation made herein based on any privileged information. This information is not intended to be nor should it be relied upon as a complete record or analysis: neither is it an offer nor a solicitation of an offer to sell or buy any security mentioned herein. This firm, Wedbush Securities, its officers, employees, and members of their families, or any one or more of them, and its discretionary and advisory accounts, may have a position in any security discussed herein or in related securities and may make, from time to time, purchases or sales thereof in the open market or otherwise. The information and expressions of opinion contained herein are subject to change without further notice. The herein mentioned securities may be sold to or bought from customers on a principal basis by this firm. Additional information with respect to the information contained herein may be obtained upon request. Wedbush Securities does and seeks to do business with companies covered in its research reports. Thus, investors should be aware that the firm may have a conflict of interest that could affect the objectivity of this report. Investors should consider this report as only a single factor in making their investment decision. Please see pages 3–7 of this report for analyst certification and important disclosure information. Retail Investors The information provided is for general informational purposes only and should not be considered an individual recommendation or personalized investment advice. The companies/investments mentioned may not be suitable for everyone. Each investor needs to review their own respective situation(s) before making any investment decisions. All expressions of opinion are subject to change without notice due to shifting market(s), economic or political conditions. Investment involves risks including the risk of principal. Past performance is no guarantee of future results and the opinions presented cannot be viewed as an indicator of future performance.

SPX500_m bulls eye key resistance level

By ForexTime 

  • SPX500_m up 2% so far this week
  • Incoming US data and Fed speeches could trigger volatility
  • Prices firmly bullish on D1 timeframe but RSI overbought ​​​​​​​
  • Key resistance level found at 4525 ​​​​​​​
  • Possible breakout on horizon

The SPX500_m has gained 2% so far this week thanks to growing investor optimism around the era of Fed hikes coming to an end.

The cooler-than-expected US CPI data on Tuesday boosted bets over the Fed done with raising rates. Yesterday’s soft PPI and retail sales report reinforced these expectations with traders currently pricing in a 25 basis-point rate cut by June 2024. 

We could see some more action on the SPX500_m today due to US economic data, speeches by Fed officials, and quarterly earnings from Walmart released before US markets open.

Taking a look at the technical picture, the SPX500_m could be in the process of another breakout or technical throwback. Prices have created a minor range on the H4 charts with the big resistance at 4525 and minor support at 4490.

Looking at the daily timeframe, bulls have been on a roll over the past few days with the SPX500_m rallying over 7% since the start of November. However, bulls are currently eyeing a significant resistance level at 4525.

Note: the last time prices secured a daily close above this point was at the start of August 2023.

There is a similar theme on the weekly charts with the powerful rebound at the start of November providing a foundation for bulls to test new highs. Beyond 4525, the next resistance can be found at 4600 – near the 2023 high.

Zooming out to the monthly, bulls seem to be regaining momentum with a solid monthly close back above 4600 opening the doors to the all-time high created at the start of 2022.

Placing our focus back on the daily timeframe, it’s all about the 4525 level.

Prices are trading well above the 50, 100, and 200-day SMA however the Relative Strength Index (RSI) signals that prices are overbought.

  • A strong daily close above 4525 could trigger a move towards 4600.

  • Should prices remain trapped below 4525, prices may decline back towards 4470 and 4410 – where the 100-day SMA resides.


Forex-Time-LogoArticle by ForexTime

ForexTime Ltd (FXTM) is an award winning international online forex broker regulated by CySEC 185/12 www.forextime.com

Mournful Bears

Source: Michael Ballanger  (11/13/23)

Michael Ballanger of GGM Advisory Inc. shares his thoughts on the current state of the market. 

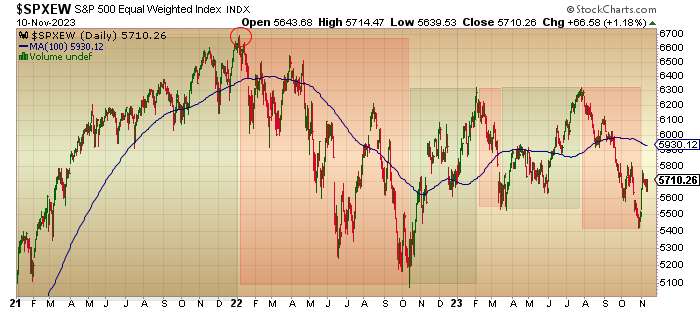
As we head into the home stretch for calendar year 2023, it is no secret that the vast majority of stocks have been in a downtrend since January 2022. While the S&P 500 is calculated using an inordinate weighting in seven mega-cap stocks, the Unweighted S&P 500 (shown below) has been thrashing about for the better part of two years, leaving the majority of traders and investors feeling like they have been left behind.

No New Highs

Because stocks have not seen a new high in 22 months, an entire generation is in a complete quandary these days, completely unfamiliar with how to navigate a market that no longer has the support of the Federal Reserve. No more quantitative easing, no more zero interest rate policy, and no more Plunge Protection Team, all serving to deliver up juicy stock market profits resulting in handsome performance bonuses with amazing regularity every single year since March 2009. Not even a global pandemic and economic shutdown could derail the bull or the expansion, thanks to copious helicopter cash drops and banking system life jackets.

Despite a shockingly obvious attempt in 2023 by the Wall Street spin doctors to create a new “flaveur de jour” called “Artificial Intelligence,” the new narrative designed to lure the masses back into the excitement of stock market participation was successful in creating a brand new breed of worthless companies all claiming to be leaders in the field of “AI,” but it all ended in July and after a painful September and terrorist-ravaged October, these poor stock trading children are once again plunged back into the reality of what we old folks had to deal with before Hank Paulson and Ben Bernanke bailed out a gaggle of criminally-responsible banks and taught new “kiddie fleet” how to “live long and plunder” without having to read a balance sheet or income statement.

I have been astounded all through September and October how legion after legion of Millennials and Genexers that came into the world of stocks and bonds after the 2008 GFC have gone from the “Buy the Effing Dip” mentality to “Sell the Effing Rip” mentality while fully convinced that the “new normal” of a hostile Fed was going to bring on the Crash of ’23.

The S&P 500 is now a full 312 points off those October lows, and this new generation of doom-and-gloom bears is still working off the “hard landing” platform that calls for new lows that will take out the October 2022 nadir and suck the life out of the “everything bubble” once and for all.

Now, we are nine days into November, and they are exhibiting behavior that is completely typical of the early stages of a new bull market. They are mere shadows of the brash, confident, take-on-the-world “super-traders” that took GME from $0.70 to $120 in 2021. They are beaten, battered, self-professed victims of an unfair world where their “divine right” of stock market riches was ripped away from them by the evil Boomers that rule the world.

Unfortunately, they are also displaying behaviors quite normal after extended periods of stagnant or declining prices; they are infected with a recency bias that has imprisoned them in a blind fog of delusion. Whereas the phrase “The Fed has our backs” emboldened a cherubic group of fuzzy-face day-traders after 2009, the phrase “higher for longer” denotes the level of pain these kids are being forced to endure in the new normal of laisser-faire investing.

The S&P 500 is now a full 312 points off those October lows, and this new generation of doom-and-gloom bears is still working off the “hard landing” platform that calls for new lows that will take out the October 2022 nadir and suck the life out of the “everything bubble” once and for all.

Finally, if I am forced to watch one more Instagram video of a 20-something girl in designer clothes and a Coach bag daubing her eyes and sniffling into the camera because after paying her bills every month, “I have nothing left for a life — no clubs, no holidays in Cancun, no health club — NOTHING!”, I am going to fire my old ten-pound eight-ball pencil sharpener through the monitor. Every generation since Omar the Club Wielder picked up chicks by thumping them over the head has had to make sacrifices at one time or another. Get used to it.

Stocks

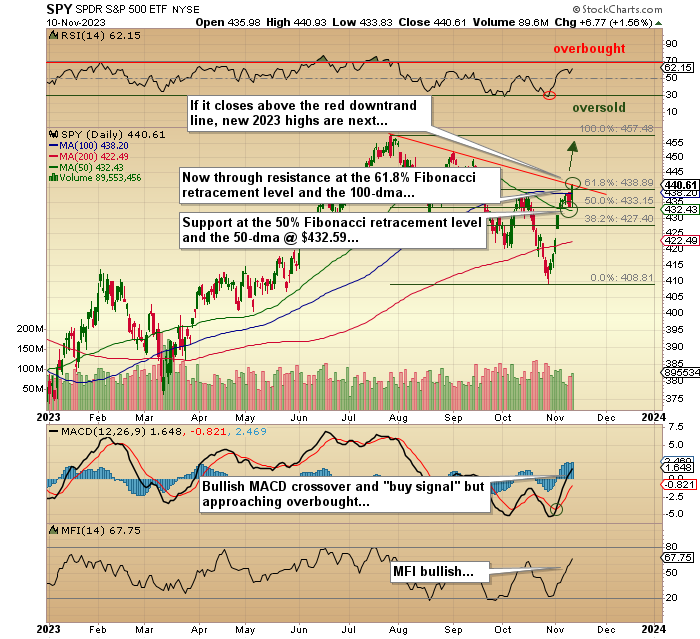
With the exception of a minor Powell-inflicted setback on Thursday, the SPDR S&P 500 ETF (SPY:NYSE) went out at $440.19, which is the highest since the October 17 close at $438.14 and is now threatening to test the September high at $449.49.

With the relative strength index (“RSI”) at 62.15, there is still more room, especially if it clears the downtrend line drawn off the July-September tops.

I am long in two equal tranches of calls, with the SPY Dec $ 445 costing $7.75 (bought pre-Israel-Hamas) and the Dec $425 calls costing $6.89 (bought end-of-month). They closed out the week at $5.41 and $20.15, respectively, and thus have turned a public flogging with cat-o-nine-tails into a six-band parade in a mere nine days.

As I have been chirping about since September, when the sky was falling all around us, the probability of a face-ripping year-end rally was high, and despite the events in the Middle East, performance-chasing portfolio managers had to buy stocks. And buying them, they are certainly doing with the panic phase not yet even begun. Add to that the massive short position in the long end of the bond market (specifically the iShares 20+ Year Treasury Bond ETF (TLT:US)), and you have a wonderful concoction of short-squeeze ingredients all simmering beautifully on the stock market stove.

While there are still possible speed bumps in the road ahead, I think those visions of bonus-driven sugar plums dancing in the heads of thousands of underweight and underperforming portfolio managers will drive stocks higher right up until the bonus cheques hit their bank accounts in early January. Then watch how fast the bullish narrative switches back to “hard landing” economics and “lag effect” lacerations halting the rally.

Gold and Silver

If I had to make a bet, the year 2023 is going to be considered the year that even the staunchest of bulls throw in the towel and pronounce gold to be “a barbarous relic.”

I can see from my Twitter feed that the youngsters are all feeling physically invaded by the abysmal performance of silver, which is certainly the most heavily promoted of all the metals. I would argue that copper has been just as dismal as silver, but just not on as many radar screens. You will never find the 500 tweets a day calling for a crash in the U.S. dollar that will take copper “to da moon” (followed by ten exclamation marks) like there was last August when the BRICS conference was being trotted out as the “seminal event” that would eliminate the U.S. dollar’s reserve currency status and take gold and silver to atmospheric levels.

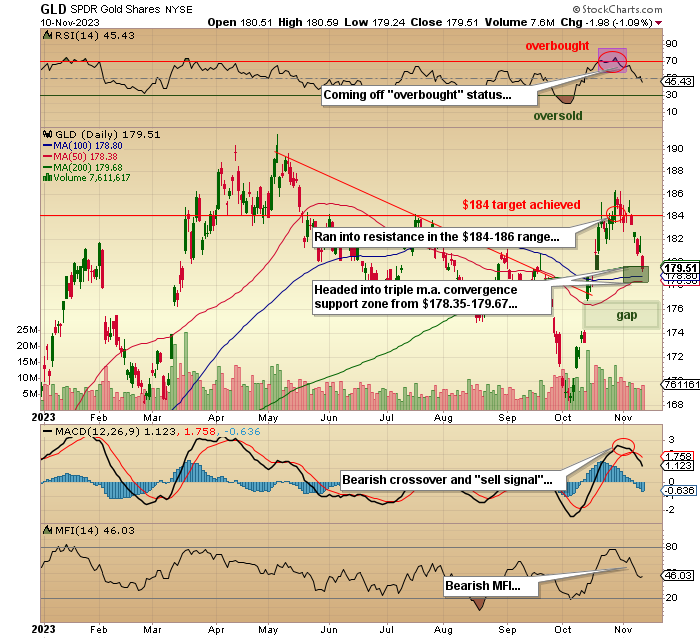
I am on the record as having dumped my SPDR Gold Shares ETF (GLD:NYSE) trading positions above $184 as spot gold cranked out to $2,019 into the geopolitical maelstrom of early October, but all that represented was a trading decision and in no way altered my expectations for new highs, albeit the actions of the bullion banks late last month completely neutralized my call for “new all-time highs by New Year’s Day.”

They provided over 70,000 contracts representing over 7 million ounces of phony, notional gold, and under the weight of such oppressive supply, those “gold to da moon!” buyers were once again pistol-whipped into submission with the GLD:NYSE going out under $180 and spot gold below $1,940.

What people should recognize is that gold (and to a lesser degree silver) are considered “Enemies of the State,” and despite the U.S. being the (alleged) holder of 8,133 metric tonnes of the yellow metal, their two primary foes — Russia and China — are stockpiling it in record quantities and are soon quite likely to surpass the U.S. as the holders of the largest cache of real money on the planet. That allows for two speculative possibilities: the first is that the U.S. has already sold all of its gold and is actually short 286 million ounces and needs to keep a lid on prices until they figure out how to extricate itself from yet “another fine mess.”

The level on the GLD:NYSE (now $179.51) at which to start warming up the “BUY” button is where the 50-dma, the 100-dma, and the 200-dma are starting to converge, which is between $178.38 and $179.68.

The second speculative possibility is that the rocket scientists at the Pentagon and at Langley have decided to hit Russia and China where it hurts the most —  in their pocketbooks.

The easiest way to do that is to use the Crimex (futures exchange known as “the paper markets”) to massage the U.S. dollar-denominated gold price downward, which in turn should theoretically move the Russian ruble and Chinese yuan higher, thus making trade with those two dastardly enemies more expensive for everyone around the world settling major transaction in dollars. Such manipulation would discourage depositors from emptying bank accounts in favor of gold and silver held outside of the banking system, and as we all know, monetary and fiscal policy has only one intention — to protect and promote the banks.

This could be nothing more than rank speculation and tinfoil hat conspiracy theorizing, but it is the reason that the scar tissue on my back arms and face has forced me to trade gold and silver rather than marry them. It just seems to make sense to me that if an entity that NEVER gets a margin call is shorting the $%$% out of gold, I had better stand aside. That is what the COT was telling us back in late October, and those who listened and are now hiding in the weeds, as am I, have cash in hand awaiting a chance to pounce at the point where the bullion bank behemoths have fallen back to sleep after gorging on a $560 million meal.

The level on the GLD:NYSE (now $179.51) at which to start warming up the “BUY” button is where the 50-dma, the 100-dma, and the 200-dma are starting to converge, which is between $178.38 and $179.68. Mind you, when I went long the GLD:NYSE back on October 4 with a price under $170.00, RSI had plunged to a massively oversold low of 20.16.

It went out at 45.43 on the week, which is not nearly as compelling as it was in early October. I might have to wait to see that big gap at $174-176 created by the events in the Middle East filled in before I take a stab, and the way to do that is to wait for a two-day-close above the $178.35-$179.68 convergence zone. If it fails, then I know the gap is in the crosshairs.

In spot gold terms, the gap is in the $1,890-1,910 zone, and if that also fails, the early October lows are to be expected, and that would not be good.

Juniors

The junior miners are going to have a particularly challenging tax-loss season as investors harvest capital losses and apply them against past gains or bank them in anticipation of future gains, but what it spells is selling pressure. There are those who think that the poor performance of the TSX Venture Exchange will result in fewer gains against which to apply losses, but within the TSXV, there are pockets of strength (like lithium earlier in the year) where enormous gains were realized. If I am holding shares in a junior silver deal, I am likely to book a loss and switch it to a junior gold and around the same price so that I have a protected window of tax-free capital gains going into 2024.

The exploration stocks have always thrived or struggled “on the margin” of either bullish or bearish sentiment for the metals. When the senior and intermediate gold and silver miners and developers catch a cold, the explorers catch pneumonia. The developers, however, are where one finds the greatest bargains because as they get kneecapped along with other junior resource stocks, their value per ounce or value per pound of whatever proven resource they hold gets taken down despite the outlook for that resource.

Getchell Gold Corp. (GTCH:CSE; GGLDF:OTCQB) is just such a developer whose 2,059,900 ounces of proven-and-probable gold ounces are being assigned a value per ounce of under $5.00. Admittedly, all junior gold developers are being assigned value per ounce numbers considered either impossible or highly unlikely prior to this recent downdraft, but I recall 500,000-ounce deposits being acquired for over $200 per ounce in Nevada back in the 2002-2011 boom.

I am sure that the junior gold developer space is littered with stories like Getchell which is typical of resource sector bear markets where “Undervalued gold deals” are like noses; everybody has one. (That phrase became popular in the smoky boardrooms of investment banking houses back in the 1980s and I must confess that in the interest of decency, I used the word “noses” in place of another anatomical appendage common to all humanity.)

There was a time when I was a younger, angry man that I refused to buy stocks unless they were in the resource category. They had to have a product that the world needed, and while they were volatile, it was infinitely more honorable to own a hard asset than some “story stock” where the CEO is a paid actor and reads off a script sheet every time a question is asked while signing stock buyback orders designed by activist fund managers just as a boatload of options vest.

Everyone over the age of 50 remembers the darling of the dotcom era, former GE Chairman and CEO Jack Welch, who ran the NYSE darling from 1981 to 2001, exiting with a record $487 million severance package. Back in the heyday of the technology boom pre-2001, Welch was a regular on CNBC, where hosts doted and fawned over him like a 60’s rock star.

You see, in the world of trading and investing and in the philosophy of free market capitalism, the only judge, jury, and executioner is one’s Statement of Profit and Loss, and if it says “profit,” you are headed to the clouds with a harp and white toga and if it says “loss,” you get out the asbestos footwear really quick.

He would lecture people on integrity and leadership, and American values and became the poster child for American exceptionalism. Then, when the dotcom bubble popped, and the rose-colored glasses were ground into tiny grains of sand, the world eventually discovered that, as Warren Buffett famously said about bear markets: “who was without swimming trunks when the tide went out.”

GE crashed and burned in the 2000s, and since the peak in 2001 at $198/share, GE has not exceeded the Welch-era highs in twenty years. Most importantly, the Welch legacy of exaltation has since been replaced with a reputation for underhanded financial reporting, risky deals, improper treatment of staff, and general corporate malfeasance of the highest order. Like Sam Bankman-Fried, the CNBC crowd reveres and worships these Oscar-winning corporate impersonators until they blow up, after which the spin involves simply never mentioning them again except in a cold, calculating, impersonal manner.

There are hundreds of Welches and SBF’s out there, all well-rehearsed in the art of subterfuge and shell-gaming. Like the magician that wants you to focus on the waving pink handkerchief, the MSM wants us all to focus on the narrative rather than the reality, which is precisely why I have learned that whether you own stocks or bonds or gold, there is no morality or immorality inherent in such ownership. This entire liberal-left notion of “ESG” being a prerequisite for responsible corporate behavior is a load of horsefeathers.

As I move into the twilight of senior citizenship, I have found immense joy in seeing through the thin veils of a bullish narrative or the odious linen of a bearish narrative, choosing instead to “rent” a position in either the SPY’s or the GLD’s or the QQQ’s without the tepid assumption of either guilt or innocence. You see, in the world of trading and investing and in the philosophy of free market capitalism, the only judge, jury, and executioner is one’s Statement of Profit and Loss, and if it says “profit,” you are headed to the clouds with a harp and white toga and if it says “loss,” you get out the asbestos footwear really quick.

Such are the rules of the back alley trader and pool-room preacher.


Important Disclosures:

  1. As of the date of this article, officers and/or employees of Streetwise Reports LLC (including members of their household) own securities of Getchell Gold Corp.
  2. Michael Ballanger I, or members of my immediate household or family, own securities of: Getchell Gold Corp. My company has a financial relationship with: Getchell Gold Corp. I determined which companies would be included in this article based on my research and understanding of the sector.
  3. Statements and opinions expressed are the opinions of the author and not of Streetwise Reports or its officers. The author is wholly responsible for the validity of the statements. The author was not paid by Streetwise Reports for this article. Streetwise Reports was not paid by the author to publish or syndicate this article. Streetwise Reports requires contributing authors to disclose any shareholdings in, or economic relationships with, companies that they write about. Streetwise Reports relies upon the authors to accurately provide this information and Streetwise Reports has no means of verifying its accuracy.
  4.  This article does not constitute investment advice. Each reader is encouraged to consult with his or her individual financial professional. By opening this page, each reader accepts and agrees to Streetwise Reports’ terms of use and full legal disclaimer. This article is not a solicitation for investment. Streetwise Reports does not render general or specific investment advice and the information on Streetwise Reports should not be considered a recommendation to buy or sell any security. Streetwise Reports does not endorse or recommend the business, products, services or securities of any company.

For additional disclosures, please click here.

Michael Ballanger Disclosures

This letter makes no guarantee or warranty on the accuracy or completeness of the data provided. Nothing contained herein is intended or shall be deemed to be investment advice, implied or otherwise. This letter represents my views and replicates trades that I am making but nothing more than that. Always consult your registered advisor to assist you with your investments. I accept no liability for any loss arising from the use of the data contained on this letter. Options and junior mining stocks contain a high level of risk that may result in the loss of part or all invested capital and therefore are suitable for experienced and professional investors and traders only. One should be familiar with the risks involved in junior mining and options trading and we recommend consulting a financial adviser if you feel you do not understand the risks involved.

NQ100_m: US CPI may spark 4000-point move

By ForexTime 

  • Tech-heavy index hovers around 15,530 ahead of pivotal US data
  • Stock bulls are hoping for new 2023 high on slowing inflation
  • Key moving averages may offer support on higher-than-expected CPI

The NQ100_m is holding around 15,500 awaiting the release of the latest US inflation data.

This tech-heavy index has “stalled” at the significant price level of 15530, after a 4000-point move in the index on Friday, November 10th.

The 15530 level has served as a key resistance in the past with recent tests in late August and mid-September failing to breach this level.

Today’s Consumer Price Inflation data (C.P.I) may inject some volatility into the markets

NOTE: CPI measures changes in the prices of goods and services purchased by consumers.


Today’s October CPI data out of the US is expected to show:

  • Headline CPI month-on-month (October 2023 vs. September 2023): 0.1%
    (lower than September’s 0.4% month-on-month CPI)
  • Headline CPI year-on-year (October 2023 vs. October 2022): 3.3%
    (lower than September’s 3.7% month-on-month CPI)
  • Core CPI month-on-month: 0.3%
    (matching September’s 0.3% month-on-month core CPI)
  • Core CPI year-on-year: 4.1%
    (matching September’s 4.1% year-on-year core CPI)


If US inflation surprises to the upside, this raises the probability of more Fed rate hikes.

With the tech index averse to US rate hikes, this could trigger a decline in NQ100_m to test support around:

  • 15300: a psychologically-important round number
  • 15135.4: former resistance of a downward sloping channel, which could act as support; the 100-day simple moving average (SMA) also resides close by
  • 50-day simple moving average

If November’s CPI data comes out lower-than expected, this should encourage NQ100_m bulls to charge on.

On the way upwards, they will have to contend with the following potential resistance levels as they aim for new highs:

  • 15768.8: the 161.8 golden fibonacci level
    (The Fibonacci level is drawn from August 14, 2022, high to October 9 2022 low on the weekly time frame)
  • 15947.7: the highest year-to-day price reached on August 19th.


In addition, the Average Directional Movement Indicator, (an indicator that shows trend strength) is above the 20-point mid-level, suggesting that the current rally in the NQ100_m is still strong.

This is further confirmed with the Relative Strength Index (RSI) staying above its mid-point level at 50.


Forex-Time-LogoArticle by ForexTime

ForexTime Ltd (FXTM) is an award winning international online forex broker regulated by CySEC 185/12 www.forextime.com

Newfound War Popularity Driving Disposable Drone Tech Boom

Source: Streetwise Reports  (11/7/23)

As modern conflicts grind on interminably, one thing is becoming remarkably clear: Drones and their rapid replacement with more drones represent a prevailing trend in depersonalizing the future of the warfighting experience.

After well over a year of ongoing conflict in Ukraine, a second major front of unleashed global conflict erupted in and around the Gaza Strip at the beginning of October. In addition to confirming age-old wisdom about war (e.g., that it is hell), these modern conflicts are teaching us new lessons about the cadence of futuristic battlefield wreck-and-replace rates, as well as the demoralizing effects such heightened operational tempos can exert on forces on both sides of the equation.

Reporting for The Daily Beast, David Axe wrote on October 28, “Look closely at photos of the Israeli army mobilizing for a possible incursion into Gaza. .  You might note strange, cage-like metal roofs welded or bolted onto the tops of Israeli Merkava tanks. Soldiers call this add-on armor a ‘cope cage,’ as it’s designed to cope with a new and devastating weapon: a toy drone.”

The ‘cope cage’ moniker is designed to be derisive and humorous, underscoring the deadly accuracy and brutal shift in power that the wide adoption of small drones by fledgling military forces has occasioned. These cages are notoriously ineffective against current drone tactics, providing little more than a psychological defense for the troops they “protect.”

According to Axe’s article, “A decade after Iraqi, Syrian and Yemeni militant groups first weaponized quadcopter-style drones — strapping explosives to them for one-way ‘kamikaze’ attacks or rigging them to drop grenades — cheap drones are now the standard aerial weapon for both the Russian and Ukrainian armies.”

“Likewise, Hamas deployed drones during its October 7 attack, damaging at least two Merkava tanks by aiming for the weak points in the tanks’ top armor — the same weak points the hastily produced cope cages are meant to protect. Earlier cope cages protected tanks from missiles that were designed to strike the vehicles on their roofs; armies assumed the cages would also work against drones.”

The Catalyst: Expendability

The wide array of simple-to-use drones currently available has led, according to Axe’s reporting, to two basic types of do-it-yourself attack drones. “There are quadcopters or octocopters that drop grenades and are guided by GPS or radio by an operator sitting behind a screen. There are also single-use first-person-view drones loaded up with explosives and steered via radio by an operator peering through a virtual-reality headset.”

This variety of vectors makes drones particularly difficult to harden against, as the threat model remains highly mutable and likely to rapidly evolve as successive attack waves are deployed and then analyzed to improve effectiveness. With no human operators’ lives at risk in any regular drone attack, a rapid operational tempo can be maintained, with losses measured only in dollars, and each loss offers valuable insights that can considerably improve future missions.

“A typical drone might weigh just a couple of pounds and fly no farther than 20 miles at a top speed of less than 30 miles per hour,” Axe explains. “Compared to a supersonic warplane weighing 20 tons and ranging hundreds of miles, a DIY attack drone is flimsy, slow, and short-ranged. But where a fighter jet might cost $50 million, the commonly-used DJI Mavic 3 FPV drone retails for just US$2,000. Military commanders think twice before sending a fighter and its expensively trained pilot into harm’s way. They don’t have to think at all before launching a drone or a whole swarm of drones.”

The numbers seen on the ground reflect this readiness to reiterate the drone strike process on an almost daily basis. According to Samuel Bendett, a senior non-resident associate with the Center for Strategic and International Studies’ Europe, Russia, and Eurasia Program, “We are seeing drone saturation on the battlefield like never before.”

Why This Sector? Combining the Oldest with the Newest

Axe reports that “Ukrainian drone operators tend to coordinate their attacks with artillery — the newest and oldest weapons on the battlefield, working together. The Ukrainians’ artillery fires first, and then the Russians have to take cover because of the artillery. While they’re waiting out the barrage, [the Ukrainian commander] is launching his attack drones for the killing blow. ‘It wins us time,’ [the commander] says of the artillery.”

“As it became clear last year how dangerous small drones could be,” Axe continues, “the Russians and Ukrainians began installing cope cages on their tanks and other armored vehicles; the Israelis scrambled to do the same following their initial tank losses during the Hamas infiltration.”

“Small drones have upended traditional warfare. Before, militaries engaged in a slow technological tit-for-tat. One military would deploy a new weapon, a rival military would develop a countermeasure, and then the first military would modify the original weapon to defeat the countermeasure. So on and so forth, year after year, decade after decade . . . Tiny drones have broken the cycle. They’re so cheap, and thus so easy to deploy in huge numbers, that armies are struggling to develop defenses fast enough to prevent devastating drone campaigns.”

As you might imagine, the past year’s wide international focus on the importance of both drones and drone suppression systems has fostered considerable growth for businesses operating in both those rapidly growing market spaces.

The hard truth is that the demand for anti-drone technology is growing, with a market size projected to reach US$3.8 billion by 2027 from a total of US$1.47 billion in 2023.

Projections from Allied Market Research value the same market at US$1.3 billion in 2021 and expect it to reach US$14.6 billion by 2031. Fortune Business Insights reports the global anti-drone market size as “US$1.34 billion in 2021” and “projected to grow from US$1.58 billion in 2022 to US$6.95 billion by 2029.”

DroneShield Ltd.

One company particularly well situated to capture this nascent market is Australian powerhouse startup DroneShield Ltd. (DRO:ASX; DRSHF:OTC), which develops technologies to protect people, vehicles, and installations from drones.

Its artificial intelligence-based platforms for protection against drone threats and other hostile autonomous systems are easily deployed across various terrestrial, maritime, and airborne platforms.

DroneShield provides custom counter-drone and electronic warfare solutions built to specification, as well as off-the-shelf products designed to meet a variety of operational requirements. The company’s wide array of products include the DroneGun TacticalDroneGun MK3DroneGun MK4DroneSentryDroneSentry-C2DroneSentry-X, and RfPatrol.

The company recently introduced the DroneSentry-X Mk2, a new detection and adaptive disruption system for tracking multi-domain unmanned systems. The DroneSentry-X Mk2 can be mounted to standard vehicle roof racks on military vehicles, surface vessels, and unmanned mobile platforms.

DroneShield CEO Oleg Vornik says the company has seen “explosive growth” this year as it has expanded its U.S. headquarters in Northern Virginia and added top talent to stabilize its production cycle in both continents on which it operates.

With over 90 employees spread across operations in Sydney and Virginia, DroneShield secured an AU$33 million government sale, an AU$9.9 million 2-year R&D contract, and an AU$40 million capital raise in the past few quarters. It has been working through an AU$ 62 million order backlog that’s part of an AU $200 million pipeline.

Streetwise Ownership Overview*

DroneShield Ltd. (DRO:ASX; DRSHF:OTC)

Retail: 84.61%
Institutions: 7.99%
Management and Insiders: 7.4%
84.6%
8.0%
7.4%
*Share Structure as of 10/26/2023


The company aims to expand to employ some 120 to 150 staff in the next five years, supporting revenue of AU$300 million to AU$500 million per year, with roughly half of that income generated via software as a service (SaaS) and software R&D channels that are being developed alongside its manufacturing base.

There are 586.9 million outstanding shares, with 496.03 million free-float traded shares. The company has a market cap of US$105.64 million. It trades in a 52-week range of US$0.10 and US$0.34.

Approximately 2.46% of DroneShield is held by management and insiders. Independent Non-Executive Chairman Peter James owns 1.09% of the company with 6.63 million shares, CEO Oleg Vornik owns 1.75% with 10.7 million shares,  and Director Jethro Marks owns 0.21% with 1.3 million shares, CFO Carla Balanco owns 1.38% of the company with 8.45 million shares, CTO Angus Bean owns 1.21% of the company with 7.39 million shares.

Institutions own 7.99% of the company. Charles Goode (through Beta Gamma Pty. Ltd. And Ravenscourt Pty. Ltd) owns 3.52% of the company with 21.50 million shares. S R Bennet Pty. Ltd. owns 0.88% of the company with 5.35 million shares, and P & B Shaw FT CB Pty. Ltd. owns 0.56% of the company with 3.43 million shares.

Red Cat Holdings Inc.

Of course, the Anti-Drone market isn’t being driven by nothing. Drones themselves are booming, and not just on the battlefield.

Red Cat Holdings Inc. (RCAT:NASDAQ) 

A recent market report from The Business Research Company explains that “The global military drones market size will grow from US$14.54 billion in 2022 to US$15.88 billion in 2023 at a compound annual growth rate (CAGR) of 9.2%. The Russia-Ukraine war disrupted the chances of global economic recovery from the COVID-19 pandemic, at least in the short term.”

The report goes on to say that “The war between these two countries has led to economic sanctions on multiple countries, a surge in commodity prices, and supply chain disruptions, causing inflation across goods and services and affecting many markets across the globe. The global military drones market size is expected to grow to US$20.64 billion in 2027 at a CAGR of 6.8%.”

Red Cat Holdings Inc. (RCAT:NASDAQ), which recently doubled its initial order with The U.S. Defense Logistics Agency to US$5.2 million, aims to fill that gaping maw of raw user demand with the type of top-tech drones that DroneShield’s best products are designed to ameliorate.

According to Red Cat Holdings CEO Jeff Thompson, “The Air Force needs to secure its airfields and bases 24/7, and our Teal 2 offers the highest-resolution night vision in its class.”

Streetwise Ownership Overview*

Red Cat Holdings Inc. (RCAT:NASDAQ)

Retail: 58.68%
Management and Insiders: 36.09%
Institutions: 5.23%
58.7%
36.1%
5.2%
*Share Structure as of 9/27/2023


The Teal 2, designed as the top unmanned platform for night operations, has been approved by the U.S. Department of Defense for use across the department and others, adhering to its evaluation standards for service. Puerto Rico-based Red Cat has also deployed 200 high-speed drones on behalf of Ukraine and is involved in a US$90 million deal to provide drones for the U.S. Customs and Border Patrol (CBP).

ThinkEquity analyst Ashok Kumar wrote in March, “Looking forward, ThinkEquity expects Red Cat’s revenue and operating income to increase. The investment bank estimates revenue will reach US$11.9 million in FY23 and then more than triple to US$37 million in FY24.

According to Technical Analyst Clive Maund, the stock “continues to have the prospect of winning some very big orders for its drones.”

He wrote on July 27 that he was staying long on the stock.”The company’s Teal 2 drone appears to be a ‘game changer,’ as it has unsurpassed nighttime capabilities.”

RedCat Holdings has a market cap of US$56.2 million, with 55.54 million shares outstanding, and trades in a 52-week range of US$1.69 and US$0.7676.

According to Red Cat, 37.27% of company stock is held by management and insiders. Reuters notes that CEO Thompson owns 22.13%. CEO of Fat Shark RC Vision Systems Gregory Ralph French has 8.67%. COO Allan Thomas Evans has 2.41%. Director Nicholas Liuzza has 1.76%. CFO Joseph Hernon has 0.47%, and CEO of Teal Drones George Matus has 0.58%.

Institutional investors have 9.01%. The Vanguard Group Inc. has 2.3%. Pelion Venture Partners has 1.62%. BlackRock Institutional Trust has 0.61%, and Geode Capital Management LLC has 0.49%.


Important Disclosures:

  1. As of the date of this article, officers and/or employees of Streetwise Reports LLC (including members of their household) own securities of DroneShield Ltd. and Red Cat Holdings Inc..
  2. Owen Ferguson wrote this article for Streetwise Reports LLC and provides services to Streetwise Reports as an independent contractor.
  3. The article does not constitute investment advice. Each reader is encouraged to consult with his or her individual financial professional and any action a reader takes as a result of information presented here is his or her own responsibility. By opening this page, each reader accepts and agrees to Streetwise Reports’ terms of use and full legal disclaimer. This article is not a solicitation for investment. Streetwise Reports does not render general or specific investment advice and the information on Streetwise Reports should not be considered a recommendation to buy or sell any security. Streetwise Reports does not endorse or recommend the business, products, services or securities of any company mentioned on Streetwise Reports.

For additional disclosures, please click here.