Archive for Stock Market News – Page 18

COT Stock Market Charts: Speculator Bets led by S&P500-Mini

By InvestMacro

Here are the latest charts and statistics for the Commitment of Traders (COT) data published by the Commodities Futures Trading Commission (CFTC).

The latest COT data is updated through Tuesday April 2nd and shows a quick view of how large traders (for-profit speculators and commercial entities) were positioned in the futures markets.

Weekly Speculator Changes led by S&P500-Mini
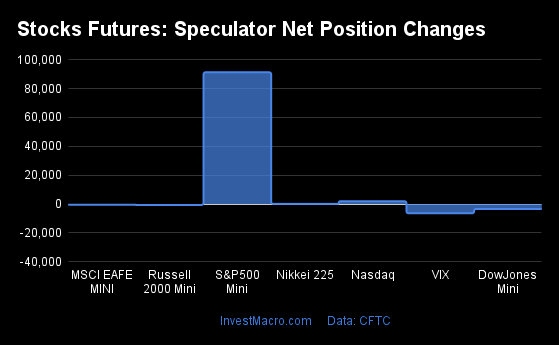
The COT stock markets speculator bets were lower this week as three out of the seven stock markets we cover had higher positioning while the other four markets had lower speculator contracts.

Leading the gains for the stock markets was S&P500-Mini (91,317 contracts) with the Nasdaq-Mini (1,921 contracts) and the Nikkei 225 (86 contracts) also showing positive weeks.

The markets with the declines in speculator bets this week were  the VIX (-6,429 contracts), the DowJones-Mini (-3,417 contracts), the Russell-Mini (-626 contracts) and the MSCI EAFE-Mini (-472 contracts) also registering lower bets on the week.


Stock Market Net Speculators Leaderboard
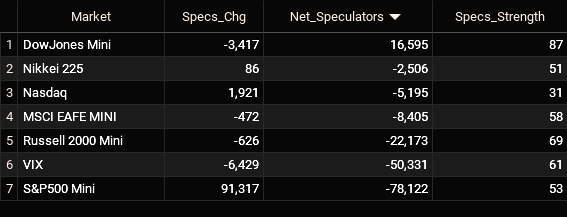
Legend: Weekly Speculators Change | Speculators Current Net Position | Speculators Strength Score compared to last 3-Years (0-100 range)


Strength Scores led by DowJones-Mini & Russell-Mini
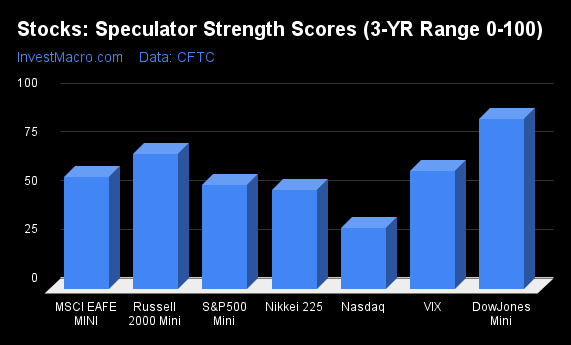
COT Strength Scores (a normalized measure of Speculator positions over a 3-Year range, from 0 to 100 where above 80 is Extreme-Bullish and below 20 is Extreme-Bearish) showed that the DowJones-Mini (87 percent) and the Russell-Mini (69 percent) lead the stock markets this week. The VIX (61 percent) comes in as the next highest in the weekly strength scores.

On the downside, the Nasdaq-Mini (31 percent) comes in at the lowest strength level currently and is currently the only market with a score below 50 percent (the midpoint of the past three years of positions).

Strength Statistics:
VIX (60.6 percent) vs VIX previous week (67.6 percent)
S&P500-Mini (53.1 percent) vs S&P500-Mini previous week (39.5 percent)
DowJones-Mini (87.3 percent) vs DowJones-Mini previous week (92.8 percent)
Nasdaq-Mini (31.1 percent) vs Nasdaq-Mini previous week (28.1 percent)
Russell2000-Mini (69.4 percent) vs Russell2000-Mini previous week (69.8 percent)
Nikkei USD (50.6 percent) vs Nikkei USD previous week (50.0 percent)
EAFE-Mini (57.7 percent) vs EAFE-Mini previous week (58.2 percent)


MSCI EAFE-Mini & S&P500-Mini top the 6-Week Strength Trends
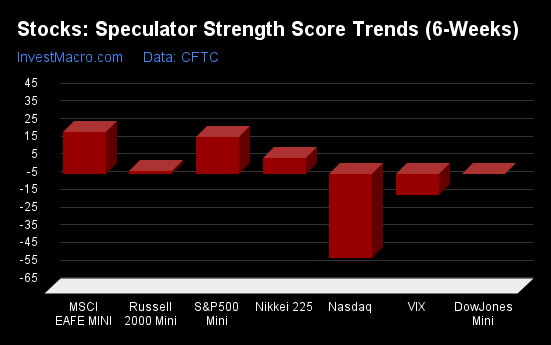
COT Strength Score Trends (or move index, calculates the 6-week changes in strength scores) showed that the MSCI EAFE-Mini (24 percent) leads the past six weeks trends for the stock markets. The S&P500-Mini (21 percent), the Nikkei 225 (9 percent) and the Russell2000-Mini (1 percent) are the next highest positive movers in the latest trends data.

The Nasdaq-Mini (-48 percent) leads the downside trend scores currently with the VIX (-12 percent) coming in as the next market with lower trend scores.

Strength Trend Statistics:
VIX (-12.2 percent) vs VIX previous week (7.6 percent)
S&P500-Mini (20.9 percent) vs S&P500-Mini previous week (6.9 percent)
DowJones-Mini (-0.2 percent) vs DowJones-Mini previous week (-0.6 percent)
Nasdaq-Mini (-47.7 percent) vs Nasdaq-Mini previous week (-60.8 percent)
Russell2000-Mini (1.4 percent) vs Russell2000-Mini previous week (2.1 percent)
Nikkei USD (8.9 percent) vs Nikkei USD previous week (5.8 percent)
EAFE-Mini (23.6 percent) vs EAFE-Mini previous week (20.6 percent)


Individual Stock Market Charts:

VIX Volatility Futures:
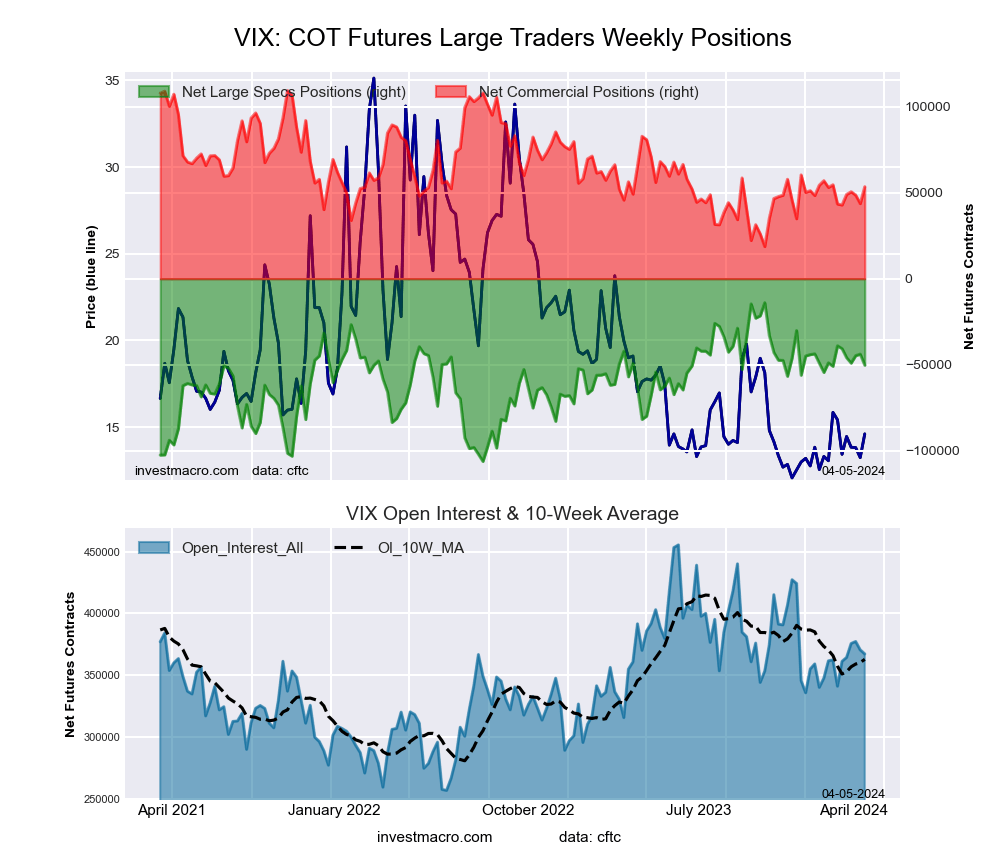
VIX Volatility Futures COT ChartThe VIX Volatility large speculator standing this week reached a net position of -50,331 contracts in the data reported through Tuesday. This was a weekly fall of -6,429 contracts from the previous week which had a total of -43,902 net contracts.

This week’s current strength score (the trader positioning range over the past three years, measured from 0 to 100) shows the speculators are currently Bullish with a score of 60.6 percent. The commercials are Bearish with a score of 38.4 percent and the small traders (not shown in chart) are Bullish-Extreme with a score of 80.0 percent.

Price Trend-Following Model: Strong Uptrend

Our weekly trend-following model classifies the current market price position as: Strong Uptrend. The current action for the model is considered to be: Hold – Maintain Long Position.

VIX Volatility Futures StatisticsSPECULATORSCOMMERCIALSSMALL TRADERS
– Percent of Open Interest Longs:18.445.97.4
– Percent of Open Interest Shorts:32.131.38.3
– Net Position:-50,33153,551-3,220
– Gross Longs:67,410168,47427,253
– Gross Shorts:117,741114,92330,473
– Long to Short Ratio:0.6 to 11.5 to 10.9 to 1
NET POSITION TREND:
– Strength Index Score (3 Year Range Pct):60.638.480.0
– Strength Index Reading (3 Year Range):BullishBearishBullish-Extreme
NET POSITION MOVEMENT INDEX:
– 6-Week Change in Strength Index:-12.211.16.1


S&P500 Mini Futures:

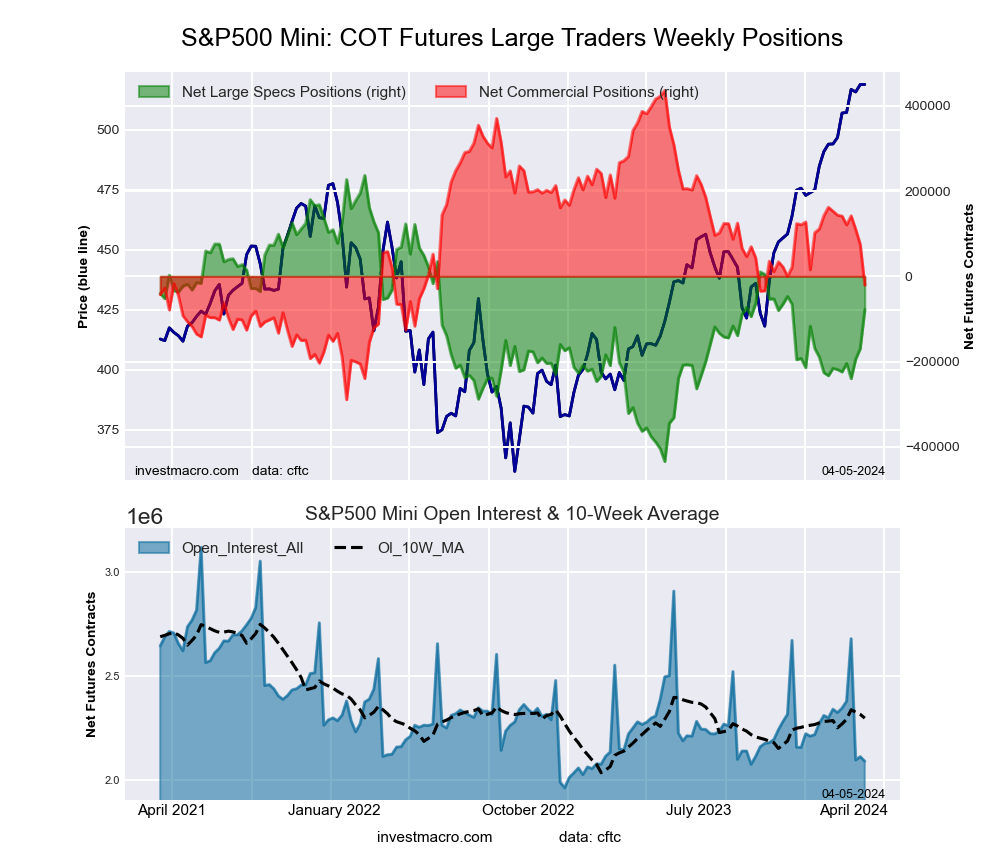
SP500 Mini Futures COT ChartThe S&P500 Mini large speculator standing this week reached a net position of -78,122 contracts in the data reported through Tuesday. This was a weekly rise of 91,317 contracts from the previous week which had a total of -169,439 net contracts.

This week’s current strength score (the trader positioning range over the past three years, measured from 0 to 100) shows the speculators are currently Bullish with a score of 53.1 percent. The commercials are Bearish with a score of 37.1 percent and the small traders (not shown in chart) are Bullish with a score of 76.3 percent.

Price Trend-Following Model: Uptrend

Our weekly trend-following model classifies the current market price position as: Uptrend. The current action for the model is considered to be: Hold – Maintain Long Position.

S&P500 Mini Futures StatisticsSPECULATORSCOMMERCIALSSMALL TRADERS
– Percent of Open Interest Longs:13.970.713.2
– Percent of Open Interest Shorts:17.671.78.5
– Net Position:-78,122-20,61298,734
– Gross Longs:290,0891,476,688275,700
– Gross Shorts:368,2111,497,300176,966
– Long to Short Ratio:0.8 to 11.0 to 11.6 to 1
NET POSITION TREND:
– Strength Index Score (3 Year Range Pct):53.137.176.3
– Strength Index Reading (3 Year Range):BullishBearishBullish
NET POSITION MOVEMENT INDEX:
– 6-Week Change in Strength Index:20.9-22.69.3


Dow Jones Mini Futures:

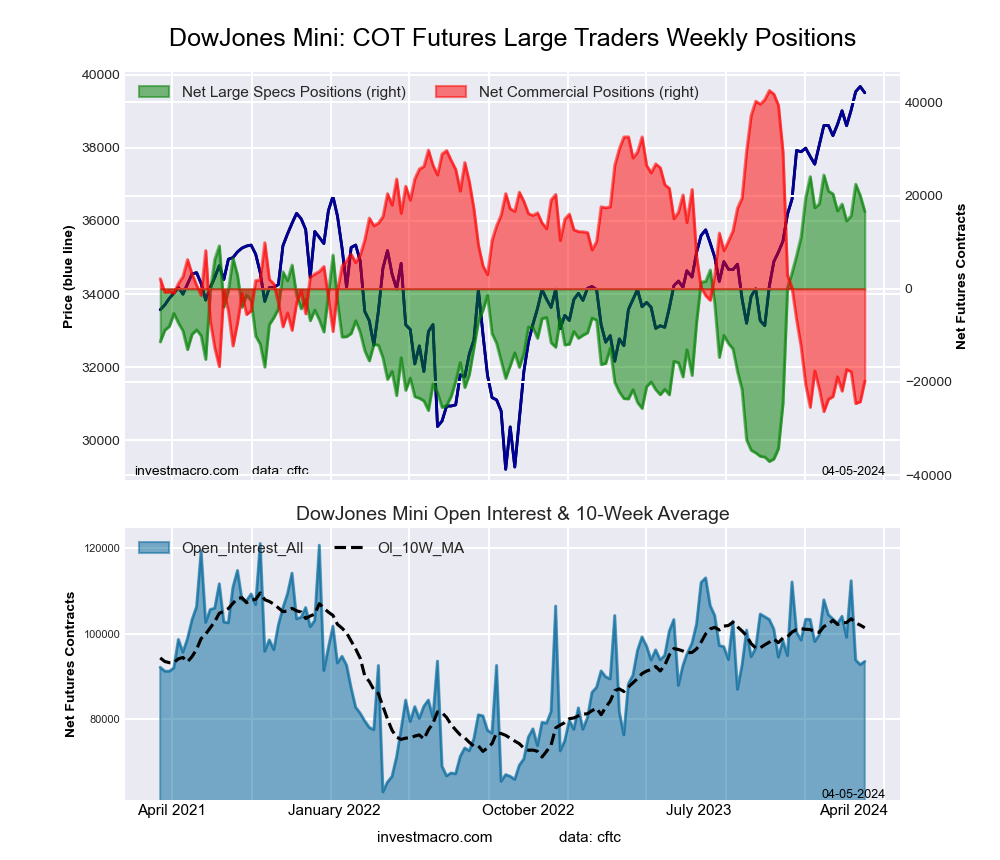
Dow Jones Mini Futures COT ChartThe Dow Jones Mini large speculator standing this week reached a net position of 16,595 contracts in the data reported through Tuesday. This was a weekly decline of -3,417 contracts from the previous week which had a total of 20,012 net contracts.

This week’s current strength score (the trader positioning range over the past three years, measured from 0 to 100) shows the speculators are currently Bullish-Extreme with a score of 87.3 percent. The commercials are Bearish-Extreme with a score of 9.5 percent and the small traders (not shown in chart) are Bullish with a score of 59.6 percent.

Price Trend-Following Model: Uptrend

Our weekly trend-following model classifies the current market price position as: Uptrend. The current action for the model is considered to be: Hold – Maintain Long Position.

Dow Jones Mini Futures StatisticsSPECULATORSCOMMERCIALSSMALL TRADERS
– Percent of Open Interest Longs:34.349.115.4
– Percent of Open Interest Shorts:16.670.311.9
– Net Position:16,595-19,8113,216
– Gross Longs:32,10645,90114,377
– Gross Shorts:15,51165,71211,161
– Long to Short Ratio:2.1 to 10.7 to 11.3 to 1
NET POSITION TREND:
– Strength Index Score (3 Year Range Pct):87.39.559.6
– Strength Index Reading (3 Year Range):Bullish-ExtremeBearish-ExtremeBullish
NET POSITION MOVEMENT INDEX:
– 6-Week Change in Strength Index:-0.2-1.35.1


Nasdaq Mini Futures:

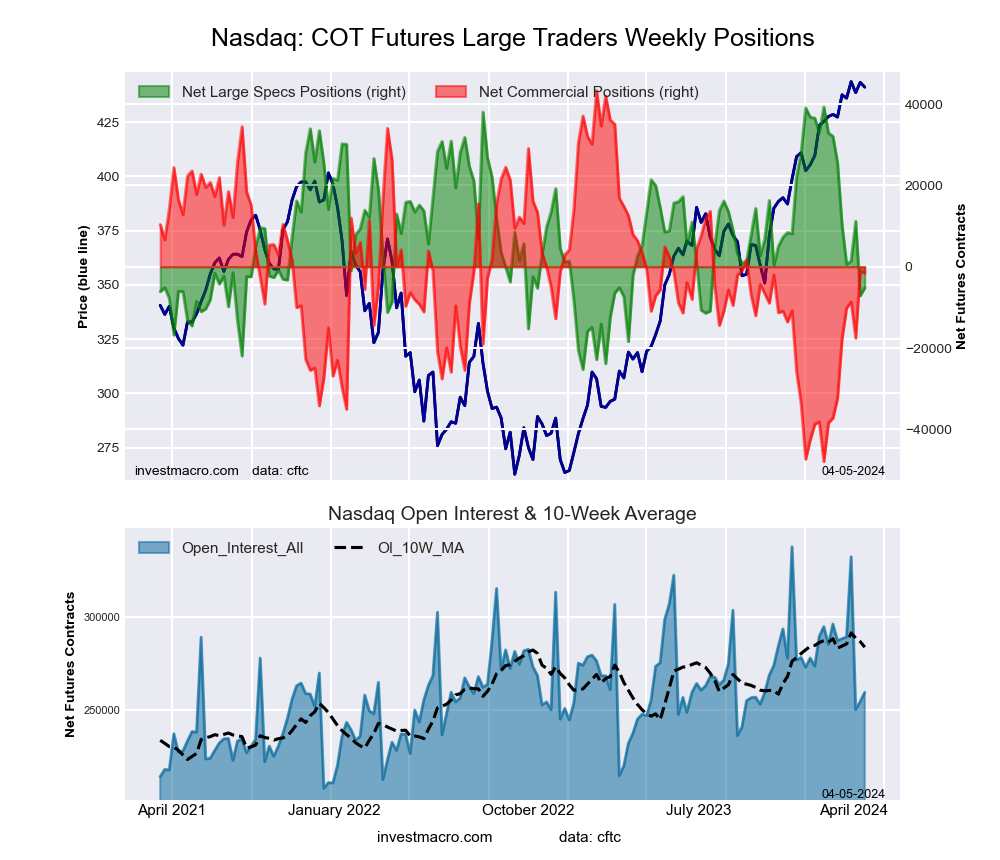
Nasdaq Mini Futures COT ChartThe Nasdaq Mini large speculator standing this week reached a net position of -5,195 contracts in the data reported through Tuesday. This was a weekly rise of 1,921 contracts from the previous week which had a total of -7,116 net contracts.

This week’s current strength score (the trader positioning range over the past three years, measured from 0 to 100) shows the speculators are currently Bearish with a score of 31.1 percent. The commercials are Bullish with a score of 50.8 percent and the small traders (not shown in chart) are Bullish-Extreme with a score of 92.8 percent.

Price Trend-Following Model: Uptrend

Our weekly trend-following model classifies the current market price position as: Uptrend. The current action for the model is considered to be: Hold – Maintain Long Position.

Nasdaq Mini Futures StatisticsSPECULATORSCOMMERCIALSSMALL TRADERS
– Percent of Open Interest Longs:25.257.415.9
– Percent of Open Interest Shorts:27.258.113.3
– Net Position:-5,195-1,5706,765
– Gross Longs:65,399149,03841,324
– Gross Shorts:70,594150,60834,559
– Long to Short Ratio:0.9 to 11.0 to 11.2 to 1
NET POSITION TREND:
– Strength Index Score (3 Year Range Pct):31.150.892.8
– Strength Index Reading (3 Year Range):BearishBullishBullish-Extreme
NET POSITION MOVEMENT INDEX:
– 6-Week Change in Strength Index:-47.733.8-0.3


Russell 2000 Mini Futures:

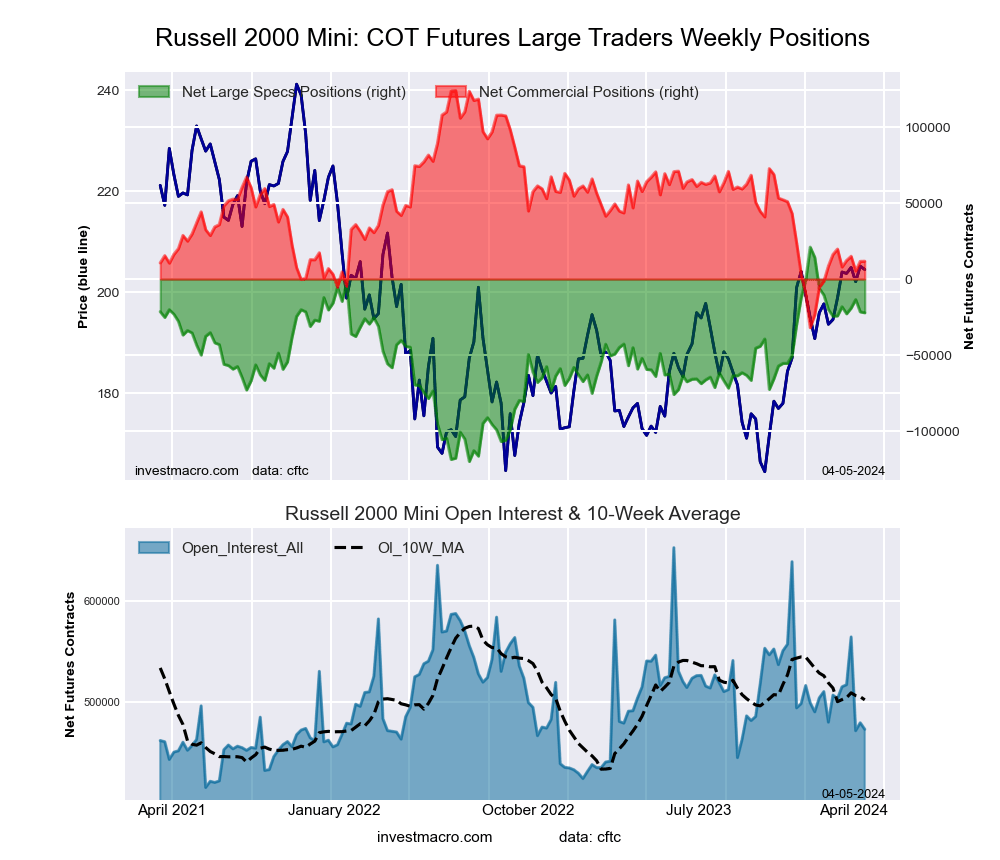
Russell 2000 Mini Futures COT ChartThe Russell 2000 Mini large speculator standing this week reached a net position of -22,173 contracts in the data reported through Tuesday. This was a weekly decrease of -626 contracts from the previous week which had a total of -21,547 net contracts.

This week’s current strength score (the trader positioning range over the past three years, measured from 0 to 100) shows the speculators are currently Bullish with a score of 69.4 percent. The commercials are Bearish with a score of 28.0 percent and the small traders (not shown in chart) are Bullish with a score of 64.2 percent.

Price Trend-Following Model: Uptrend

Our weekly trend-following model classifies the current market price position as: Uptrend. The current action for the model is considered to be: Hold – Maintain Long Position.

Russell 2000 Mini Futures StatisticsSPECULATORSCOMMERCIALSSMALL TRADERS
– Percent of Open Interest Longs:15.776.86.4
– Percent of Open Interest Shorts:20.474.34.2
– Net Position:-22,17311,73310,440
– Gross Longs:74,238363,07430,378
– Gross Shorts:96,411351,34119,938
– Long to Short Ratio:0.8 to 11.0 to 11.5 to 1
NET POSITION TREND:
– Strength Index Score (3 Year Range Pct):69.428.064.2
– Strength Index Reading (3 Year Range):BullishBearishBullish
NET POSITION MOVEMENT INDEX:
– 6-Week Change in Strength Index:1.4-5.120.1


Nikkei Stock Average (USD) Futures:

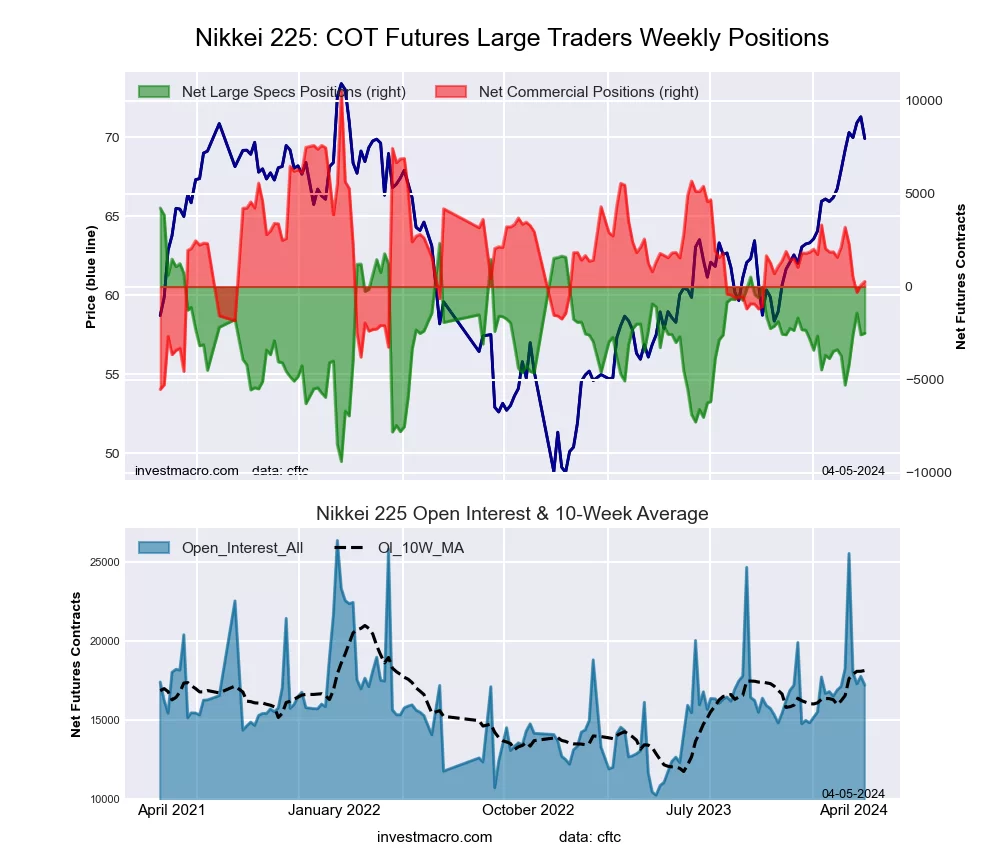
Nikkei Stock Average (USD) Futures COT ChartThe Nikkei Stock Average (USD) large speculator standing this week reached a net position of -2,506 contracts in the data reported through Tuesday. This was a weekly boost of 86 contracts from the previous week which had a total of -2,592 net contracts.

This week’s current strength score (the trader positioning range over the past three years, measured from 0 to 100) shows the speculators are currently Bullish with a score of 50.6 percent. The commercials are Bearish with a score of 36.1 percent and the small traders (not shown in chart) are Bullish with a score of 73.4 percent.

Price Trend-Following Model: Uptrend

Our weekly trend-following model classifies the current market price position as: Uptrend. The current action for the model is considered to be: Hold – Maintain Long Position.

Nikkei Stock Average Futures StatisticsSPECULATORSCOMMERCIALSSMALL TRADERS
– Percent of Open Interest Longs:5.069.525.5
– Percent of Open Interest Shorts:19.667.912.5
– Net Position:-2,5062752,231
– Gross Longs:86311,9624,386
– Gross Shorts:3,36911,6872,155
– Long to Short Ratio:0.3 to 11.0 to 12.0 to 1
NET POSITION TREND:
– Strength Index Score (3 Year Range Pct):50.636.173.4
– Strength Index Reading (3 Year Range):BullishBearishBullish
NET POSITION MOVEMENT INDEX:
– 6-Week Change in Strength Index:8.9-11.510.4


MSCI EAFE Mini Futures:

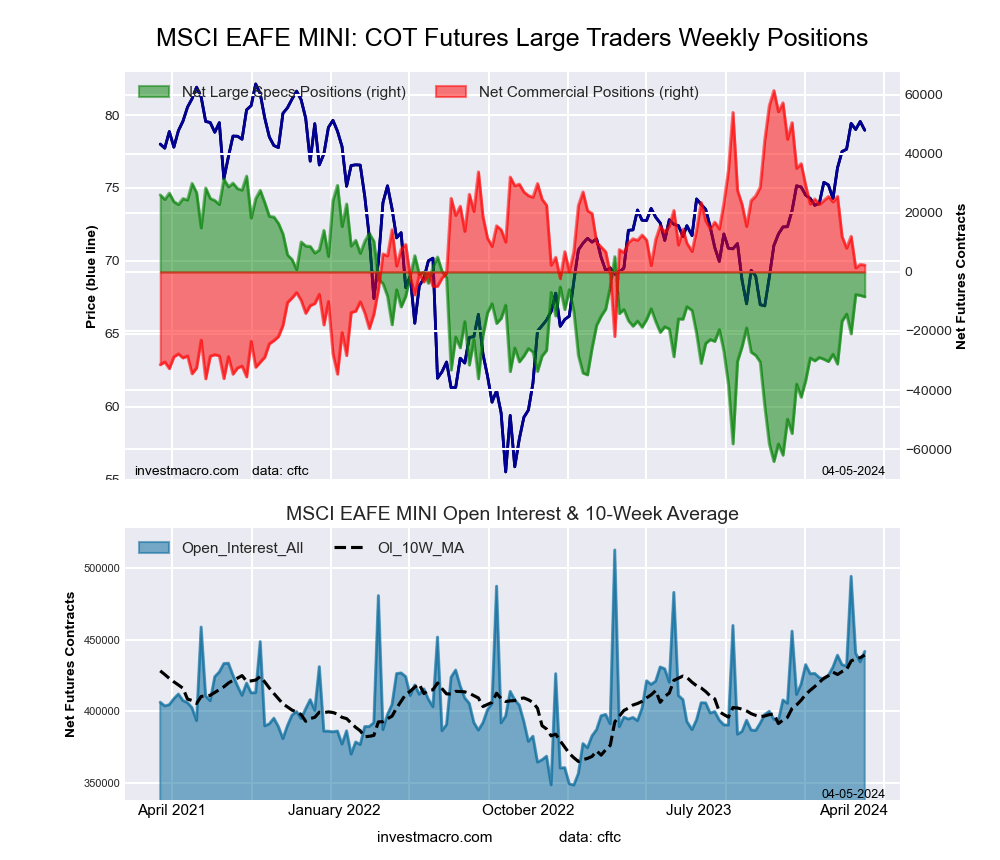
MSCI EAFE Mini Futures COT ChartThe MSCI EAFE Mini large speculator standing this week reached a net position of -8,405 contracts in the data reported through Tuesday. This was a weekly reduction of -472 contracts from the previous week which had a total of -7,933 net contracts.

This week’s current strength score (the trader positioning range over the past three years, measured from 0 to 100) shows the speculators are currently Bullish with a score of 57.7 percent. The commercials are Bearish with a score of 39.5 percent and the small traders (not shown in chart) are Bearish with a score of 47.3 percent.

Price Trend-Following Model: Uptrend

Our weekly trend-following model classifies the current market price position as: Uptrend. The current action for the model is considered to be: Hold – Maintain Long Position.

MSCI EAFE Mini Futures StatisticsSPECULATORSCOMMERCIALSSMALL TRADERS
– Percent of Open Interest Longs:7.989.02.6
– Percent of Open Interest Shorts:9.888.51.3
– Net Position:-8,4052,3286,077
– Gross Longs:34,826393,31511,626
– Gross Shorts:43,231390,9875,549
– Long to Short Ratio:0.8 to 11.0 to 12.1 to 1
NET POSITION TREND:
– Strength Index Score (3 Year Range Pct):57.739.547.3
– Strength Index Reading (3 Year Range):BullishBearishBearish
NET POSITION MOVEMENT INDEX:
– 6-Week Change in Strength Index:23.6-23.82.2


Article By InvestMacroReceive our weekly COT Newsletter

*COT Report: The COT data, released weekly to the public each Friday, is updated through the most recent Tuesday (data is 3 days old) and shows a quick view of how large speculators or non-commercials (for-profit traders) were positioned in the futures markets.

The CFTC categorizes trader positions according to commercial hedgers (traders who use futures contracts for hedging as part of the business), non-commercials (large traders who speculate to realize trading profits) and nonreportable traders (usually small traders/speculators) as well as their open interest (contracts open in the market at time of reporting). See CFTC criteria here.

Five Eyes Gov’t Awards R&D Contract to Counterdrone Co.

Source: Streetwise Reports (4/2/24)

DroneShield Ltd. announced it has been awarded an AU$900,000 research and development contract by a Five Eyes government. Find out why one research firm names it one of the most important military AI companies. 

DroneShield Ltd. (DRO:ASX; DRSHF:OTC) announced it has been awarded an AU$900,000 research and development contract by a Five Eyes government.

The Five Eyes intelligence alliance was born out of the World War II era and includes Australia, Canada, New Zealand, the United Kingdom, and the United States.

DroneShield said the contract specifically aims to leverage the potential of the company’s DroneSentry-X Mk2 and provide a set of software tools to enhance end-user capabilities in the counter-unmanned aerial systems (C-UAS) domain.

“DroneShield’s radio frequency jamming capability has been recognized globally as highly effective in defeating nefarious drones,” DroneShield Chief Technical Officer Angus Bean said. “This new contract highlights that the DroneSentry-X Mk2 is a step-function in smart- jamming capabilities. We are looking forward to delivering on the capabilities the Defense users are looking for.”

The company said the contract “aligns closely” with its current technology roadmap. “Software controlled multi-channel wideband disruption allows for not only optimized channel management, frequency management, power usage, and optimization, but the addition of custom waveforms targeted at various threats,” DroneShield noted in a release.

One of the Most Important Military AI Companies

DroneShield provides C-UAS protection with a focus on radio frequency sensing, artificial intelligence (AI) machine learning, sensor fusion, electronic warfare, rapid prototyping, and MIL-SPEC manufacturing, the company’s website said.

Its technology uses “a multi-layered artificial intelligence-based solution for both detection and defeat, with smart, non-kinetic defeat.”

The company offers “protection against a wide range of improvised threats” through UAV (unmanned aerial vehicles), UGV (unmanned ground vehicles), USV (unmanned surface vehicles), and UUV (unmanned underwater vehicles).

Bell Potter analyst Daniel Laing gave the stock a Buy rating and an AU$0.90 per share price target.

DroneShield showed record results with its first profitable year in 2023, “with AU$9.3 million profit after tax.”

“DroneShield has had an outstanding last 12 months, which has been reflected in the share price performance YTD,” Bell Potter analyst Daniel Laing wrote in a research note on March 4. Laing gave the stock a Buy rating and an AU$0.90 per share price target.

McAlinden Research Partners has rated DroneShield as one of the most important military AI companies as defense orders outpace equipment losses in Ukraine.

The Catalyst: A ‘New Generation of Disruption Capabilities’

The new contract represents “the start of an entirely new generation of disruption capabilities,” DroneShield Chief Executive Officer Oleg Vornik said.

“DroneShield products are considered to be market leading by many governments around the world,” he continued. “We pride ourselves on setting the global benchmark.”

As drone protocols are designed to move away from RF interference and work in high-noise, high-clutter environments means that traditional disruption methods may become less effective. A software approach to stay one step ahead has become important to successful disruption systems, the company noted.

Technical Analyst Clive Maund wrote in 2023 that DroneShield looked “set to succeed.” In February, he wrote: “After starting higher again in November, it has advanced in a classic bullish staircase pattern, but over the past week or two the advance has accelerated dramatically with the price at last breaking out to new all-time highs, an impressive move given the number of shares in issue.”

Laing commented on DroneShield’s current sales pipeline of AU$510 million, with AU$388 million of potential orders this year.

“DRO’s confidence in the sales pipeline is reflected in its recent investment (committed supply chain payments of AU$30m) in its inventory balance, which we view as a leading indicator of near-term sales announcements,” Laing noted.

Darren Odell of Peloton Capital also predicted good things for DroneShield, writing in July 2023 that the company had “already exceeded 2023 revenue estimates.”

Streetwise Ownership Overview*

DroneShield Ltd. (DRO:ASX; DRSHF:OTC)

Retail: 75.01%
Institutions: 13.99%
Management and Insiders: 11%
75.0%
14.0%
11.0%
*Share Structure as of 1/24/2024


Ownership and Share Structure

Management and insiders own 11% of the company. CEO Oleg Vornik owns 2.23% of the company with 15 million options, on a fully diluted basis. Non-Executive Chairman Peter James owns 0.58% of the company with 920k shares and 3 million options, on a fully diluted basis, and Non-Executive Director Jethro Marks owns 0.22%, with 1.5 million options, on a fully diluted basis, according to DroneShield.

The company reports that the largest independent investor, Charles Goode, owns 4.41% of the company with 21.5 million shares, while strategic investors own a total of 13.99% of the company.

Eprius Inc. is the second largest shareholder, with 3.16% of the company with 18.5 million shares.

In its February 2023 placement, Droneshield said that it brought ten new institutional investors on board, but it has not yet released more details.

The company reports that there are about 616 million shares outstanding, and about 526 million free-float traded shares. Its market cap is about AU$499.37 million, and it trades in a 52-week range of AU$0.93 and AU$0.21.


Important Disclosures:

  1. As of the date of this article, officers and/or employees of Streetwise Reports LLC (including members of their household) own securities of DroneShield Ltd.
  2. Steve Sobek wrote this article for Streetwise Reports LLC and provides services to Streetwise Reports as an employee.
  3.  This article does not constitute investment advice and is not a solicitation for any investment. Streetwise Reports does not render general or specific investment advice and the information on Streetwise Reports should not be considered a recommendation to buy or sell any security. Each reader is encouraged to consult with his or her personal financial adviser and perform their own comprehensive investment research. By opening this page, each reader accepts and agrees to Streetwise Reports’ terms of use and full legal disclaimer. Streetwise Reports does not endorse or recommend the business, products, services or securities of any company.

For additional disclosures, please click here.

UK100 index teases record high

By ForexTime 

  • UK100 index broke above 8k mark today
  • This stock index came to within 150 pips of its all-time high
  • Falling UK house prices fostered bets for UK interest rate cuts
  • “Dovish” Bank of England weakened GBP, cheered UK stocks
  • Could this be the 12th FXTM stock index to reach record high this year?


The UK100 index came to less than 0.2% away from its record high!

This stock index broke above the psychological 8,000 level, before easing back lower at the time of writing.


What is a stock index?

Imagine a stock index being a basket of many different stocks.

The index measures the overall performance of all those stocks inside that “basket”.

So, rising stock prices inside that “basket” tends to push the index’s prices higher, and vice versa.


What does the UK100 stock index track?

FXTMs UK100 stock index tracks the performance of the benchmark FTSE 100 index.

The FTSE 100 is a blue-chip index, measuring the performance of the 100 biggest companies listed on the London Stock Exchange.

This includes well-known companies such as Shell, AstraZeneca, HSBC, Unilever, and BP, among others.


How far away is the UK100 from its current record high?

The current ATH (all-time high) for this stock index, using intraday prices, stands at 8051.4 posted on 16th February 2023.

Note that this UK100 index tends to move by an average of 0.9% on any given trading day over the past two years.

In other words, this UK100 stock index remains well within reach of its current record high.

If the UK100 stock index can set a new record high soon, that would raise the tally to …

12 of the 18 different stock indices offered across FXTM’s platforms that have posted their respective record highs so far in 2024!


UK100 playing catch up with global peers

Note that the UK100 stock index is up “just” about 3% so far in 2024.

That pales in contrast to the year-to-date gains shown in these stock indexes:

  • JAP225: +19%
  • NETH25: +13%
  • EU50: +12.7%
  • TWN: +11.7%
  • US500: +9.9%


Why is the UK100 stock index rising today (Tuesday, April 2nd)?

Today (April 2nd, 2024), it was revealed that UK house prices in March 2024 fell 0.2% compared to February 2024.

This was the first month-on-month decline for UK house prices since December 2023.

While falling UK house prices may ease inflationary pressures, it could also mean stagnating economic growth.

Either way, the data points to a greater likelihood that the Bank of England may cut its Bank Rate sooner rather than later.


How does the BOE’s rate outlook impact the FTSE 100 stock index?

The prospects of UK interest rates moving lower tends to weaken the British Pound, which in turn lifts up the FTSE 100.

At the time of writing, markets are pricing in a 72% chance that the Bank of England will lower its benchmark rate at its June 2024 policy meeting.

Those 72% odds are significantly higher compared to the 42% chance accorded just a month ago (early March 2024) for the same event (BOE rate cut in June).

As a general rule, markets tend to weaken the currency belonging to the central bank that’s about to lower its interest rates.


Also note that the FTSE 100 index and Sterling tend to go in opposite directions (inverse relationship).

In fact, using Bloomberg data, over any given 5-day rolling period over the past 30 years …

the FTSE 100 has moved in the opposite direction as the British Pound, 95% of the time!


Hence, the thought of lower BOE rates = weaker Pound = higher UK100 stock index.


How high could the UK100 stock index go?

Wall Street analysts predict that this UK100 stock index could flirt with the 9,000 mark, 12 months from now.

That suggests potential gains of over 12% over the next 12 months!

If investors can become even more optimistic about the UK and global economic outlook, supported by lower interest rates in the UK, that should help this UK100 stock index realise its upside potential.


Beware of technical pullback

However, on the daily timeframe, note that the UK100’s 14-day relative strength index (RSI) has broken the 70 line and into “overbought” territory.

History suggests that such a technical event may lead to a price pullback in the near future.

Still, once the froth has been cleared from this technical pullback, the UK100 stock index may resume its uptrend that began in late-October 2023, provided the fundamental reasonings remain sound.


Forex-Time-LogoArticle by ForexTime

ForexTime Ltd (FXTM) is an award winning international online forex broker regulated by CySEC 185/12 www.forextime.com

Climate change puts global semiconductor manufacturing at risk. Can the industry cope?

By Josh Lepawsky, Memorial University of Newfoundland 

Semiconductors are the basic building blocks of microchips. These technological marvels are in everything from lightbulbs and toothbrushes to cars, trains and planes, not to mention the vast array of electronics that have become integral to many people’s daily lives.

The 21st century chip manufacturing industry has been described as “at least as significant geopolitically as oil was in the 20th.” But semiconductor manufacturing requires vast quantities of water to keep machinery cool and wafer sheets free of debris, and the unfolding climate emergency puts the industry at risk.

Despite the industry’s dependence on water, little attention has been paid to how changing environmental conditions may impact it. Reporting by journalists and think tanks tend to overlook climate as a risk factor for the future of the industry.

Yet, globally and regionally there are signs of trouble. Taiwan, for example, produces about 90 per cent of the world’s most advanced semiconductors and has been experiencing a significant drought since 2021.

The drought is bad enough that Taiwanese farmers are being paid to keep their fields fallow so water that would otherwise go to agriculture can be fed into semiconductor manufacturing plants. Taiwanese manufacturing plants have even had to resort to trucking water from one watershed to another to overcome shortages.

Publicly available data on climate change-induced water stress, combined with data on the location of existing, planned and announced semiconductor manufacturing facilities around the world, all point to global patterns of concern for the future of semiconductor manufacturing.

Looming water shortages ahead

No matter the climate change scenario considered — whether optimistic, business-as-usual or pessimistic — a minimum of 40 per cent of all existing semiconductor manufacturing plants are located in watersheds that are anticipated to experience high or extremely high water stress risk by 2030.

High-risk watersheds are those in which 40 to 80 per cent of the total renewable surface and ground water available for all purposes (e.g., irrigation, industrial, domestic use) are in use. Extremely high-risk watersheds are those in which greater than 80 per cent of the total renewable surface and ground water are in use.

Much of the recent concern expressed over semiconductor manufacturing paints the issue in geopolitical terms about interstate rivalry, especially between China and the United States.

Both the U.S. and Europe have announced major government funding for the semiconductor manufacturing industry, especially to bring back the facilities of companies that spent decades setting up manufacturing capacity outside of those regions. However, the manufacturing facilities being announced or under construction in the U.S. and Europe are all located in regions that are already facing significant water stress.

Intel, Taiwan Semiconductor Manufacturing Company (TSMC) and Samsung are all building new facilities in the southwestern U.S. — a region that has been under official drought conditions since 1994. In 2021, the U.S. Bureau of reclamation made its first ever shortage declaration for the Colorado River basin.

Future climate change scenarios suggest more than 40 per cent of all new semiconductor manufacturing facilities announced since 2021 will be in watersheds likely to experience high- or extremely high-risk water stress scenarios.

Put simply, climate change and water shortages is creating risks for semiconductor manufacture in both the short- and long-term.

The state of the industry

Semiconductor manufacturing facilities are multi-billion dollar investments. One does not simply pick a facility up from one location and plunk it down elsewhere if local water conditions become problematic.

As worrying as the future might be for the sector, aggregate water stress risks only tell part of the story. The importance of particular nodes in global production networks for semiconductors is another key factor.

For example, TSMC is widely acknowledged as a world leader in manufacturing advanced semiconductors for companies like Apple, Nvidia and Cerebras. Yet, the facilities where TSMC manufactures for those companies are located in just three sites in Taiwan. This makes the global production networks that manufacture these technologies quite fragile. Semiconductors, especially the most advanced ones, rely on a network of only a handful of facilities like TSMC’s.

Customers of those facilities cannot easily switch to another supplier in the face of a disruption, so issues that arise at a single facility can cascade through global supply chains. This can impact a wide variety of commodities that make use of semiconductors, as was experienced during the COVID-19 pandemic.

Major semiconductor manufacturers like Intel and TSMC claim to take water stewardship seriously. Yet, their own company reports suggest there may be trouble ahead. Despite TSMC’s investments in water reclamation and recycling, the company anticipates being able to provide only two-thirds of the daily water consumption needed at its Taiwan-based facilities.

Intel, meanwhile, claims to achieve net positive water use across its manufacturing network as a whole. But, it manages this achievement only by counting surplus water at locations in one part of the world against water deficits at its facilities elsewhere.

A concerning future ahead

It is not going to be easy — or cheap — to overcome the chronic water stress risks for the semiconductor industry arising from the unfolding climate emergency. Conflicts already exist between the sector and other water users.

Even as individual companies make impressive water use efficiency improvements, these efforts do not automatically result in systemic efficiencies across semiconductor production networks. And no amount of efficiency will ever overcome the problem of the water that is needed for semiconductor manufacturing also being needed by other users.

It may still be possible to avoid some of the worst consequences of locking in future water stress for the sector by rethinking the location of future facilities that have been announced, but are not yet under construction.

Without secure access to large volumes of water there are no semiconductors, and without semiconductors there are no electronics. The climate emergency is a major driver of water stress both now and in the future. Can the tech sector cope? It remains to be seen.The Conversation

About the Author:

Josh Lepawsky, Full Professor of Geography, Memorial University of Newfoundland

This article is republished from The Conversation under a Creative Commons license. Read the original article.


AI Revolution and NVDA: Why Tough Going May Be Ahead

“These things could get more intelligent than us”

By Elliott Wave International

The topic with all the buzz these days is Artificial Intelligence (AI) and its future.

The potential benefits include automating repetitive tasks, enhancing productivity, data analysis, assisting in medical applications — and more.

Then there’s the possible downside. Some of the major worries include the elimination of jobs, privacy violations, unclear legal regulations and the potential for AIs to go rogue as the goals of AI become misaligned with the goals of humans.

In an interview with NPR in 2023, computer scientist Geoffrey Hinton, who is known as the godfather of AI, said:

These things could get more intelligent than us and could decide to take over, and we need to worry now about how we prevent that happening.

However, right now, the mood surrounding AI is way more optimistic than pessimistic.

Just think about how investors have bid up the price of AI-related stock Nvidia Corp., which has a market capitalization of around $2 trillion. That’s more than the GDP of Australia or South Korea. Indeed, if Nvidia was a country, it would rank just outside the top ten largest economies on Earth.

Yet — a word of caution: Trends generally don’t go up or down in straight lines without significant interruptions.

Indeed, the March Global Rates & Money Flows, one of Elliott Wave International’s newest services, which covers global fixed income markets, stocks, currencies and more, shows this chart of an AI exchange-traded fund and says:

BOTZ, the ticker for the Global X Robotics & Artificial Intelligence ETF, sports a clear five-wave decline from 2021 to 2022. Since then, a corrective rally appears to be in operation with wave C advancing now. … [The] evidence suggests that the AI revolution may be off to a false start.

But what about the price pattern of Nvidia? — you may ask.

Know that our Senior Global Strategist, Murray Gunn, also provides Elliott wave analysis of Nvidia in the March Global Rates & Money Flows.

If you’re unfamiliar with Elliott wave analysis, read Frost & Prechter’s definitive text on the topic, Elliott Wave Principle: Key to Market Behavior. Here’s a quote from this Wall Street classic:

Despite the fact that many analysts do not treat it as such, the Wave Principle is by all means an objective study, or as [Charles] Collins put it, “a disciplined form of technical analysis.” [Hamilton] Bolton used to say that one of the hardest things he had to learn was to believe what he saw. If you do not believe what you see, you are likely to read into your analysis what you think should be there for some other reason. At this point, your count becomes subjective and worthless.

How can you remain objective in a world of uncertainty? It is not difficult once you understand the proper goal of your analysis.

Without Elliott, there appear to be an infinite number of possibilities for market action. What the Wave Principle provides is a means of first limiting the possibilities and then ordering the relative probabilities of possible future market paths. Elliott’s highly specific rules reduce the number of valid alternatives to a minimum.

If you’d like to learn about the “highly specific rules” of the Wave Principle, know that you can gain complimentary access to the entire online version of Elliott Wave Principle: Key to Market Behavior for free.

Just follow the link and you can have the Wall Street bestseller on your computer in moments: Elliott Wave Principle: Key to Market Behavior — get free and instant access.

NETH25 index chasing new record highs!

By ForexTime 

  • FXTM launches 6 new stock indices
  • NETH25 gaining more than Gold, US stock indices so far in 2024
  • NETH25 tracks 25 largest and most-traded Dutch stocks
  • NETH25 index includes ASML – Europe’s most-valuable tech company
  • Experts predict this stock index could rise another 8.6% in 12 months


FXTM’s new NETH25 stock index has been on an unrelenting search for new record highs!

The current ATH (all-time high) for this stock index stands at 879.3, posted yesterday (Monday, March 25th).

NOTE: 11 of the 18 different stock indices offered across FXTM’s platforms have posted record highs respectively so far in 2024!


Although the uptrend is on a pause at the time of writing,

the NETH25 index is still up by about 11.5% so far this year!

The NETH25’s index’s year-to-date gains have outperformed those of other popular assets:

  • NAS100 stock index: +8.6%
  • Gold: +5.3%
  • US Dollar index: +2.8%


What is a stock index?

Imagine a stock index being a basket of many different stocks.

The index measures the overall performance of those stocks inside that “basket”.


What does the NETH25 stock index track?

FXTMs NETH25 stock index tracks the performance of the AEX index – the Amsterdam Exchange index.

The AEX index measures the overall performance of the 25 biggest and most actively traded shares on Euronext Amsterdam.

The AEX index includes well-known companies such as ASML, Shell, Unilever, ING, Universal Music Group, and Heineken, among others.

FUN FACT: The Amsterdam Stock Exchange is generally considered to be the oldest stock exchange in the world, established in 1602.


3 key things to know about the NETH25 index:


1) NETH25 is a tech-heavy stock index

Tech stocks account for over 25% of the AEX index, led by ASML – Europe’s most-valuable tech company.

Note how tech companies leading the charge upwards for many stock markets around the world, from Nvidia in the US, to Taiwan Semiconductor Manufacturing in Taiwan.

In similar fashion, the NETH25 index is also soaring upwards thanks to the ongoing AI-mania which is bolstering demand for semiconductors.


2) NETH25 battling for 2nd-best performing FXTM stock index so far in 2024

Here are the top-5 biggest gainers of the 18 stock indices offered across FXTM’s platforms:

  1. JAP225: +20.7%
  2. EU50: 11.6%
  3. NETH25: 11.5%
  4. TWN: +9.7%
  5. US500: 9.4%

9 of the AEX Index’s 25 member stocks have already posted double-digit year-to-date gains, which is helping the NETH25 keep pace with the overall surge in global stock indices.


3) NETH25 index forecasted to climb another 8.6% over next 12 months

Over the next 12 months, the AEX index is expected by expert financial analysts to cross over the 950 level.

If so, that marks 8.6% in potential gains, with a further upside of 76 index points.

Of course, markets hardly ever move in a straight line, and there are bound to be twists and turns along the way, presenting trading opportunities for both buyers and sellers.


Still, over the longer-term horizon, as long as a AI-mania can keep chugging along, bolstered further by a rosier outlook for the European economy, thanks to incoming rate cuts by the European Central Bank 

that should enable the NETH25 index to post multiple new record highs along the way.


Forex-Time-LogoArticle by ForexTime

ForexTime Ltd (FXTM) is an award winning international online forex broker regulated by CySEC 185/12 www.forextime.com

Stocks: What to Make of All This Insider Selling

Here are details of “The Great Cash-Out”

By Elliott Wave International

Corporate insiders may sell the shares of their company for any number of reasons but one of them is not because they think the price is going up.

In other words, insider selling can serve as a warning.

For example, the January 2022 Elliott Wave Financial Forecast, a monthly publication which covers major U.S. financial markets, noted:

Only one group is selling. … Corporate insiders sold a record $64.5 billion of their firms’ shares through November [2021]. As the December [2021] Theorist noted, insiders “know what their companies are worth,” and “they’ve been selling their heads off.”

This commentary was published within days of the January 2022 highs in the Dow Industrials and S&P 500.

What does all this have to do with today?

You guessed it, insiders are in a selling mood again.

Here are just a few prominent examples:

In the last two months of 2023, Mark Zuckerberg, the executive chairman of Meta Platforms (Facebook), sold $400 million worth of Meta stock. He then sold another $661 million between January 31 and February 21.

Around this time, on Jan. 20, Bloomberg noted:

… a total of 1,000 insiders sold their own stock and 128 bought shares, leaving the sell-to-buy ratio poised for the highest monthly reading in data going back to 1988.

Then, on Feb. 27, we had this headline from Fortune:

The Great Cash-Out: Jeff Bezos, Leon Black, Jamie Dimon, and the Walton family have now sold a combined $11 billion in company stock this month …

JPMorgan CEO Jamie Dimon and Apollo Global Management co-founder Leon Black sold shares in their companies for the first time ever.

The Walton family unloaded $1.5 billion of Walmart shares and Jeff Bezos sold $8.5 billion of Amazon stock.

Also of note are the stock market activities of another very rich person — or shall I say the lack of activities.

Warren Buffet of Berkshire Hathaway is holding onto a record high stockpile of cash: $167.7 billion. The Oracle of Omaha says he sees “no candidates for capital deployment.”

Of course, major corporate insider selling is by no means the only indicator investors should watch.

Market participants may also want to monitor the repetitive patterns of investor psychology — which show up as Elliott waves on price charts.

If you’d like to delve into the details of Elliott wave analysis, read Frost & Prechter’s definitive text on the subject — Elliott Wave Principle: Key to Market Behavior. Here’s a quote from this Wall Street classic:

It is a thrilling experience to pinpoint a turn, and the Wave Principle is the only approach that can occasionally provide the opportunity to do so.

The ability to identify such junctures is remarkable enough, but the Wave Principle is the only method of analysis that also provides guidelines for forecasting. Many of these guidelines are specific and can occasionally yield stunningly precise results.

Get more insights into the Wave Principle by reading the entire online version of the book for free.

Just follow the link and you can have the Wall Street bestseller on your computer screen in moments: Elliott Wave Principle: Key to Market Behavior — get free and instant access.

This article was syndicated by Elliott Wave International and was originally published under the headline Stocks: What to Make of All This Insider Selling. EWI is the world’s largest market forecasting firm. Its staff of full-time analysts led by Chartered Market Technician Robert Prechter provides 24-hour-a-day market analysis to institutional and private investors around the world.

Trade Of The Week: CN50 flirts with critical resistance

By ForexTime 

  • CN50 up over 5% YTD
  • Prices bullish on D1 charts
  • Watch out for Big China bank earnings
  • Key level of interest at 12250
  • Major breakout on horizon?

If you are seeking fresh market opportunities, then look no further!

FXTM’s CN50 index, which tracks the benchmark FTSE China A50, is flirting around key weekly resistance ahead of an event-heavy week…

That’s right, various Chinese companies listed in the CN50 are due to report their latest quarterly earnings throughout the week. This will be complemented with China’s latest industrial profits which could provide insight into the health of the world’s second largest economy.

Before we discuss what to keep an eye on this week, here are some fun facts about the CN50:

  • The index recently hit a fresh 2024 high.

  • It’s up over 5% year-to-date.

  • Rebounded roughly 15% from the mid-January low

CN50 bulls have drawn strength from government stimulus hopes with prices now knocking on critical resistance. Taking a quick look at the technical picture, prices are respecting a bullish channel on the daily charts.

With all the above said, here are 3 forces that could move the CN50 this week:

    1) China industrial profits

The main data release from China will be the industrial profits published on Wednesday.

Profits at large Chinese industrial companies are forecast to rise 9.0% in the first two months of 2024, after falling 2.3% in December 2023.

  • A figure that exceeds the 9% forecast could boost sentiment towards the Chinese economy, supporting the CN50 index as a result.
  • Should China’s industrial profits print below expectations, the CN50 could weaken amid growing concerns over the world’s second-largest economy.


    2) Big China bank earnings

Quarterly earnings from four of the biggest Chinese banks – Industrial and Commercial Bank of China, Bank of China, China Construction Bank, and Agricultural Bank of China among many others will be in focus. 

Note: Chinese banks have been under much stress due to consumers missing loan payments, especially in the real estate sector.

The latest quarterly earnings may provide some insight into where the property crises may be heading.

Given how banks make up just over 20% of the CN50’s weighting, the market response to the earnings could influence the index.

Note: Speaking of property crises, watch out for earnings from Country Garden and China Vanke published on Thursday. Although they are not part of the CN50 Index, they are heavyweights in the property industry with their results influencing sentiment towards the Chinese economy.

  • A positive set of earnings from Chinese big banks and the largest property companies could boost confidence in China’s economy, supporting the CN50 index.
  • Should overall earnings from banks and biggest property developers disappoint, CN50 bears may jump back into the scene.


    3) Technical forces 

The CN50 remains in an uptrend on the daily charts with prices trading above the 50, 100, and 200-day SMA. A breakout could be on the horizon with support found at 12000 and resistance at 12250.

  • A solid breakout and daily close above 12250 may encourage a move towards 12450.
  • Should prices secure a daily close back under 12000, this may inspire bears to target 11700.


Forex-Time-LogoArticle by ForexTime

ForexTime Ltd (FXTM) is an award winning international online forex broker regulated by CySEC 185/12 www.forextime.com

COT Stock Market Charts: Speculator Bets led by S&P 500 & EAFE

By InvestMacro

Here are the latest charts and statistics for the Commitment of Traders (COT) data published by the Commodities Futures Trading Commission (CFTC).

The latest COT data is updated through Tuesday March 19th and shows a quick view of how large traders (for-profit speculators and commercial entities) were positioned in the futures markets.

Weekly Speculator Changes led by SP500 & EAFE

The COT stock markets speculator bets were higher this week as all seven out of the seven stock markets we cover had higher positioning.

Leading the gains for the stock markets was the S&P500-Mini (45,658 contracts) with the MSCI EAFE-Mini (13,261 contracts), the Nasdaq-Mini (9,765 contracts), the DowJones-Mini (6,774 contracts), the VIX (4,316 contracts), the Russell-Mini (5,610 contracts) and the Nikkei 225 (1,171 contracts) also having positive weeks.


Stock Market Net Speculators Leaderboard

Legend: Weekly Speculators Change | Speculators Current Net Position | Speculators Strength Score compared to last 3-Years (0-100 range)


Strength Scores led by DowJones-Mini & Russell-Mini

COT Strength Scores (a normalized measure of Speculator positions over a 3-Year range, from 0 to 100 where above 80 is Extreme-Bullish and below 20 is Extreme-Bearish) showed that the DowJones-Mini (97 percent) and the Russell-Mini (76 percent) lead the stock markets this week. The VIX (67 percent) and Nikkei 225 Yen (61 percent) come in as the next highest in the weekly strength scores.

On the downside, the S&P500-Mini (36 percent) comes in at the lowest strength level currently.

Strength Statistics:
VIX (66.6 percent) vs VIX previous week (62.0 percent)
S&P500-Mini (35.8 percent) vs S&P500-Mini previous week (29.0 percent)
DowJones-Mini (96.8 percent) vs DowJones-Mini previous week (85.8 percent)
Nasdaq-Mini (56.5 percent) vs Nasdaq-Mini previous week (41.3 percent)
Russell2000-Mini (75.5 percent) vs Russell2000-Mini previous week (71.5 percent)
Nikkei USD (56.4 percent) vs Nikkei USD previous week (48.2 percent)
EAFE-Mini (58.5 percent) vs EAFE-Mini previous week (44.7 percent)


MSCI EAFE-Mini & Nikkei 225 top the 6-Week Strength Trends

COT Strength Score Trends (or move index, calculates the 6-week changes in strength scores) showed that the MSCI EAFE-Mini (23 percent) leads the past six weeks trends for the stock markets. The Nikkei 225 (15 percent), the S&P500-Mini (6 percent) and the VIX (5 percent) are the next highest positive movers in the latest trends data.

The Nasdaq-Mini (-34 percent) leads the downside trend scores currently.

Strength Trend Statistics:
VIX (4.5 percent) vs VIX previous week (5.9 percent)
S&P500-Mini (5.8 percent) vs S&P500-Mini previous week (-2.1 percent)
DowJones-Mini (2.4 percent) vs DowJones-Mini previous week (-14.2 percent)
Nasdaq-Mini (-33.7 percent) vs Nasdaq-Mini previous week (-58.7 percent)
Russell2000-Mini (4.6 percent) vs Russell2000-Mini previous week (-6.1 percent)
Nikkei USD (14.6 percent) vs Nikkei USD previous week (9.0 percent)
EAFE-Mini (23.4 percent) vs EAFE-Mini previous week (8.9 percent)


Individual Stock Market Charts:

VIX Volatility Futures:

VIX Volatility Futures COT ChartThe VIX Volatility large speculator standing this week resulted in a net position of -44,790 contracts in the data reported through Tuesday. This was a weekly increase of 4,316 contracts from the previous week which had a total of -49,106 net contracts.

This week’s current strength score (the trader positioning range over the past three years, measured from 0 to 100) shows the speculators are currently Bullish with a score of 66.6 percent. The commercials are Bearish with a score of 33.0 percent and the small traders (not shown in chart) are Bullish with a score of 76.8 percent.

Price Trend-Following Model: Weak Uptrend

Our weekly trend-following model classifies the current market price position as: Weak Uptrend. The current action for the model is considered to be: New Buy – Long Position.

VIX Volatility Futures StatisticsSPECULATORSCOMMERCIALSSMALL TRADERS
– Percent of Open Interest Longs:17.947.77.3
– Percent of Open Interest Shorts:29.834.88.3
– Net Position:-44,79048,644-3,854
– Gross Longs:67,646179,88727,545
– Gross Shorts:112,436131,24331,399
– Long to Short Ratio:0.6 to 11.4 to 10.9 to 1
NET POSITION TREND:
– Strength Index Score (3 Year Range Pct):66.633.076.8
– Strength Index Reading (3 Year Range):BullishBearishBullish
NET POSITION MOVEMENT INDEX:
– 6-Week Change in Strength Index:4.5-4.91.5


S&P500 Mini Futures:

SP500 Mini Futures COT ChartThe S&P500 Mini large speculator standing this week resulted in a net position of -194,169 contracts in the data reported through Tuesday. This was a weekly rise of 45,658 contracts from the previous week which had a total of -239,827 net contracts.

This week’s current strength score (the trader positioning range over the past three years, measured from 0 to 100) shows the speculators are currently Bearish with a score of 35.8 percent. The commercials are Bullish with a score of 55.1 percent and the small traders (not shown in chart) are Bullish with a score of 70.5 percent.

Price Trend-Following Model: Strong Uptrend

Our weekly trend-following model classifies the current market price position as: Strong Uptrend. The current action for the model is considered to be: Hold – Maintain Long Position.

S&P500 Mini Futures StatisticsSPECULATORSCOMMERCIALSSMALL TRADERS
– Percent of Open Interest Longs:12.373.512.5
– Percent of Open Interest Shorts:21.668.28.5
– Net Position:-194,169110,10184,068
– Gross Longs:258,1691,539,140261,988
– Gross Shorts:452,3381,429,039177,920
– Long to Short Ratio:0.6 to 11.1 to 11.5 to 1
NET POSITION TREND:
– Strength Index Score (3 Year Range Pct):35.855.170.5
– Strength Index Reading (3 Year Range):BearishBullishBullish
NET POSITION MOVEMENT INDEX:
– 6-Week Change in Strength Index:5.8-7.15.1


Dow Jones Mini Futures:

Dow Jones Mini Futures COT ChartThe Dow Jones Mini large speculator standing this week resulted in a net position of 22,445 contracts in the data reported through Tuesday. This was a weekly increase of 6,774 contracts from the previous week which had a total of 15,671 net contracts.

This week’s current strength score (the trader positioning range over the past three years, measured from 0 to 100) shows the speculators are currently Bullish-Extreme with a score of 96.8 percent. The commercials are Bearish-Extreme with a score of 2.5 percent and the small traders (not shown in chart) are Bullish with a score of 54.6 percent.

Price Trend-Following Model: Strong Uptrend

Our weekly trend-following model classifies the current market price position as: Strong Uptrend. The current action for the model is considered to be: Hold – Maintain Long Position.

Dow Jones Mini Futures StatisticsSPECULATORSCOMMERCIALSSMALL TRADERS
– Percent of Open Interest Longs:38.045.214.9
– Percent of Open Interest Shorts:14.171.412.6
– Net Position:22,445-24,6322,187
– Gross Longs:35,68842,38513,967
– Gross Shorts:13,24367,01711,780
– Long to Short Ratio:2.7 to 10.6 to 11.2 to 1
NET POSITION TREND:
– Strength Index Score (3 Year Range Pct):96.82.554.6
– Strength Index Reading (3 Year Range):Bullish-ExtremeBearish-ExtremeBullish
NET POSITION MOVEMENT INDEX:
– 6-Week Change in Strength Index:2.4-1.3-2.6


Nasdaq Mini Futures:

Nasdaq Mini Futures COT ChartThe Nasdaq Mini large speculator standing this week resulted in a net position of 11,160 contracts in the data reported through Tuesday. This was a weekly advance of 9,765 contracts from the previous week which had a total of 1,395 net contracts.

This week’s current strength score (the trader positioning range over the past three years, measured from 0 to 100) shows the speculators are currently Bullish with a score of 56.5 percent. The commercials are Bearish with a score of 33.3 percent and the small traders (not shown in chart) are Bullish-Extreme with a score of 91.7 percent.

Price Trend-Following Model: Uptrend

Our weekly trend-following model classifies the current market price position as: Uptrend. The current action for the model is considered to be: Hold – Maintain Long Position.

Nasdaq Mini Futures StatisticsSPECULATORSCOMMERCIALSSMALL TRADERS
– Percent of Open Interest Longs:27.355.515.7
– Percent of Open Interest Shorts:22.862.513.2
– Net Position:11,160-17,5266,366
– Gross Longs:68,217138,89739,354
– Gross Shorts:57,057156,42332,988
– Long to Short Ratio:1.2 to 10.9 to 11.2 to 1
NET POSITION TREND:
– Strength Index Score (3 Year Range Pct):56.533.391.7
– Strength Index Reading (3 Year Range):BullishBearishBullish-Extreme
NET POSITION MOVEMENT INDEX:
– 6-Week Change in Strength Index:-33.722.92.1


Russell 2000 Mini Futures:

Russell 2000 Mini Futures COT ChartThe Russell 2000 Mini large speculator standing this week resulted in a net position of -13,484 contracts in the data reported through Tuesday. This was a weekly rise of 5,610 contracts from the previous week which had a total of -19,094 net contracts.

This week’s current strength score (the trader positioning range over the past three years, measured from 0 to 100) shows the speculators are currently Bullish with a score of 75.5 percent. The commercials are Bearish with a score of 23.9 percent and the small traders (not shown in chart) are Bullish with a score of 56.6 percent.

Price Trend-Following Model: Uptrend

Our weekly trend-following model classifies the current market price position as: Uptrend. The current action for the model is considered to be: Hold – Maintain Long Position.

Russell 2000 Mini Futures StatisticsSPECULATORSCOMMERCIALSSMALL TRADERS
– Percent of Open Interest Longs:14.778.66.0
– Percent of Open Interest Shorts:17.577.54.3
– Net Position:-13,4845,2738,211
– Gross Longs:69,077370,39628,373
– Gross Shorts:82,561365,12320,162
– Long to Short Ratio:0.8 to 11.0 to 11.4 to 1
NET POSITION TREND:
– Strength Index Score (3 Year Range Pct):75.523.956.6
– Strength Index Reading (3 Year Range):BullishBearishBullish
NET POSITION MOVEMENT INDEX:
– 6-Week Change in Strength Index:4.6-2.1-11.0


Nikkei Stock Average (USD) Futures:

Nikkei Stock Average (USD) Futures COT ChartThe Nikkei Stock Average (USD) large speculator standing this week resulted in a net position of -1,421 contracts in the data reported through Tuesday. This was a weekly rise of 1,171 contracts from the previous week which had a total of -2,592 net contracts.

This week’s current strength score (the trader positioning range over the past three years, measured from 0 to 100) shows the speculators are currently Bullish with a score of 56.4 percent. The commercials are Bearish with a score of 34.0 percent and the small traders (not shown in chart) are Bullish with a score of 65.3 percent.

Price Trend-Following Model: Strong Uptrend

Our weekly trend-following model classifies the current market price position as: Strong Uptrend. The current action for the model is considered to be: Hold – Maintain Long Position.

Nikkei Stock Average Futures StatisticsSPECULATORSCOMMERCIALSSMALL TRADERS
– Percent of Open Interest Longs:8.066.525.5
– Percent of Open Interest Shorts:16.268.315.5
– Net Position:-1,421-3131,734
– Gross Longs:1,38611,4924,413
– Gross Shorts:2,80711,8052,679
– Long to Short Ratio:0.5 to 11.0 to 11.6 to 1
NET POSITION TREND:
– Strength Index Score (3 Year Range Pct):56.434.065.3
– Strength Index Reading (3 Year Range):BullishBearishBullish
NET POSITION MOVEMENT INDEX:
– 6-Week Change in Strength Index:14.6-13.21.9


MSCI EAFE Mini Futures:

MSCI EAFE Mini Futures COT ChartThe MSCI EAFE Mini large speculator standing this week resulted in a net position of -7,682 contracts in the data reported through Tuesday. This was a weekly lift of 13,261 contracts from the previous week which had a total of -20,943 net contracts.

This week’s current strength score (the trader positioning range over the past three years, measured from 0 to 100) shows the speculators are currently Bullish with a score of 58.5 percent. The commercials are Bearish with a score of 38.5 percent and the small traders (not shown in chart) are Bearish with a score of 48.5 percent.

Price Trend-Following Model: Strong Uptrend

Our weekly trend-following model classifies the current market price position as: Strong Uptrend. The current action for the model is considered to be: Hold – Maintain Long Position.

MSCI EAFE Mini Futures StatisticsSPECULATORSCOMMERCIALSSMALL TRADERS
– Percent of Open Interest Longs:8.788.62.4
– Percent of Open Interest Shorts:10.488.30.9
– Net Position:-7,6821,3696,313
– Gross Longs:38,124390,36910,384
– Gross Shorts:45,806389,0004,071
– Long to Short Ratio:0.8 to 11.0 to 12.6 to 1
NET POSITION TREND:
– Strength Index Score (3 Year Range Pct):58.538.548.5
– Strength Index Reading (3 Year Range):BullishBearishBearish
NET POSITION MOVEMENT INDEX:
– 6-Week Change in Strength Index:23.4-24.87.6


Article By InvestMacroReceive our weekly COT Newsletter

*COT Report: The COT data, released weekly to the public each Friday, is updated through the most recent Tuesday (data is 3 days old) and shows a quick view of how large speculators or non-commercials (for-profit traders) were positioned in the futures markets.

The CFTC categorizes trader positions according to commercial hedgers (traders who use futures contracts for hedging as part of the business), non-commercials (large traders who speculate to realize trading profits) and nonreportable traders (usually small traders/speculators) as well as their open interest (contracts open in the market at time of reporting). See CFTC criteria here.

SG20 index: more dividends, less volatility

By ForexTime

  • FXTM launches brand new SG20 stock index
  • SG20 has highest dividend yield of all FXTM stock indices
  • SG20: most stable Asian stock index within FXTM universe
  • SG20 has strong positive correlation with spot gold
  • Wall Street forecasts that this stock index could rise by another 14%


FXTM’s new SG20 index may be enticing for range traders who enjoy consistent cash payouts.


What is a stock index?

Imagine a stock index being a basket of many different stocks.

The index measures the overall performance of those stocks inside that “basket”.


What does the SG20 stock index track?

FXTMs SG20 stock index tracks the performance of the MSCI Singapore Index.

Note that this MSCI Singapore index is not the same as the benchmark Straits Times index, which is maintained by the FTSE.

This MSCI Singapore index aims to capture the overall performance of 22 different large- and mid-cap stocks in Singapore.

Together, those 22 stocks make up about 85% of the entire Singaporean stock market.


3 key things to know about the SG20 index:


1) Singaporean banks are the largest members of this index

Singapore is a city-state that is also known for its status as a “safe haven”, especially for the Asian region.

As a result, its financial sector tends to attract outsized fund inflows, benefitting its banks.

No surprise then that DBS Group, OBCB Bank, and UOB, combine to make up nearly half (48.17%) of the entire SG20 index.


2) Least volatile Asian stock index within FXTM universe

Of the 6 different Asian stock indices, the SG20 index has the lowest 30-day volatility figure, as of today (Tuesday, March 19th).

  • SDG20: 10.9
  • TWN: 13.2
  • JP225: 15.8
  • CN50: 17.1
  • HK50: 23.6
  • CHINAH: 27.5


Here are more data points to showcase the SG20 index’s relative stability:

  • SG20 index is faring better than Singapore’s benchmark Straits Times index

The SG20 index is up 1.25% so far in 2024.

Compare that to Singapore’s benchmark stock index (FTSE Straits Times index), which has dropped by by more than 2% so far in 2024.

While the performance of Singaporean stocks are in stark contrast to the many stock indices around the world that have printed fresh record highs this year …

SG20 index appears to putting in a relatively steady shift so far this year.
 

  • SG20 index has a strong correlation with gold

To buffer the notion of Singapore as a “safe haven”, this SG20 index tends to mirror the performance of another famed “safe haven” asset: gold.

Over any given 5-day period from the past 20 years, both XAUUSD (gold) and this SG20 index have moved in the same direction 51% of the time (positive correlation.

NOTE: According to Bloomberg data, gold and SG20 have a positive correlation of 0.51, over a rolling 5-day period from the past 20 years. A number of 0.5 or higher indicates a strong correlation.


3) SG20 has highest dividend yield of all FXTM Stock Indices

Over the past 12 months, this SG20 index has paid out a dividend yield of 4.7% (based on current prices).

That’s significantly higher than the dividend yields currently offered by other popular stock indices (based on current prices):

  • UK100: 4%
  • EU50: 2.9%
  • JP225: 1.6%
  • US500: 1.4%
  • NAS100: 0.8%


But wait, there’s more!

Over the next 12 months, Wall Street analysts forecast that members of the SG20 index will pay out EVEN MORE dividends.

This is expected to bring the forward 12-month yield up to 4.9%.


What is a “dividend yield”?

Dividend yield is a % number representing how much money an investor gets for buying and holding an asset.

The higher the yield, the more dividends the investor receives, as a ratio of what was originally invested.

Dividends are cash rewards that are given by companies (in this case, companies that are included in the SG20 index) to its shareholders.

Hence, holders of assets linked to the SG20 index, such as Exchange-Traded Funds (ETF) or even Contracts for Differences (CFD), often are entitled to similar dividends as well.


Where’s SG20 headed next?

Over the next 12 months, Wall Street analysts predict this SG20 index could return to the 330 mark.

From current prices, this implies about 14% in potential gains.

For proper context, a number around 330 would only restore the SG20 index to levels not seen since 2022.

That would still pale in comparison to the SG20 index’s all-time intraday high of 481.23 posted 10th October 2007, before the Global Financial Crisis.


SG20 bulls (those hoping that prices will rise) will be hoping that the Asian “safe haven” economy can continue registering steady growth, benefitting the city-state’s financial sector along the way.

If such an outlook proves true, then …

Traders and investors may yet enjoy more gains amid less-volatile prices, while collecting healthy dividends along the way.


Forex-Time-LogoArticle by ForexTime

ForexTime Ltd (FXTM) is an award winning international online forex broker regulated by CySEC 185/12 www.forextime.com