Archive for Stock Market News – Page 16

S&P 500 index hits record high amidst lower inflation

By RoboForex Analytical Department

The US stock market has surged to new heights, with the S&P 500 index reaching a record high of 5,325 points and the DJIA index touching 40,000 points. Investors are experiencing euphoria, spurred by the unexpectedly low US inflation figures released earlier.

Inflation has recently been a critical driver of market volatility, thus its stabilisation is a cause for significant optimism. The April CPI increase, lower than expected at just 0.3% month-on-month, suggests a potential return to a downward inflation trajectory. Year-on-year, the CPI climbed by 3.4% in April, a slight dip from 3.5% in March. Inflation peaked in June 2022 at 9.1%, and while there was progress, the current deceleration is encouraging for investors.

The April inflation report marked the first decline in year-on-year inflation since January 2024. The CPI rose slower, raising market hopes that the Federal Reserve might soon ease monetary conditions.

Technical analysis of S&P 500

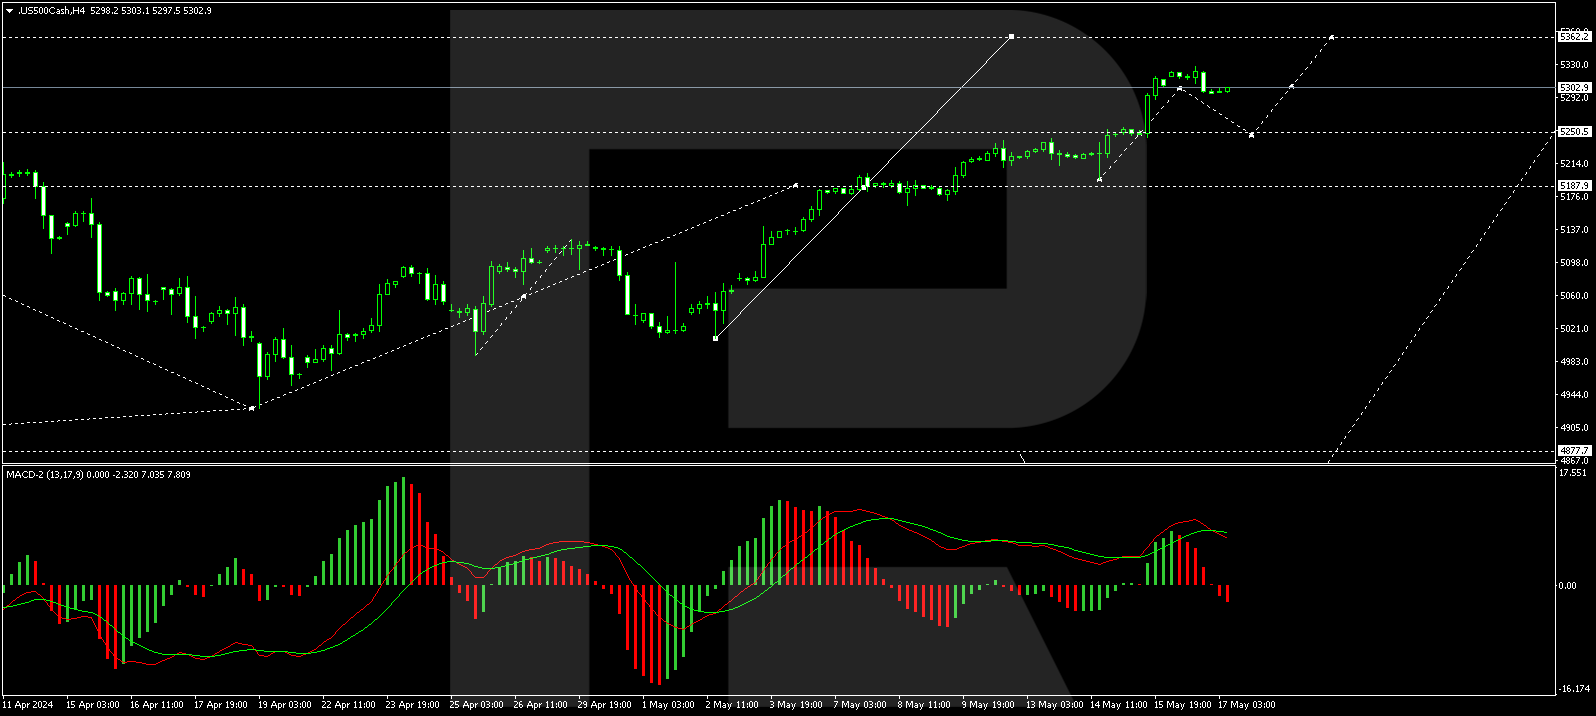
On the H4 chart of the S&P 500 index, a consolidation range has formed around the 5188.0 level. With an upward breakout, extending the fifth wave to 5363.0 is possible. The growth link to 5315.0 has been executed, and we now expect a consolidation range to form around this level. A downward breakout could lead to a range expansion to 5250.5, while an upward breakout could extend to 5363.0. The market is developing the fifth wave of growth without any significant correction, and a sharp decline along the trend to 4735.0 could begin at any moment. This scenario is technically supported by the MACD indicator, with its signal line at the maximums and pointing strictly downwards.

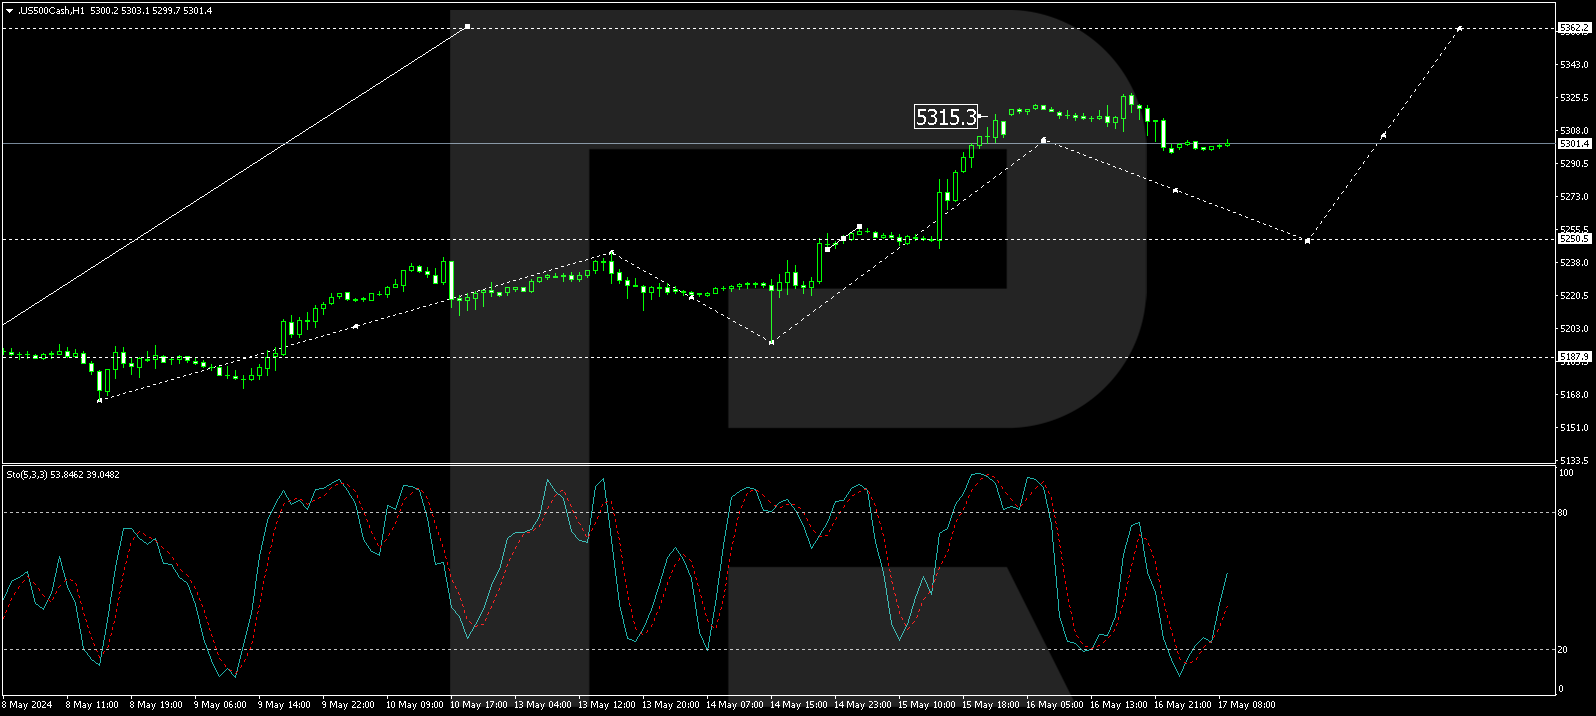
On the H1 chart, the upward move to 5315.5 has been completed. A consolidation range is forming around this level, and a downward impulse to 5296.0 has been fulfilled. We expect a growth link to 5315.5 (testing from below) today. A downward breakout from the range could lead to a continuation of the decrease wave to 5250.5. The Stochastic oscillator technically confirms this scenario, with its signal line above 20 and expected to rise to 80, indicating a potential for continued growth.

Disclaimer

Any forecasts contained herein are based on the author’s particular opinion. This analysis may not be treated as trading advice. RoboForex bears no responsibility for trading results based on trading recommendations and reviews contained herein.

Meme-stock mania: Will GameStop, AMC stocks surge even higher?

By ForexTime

  • GameStop ↑ 179% this week
  • ↑ as much as 32.6% pre-market
  • 2nd most traded US stock pre-market
  • Is meme stock craze here to stay?
  • Heavily bullish on D1 chart

In case you missed it, GameStop and other pandemic-era meme stocks roared back to life!

The trigger? “Roaring Kitty”, a.k.a. Keith Gill posted one cryptic meme.

Source: Twitter 

For anyone asking – a meme stock is a stock that has essentially gone viral among retail investors, ignoring the core fundamentals.

To put things into context, this week:

  • GameStop: up 179%
  • AMC stocks: up 135%
  • Beyond Meat: 12%
  • Blackberry: almost 20%

Is the mania here to stay?

Well, GameStop shares rose as much as 32.6% in today’s pre-market, while AMC jumped as much as 23%! In addition, they are also the two most traded US stocks pre-market!

A blast from the past…

The aggressively bullish price action this week certainly creates a sense of Déjà vu…

Taking a trip back memory lane, “Roaring Kitty” was at the heart of the meme craze in 2021 that saw a fierce battle between retail traders and hedge funds.

GameStop soared more than 2000% in early 2021 as retail traders banded together. As prices rose, short sellers were squeezed out of their position – fueling upside gains!

However, after peaking in January prices came crashing down within weeks as the excitement fizzled.

One of the biggest takeaways was that while meme stocks may surge due to growing interest, they may fall as fast if sentiment shifts. This was reflected in price action as GameStop gave back most of its eye-popping gains in a two-week window.

Looking ahead 

If the mania continues, GameStop and AMC among other meme stocks are likely to ignore the incoming US CPI report.

How long will this mania last? It is anybody’s guess but looking at what happened in 2021, GameStop witnessed 9 consecutive days of double-digit gains/losses.

Although the current rally has nothing to do with technicals or fundamentals, the charts show that bulls are in the driving seat. More volatility could be on the cards if this mania is here to stay.


Forex-Time-LogoArticle by ForexTime

ForexTime Ltd (FXTM) is an award winning international online forex broker regulated by CySEC 185/12 www.forextime.com

Sports gambling creates a windfall, but raises questions of integrity – here are three lessons from historic sports-betting scandals

By Jared Bahir Browsh, University of Colorado Boulder 

Sports betting is having a big moment across the United States. While gambling on sports has been legal for decades in countries such as the U.K., it wasn’t until 2018 that the U.S. Supreme Court ruled that states could legalize sports betting. Before then, sports betting had been permitted only in Nevada.

After the Supreme Court decision, the floodgates opened. Many states were happy to legalize sports gambling, enticed by the opportunity for more tax revenue. As of May 2024, sports gambling is legal in 38 states and Washington, D.C. Americans wagered nearly US$120 billion on sports in 2023 alone.

Until about 10 years ago, sports leagues in North America were apprehensive about – if not totally against – legalizing sports betting. The long history of sports gambling scandals in the U.S. led many to worry that legalizing sports betting would tarnish their sports’ credibility and image. The NCAA was one of many governing bodies that objected to legalizing sports gambling nationwide.

But now that the Supreme Court has blessed it, sports leagues have embraced gambling, forming partnerships with brands like Caesars Entertainment. The sportsbooks and platforms have integrity monitors to track potential inconsistencies. Still, a number of scandals involving athletes and the people around them have emerged since the Supreme Court ruling.

As a professor of critical sports studies, I teach students about the history of sports betting scandals. And I think they offer lessons for the present day.

Disgruntled players and pay disputes lead to temptation

The Black Sox Scandal of 1919 helped to further organize baseball, leading to the creation of the position of commissioner of baseball, which was first assumed by former judge and known racist Kennesaw Mountain Landis. Along with maintaining the color line, arguably his most notable action was banning, for life, the players on the Chicago White Sox involved in the fixing of the 1919 World Series.

Early professional baseball regulations explicitly banned gambling, but the money was too tempting for many players to ignore – and that included members of the 1919 White Sox. The players hated the team’s owner, Charles Comiskey, and felt that they were underpaid. But they were unable to change teams due to the reserve clause in their contracts, which gave owners exclusive rights to their players in perpetuity.

A faction of the team agreed to throw the World Series. Those players were ultimately indicted by a grand jury and went to trial. They were acquitted of criminal charges, but Landis suspended all of the players connected to the fix – including superstar “Shoeless” Joe Jackson, who admitted taking money from a teammate but maintained he was innocent of game fixing.

This was the the most notable of several attempts to fix baseball games early in the 20th century, as the game grew in popularity and a number of people associated with baseball, including players, managers and even umpires, looked to cash in.

Addiction isn’t limited to substances

Athlete salaries have soared in recent decades. However, this money hasn’t shielded players and others involved in sports from the grips of gambling addiction.

There are no rules banning athletes from sitting at a blackjack table or even gambling on other sports. Numerous players have wagered millions of dollars, with some athletes building up massive debts due to addiction.

These debts can lead to such desperation that athletes decide to risk their careers. Baseball legend and admitted compulsive gambler Pete Rose continues to sit outside the Hall of Fame because he bet on baseball games.

The most substantial gambling scandal in modern sports came in the NBA during the 2000s, involving referee Tim Donaghy. He admitted to providing information on NBA games, including those he officiated, which allegedly influenced his calls. Donaghy served time in prison as a result. So it isn’t just players who get in trouble.

Unpaid student-athletes are especially vulnerable to improprieties – and harassment

There have been several major point-shaving scandals in college basketball history, most famously at the City College of New York in the 1950s and at Boston College in the late 1970s – the latter of which involved Henry Hill, the subject of the blockbuster film “Goodfellas.”

The increasing use of prop, or proposition, bets, which focus on a specific outcome within a game rather than the overall result, has created a new point of vulnerability for student-athletes. While influencing an entire team is hard, history shows that individual players are more susceptible to pressure. A point guard or quarterback can slow down the game and reduce the margin of victory.

And while today’s unpaid student-athletes have the same financial incentives to cheat as earlier generations did, they face a new pressure: They’re often surrounded by gamblers on campus and on social media. Betting is pervasive not only at large universities but at smaller schools, too. According to NCAA surveys, 1 in 3 student-athletes have faced harassment from gamblers, ranging from derogatory comments to death threats.

New regulations and oversight measures could help

The sportsbooks have very little incentive to address potential violations, so it’s up to organizations that oversee sports to ensure the integrity of their games.

NCAA President Charlie Baker’s suggestion to ban prop bets is a good first step: The more individual players and gameplay are isolated, the easier it is for improprieties to occur.

Providing more guidance for players – and different types of punishments for different transgressions – could also be useful. Gambling violations that don’t affect competition outcomes should be treated differently from ones that do. The NCAA already does this by meting out lighter penalties for student-athletes who wager on other teams and sports as opposed to their own.

Providing treatment for players and others suffering from gambling addiction would be helpful as well, and there’s some evidence that open discussions of gambling addiction in European soccer have had a positive impact.

NBA Commissioner Adam Silver has suggested implementing federal oversight to eliminate the uncertainty of state-by-state regulations. Although scandals are still likely to occur, gambling commissions like the one in the U.K. can provide a framework for federal licensing and oversight.

The suddenness of states adopting sports betting has led to a windfall of profit for gambling companies and tax revenue for the states. But it may also endanger the integrity of sports. As policymakers mull how to address the issue, they might be wise to learn from history.The Conversation

About the Author:

Jared Bahir Browsh, Assistant Teaching Professor of Critical Sports Studies, University of Colorado Boulder

This article is republished from The Conversation under a Creative Commons license. Read the original article.


Trade of the Week: CHINAH to extend lead as Asia’s winner?

By ForexTime 

  • CHINAH overtakes JP225 in year-to-date gains
  • Earnings from Tencent, Meituan, Alibaba etc. may cause CHINAH to climb/fall
  • Traders also watching China rate decision and US CPI
  • CHINAH at risk of technical pullback, despite bullish “golden cross”
  • CHINAH forecasted to climb another 15.3% over next 12 months


There’s a new winner among FXTM’s Asian stock indices!

The CHINAH stock index has now overtaken the JP225 index, with the latter previously holding the most year-to-date gains among major stock indices worldwide throughout Q1 (January-March) 2024.

However, CHINAH has been on a tear, climbing as much as 19.75% since that mid-April trough.

NOTE: FXTM’s CHINAH stock index mirrors the performance of the underlying Hang Seng China Enterprises index.
It tracks 50 of the largest and most liquid stocks from Mainland China that are listed in Hong Kong.


Following the surge in recent weeks, CHINAH is now trading at its highest levels since August 2023.


For reference, here’s the current year-to-date standings among FXTM’s Asian stock indices:

  • CHINAH: +17.2%
  • JP225: +14.1%
  • TWN: +13.1%
  • HK50: +12.1%
  • CN50: +9.9%
  • SG20: +6.7%


Why are China’s stock markets climbing?

Chinese stocks have been boosted by hopes that the government is stepping in to support the economy.

Much has already been made about how China, the world’s second-largest economy, have faltered in its post-pandemic recovery, lagging behind other major economies.

China’s sluggish economic performance in turn weighed down its stock markets, with the Hang Seng China Enterprises index posting 4 consecutive years of declines!

But now, with Beijing’s boosters on the way, such optimism is in turn fuelling a recovery in Chinese stock indices.

Just today (Monday, May 13th), China’s Ministry of Finance announced the sale of about 1 trillion yuan (about US$138 billion) in government bonds, beginning this Friday (May 17th) through November.

The 1 trillion yuan raised from this bond sales – only the 4th of its kind in 26 years – will be used to support China’s economic growth.

The news is sending CHINAH 0.6% higher today!


What could move CHINAH higher/lower this week?


1) Chinese stocks’ earnings: May 14th – 16th

8 of the CHINAH stock index’s 50 members are due to report their respective quarterly earnings this week.

This lineup includes 3 of the 4 biggest members of the Hang Seng China Enterprises index, namely Tencent, Meituan, and Alibaba.

These 8 reporting companies combined account for 30% of the entire CHINAH stock index!

Hence, the market’s overall reaction to these upcoming earnings announcements, either positive or negative, could move the broader stock index up/down as well.


2) China policy rate: Wednesday, May 15th

The People’s Bank of China (PBoC) is expected to maintain its one-year medium-term lending facility (MLF) rate unchanged at 2.5%.

Although the Chinese economy could do with even more support, from both the government (fiscal policy) as well as the central bank (monetary policy), the PBoC may want to hold off on lowering this rate so as not to further weaken the Chinese Yuan currency.

In the unlikely event of a surprise rate cut by the PBoC this week, that’s likely to jolt the CHINAH stock index even higher!


3) US April consumer price index (CPI): Wednesday, May 15th

The consumer price index (CPI) is a widely used gauge to measure a country’s inflation rate.

The US CPI is one of the most closely-watched economic data that could rock financial assets around the world, including FX markets, gold, and stock indexes!

After all, the world’s most-important central bank, the US Federal Reserve, currently finds itself in an ongoing battle in slowing down still-stubborn inflation in the world’s largest economy.


Here are the forecasts from economists for this week’s US CPI prints

  • CPI month-on-month (April 2024 vs. March 2024): 0.4%
    If so, that would match March’s 0.4% month-on-month figure
  • CPI year-on-year (April 2024 vs. April 2023): 3.4%
    If so, that would be slightly lower than March’s 3.5% year-on-year figure
  • Core CPI (excluding food and energy prices) month-on-month: 0.3%
    If so, that would be slightly lower than March’s 0.4% month-on-month figure
  • Core CPI year-on-year: 3.6%
    If so, that would be lower than March’s 3.8% year-on-year figure

Higher-than-expected CPI figures may drag down stock indexes around the world, including the CHINAH (and vice versa).


Key levels this week

POTENTIAL RESISTANCE:

  • 6877: cycle high from mid-June 2023
  • 7000: psychologically-important level


POTENTIAL SUPPORT:

  • 6417.9: May 8th intraday low (recent technical pullback)
  • 6200: psychological round number; April 30th closing price; 21-day simple moving average


Beware of potential technical pullback

Note that the 14-day relative strength index (RSI) is already above the 70 level which marks “overbought” territory.

Hence, from a technical perspective, a slight pullback may be in order.

However, once CHINAH can clear some of the froth from its recent ascent, this stock index may well resume its uptrend, provided that this week’s fundamental events do support the upside scenario.


“Golden cross” offers technical bullish signal?

Looking at first chart above, the CHINAH recently formed a “golden cross”.

A “golden cross” is a technical pattern when an asset’s 50-day simple moving average (SMA) crosses above its 200-day counterpart.

A “golden cross” is often used as a technical sign that the asset’s prices can climb further: a “bullish” signal.


However, recent “golden crosses” had produced mixed results:

  • Late January 2023

The last time that the Hang Seng China Enterprises index formed a “golden cross”, it didn’t go as planned.

This stock index fell by 36.4% in the 12 months (January 2023 until January 2024) after the last “golden cross” was formed.


  • Late-November 2020

Still, the “golden cross” prior did adhere to the textbook scenario.

The Hang Seng China Enterprises index soared by 16.2% between November 2020 through February 2021.


How much higher can CHINAH go?

Analysts forecast that the Hang Seng China Enterprises index can climb by a further 15.3% and flirt with the 7800 level in 12 months from now (by May 2025).

If so, that would restore the CHINAH stock index back to its end-June 2022 peak!


However, the road back to such heights will be measured one step at a time.

This week’s events may well determine whether CHINA is firmly on the path upwards.


Forex-Time-LogoArticle by ForexTime

ForexTime Ltd (FXTM) is an award winning international online forex broker regulated by CySEC 185/12 www.forextime.com

The German index has hit an all-time high. China sees rising consumer inflation

By JustMarkets

On Friday, the Dow Jones (US30) Index gained 0.32% (for the week +1.94%), while the S&P 500 (US500) Index gained 0.16% (for the week +1.56%). The NASDAQ Technology Index (US100) closed negative 0.03% (for the week +0.82%).

On Friday, several FOMC officials gave their comments on plans. Fed Chair Michelle Bowman said that the Fed needs to maintain confidence in inflation by moving cautiously and deliberately toward our 2% target. She said the Fed needs to keep rates unchanged for a while longer. In addition, Atlanta Fed President Raphael Bostic told Reuters in an interview that he expects only one 25 bps rate cut this year, which will come at the end of the year. Dallas Fed President Lorie Logan said it was too early to consider a rate cut. Minneapolis Fed President Neel Kashkari said the Fed is waiting to see if inflation slows. He also said he did not rule out the need for another rate hike, although he noted that the bar would be high for such a decision. Chicago Fed President Austan Goolsbee, who takes a less hawkish view, said there is little evidence that inflation has stalled at 3%.

The University of Michigan’s preliminary May Consumer Sentiment Index fell 9.8 points to a 6-month low of 67.4, weaker than market expectations. At the same time, US consumers’ inflation expectations rose. The expected inflation indicator from the University of Michigan for May rose by 0.3 points to 3.5% from April’s 3.2% and was stronger than expectations of an unchanged 3.2%. In addition, the May 5–10-year inflation expectations indicator rose to 3.1% from April’s 3.0%.

Equity markets in Europe were mostly up on Friday. The German DAX (DE40) rose by 0.46% (for the week +4.29%), the French CAC 40 (FR40) closed Friday up 0.38% (for the week +3.05%), the Spanish IBEX 35 (ES35) added 0.50% (for the week +2.09%), the British FTSE 100 (UK100) closed positive 0.63% (for the week +3.20%).

The DAX (DE40) index gained nearly 0.5% on Friday to close at a record high of 18,773, extending its weekly gain to 4.3% as investors remain optimistic that major central banks will soon begin cutting interest rates. Minutes from the ECB’s latest meeting coincided with the current view that the Central Bank should cut rates in June as the cycle’s governor agreed that inflation is approaching the target faster. Positive corporate developments also boosted sentiment. Siemens shares jumped by 2.3%, closing at an all-time high among the leaders.

WTI crude oil prices fell below $78 a barrel on Monday, extending losses from the previous session as uncertainty over demand pressured the market. Oil prices fell more than 1% on Friday as US Federal Reserve officials signaled that interest rates could remain elevated for a long time, dampening growth and fuel demand in the world’s top oil consumer. Meanwhile, investors are looking ahead to the upcoming OPEC meeting in early June, where the group is expected to extend supply cuts for the year’s second half.

Asian markets were mostly up last week. Japan’s Nikkei 225 (JP225) rose by 0.59%, China’s FTSE China A50 (CHA50) lost 0.32% for the week, Hong Kong’s Hang Seng (HK50) gained 2.57% for the week, and Australia’s ASX 200 (AU200) was positive 1.57%.

China’s annualized inflation rate for April 2024 rose to 0.3% compared to market estimates and March’s 0.1%. This was the third consecutive month of rising consumer inflation amid a continued recovery in domestic demand despite a fragile economic recovery. On the other hand, producer prices in China fell to 2.5% y/y in April 2024, compared to market forecasts of a 2.3% y/y drop following a 2.8% y/y decline in March. The figure marked the 19th consecutive month of factory price declines, underscoring continued economic uncertainty despite numerous support measures from the government. The offshore yuan depreciated around 7.24 per dollar, reacting to key economic data from China.

The NAB Australia Business Confidence Index for April 2024 stood at 1, unchanged for the second consecutive month and below its long-term average. Weak sentiment in retail, wholesale trade, and mining offset leisure and personal services, construction, and manufacturing improvements.

S&P 500 (US500) 5,222.68 +8.60 (+0.16%)

Dow Jones (US30) 39,512.84 +125.08 (+0.32%)

DAX (DE40) 18,772.85 +86.25 (+0.46%)

FTSE 100 (UK100) 8,433.76 +52.41 (+0.63%)

USD Index 105.31 +0.09 (+0.09%)

Important events today:
  • – Australia NAB Business Confidence (m/m) at 04:30 (GMT+3);
  • – New Zealand Inflation Expectations (m/m) at 06:00 (GMT+3);
  • – Canada Building Permits (m/m) at 15:30 (GMT+3);
  • – US FOMC Member Mester Speaks at 16:00 (GMT+3);
  • – Switzerland SNB Chairman Thomas Jordan speaks at 19:45 (GMT+3).

By JustMarkets


This article reflects a personal opinion and should not be interpreted as an investment advice, and/or offer, and/or a persistent request for carrying out financial transactions, and/or a guarantee, and/or a forecast of future events.

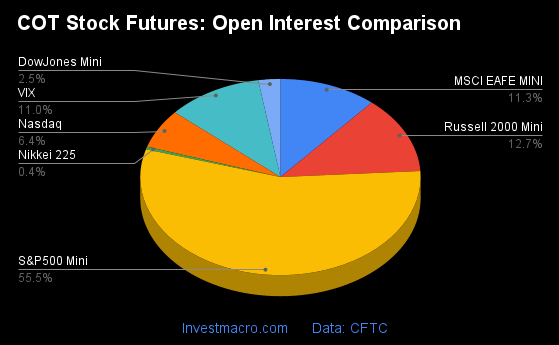
COT Stock Market Charts: Speculator bets led by DowJones & Russell 2000

By InvestMacro

Here are the latest charts and statistics for the Commitment of Traders (COT) data published by the Commodities Futures Trading Commission (CFTC).

The latest COT data is updated through Tuesday May 7th and shows a quick view of how large traders (for-profit speculators and commercial entities) were positioned in the futures markets.

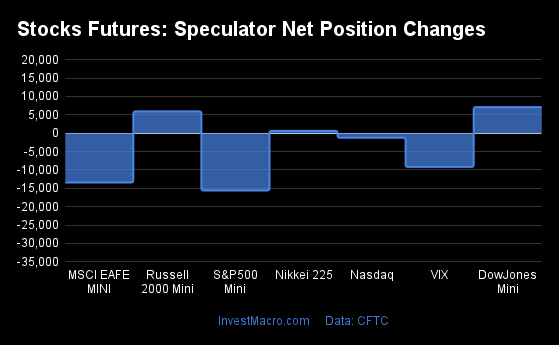
Weekly Speculator Changes led by DowJones & Russell 2000

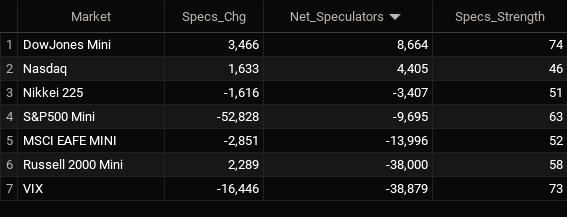
The COT stock markets speculator bets were lower this week as three out of the seven stock markets we cover had higher positioning while the other four markets had lower speculator contracts.

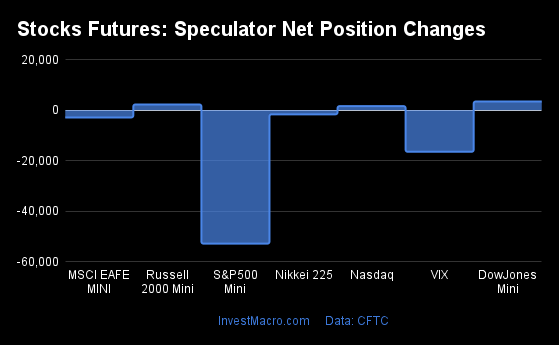
Leading the gains for the stock markets was the DowJones-Mini (3,466 contracts) with the Russell-Mini (2,289 contracts) and the Nasdaq-Mini (1,633 contracts) also showing positive weeks.

The markets with the declines in speculator bets this week were S&P500-Mini (-52,828 contracts), the VIX (-16,446 contracts), the MSCI EAFE-Mini (-2,851 contracts) and the Nikkei 225 (-1,616 contracts) also seeing lower bets on the week.


Stock Market Net Speculators Leaderboard
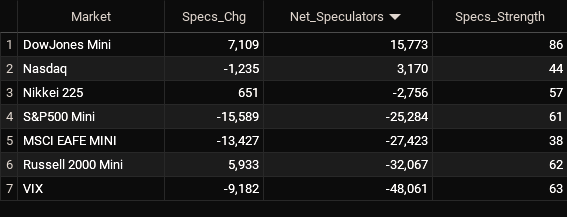
Legend: Weekly Speculators Change | Speculators Current Net Position | Speculators Strength Score compared to last 3-Years (0-100 range)


Strength Scores led by DowJones-Mini & VIX
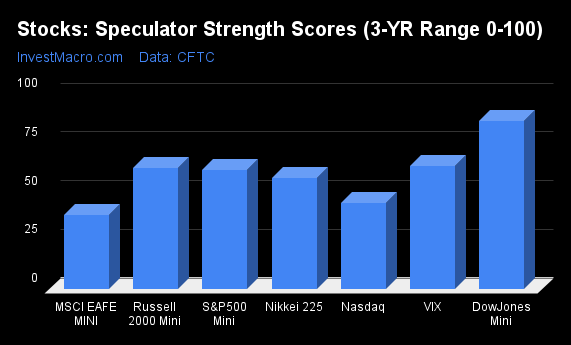
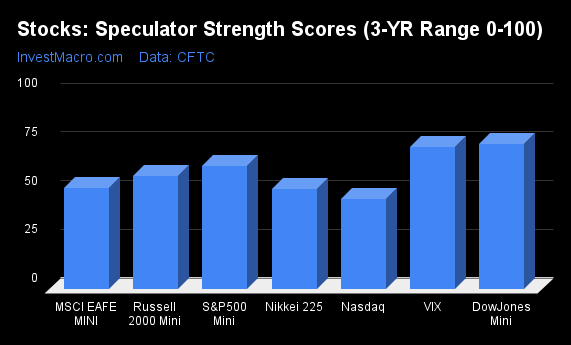
COT Strength Scores (a normalized measure of Speculator positions over a 3-Year range, from 0 to 100 where above 80 is Extreme-Bullish and below 20 is Extreme-Bearish) showed that the DowJones-Mini (74 percent) and the VIX (73 percent) lead the stock markets this week. The S&P500-Mini (63 percent) comes in as the next highest in the weekly strength scores.

On the downside, the Nasdaq-Mini (46 percent) comes in at the lowest strength level currently.

Strength Statistics:
VIX (73.0 percent) vs VIX previous week (90.8 percent)
S&P500-Mini (63.3 percent) vs S&P500-Mini previous week (71.2 percent)
DowJones-Mini (74.4 percent) vs DowJones-Mini previous week (68.8 percent)
Nasdaq-Mini (46.0 percent) vs Nasdaq-Mini previous week (43.5 percent)
Russell2000-Mini (58.1 percent) vs Russell2000-Mini previous week (56.5 percent)
Nikkei USD (51.1 percent) vs Nikkei USD previous week (64.9 percent)
EAFE-Mini (51.9 percent) vs EAFE-Mini previous week (54.9 percent)


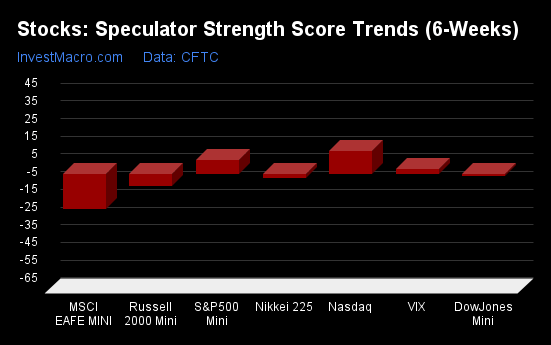
S&P500-Mini & Nasdaq-Mini top the 6-Week Strength Trends

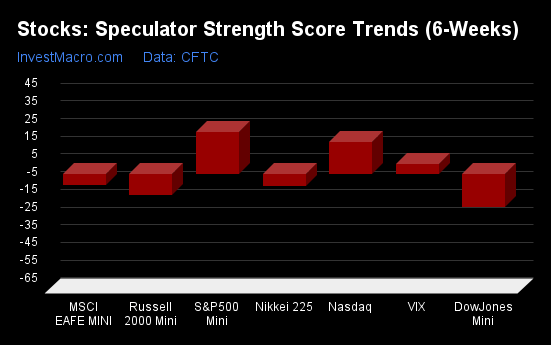
COT Strength Score Trends (or move index, calculates the 6-week changes in strength scores) showed that the S&P500-Mini (24 percent) leads the past six weeks trends for the stock markets. The Nasdaq-Mini (18 percent) and the VIX (5 percent) are the next highest positive movers in the latest trends data.

The DowJones-Mini (-18 percent) leads the downside trend scores currently with the Russell-Mini (-12 percent) coming in as the next market with lower trend scores.

Strength Trend Statistics:
VIX (5.4 percent) vs VIX previous week (24.2 percent)
S&P500-Mini (23.8 percent) vs S&P500-Mini previous week (35.4 percent)
DowJones-Mini (-18.5 percent) vs DowJones-Mini previous week (-28.1 percent)
Nasdaq-Mini (17.9 percent) vs Nasdaq-Mini previous week (-13.0 percent)
Russell2000-Mini (-11.7 percent) vs Russell2000-Mini previous week (-19.0 percent)
Nikkei USD (-7.0 percent) vs Nikkei USD previous week (-3.2 percent)
EAFE-Mini (-6.3 percent) vs EAFE-Mini previous week (-3.6 percent)


Individual Stock Market Charts:

VIX Volatility Futures:
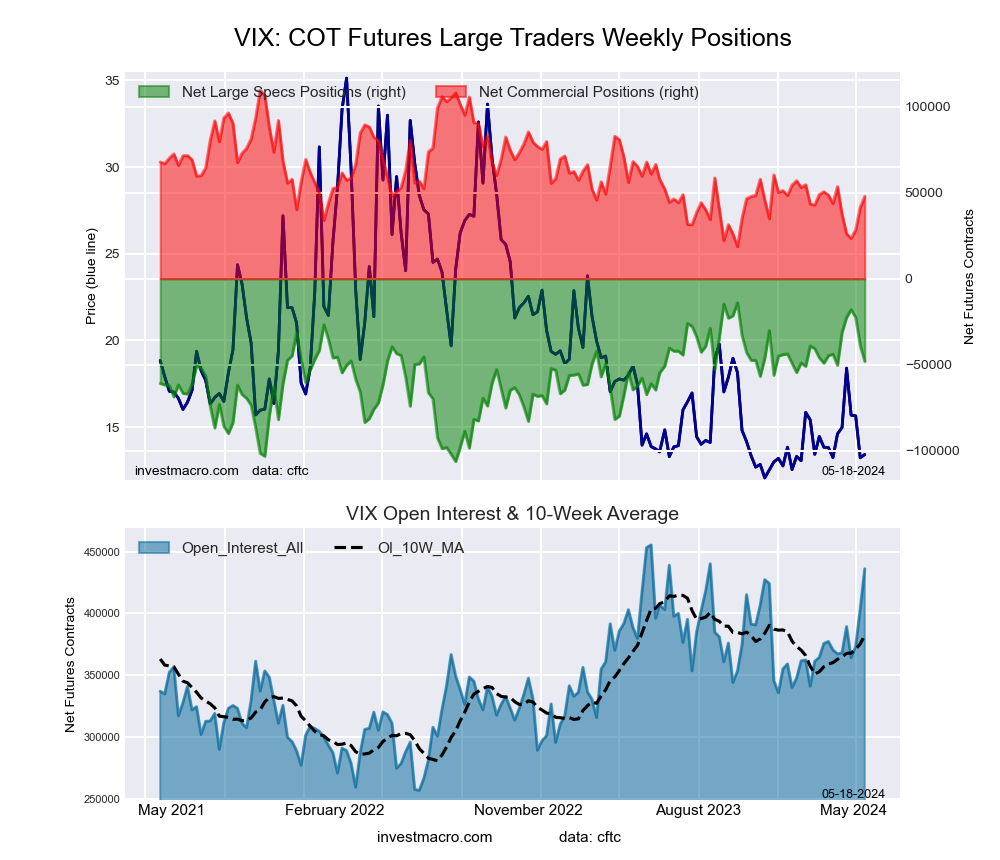
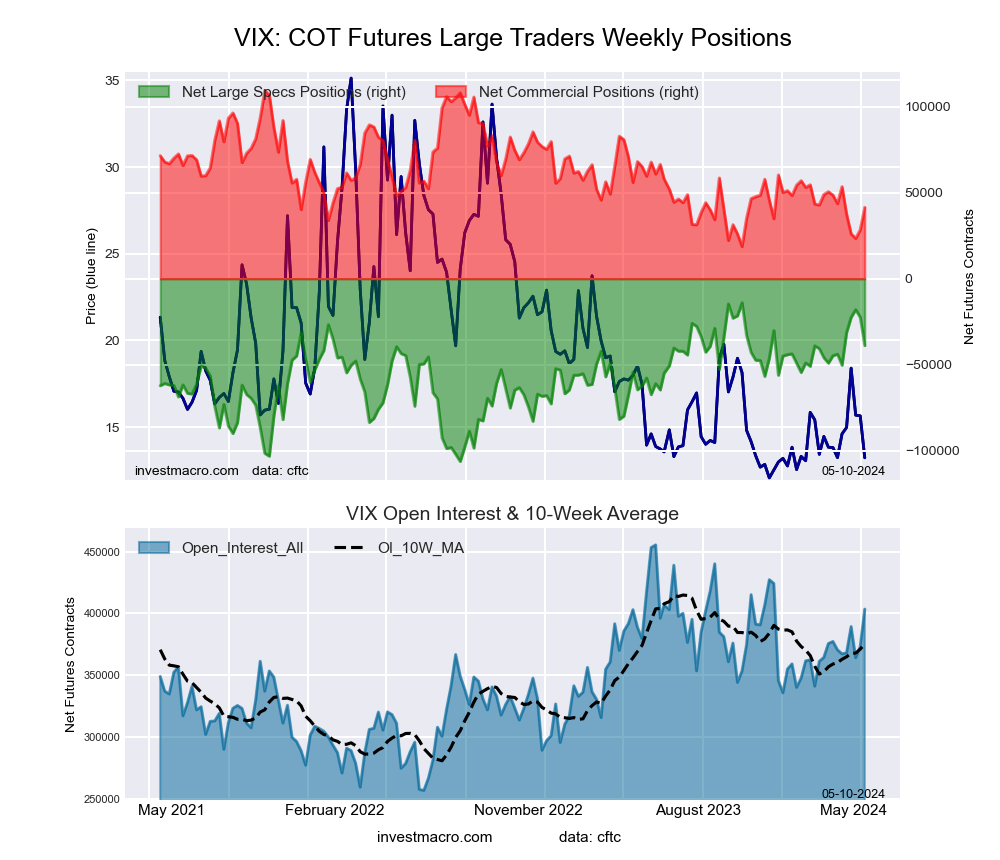
VIX Volatility Futures COT ChartThe VIX Volatility large speculator standing this week recorded a net position of -38,879 contracts in the data reported through Tuesday. This was a weekly lowering of -16,446 contracts from the previous week which had a total of -22,433 net contracts.

This week’s current strength score (the trader positioning range over the past three years, measured from 0 to 100) shows the speculators are currently Bullish with a score of 73.0 percent. The commercials are Bearish with a score of 25.1 percent and the small traders (not shown in chart) are Bullish-Extreme with a score of 83.0 percent.

Price Trend-Following Model: Weak Uptrend

Our weekly trend-following model classifies the current market price position as: Weak Uptrend. The current action for the model is considered to be: Hold – Maintain Long Position.

VIX Volatility Futures StatisticsSPECULATORSCOMMERCIALSSMALL TRADERS
– Percent of Open Interest Longs:24.442.57.5
– Percent of Open Interest Shorts:34.032.28.1
– Net Position:-38,87941,509-2,630
– Gross Longs:98,258171,48630,089
– Gross Shorts:137,137129,97732,719
– Long to Short Ratio:0.7 to 11.3 to 10.9 to 1
NET POSITION TREND:
– Strength Index Score (3 Year Range Pct):73.025.183.0
– Strength Index Reading (3 Year Range):BullishBearishBullish-Extreme
NET POSITION MOVEMENT INDEX:
– 6-Week Change in Strength Index:5.4-2.4-14.3


S&P500 Mini Futures:

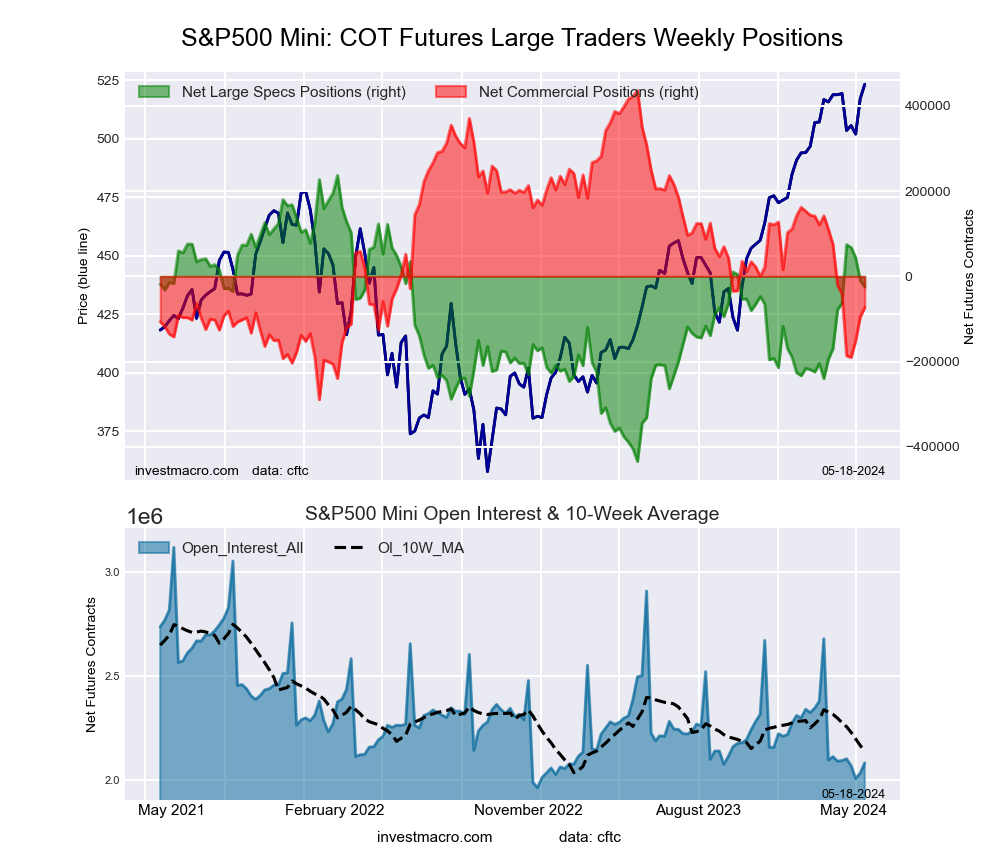
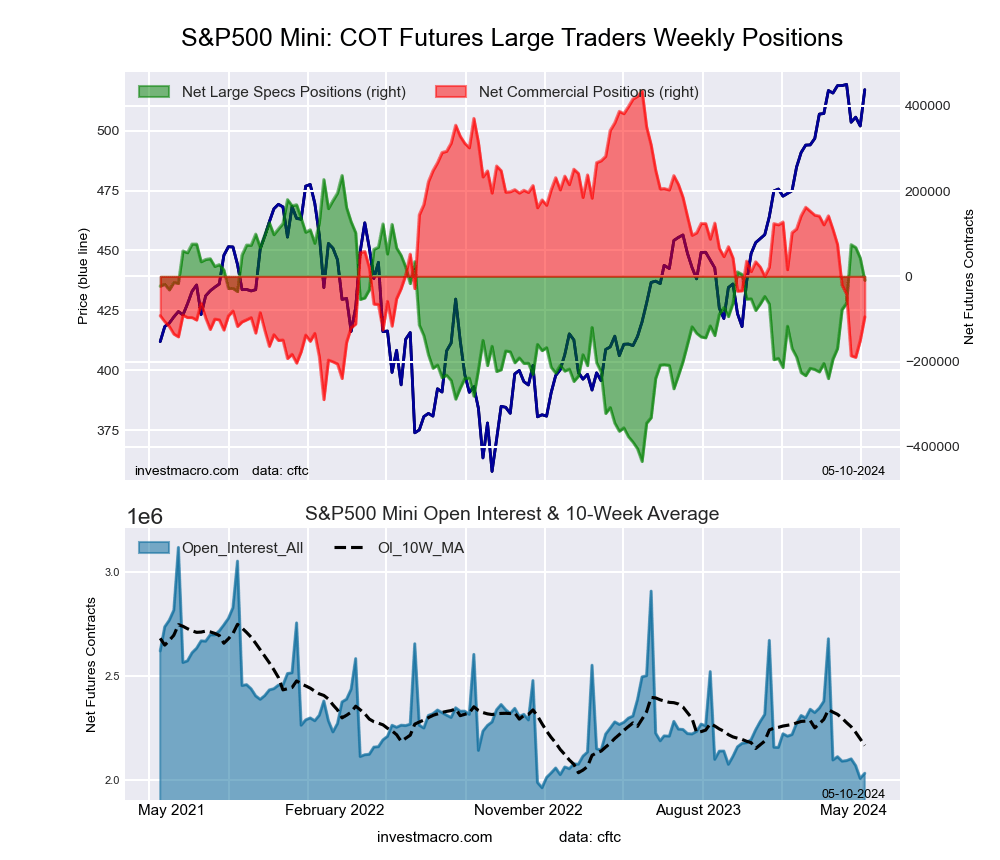
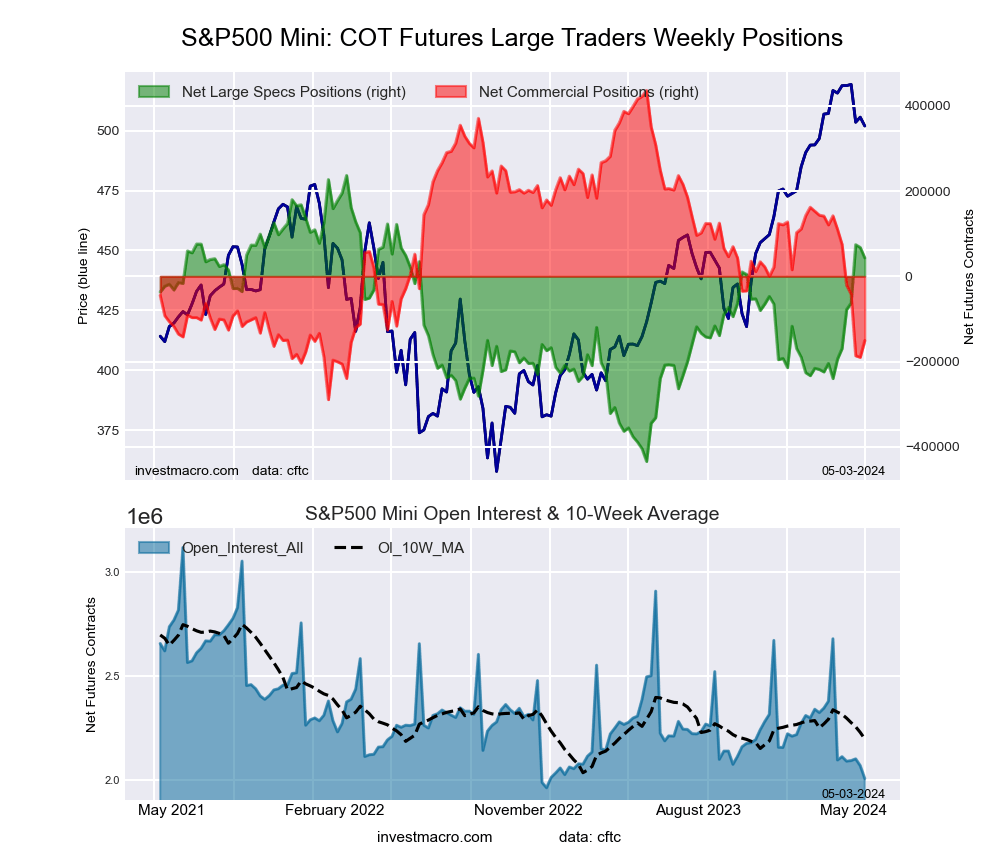
SP500 Mini Futures COT ChartThe S&P500 Mini large speculator standing this week recorded a net position of -9,695 contracts in the data reported through Tuesday. This was a weekly reduction of -52,828 contracts from the previous week which had a total of 43,133 net contracts.

This week’s current strength score (the trader positioning range over the past three years, measured from 0 to 100) shows the speculators are currently Bullish with a score of 63.3 percent. The commercials are Bearish with a score of 26.8 percent and the small traders (not shown in chart) are Bullish with a score of 78.7 percent.

Price Trend-Following Model: Uptrend

Our weekly trend-following model classifies the current market price position as: Uptrend. The current action for the model is considered to be: Hold – Maintain Long Position.

S&P500 Mini Futures StatisticsSPECULATORSCOMMERCIALSSMALL TRADERS
– Percent of Open Interest Longs:12.970.713.8
– Percent of Open Interest Shorts:13.475.48.6
– Net Position:-9,695-95,129104,824
– Gross Longs:262,7781,436,696280,192
– Gross Shorts:272,4731,531,825175,368
– Long to Short Ratio:1.0 to 10.9 to 11.6 to 1
NET POSITION TREND:
– Strength Index Score (3 Year Range Pct):63.326.878.7
– Strength Index Reading (3 Year Range):BullishBearishBullish
NET POSITION MOVEMENT INDEX:
– 6-Week Change in Strength Index:23.8-23.44.0


Dow Jones Mini Futures:

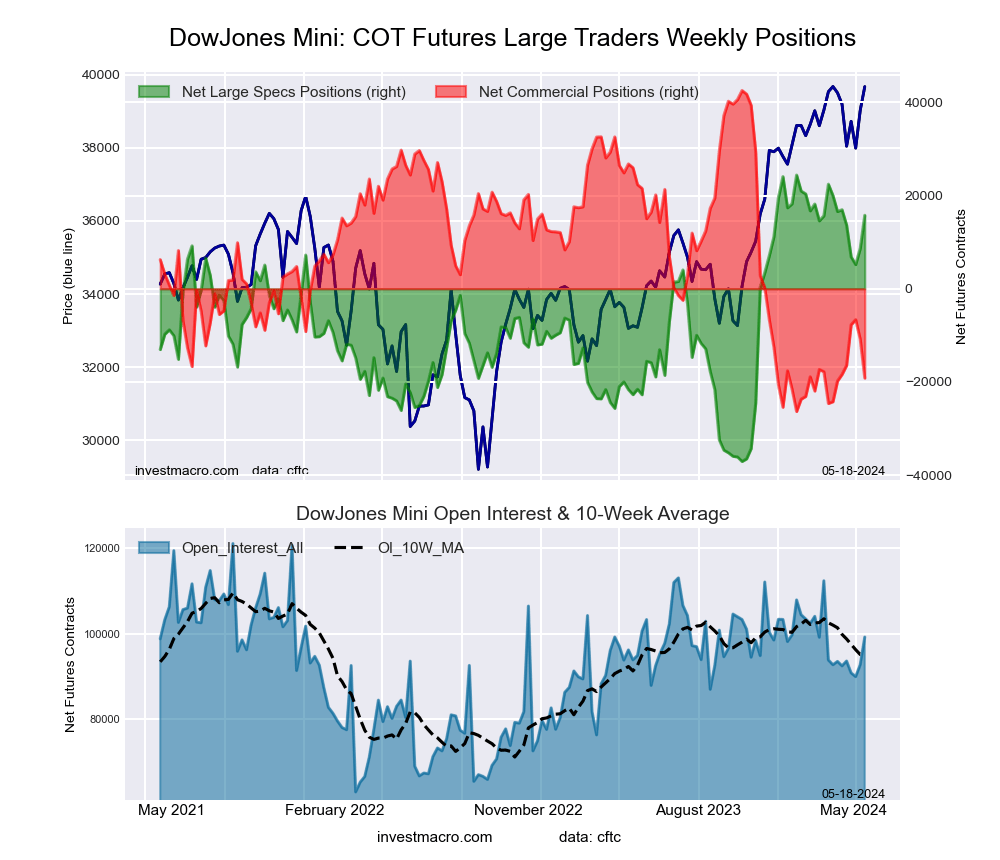
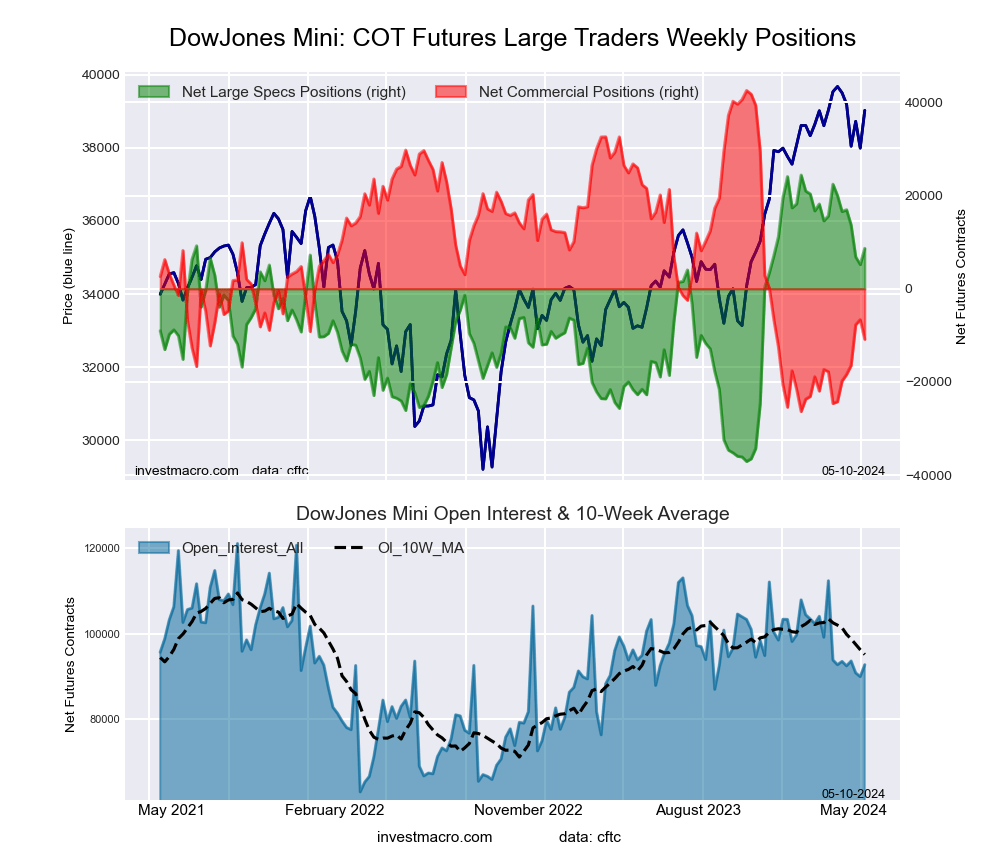
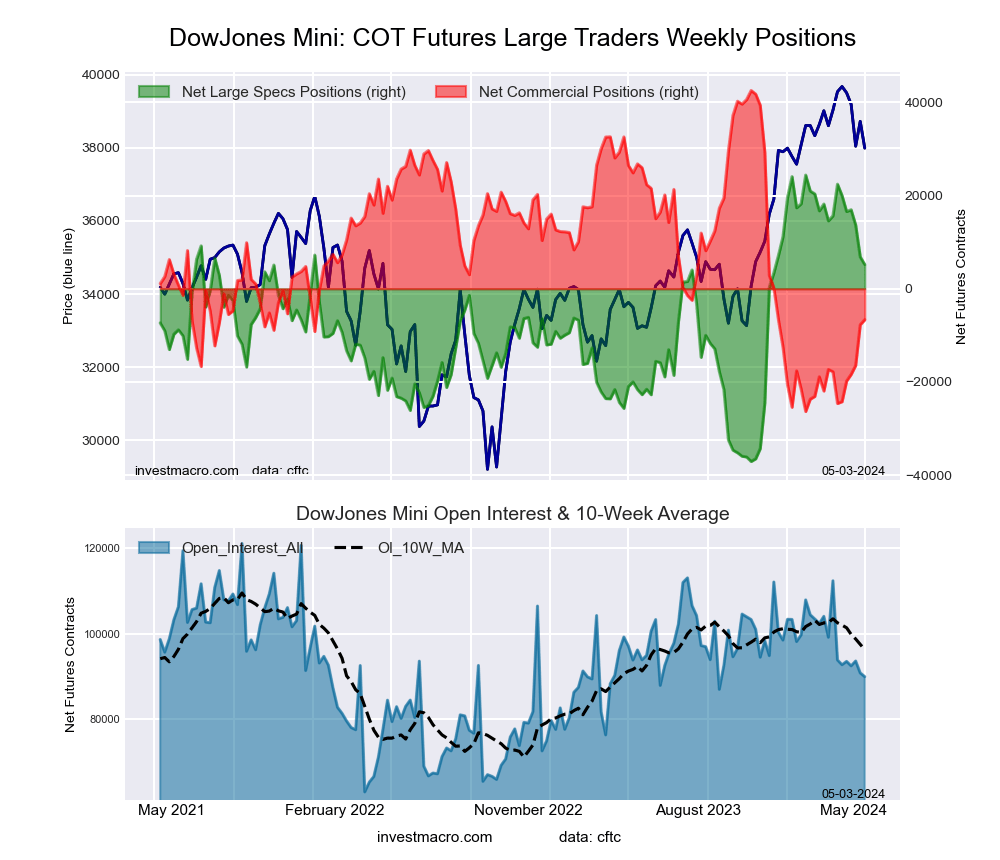
Dow Jones Mini Futures COT ChartThe Dow Jones Mini large speculator standing this week recorded a net position of 8,664 contracts in the data reported through Tuesday. This was a weekly lift of 3,466 contracts from the previous week which had a total of 5,198 net contracts.

This week’s current strength score (the trader positioning range over the past three years, measured from 0 to 100) shows the speculators are currently Bullish with a score of 74.4 percent. The commercials are Bearish with a score of 22.5 percent and the small traders (not shown in chart) are Bullish with a score of 54.5 percent.

Price Trend-Following Model: Strong Uptrend

Our weekly trend-following model classifies the current market price position as: Strong Uptrend. The current action for the model is considered to be: Hold – Maintain Long Position.

Dow Jones Mini Futures StatisticsSPECULATORSCOMMERCIALSSMALL TRADERS
– Percent of Open Interest Longs:20.861.514.8
– Percent of Open Interest Shorts:11.573.212.5
– Net Position:8,664-10,8472,183
– Gross Longs:19,30557,06113,773
– Gross Shorts:10,64167,90811,590
– Long to Short Ratio:1.8 to 10.8 to 11.2 to 1
NET POSITION TREND:
– Strength Index Score (3 Year Range Pct):74.422.554.5
– Strength Index Reading (3 Year Range):BullishBearishBullish
NET POSITION MOVEMENT INDEX:
– 6-Week Change in Strength Index:-18.519.4-10.0


Nasdaq Mini Futures:

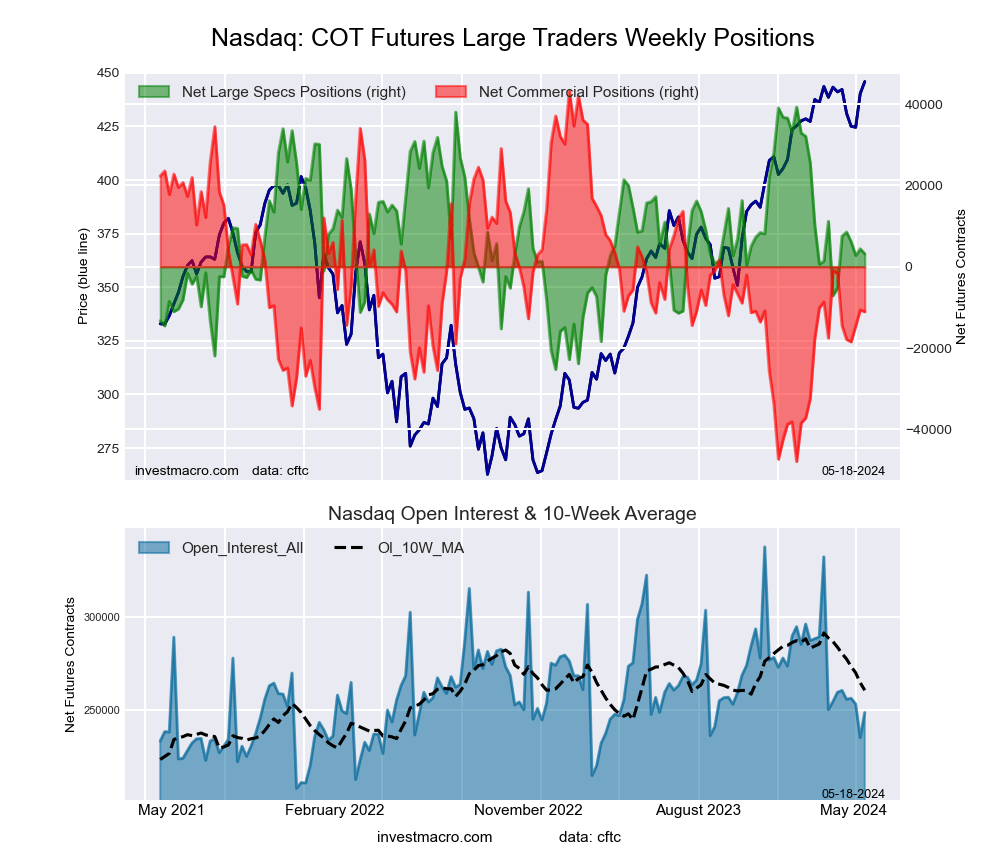
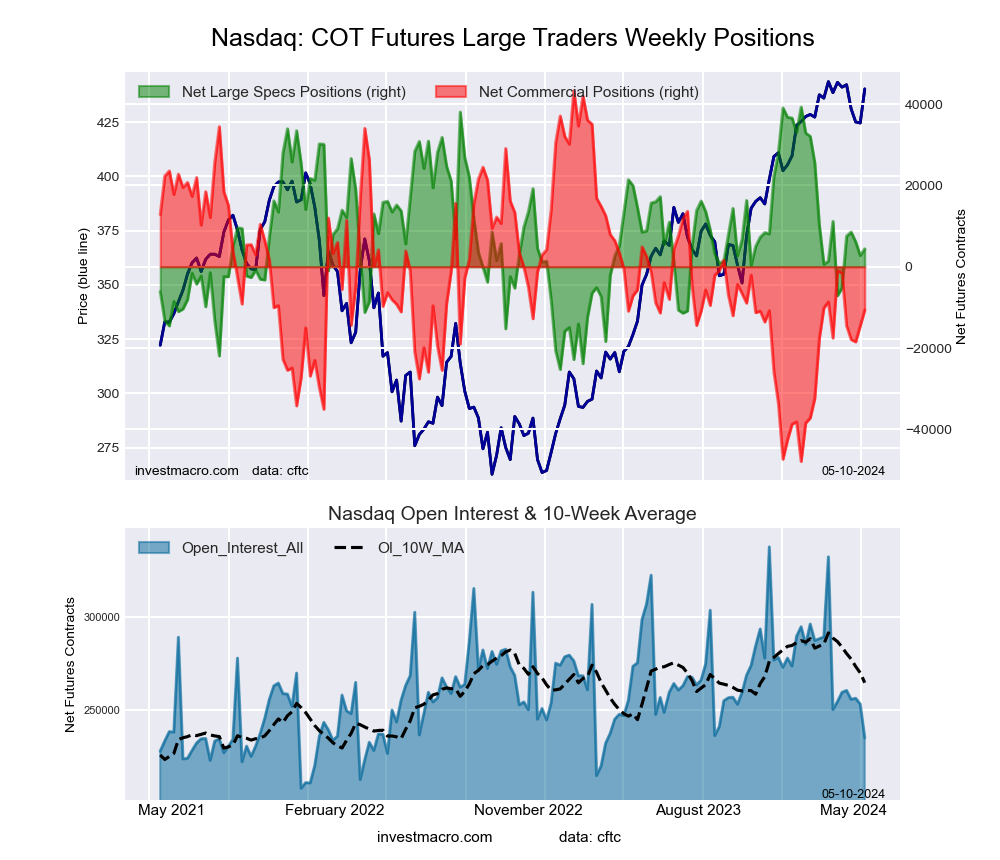
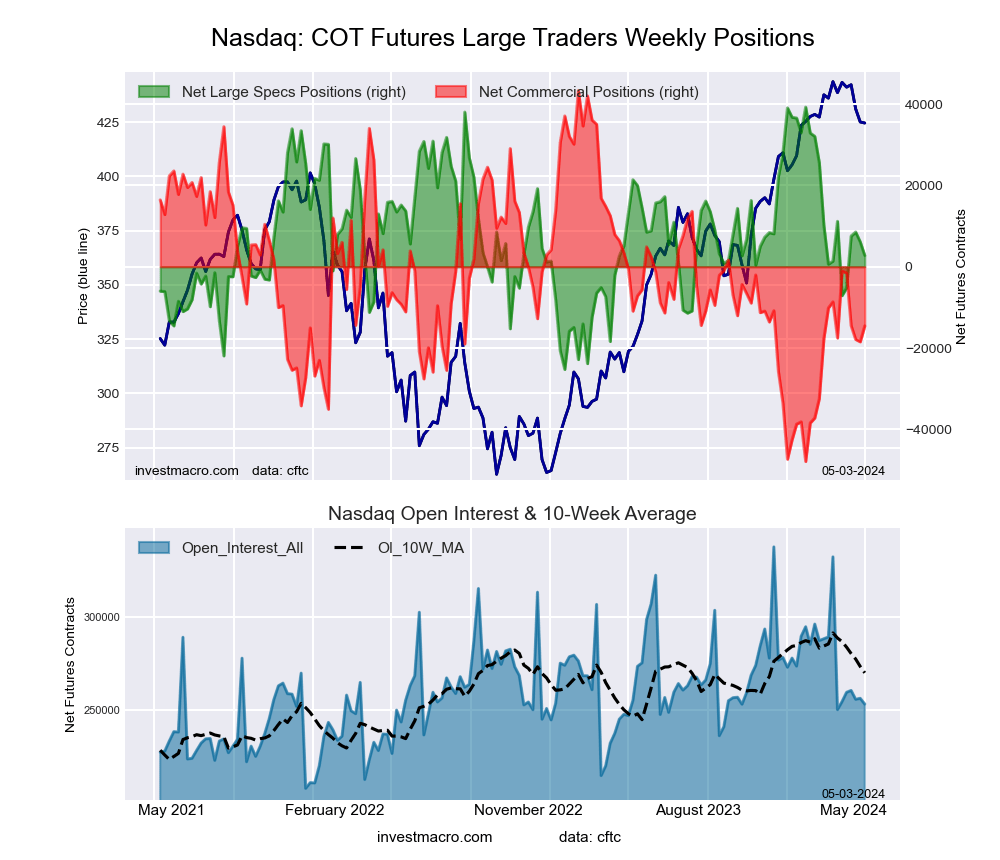
Nasdaq Mini Futures COT ChartThe Nasdaq Mini large speculator standing this week recorded a net position of 4,405 contracts in the data reported through Tuesday. This was a weekly increase of 1,633 contracts from the previous week which had a total of 2,772 net contracts.

This week’s current strength score (the trader positioning range over the past three years, measured from 0 to 100) shows the speculators are currently Bearish with a score of 46.0 percent. The commercials are Bearish with a score of 40.8 percent and the small traders (not shown in chart) are Bullish-Extreme with a score of 85.0 percent.

Price Trend-Following Model: Uptrend

Our weekly trend-following model classifies the current market price position as: Uptrend. The current action for the model is considered to be: Hold – Maintain Long Position.

Nasdaq Mini Futures StatisticsSPECULATORSCOMMERCIALSSMALL TRADERS
– Percent of Open Interest Longs:27.752.817.3
– Percent of Open Interest Shorts:25.957.414.7
– Net Position:4,405-10,6336,228
– Gross Longs:65,234124,25140,762
– Gross Shorts:60,829134,88434,534
– Long to Short Ratio:1.1 to 10.9 to 11.2 to 1
NET POSITION TREND:
– Strength Index Score (3 Year Range Pct):46.040.885.0
– Strength Index Reading (3 Year Range):BearishBearishBullish-Extreme
NET POSITION MOVEMENT INDEX:
– 6-Week Change in Strength Index:17.9-10.5-4.8


Russell 2000 Mini Futures:

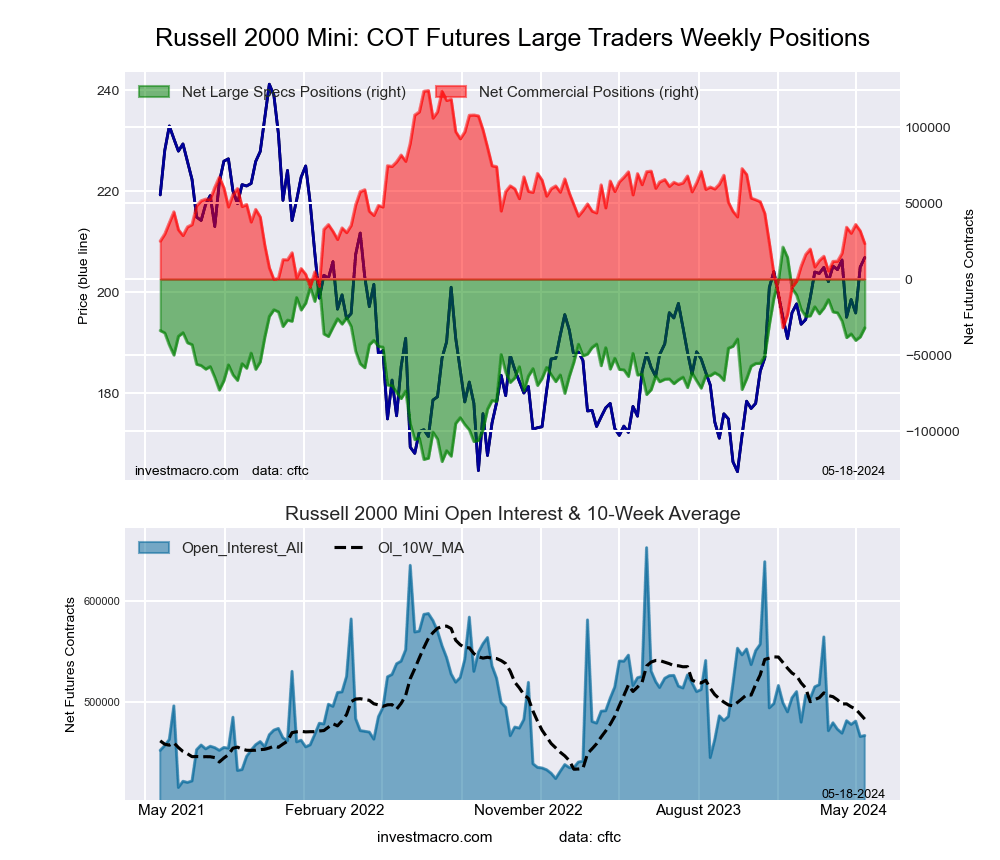
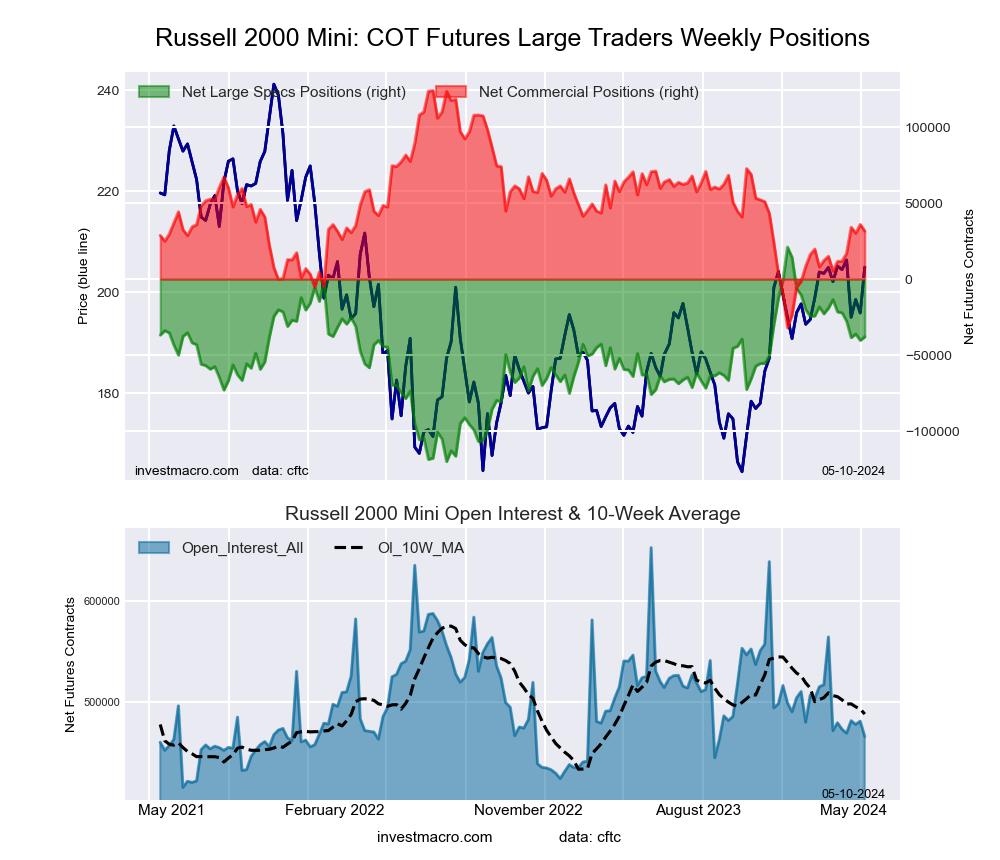
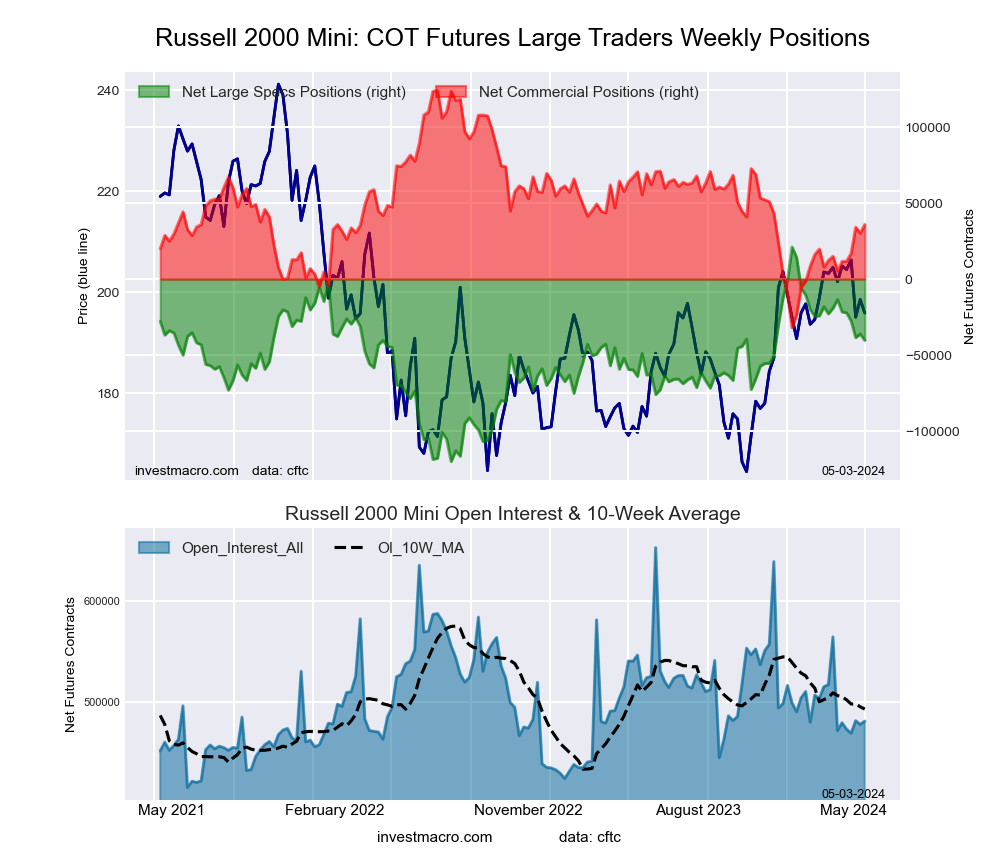
Russell 2000 Mini Futures COT ChartThe Russell 2000 Mini large speculator standing this week recorded a net position of -38,000 contracts in the data reported through Tuesday. This was a weekly rise of 2,289 contracts from the previous week which had a total of -40,289 net contracts.

This week’s current strength score (the trader positioning range over the past three years, measured from 0 to 100) shows the speculators are currently Bullish with a score of 58.1 percent. The commercials are Bearish with a score of 40.8 percent and the small traders (not shown in chart) are Bullish with a score of 50.4 percent.

Price Trend-Following Model: Strong Uptrend

Our weekly trend-following model classifies the current market price position as: Strong Uptrend. The current action for the model is considered to be: Hold – Maintain Long Position.

Russell 2000 Mini Futures StatisticsSPECULATORSCOMMERCIALSSMALL TRADERS
– Percent of Open Interest Longs:15.576.06.2
– Percent of Open Interest Shorts:23.769.24.9
– Net Position:-38,00031,6386,362
– Gross Longs:72,277353,89129,050
– Gross Shorts:110,277322,25322,688
– Long to Short Ratio:0.7 to 11.1 to 11.3 to 1
NET POSITION TREND:
– Strength Index Score (3 Year Range Pct):58.140.850.4
– Strength Index Reading (3 Year Range):BullishBearishBullish
NET POSITION MOVEMENT INDEX:
– 6-Week Change in Strength Index:-11.712.8-12.0


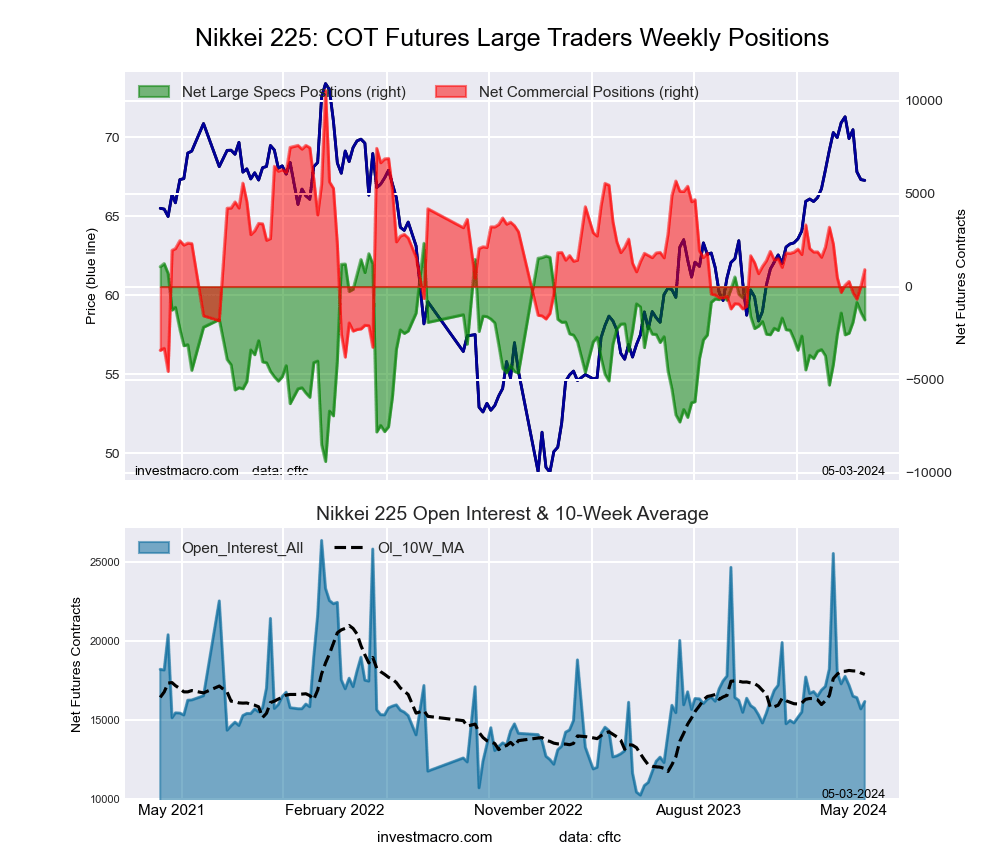
Nikkei Stock Average (USD) Futures:

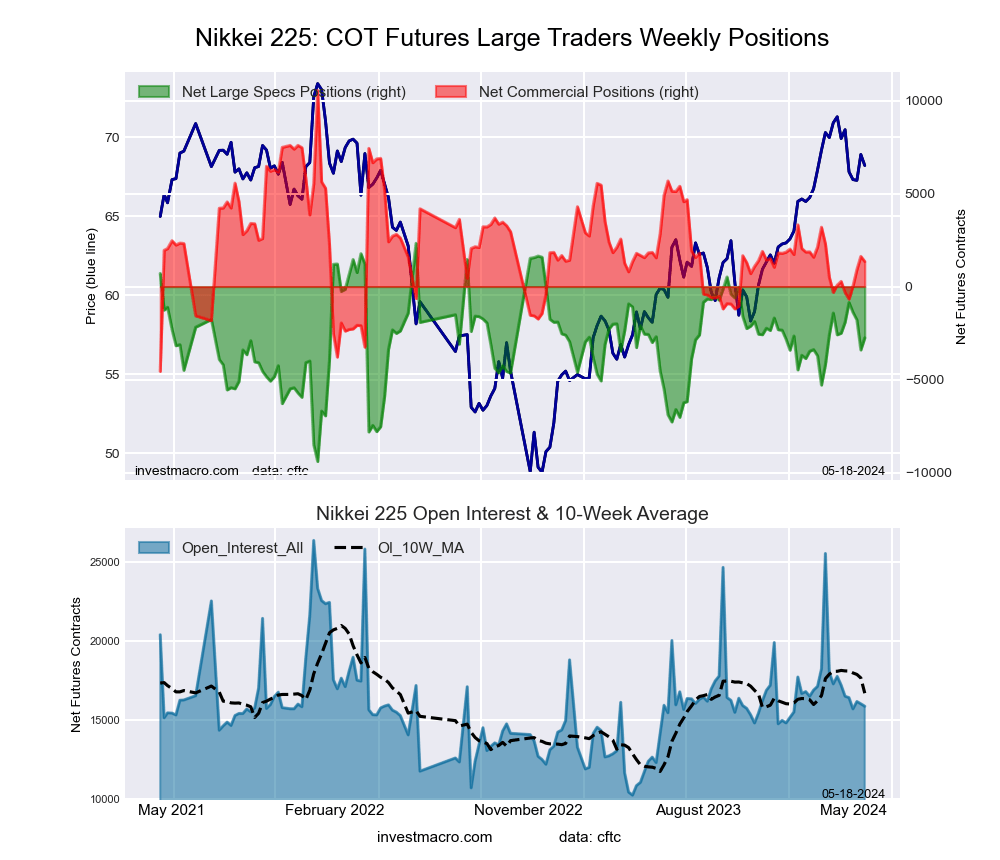
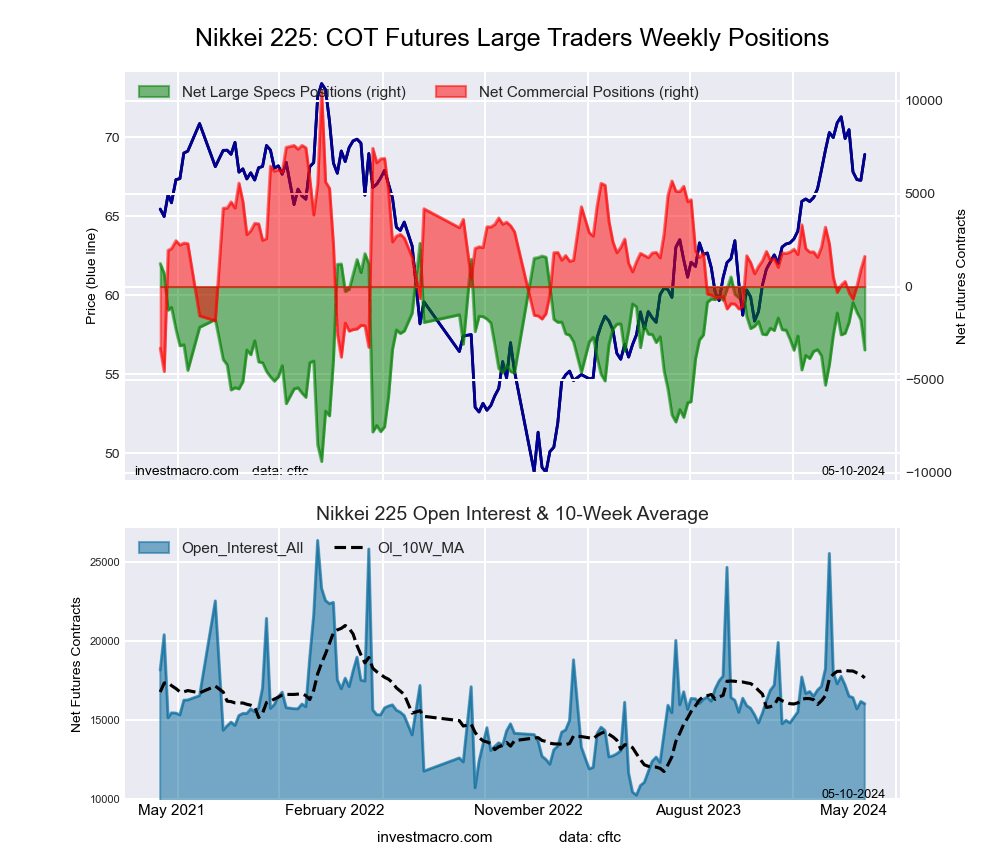
Nikkei Stock Average (USD) Futures COT ChartThe Nikkei Stock Average (USD) large speculator standing this week recorded a net position of -3,407 contracts in the data reported through Tuesday. This was a weekly fall of -1,616 contracts from the previous week which had a total of -1,791 net contracts.

This week’s current strength score (the trader positioning range over the past three years, measured from 0 to 100) shows the speculators are currently Bullish with a score of 51.1 percent. The commercials are Bearish with a score of 40.9 percent and the small traders (not shown in chart) are Bullish with a score of 66.2 percent.

Price Trend-Following Model: Weak Uptrend

Our weekly trend-following model classifies the current market price position as: Weak Uptrend. The current action for the model is considered to be: Hold – Maintain Long Position.

Nikkei Stock Average Futures StatisticsSPECULATORSCOMMERCIALSSMALL TRADERS
– Percent of Open Interest Longs:9.166.624.2
– Percent of Open Interest Shorts:30.456.513.1
– Net Position:-3,4071,6211,786
– Gross Longs:1,46510,6753,885
– Gross Shorts:4,8729,0542,099
– Long to Short Ratio:0.3 to 11.2 to 11.9 to 1
NET POSITION TREND:
– Strength Index Score (3 Year Range Pct):51.140.966.2
– Strength Index Reading (3 Year Range):BullishBearishBullish
NET POSITION MOVEMENT INDEX:
– 6-Week Change in Strength Index:-7.010.3-12.0


MSCI EAFE Mini Futures:

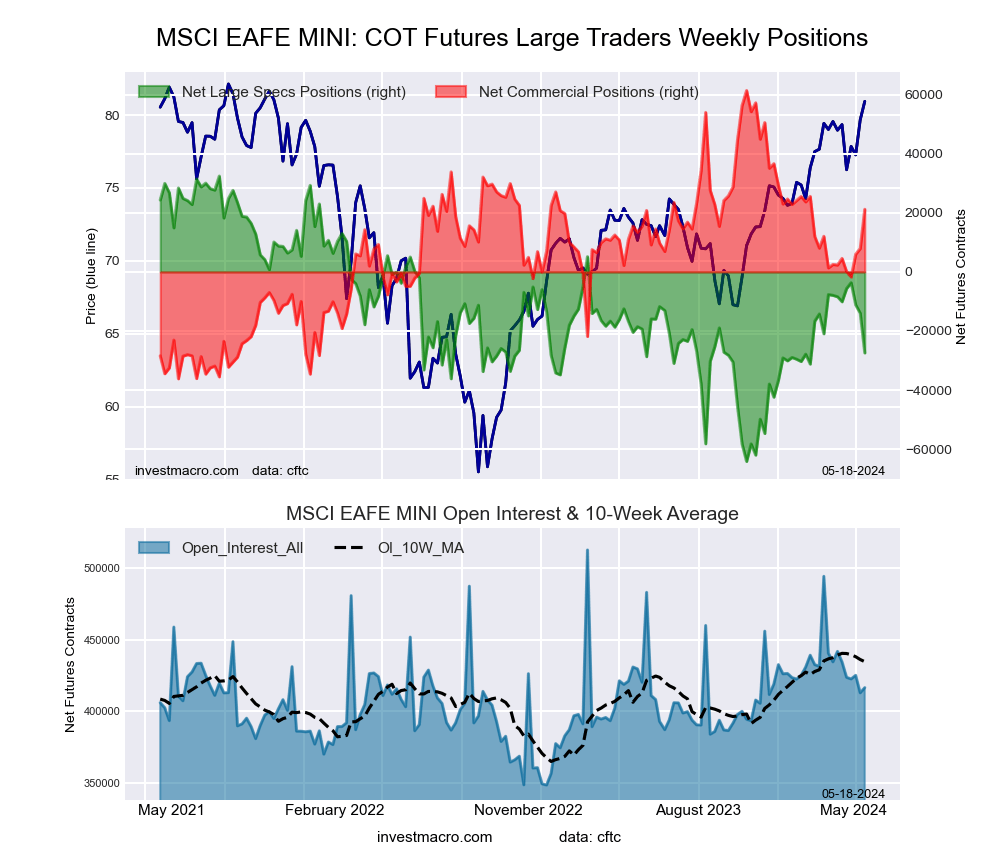
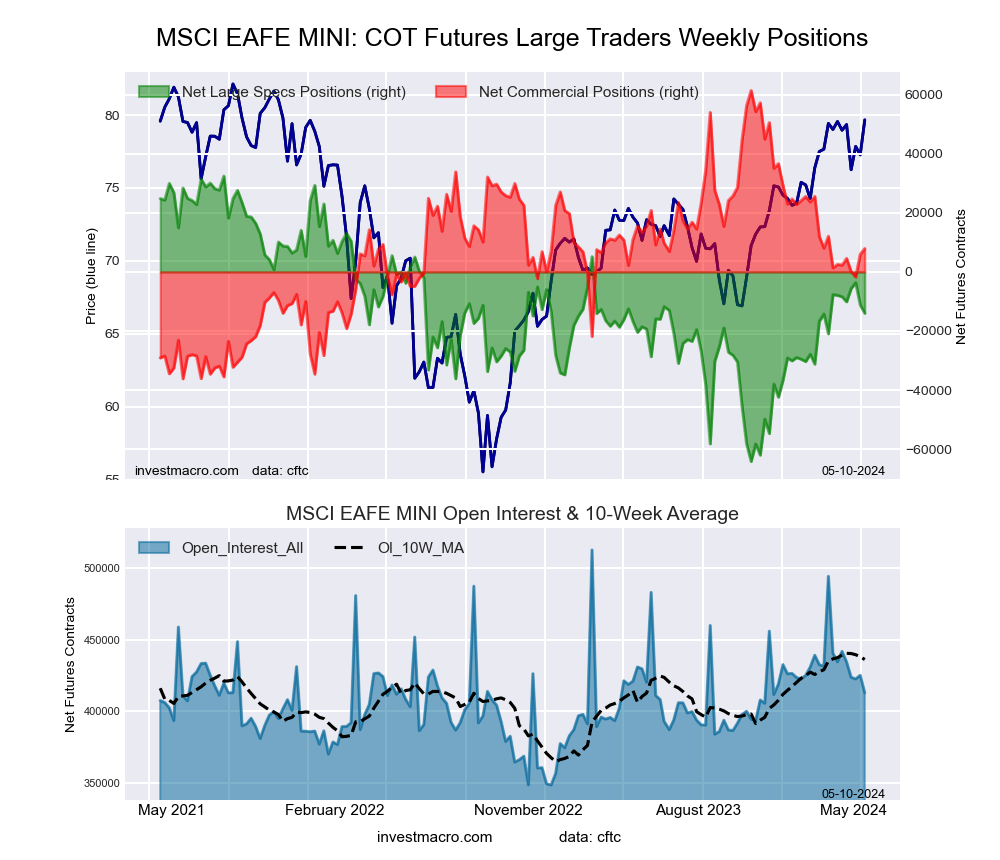
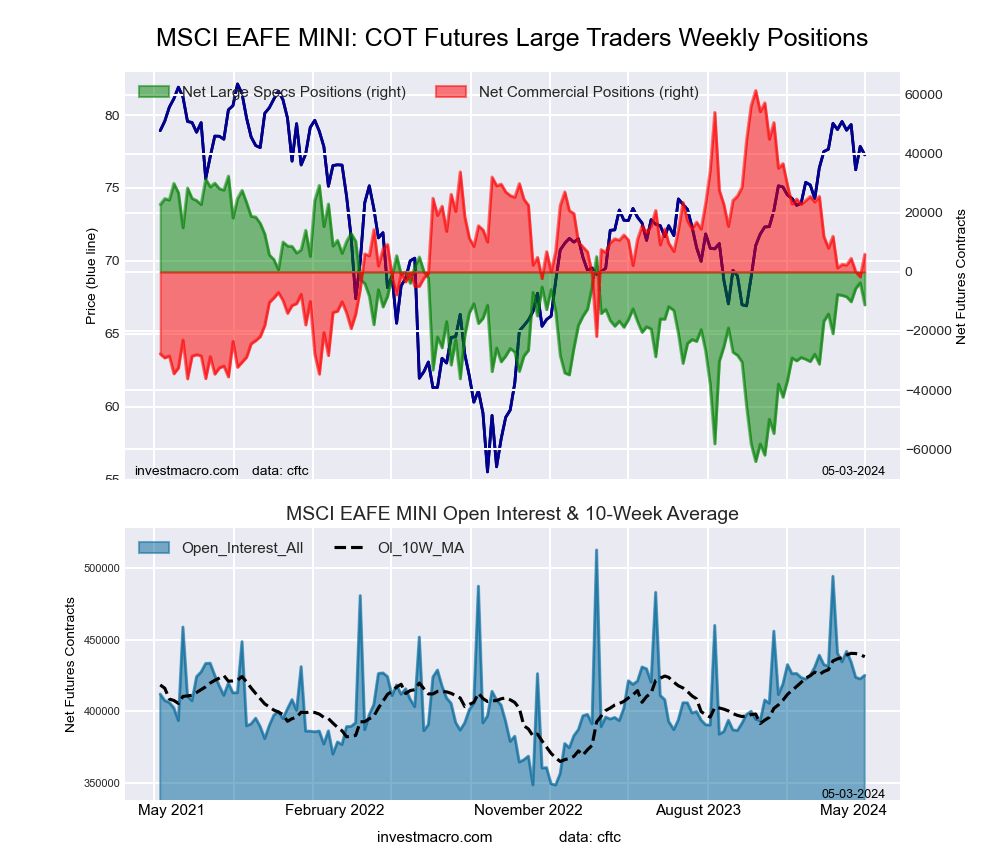
MSCI EAFE Mini Futures COT ChartThe MSCI EAFE Mini large speculator standing this week recorded a net position of -13,996 contracts in the data reported through Tuesday. This was a weekly lowering of -2,851 contracts from the previous week which had a total of -11,145 net contracts.

This week’s current strength score (the trader positioning range over the past three years, measured from 0 to 100) shows the speculators are currently Bullish with a score of 51.9 percent. The commercials are Bearish with a score of 45.2 percent and the small traders (not shown in chart) are Bearish with a score of 47.3 percent.

Price Trend-Following Model: Strong Uptrend

Our weekly trend-following model classifies the current market price position as: Strong Uptrend. The current action for the model is considered to be: Hold – Maintain Long Position.

MSCI EAFE Mini Futures StatisticsSPECULATORSCOMMERCIALSSMALL TRADERS
– Percent of Open Interest Longs:6.090.53.1
– Percent of Open Interest Shorts:9.488.51.6
– Net Position:-13,9967,9126,084
– Gross Longs:24,945373,54312,596
– Gross Shorts:38,941365,6316,512
– Long to Short Ratio:0.6 to 11.0 to 11.9 to 1
NET POSITION TREND:
– Strength Index Score (3 Year Range Pct):51.945.247.3
– Strength Index Reading (3 Year Range):BullishBearishBearish
NET POSITION MOVEMENT INDEX:
– 6-Week Change in Strength Index:-6.35.53.4


Article By InvestMacroReceive our weekly COT Newsletter

*COT Report: The COT data, released weekly to the public each Friday, is updated through the most recent Tuesday (data is 3 days old) and shows a quick view of how large speculators or non-commercials (for-profit traders) were positioned in the futures markets.

The CFTC categorizes trader positions according to commercial hedgers (traders who use futures contracts for hedging as part of the business), non-commercials (large traders who speculate to realize trading profits) and nonreportable traders (usually small traders/speculators) as well as their open interest (contracts open in the market at time of reporting). See CFTC criteria here.

Is Boeing (BA) a Recovery Play? Evaluating Upside Potential and Risks

By Ino.com

The Boeing Company (BA), a stalwart in aircraft manufacturing and services, has faced a cascade of challenges so far this year. Just as the dust was settling on its mid-air blowout incident in January, another report emerged of a plane having mechanical failures, though this one is somewhat different from the reports we’ve already heard.

This time, it’s a Delta flight from New York to Los Angeles, reporting a problem with the emergency slide on the right wing and a strange sound. While this isn’t good news for Boeing, given that the plane is quite old (flying since 1990), it’s not expected to cause too much trouble either.

Now, let’s evaluate the upside potential and risks associated with investing in BA, considering factors like financials, growth prospects, valuation, and industry dynamics.

A Tumultuous Start to 2024

Boeing and its aircraft manufacturer have faced significant media attention since the start of 2024, with a series of incidents prompting investigations. In January, an Alaska Airlines Boeing 737 MAX 9 had to make an emergency landing in Portland, Oregon, because a part of the plane’s fuselage blew out.

Although there were no casualties, the U.S. National Transportation Safety Board (NTSB) investigation revealed that the door was not properly secured due to missing bolts. As a result, it led to a grounding of its 737-9 MAX fleet, increased scrutiny of the plane maker’s 737 production and safety processes, and decreased overall plane production.

Later in January, an ANA (All Nippon Airways) Boeing 737-800 had to return to Japan after a crack was found on its cockpit window during flight.

On February 21, a United Airlines Boeing 757-200 made an emergency landing in Denver due to wing damage. Furthermore, in March, a United Airlines Boeing 777-200 had to land in Los Angeles after a tire fell off following take-off, damaging vehicles below.

Other incidents include a brief rudder control failure on a Boeing 737 Max in New Jersey, a United Airlines Boeing 737 MAX 8 going off the taxiway in Houston, and a Boeing 737 in Medford, Oregon, being found missing a panel.

Further, on March 18, an Alaska Airlines Boeing 737 had a cracked windshield upon landing in Portland.

Can Boeing Be Trusted Again?

Such incidents have dealt a significant blow to the company, raising concerns about BA’s approach of prioritizing profits over safety. Particularly, the Alaska Airlines incident led to tighter regulatory scrutiny, financial implications, and demands for compensation, potentially hampering Boeing’s growth trajectory.

However, the company has taken steps to improve quality, including expanding inspections, changing how work is performed, increasing training, and soliciting more feedback from employees.

“We are absolutely committed to doing everything we can to make certain our regulators, customers, employees and the flying public are 100 percent confident in Boeing,” Dave Calhoun, Boeing’s chief executive officer, said in a letter to employees last week.

Moreover, the company is also in talks to acquire Spirit AeroSystems Holdings, Inc. (SPR), a troubled supplier that builds the body of the Max jet, which had been a part of Boeing until it was spun out two decades ago. This potential acquisition reflects Boeing’s commitment to streamlining its supply chain, strengthening production capabilities, and exerting greater control over supplier policies and practices.

Disappointing Financial Performance

Despite a rocky start this year, Boeing reported a slightly better-than-feared quarter but continued to burn cash (almost $4 billion) as it tried to stabilize production. With fewer planes exiting factories in the last three months, Boeing’s revenue suffered a significant blow in the first quarter.

For the quarter that ended March 31, 2023, the company posted a 7.5% year-over-year decline in its total revenues to $16.57 billion. Its non-GAAP core operating loss came in at $388 million and $1.13 per share, respectively. Also, BA’s net loss for the quarter amounted to $355 million, which was not as steep as analysts had expected, and it was smaller than the $425 million loss in the prior year’s period.

Deliveries of Boeing’s commercial planes declined by 36% year-on-year in the first three months of 2024. The airline company also reported an operating cash outflow of $3.36 billion, compared with $318 million cash outflow in the last year’s period. Also, it posted a negative free cash flow of $3.92 billion, compared with a loss of $787 million a year ago. Further, the total company backlog grew to $529 billion, including over 5,600 commercial airplanes.

CEO Dave Calhoun, emphasizing the ‘tough moment,’ said, “Lower deliveries can be difficult for our customers and for our financials. But safety and quality must and will come above all else.”

Mixed Analyst Expectations

As Boeing continues to face substantial expenses in resolving identified issues, compensating affected parties, and handling potential legal matters, CFO Brian West believes the company will have a “sizable use of cash” in the second quarter.

Analysts expect BA’s revenue for the fiscal year (ending December 2024) to increase 4.2% year-over-year to $81.09 billion. However, the company is expected to report a loss per share of $0.55. For the ongoing quarter ending June 2024, its revenue is estimated to decline 3.6% year-over-year to $19.05 billion.

However, Street expects the company’s revenue for the next quarter (ending September 30, 2024) to increase by 18.5% year-over-year to $21.46 billion, while its earnings per share is expected to be at $0.41.

During this challenging period, Calhoun stated, “We are utilizing this period, challenging as it may be, to intentionally reduce the pace of operations, strengthen the supply chain, enhance our factory operations, and position Boeing to consistently deliver the reliability and quality our customers expect in the long run.”

Bottom Line

BA’s ongoing challenges, including numerous safety issues, production halts, and delayed deliveries, have put the firm in a complex situation where forecasting future demand has become increasingly precarious. These headwinds are significantly impacting its airline customer base, leading to declining profitability, cash flow problems, and inventory issues that might linger for a while.

Despite these short-term hurdles, the company is committed to strengthening its market position, achieving long-term growth outlooks, and improving predictability for both customers and investors. But this process is going to take some time and concerted effort.

Ultimately, the market’s confidence in Boeing depends on its ability to bounce back from its current challenges. However, the question remains: can the recovery be achieved soon?

Regarding price performance, the stock has plunged nearly 15% over the past three months and more than 33% year-to-date.

Moreover, the stock seems pretty pricey at the moment. In terms of forward P/E, BA is currently trading at 142.59x, which is substantially higher than the industry average of 23.99x. The stock’s forward EV/Sales of 1.81x is 2.9% higher than the industry average of 1.76x. Also, its forward EV/EBITDA of 33.92x compares to the industry average of 11.30x.

Besides, BA’s trailing-12-month gross profit and levered FCF margins of 11.48% and 4.01% are 62.7% and 38.9% lower than the industry averages of 30.80% and 6.56%, respectively. Also, its net income margin of negative 2.81% compares to the industry average of 5.86%.

Recently, Argus Research downgraded their outlook for BA stock from Buy to Hold, estimating a target price of $243.01, indicating a 40.1% upside. In addition, Northcoast Research downgraded the stock from Neutral to Sell.

Given these factors, we believe waiting for a better entry point in this stock could be wise now.

By Ino.com – See our Trader Blog, INO TV Free & Market Analysis Alerts

Source: Is Boeing (BA) a Recovery Play? Evaluating Upside Potential and Risks

COT Stock Market Charts: Speculator bets led lower by S&P500 & MSCI EAFE

By InvestMacro

Here are the latest charts and statistics for the Commitment of Traders (COT) data published by the Commodities Futures Trading Commission (CFTC).

The latest COT data is updated through Tuesday April 30th and shows a quick view of how large traders (for-profit speculators and commercial entities) were positioned in the futures markets.

Weekly Speculator bets led lower by S&P500 & MSCI EAFE

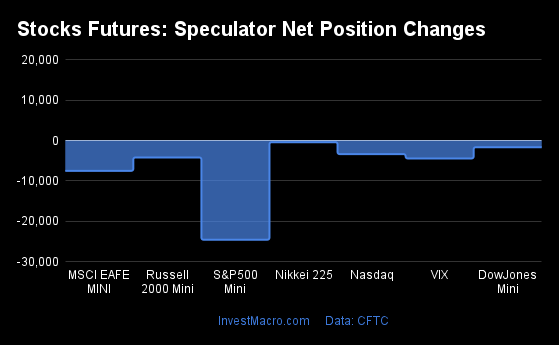
The COT stock markets speculator bets were lower this week as all of the seven stock markets we cover had lower speculator net contract positions.

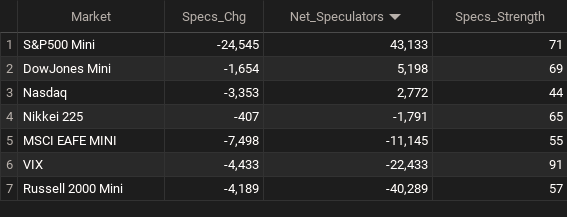
Leading the declines for the stock markets was the S&P500-Mini (-24,545 contracts), the MSCI EAFE-Mini (-7,498 contracts), the VIX (-4,433 contracts), the Russell-Mini (-4,189 contracts), Nasdaq-Mini (-3,353 contracts), the DowJones-Mini (-1,654 contracts) and with the Nikkei 225 (-407 contracts) also registering lower bets on the week.


Stock Market Net Speculators Leaderboard

Legend: Weekly Speculators Change | Speculators Current Net Position | Speculators Strength Score compared to last 3-Years (0-100 range)


Strength Scores led by VIX & S&P500-Mini

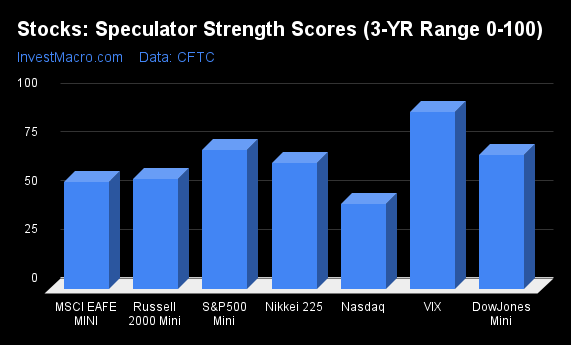
COT Strength Scores (a normalized measure of Speculator positions over a 3-Year range, from 0 to 100 where above 80 is Extreme-Bullish and below 20 is Extreme-Bearish) showed that the VIX (91 percent) and the S&P500-Mini (71 percent) lead the stock markets this week. The DowJones-Mini (69 percent) and Nikkei 225 (65 percent) come in as the next highest in the weekly strength scores.

On the downside, the Nasdaq-Mini (43 percent) comes in at the lowest strength level currently.

Strength Statistics:
VIX (90.8 percent) vs VIX previous week (95.6 percent)
S&P500-Mini (71.2 percent) vs S&P500-Mini previous week (74.8 percent)
DowJones-Mini (68.8 percent) vs DowJones-Mini previous week (71.4 percent)
Nasdaq-Mini (43.5 percent) vs Nasdaq-Mini previous week (48.7 percent)
Russell2000-Mini (56.5 percent) vs Russell2000-Mini previous week (59.5 percent)
Nikkei USD (64.9 percent) vs Nikkei USD previous week (68.4 percent)
EAFE-Mini (54.9 percent) vs EAFE-Mini previous week (62.6 percent)


S&P500-Mini & VIX top the 6-Week Strength Trends

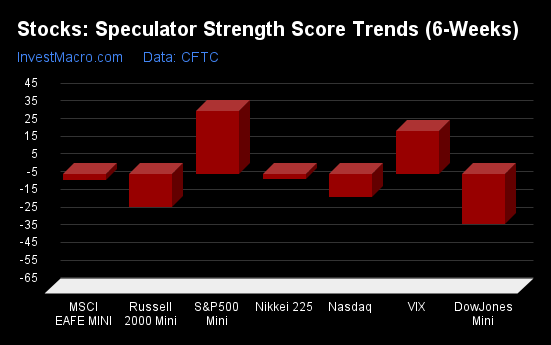
COT Strength Score Trends (or move index, calculates the 6-week changes in strength scores) showed that the S&P500-Mini (35 percent) leads the past six weeks trends for the stock markets. The VIX (24 percent) is the next highest positive mover in the latest trends data.

The DowJones-Mini (-28 percent) leads the downside trend scores currently with the Russell-Mini (-19 percent) coming in as the next market with lower trend scores.

Strength Trend Statistics:
VIX (24.2 percent) vs VIX previous week (33.7 percent)
S&P500-Mini (35.4 percent) vs S&P500-Mini previous week (45.9 percent)
DowJones-Mini (-28.1 percent) vs DowJones-Mini previous week (-14.3 percent)
Nasdaq-Mini (-13.0 percent) vs Nasdaq-Mini previous week (7.3 percent)
Russell2000-Mini (-19.0 percent) vs Russell2000-Mini previous week (-12.1 percent)
Nikkei USD (-3.2 percent) vs Nikkei USD previous week (10.3 percent)
EAFE-Mini (-3.6 percent) vs EAFE-Mini previous week (17.9 percent)


Individual Stock Market Charts:

VIX Volatility Futures:

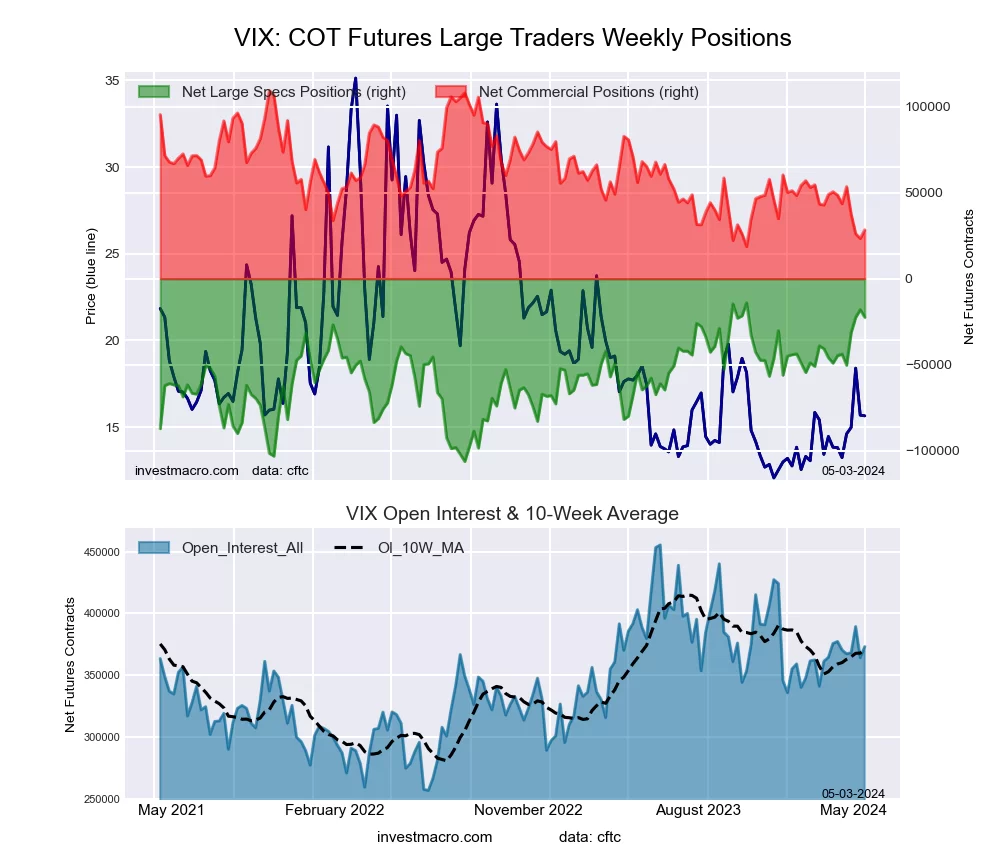
VIX Volatility Futures COT ChartThe VIX Volatility large speculator standing this week equaled a net position of -22,433 contracts in the data reported through Tuesday. This was a weekly reduction of -4,433 contracts from the previous week which had a total of -18,000 net contracts.

This week’s current strength score (the trader positioning range over the past three years, measured from 0 to 100) shows the speculators are currently Bullish-Extreme with a score of 90.8 percent. The commercials are Bearish-Extreme with a score of 10.7 percent and the small traders (not shown in chart) are Bullish with a score of 65.8 percent.

Price Trend-Following Model: Uptrend

Our weekly trend-following model classifies the current market price position as: Uptrend. The current action for the model is considered to be: Hold – Maintain Long Position.

VIX Volatility Futures StatisticsSPECULATORSCOMMERCIALSSMALL TRADERS
– Percent of Open Interest Longs:24.640.97.0
– Percent of Open Interest Shorts:30.633.38.6
– Net Position:-22,43328,429-5,996
– Gross Longs:91,655152,81226,276
– Gross Shorts:114,088124,38332,272
– Long to Short Ratio:0.8 to 11.2 to 10.8 to 1
NET POSITION TREND:
– Strength Index Score (3 Year Range Pct):90.810.765.8
– Strength Index Reading (3 Year Range):Bullish-ExtremeBearish-ExtremeBullish
NET POSITION MOVEMENT INDEX:
– 6-Week Change in Strength Index:24.2-22.3-10.9


S&P500 Mini Futures:

SP500 Mini Futures COT ChartThe S&P500 Mini large speculator standing this week equaled a net position of 43,133 contracts in the data reported through Tuesday. This was a weekly lowering of -24,545 contracts from the previous week which had a total of 67,678 net contracts.

This week’s current strength score (the trader positioning range over the past three years, measured from 0 to 100) shows the speculators are currently Bullish with a score of 71.2 percent. The commercials are Bearish-Extreme with a score of 19.1 percent and the small traders (not shown in chart) are Bullish with a score of 79.8 percent.

Price Trend-Following Model: Uptrend

Our weekly trend-following model classifies the current market price position as: Uptrend. The current action for the model is considered to be: Hold – Maintain Long Position.

S&P500 Mini Futures StatisticsSPECULATORSCOMMERCIALSSMALL TRADERS
– Percent of Open Interest Longs:13.669.413.9
– Percent of Open Interest Shorts:11.476.98.6
– Net Position:43,133-150,593107,460
– Gross Longs:272,8131,392,147279,080
– Gross Shorts:229,6801,542,740171,620
– Long to Short Ratio:1.2 to 10.9 to 11.6 to 1
NET POSITION TREND:
– Strength Index Score (3 Year Range Pct):71.219.179.8
– Strength Index Reading (3 Year Range):BullishBearish-ExtremeBullish
NET POSITION MOVEMENT INDEX:
– 6-Week Change in Strength Index:35.4-36.09.3


Dow Jones Mini Futures:

Dow Jones Mini Futures COT ChartThe Dow Jones Mini large speculator standing this week equaled a net position of 5,198 contracts in the data reported through Tuesday. This was a weekly reduction of -1,654 contracts from the previous week which had a total of 6,852 net contracts.

This week’s current strength score (the trader positioning range over the past three years, measured from 0 to 100) shows the speculators are currently Bullish with a score of 68.8 percent. The commercials are Bearish with a score of 28.6 percent and the small traders (not shown in chart) are Bullish with a score of 50.9 percent.

Price Trend-Following Model: Weak Uptrend

Our weekly trend-following model classifies the current market price position as: Weak Uptrend. The current action for the model is considered to be: Hold – Maintain Long Position.

Dow Jones Mini Futures StatisticsSPECULATORSCOMMERCIALSSMALL TRADERS
– Percent of Open Interest Longs:19.963.314.4
– Percent of Open Interest Shorts:14.170.712.8
– Net Position:5,198-6,6391,441
– Gross Longs:17,88356,95912,944
– Gross Shorts:12,68563,59811,503
– Long to Short Ratio:1.4 to 10.9 to 11.1 to 1
NET POSITION TREND:
– Strength Index Score (3 Year Range Pct):68.828.650.9
– Strength Index Reading (3 Year Range):BullishBearishBullish
NET POSITION MOVEMENT INDEX:
– 6-Week Change in Strength Index:-28.126.1-3.6


Nasdaq Mini Futures:

Nasdaq Mini Futures COT ChartThe Nasdaq Mini large speculator standing this week equaled a net position of 2,772 contracts in the data reported through Tuesday. This was a weekly decrease of -3,353 contracts from the previous week which had a total of 6,125 net contracts.

This week’s current strength score (the trader positioning range over the past three years, measured from 0 to 100) shows the speculators are currently Bearish with a score of 43.5 percent. The commercials are Bearish with a score of 36.5 percent and the small traders (not shown in chart) are Bullish-Extreme with a score of 98.6 percent.

Price Trend-Following Model: Uptrend

Our weekly trend-following model classifies the current market price position as: Uptrend. The current action for the model is considered to be: Hold – Maintain Long Position.

Nasdaq Mini Futures StatisticsSPECULATORSCOMMERCIALSSMALL TRADERS
– Percent of Open Interest Longs:23.855.117.6
– Percent of Open Interest Shorts:22.760.813.0
– Net Position:2,772-14,55711,785
– Gross Longs:60,312139,47544,588
– Gross Shorts:57,540154,03232,803
– Long to Short Ratio:1.0 to 10.9 to 11.4 to 1
NET POSITION TREND:
– Strength Index Score (3 Year Range Pct):43.536.598.6
– Strength Index Reading (3 Year Range):BearishBearishBullish-Extreme
NET POSITION MOVEMENT INDEX:
– 6-Week Change in Strength Index:-13.03.313.2


Russell 2000 Mini Futures:

Russell 2000 Mini Futures COT ChartThe Russell 2000 Mini large speculator standing this week equaled a net position of -40,289 contracts in the data reported through Tuesday. This was a weekly fall of -4,189 contracts from the previous week which had a total of -36,100 net contracts.

This week’s current strength score (the trader positioning range over the past three years, measured from 0 to 100) shows the speculators are currently Bullish with a score of 56.5 percent. The commercials are Bearish with a score of 43.5 percent and the small traders (not shown in chart) are Bearish with a score of 43.8 percent.

Price Trend-Following Model: Uptrend

Our weekly trend-following model classifies the current market price position as: Uptrend. The current action for the model is considered to be: Hold – Maintain Long Position.

Russell 2000 Mini Futures StatisticsSPECULATORSCOMMERCIALSSMALL TRADERS
– Percent of Open Interest Longs:14.677.45.6
– Percent of Open Interest Shorts:23.070.04.6
– Net Position:-40,28935,8924,397
– Gross Longs:70,255372,28426,725
– Gross Shorts:110,544336,39222,328
– Long to Short Ratio:0.6 to 11.1 to 11.2 to 1
NET POSITION TREND:
– Strength Index Score (3 Year Range Pct):56.543.543.8
– Strength Index Reading (3 Year Range):BullishBearishBearish
NET POSITION MOVEMENT INDEX:
– 6-Week Change in Strength Index:-19.019.6-12.9


Nikkei Stock Average (USD) Futures:

Nikkei Stock Average (USD) Futures COT ChartThe Nikkei Stock Average (USD) large speculator standing this week equaled a net position of -1,791 contracts in the data reported through Tuesday. This was a weekly decrease of -407 contracts from the previous week which had a total of -1,384 net contracts.

This week’s current strength score (the trader positioning range over the past three years, measured from 0 to 100) shows the speculators are currently Bullish with a score of 64.9 percent. The commercials are Bearish with a score of 36.2 percent and the small traders (not shown in chart) are Bullish with a score of 51.4 percent.

Price Trend-Following Model: Uptrend

Our weekly trend-following model classifies the current market price position as: Uptrend. The current action for the model is considered to be: Hold – Maintain Long Position.

Nikkei Stock Average Futures StatisticsSPECULATORSCOMMERCIALSSMALL TRADERS
– Percent of Open Interest Longs:7.271.221.6
– Percent of Open Interest Shorts:18.365.616.1
– Net Position:-1,791909882
– Gross Longs:1,16111,5193,490
– Gross Shorts:2,95210,6102,608
– Long to Short Ratio:0.4 to 11.1 to 11.3 to 1
NET POSITION TREND:
– Strength Index Score (3 Year Range Pct):64.936.251.4
– Strength Index Reading (3 Year Range):BullishBearishBullish
NET POSITION MOVEMENT INDEX:
– 6-Week Change in Strength Index:-3.28.1-13.9


MSCI EAFE Mini Futures:

MSCI EAFE Mini Futures COT ChartThe MSCI EAFE Mini large speculator standing this week equaled a net position of -11,145 contracts in the data reported through Tuesday. This was a weekly lowering of -7,498 contracts from the previous week which had a total of -3,647 net contracts.

This week’s current strength score (the trader positioning range over the past three years, measured from 0 to 100) shows the speculators are currently Bullish with a score of 54.9 percent. The commercials are Bearish with a score of 43.2 percent and the small traders (not shown in chart) are Bearish with a score of 42.7 percent.

Price Trend-Following Model: Uptrend

Our weekly trend-following model classifies the current market price position as: Uptrend. The current action for the model is considered to be: Hold – Maintain Long Position.

MSCI EAFE Mini Futures StatisticsSPECULATORSCOMMERCIALSSMALL TRADERS
– Percent of Open Interest Longs:6.490.42.9
– Percent of Open Interest Shorts:9.088.91.6
– Net Position:-11,1455,9895,156
– Gross Longs:27,229384,16612,135
– Gross Shorts:38,374378,1776,979
– Long to Short Ratio:0.7 to 11.0 to 11.7 to 1
NET POSITION TREND:
– Strength Index Score (3 Year Range Pct):54.943.242.7
– Strength Index Reading (3 Year Range):BullishBearishBearish
NET POSITION MOVEMENT INDEX:
– 6-Week Change in Strength Index:-3.64.7-5.7


Article By InvestMacroReceive our weekly COT Newsletter

*COT Report: The COT data, released weekly to the public each Friday, is updated through the most recent Tuesday (data is 3 days old) and shows a quick view of how large speculators or non-commercials (for-profit traders) were positioned in the futures markets.

The CFTC categorizes trader positions according to commercial hedgers (traders who use futures contracts for hedging as part of the business), non-commercials (large traders who speculate to realize trading profits) and nonreportable traders (usually small traders/speculators) as well as their open interest (contracts open in the market at time of reporting). See CFTC criteria here.

Is Intel (INTC) a Buy, Sell, or Hold Amidst Tough Competition?

By Ino.com

Intel Corporation (INTC), a prominent semiconductor company, is currently navigating a challenging phase characterized by a dwindling financial outlook and difficulties sustaining competitiveness within the semiconductor industry. Intel stands behind many tech stocks in the S&P 500 this year, while rival chipmaker NVIDIA Corporation (NVDA) emerges as the third-best performer in the index.

Now, we will evaluate the risks and opportunities associated with investing in Intel amidst competitive pressures.

Strategic Initiatives to Keep up With the Fierce Competition

Amid escalating competition in the tech arena, INTC, the foremost producer of processors driving PCs and laptops, has aggressively expanded its presence in the AI domain to remain abreast of its peers.

Last month, the company announced the creation of the world’s largest neuromorphic system, dubbed Hala Point, which is powered by Intel’s Loihi 2 processor. Initially deployed at Sandia National Laboratories, this system supports research for future brain-inspired AI and addresses challenges concerning AI efficiency and sustainability.

On April 9, Intel also unveiled a new AI chip called Gaudi 3, which was intended to compete against NVDA’s dominance in popular graphics processing units. The new chip boasts over twice the power efficiency and can run AI models one-and-a-half times faster than NVDA’s H100 GPU. The company expects more than $500 million in sales from its Gaudi 3 chips in the year’s second half.

In March, Reuters reported that INTC plans to spend $100 billion across four U.S. states to build and expand factories, bolstered by $19.5 billion in federal grants and loans (with an additional $25 billion in tax incentives in sight). CEO Pat Gelsinger envisions transforming vacant land near Columbus, Ohio, into “the largest AI chip manufacturing site globally” by 2027, forming the cornerstone of Intel’s ambitious five-year spending plan.

Such advancements enable the company to stay competitive and meet the growing demand for AI-driven solutions across various industries.

Solid First-Quarter Performance but Shaky Outlook

For the first quarter that ended March 30, 2024, INTC’s net revenue surged 8.6% year-over-year to $12.72 billion, primarily driven by growth in its personal computing, data center, and AI business. However, its revenue from the Foundry unit amounted to $4.40 billion, down about 10% year-over-year.

Intel’s gross margin grew 30.2% from the prior year’s quarter to $5.22 billion. Also, it reported a non-GAAP operating income of $723 million, compared to an operating loss of $294 million in 2023. Further, its non-GAAP net income and non-GAAP earnings per share came in at $759 million and $0.18 versus a net loss and loss per share of $169 million and $0.04, respectively, in the same quarter last year.

The solid financial performance underscores the vital innovation across its client, edge, and data center portfolios, driving double-digit product revenue growth. Total Intel Products chalked up $11.90 billion in revenue for the first quarter of 2024, resulting in a 17% year-over-year increase over the prior year’s period. Its Client Computing Group (CCG) contributed to about 31% of the gains of this unit.

However, the company lowered its outlook for the second quarter of 2024. The company expects its revenue to come between $12.5 billion and $13.5 billion, while its non-GAAP earnings per share is expected to be $0.10.

Following the company’s weak guidance for the ongoing quarter, Intel shares nosedived as much as 13% on Friday morning, overshadowing its first-quarter earnings beat. Also, the stock has plunged nearly 15% over the past six months and more than 39% year-to-date.

Bottom Line

INTC surpassed analyst estimates on the top and bottom lines in the first quarter of 2024, but achieving full recovery appears challenging. The chipmaker provided a weak outlook for the second quarter, validating concerns about its ongoing struggle to capitalize on the AI boom amid competition pressures.

Looking ahead, analysts expect INTC’s revenue to increase marginally year-over-year to $13.09 billion for the quarter ending June 2024. However, the company’s EPS for the current quarter is expected to fall 16.2% from the prior year’s period to $0.11.

For the fiscal year 2024, the consensus revenue and EPS estimates of $56.06 billion and $1.10 indicate increases of 3.4% and 5.2% year-over-year, respectively.

Recently, Goldman Sachs analysts slashed their price target for Intel stock by $5 to $34 per share and reaffirmed a ‘Sell’ rating in light of heightened competition in the artificial intelligence landscape.

Toshiya Hari noted that the company’s weak guidance was due to delayed recovery in traditional server demand, driven by cloud and enterprise customers’ focus on AI infrastructure spending. As a result, it could lead INTC to lose market share to competitors like NVDA and Arm Holdings plc (ARM) in the data center computing market.

Moreover, analysts at Bank of America decreased their price target on the stock from $44 to $40, citing rising costs, slower growth prospects, and intensified competition.

Additionally, INTC’s elevated valuation exacerbates market sensitivity. In terms of forward non-GAAP P/E, the stock trades at 27.58x, 18.9% above the industry average of 23.19x. Furthermore, its forward EV/Sales of 2.93x is 5.7% higher than the industry average of 2.77x. And the stock’s forward EV/EBIT of 31.80x compares to the industry average of 19.07x.

Also, the stock’s trailing-12-month gross profit and EBIT margins of 41.49% and 1.29% are 14.7% and 73.1% lower than the industry averages of 48.64% and 4.80%, respectively. Likewise, its asset turnover ratio of negative 0.29x compares to the industry average of 0.61x.

Given this backdrop, while we wouldn’t recommend investing in INTC now, keeping a close eye on the stock seems prudent.

By Ino.com – See our Trader Blog, INO TV Free & Market Analysis Alerts

Source: Is Intel (INTC) a Buy, Sell, or Hold Amidst Tough Competition?

Week Ahead: UK100 set for more record highs?

By ForexTime 

  • UK100 ↑ over 2% in April
  • Index could see heightened volatility
  • BoE decision & Q1 GDP in focus
  • Bullish on D1 but RSI overbought
  • Key levels of interest at 8200, 8110 & 8023

Even as the clock ticks down to the US jobs report this afternoon (Friday, 3rd May), markets are bracing for more action in the week ahead.

Key central bank decisions, top economic data, and another volley of corporate earnings could present fresh trading opportunities:

Monday, 6th May

  • CN50: China Caixin services PMI
  • EU50: Eurozone S&P Global Services PMI, PPI
  • CHF: SNB President Thomas Jordan speech
  • US500: New York Fed President Williams, Richmond Fed President Barkin speech

Tuesday, 7th May

  • CNH: China forex reserves
  • AU200: RBA rate decision
  • EU50: Eurozone retail sales
  • GER40: Germany factory orders
  • TWN: Taiwan CPI
  • USD: Minneapolis Fed President Neel Kashkari
  • US30: Walt Disney earnings
  • UK100: BP earnings

Wednesday, 8th May

  • GER40: Germany industrial production
  • SEK: Riksbank rate decision
  • TWN: Taiwan trade
  • USD: Fed Governor Lisa Cook speech
  • JP225: Toyota earnings

Thursday, 9th May  

  • CN50: China trade
  • JP225: BoJ summary of opinions
  • ZAR: South Africa manufacturing production
  • USD: US initial jobless claims
  • UK100: BoE rate decision

Friday, 10th May

  • CAD: Canada unemployment
  • JP225: Japan household spending
  • EUR: ECB meeting minutes
  • NZD: New Zealand home sales, PMI
  • USD: University of Michigan consumer sentiment, Chicago Fed President Goolsbee speech
  • UK100: UK industrial production, Q1 GDP, BOE Chief Economist Huw Pill speech

FXTM’s UK100 caught our attention this morning after kissing a fresh all-time high.

Note: UK100 tracks the FTSE100 index – the benchmark measuring the stock performance of the 100 largest listed companies on the London Stock Exchange.

After ending April over 2% higher and hitting record highs along the way, it looks like the FTSE100 has got its mojo back. Bulls have been supported by easing geopolitical risks and expectations around the BoE cutting interest rates by August.

With all the above said, the week ahead could be volatile for the UK100!

Here are 3 reasons why:

    1) BoE rate decision

The Bank of England is widely expected to leave interest rates unchanged next week.

So much focus will be directed towards the policy statement, BoE Bailey’s news conference and the quarterly Monetary Policy Report (MPR) – making it a super Thursday combo.

Note: Over 80% of the revenues from FTSE100 companies come from outside of the UK.

So essentially, when the pound appreciates, it results in lower revenues for those companies that acquire sales from overseas – dragging the UK100 lower as a result. The same is true vice versa.

Traders are currently pricing in a 45% probability of a 25-basis point BoE cut by June with this jumping to 89% by August.

  • The UK100 could push higher if the pound weakens on any hints around lower UK rates.
  • Should a hawkish-sounding BoE boost the pound, the UK100 could fall.


    2) Key UK data

Beyond the BoE rate decision, all eyes will be on first-quarter GDP figures published on Friday.

Markets expect a modest quarter-on-quarter growth of 0.4% as the economy rebounds from the mild recession in the second half of 2023. Also, keep an eye on the latest industrial production figures which could provide additional insight into the health of the UK economy.

  • Should the data support the case for lower UK interest rates, this could support the UK100.
  • If the reports push back BoE cut bets – this may hit the UK100 as the pound strengthens.

Note: On the earnings front, BP’s latest results published on Tuesday could trigger volatility as it accounts for just over 4% of the FTSE100 weighting.


    3) Technical forces 

The UK100 is firmly bullish on the daily charts with prices above the 50, 100 and 200-day SMA. However, the Relative Strength Index indicates that overbought conditions have been reached.

  • A solid weekly close above 8200 may encourage a move towards the next psychological level at 8300.
  • Should prices slip below 8200, this could trigger a decline towards 8111 and potentially 8023 before bulls jump back into the scene.


Forex-Time-LogoArticle by ForexTime
ForexTime Ltd (FXTM) is an award winning international online forex broker regulated by CySEC 185/12 www.forextime.com