Archive for Stock Market News – Page 15

COT Stock Market Charts: Speculator bets led by MSCI EAFE & Nasdaq

By InvestMacro

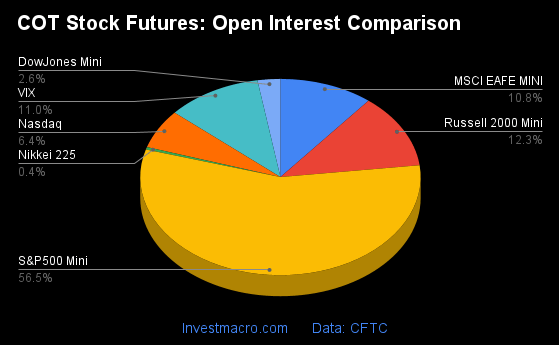
Here are the latest charts and statistics for the Commitment of Traders (COT) data published by the Commodities Futures Trading Commission (CFTC).

The latest COT data is updated through Tuesday June 4th and shows a quick view of how large traders (for-profit speculators and commercial entities) were positioned in the futures markets.

Weekly Speculator Changes led by MSCI EAFE & Nasdaq

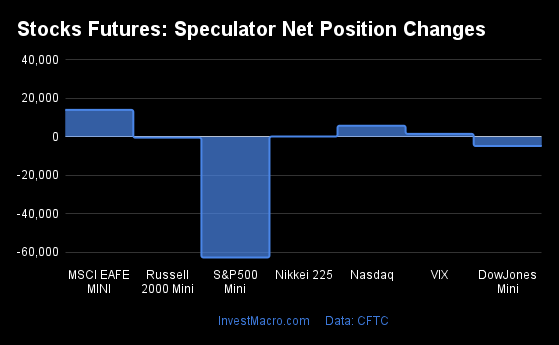
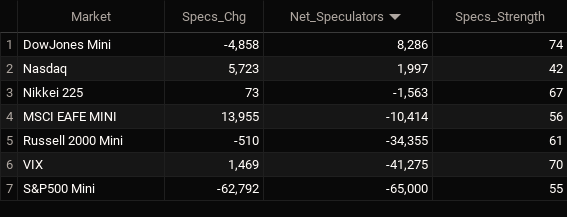
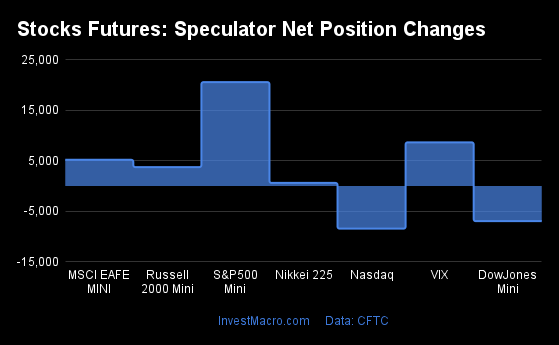
The COT stock markets speculator bets were higher this week as four out of the seven stock markets we cover had higher positioning while the other three markets had lower speculator contracts.

Leading the gains for the stock markets was with the MSCI EAFE-Mini (13,955 contracts), the Nasdaq-Mini (5,723 contracts), the VIX (1,469 contracts) and the Nikkei 225 (73 contracts) also showing positive weeks.

The markets with the declines in speculator bets this week were the S&P500-Mini (-62,792 contracts), the DowJones-Mini (-4,858 contracts) and with the Russell-Mini (-510 contracts) also registering lower bets on the week.


Stock Market Net Speculators Leaderboard

Legend: Weekly Speculators Change | Speculators Current Net Position | Speculators Strength Score compared to last 3-Years (0-100 range)


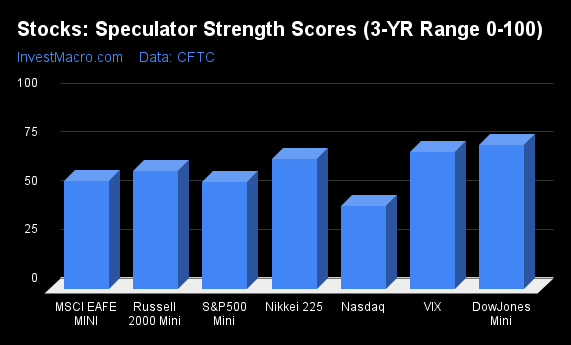
Strength Scores led by DowJones-Mini & VIX

COT Strength Scores (a normalized measure of Speculator positions over a 3-Year range, from 0 to 100 where above 80 is Extreme-Bullish and below 20 is Extreme-Bearish) showed that the DowJones-Mini (74 percent) and the VIX (70 percent) lead the stock markets this week. The Nikkei 225 (67 percent) comes in as the next highest in the weekly strength scores.

On the downside, the Nasdaq-Mini (42 percent) comes in at the lowest strength level currently.

Strength Statistics:
VIX (70.4 percent) vs VIX previous week (68.9 percent)
S&P500-Mini (55.0 percent) vs S&P500-Mini previous week (64.4 percent)
DowJones-Mini (73.8 percent) vs DowJones-Mini previous week (81.7 percent)
Nasdaq-Mini (42.3 percent) vs Nasdaq-Mini previous week (33.4 percent)
Russell2000-Mini (60.7 percent) vs Russell2000-Mini previous week (61.1 percent)
Nikkei USD (66.8 percent) vs Nikkei USD previous week (66.2 percent)
EAFE-Mini (55.6 percent) vs EAFE-Mini previous week (41.2 percent)


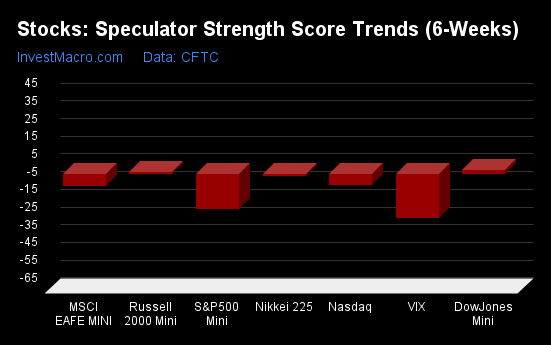
DowJones-Mini & Russell-Mini top the 6-Week Strength Trends

COT Strength Score Trends (or move index, calculates the 6-week changes in strength scores) showed that the DowJones-Mini (2 percent) and the Russell-Mini (1 percent) lead the past six weeks and are the only positive movers in the latest trends data.

The VIX (-25 percent) leads the downside trend scores currently with the S&P500-Mini (-20 percent) coming in as the next market with the lowest trend score.

Strength Trend Statistics:
VIX (-25.2 percent) vs VIX previous week (-21.9 percent)
S&P500-Mini (-19.8 percent) vs S&P500-Mini previous week (-11.4 percent)
DowJones-Mini (2.3 percent) vs DowJones-Mini previous week (-0.9 percent)
Nasdaq-Mini (-6.4 percent) vs Nasdaq-Mini previous week (-19.0 percent)
Russell2000-Mini (1.2 percent) vs Russell2000-Mini previous week (3.3 percent)
Nikkei USD (-1.5 percent) vs Nikkei USD previous week (-6.7 percent)
EAFE-Mini (-7.0 percent) vs EAFE-Mini previous week (-19.4 percent)


Individual Stock Market Charts:

VIX Volatility Futures:

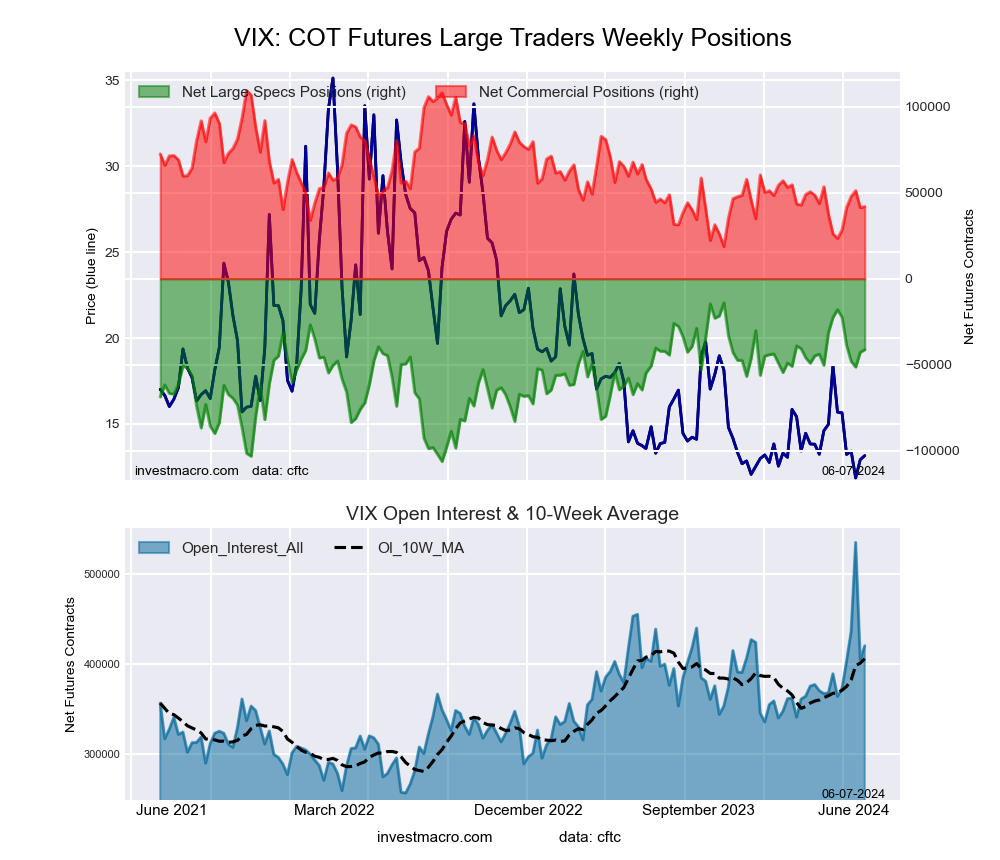
VIX Volatility Futures COT ChartThe VIX Volatility large speculator standing this week resulted in a net position of -41,275 contracts in the data reported through Tuesday. This was a weekly boost of 1,469 contracts from the previous week which had a total of -42,744 net contracts.

This week’s current strength score (the trader positioning range over the past three years, measured from 0 to 100) shows the speculators are currently Bullish with a score of 70.4 percent. The commercials are Bearish with a score of 25.6 percent and the small traders (not shown in chart) are Bullish-Extreme with a score of 89.8 percent.

Price Trend-Following Model: Strong Downtrend

Our weekly trend-following model classifies the current market price position as: Strong Downtrend. The current action for the model is considered to be: New Sell – Short Position.

VIX Volatility Futures StatisticsSPECULATORSCOMMERCIALSSMALL TRADERS
– Percent of Open Interest Longs:22.839.67.2
– Percent of Open Interest Shorts:32.629.67.4
– Net Position:-41,27541,985-710
– Gross Longs:95,865166,55530,228
– Gross Shorts:137,140124,57030,938
– Long to Short Ratio:0.7 to 11.3 to 11.0 to 1
NET POSITION TREND:
– Strength Index Score (3 Year Range Pct):70.425.689.8
– Strength Index Reading (3 Year Range):BullishBearishBullish-Extreme
NET POSITION MOVEMENT INDEX:
– 6-Week Change in Strength Index:-25.220.423.5


S&P500 Mini Futures:

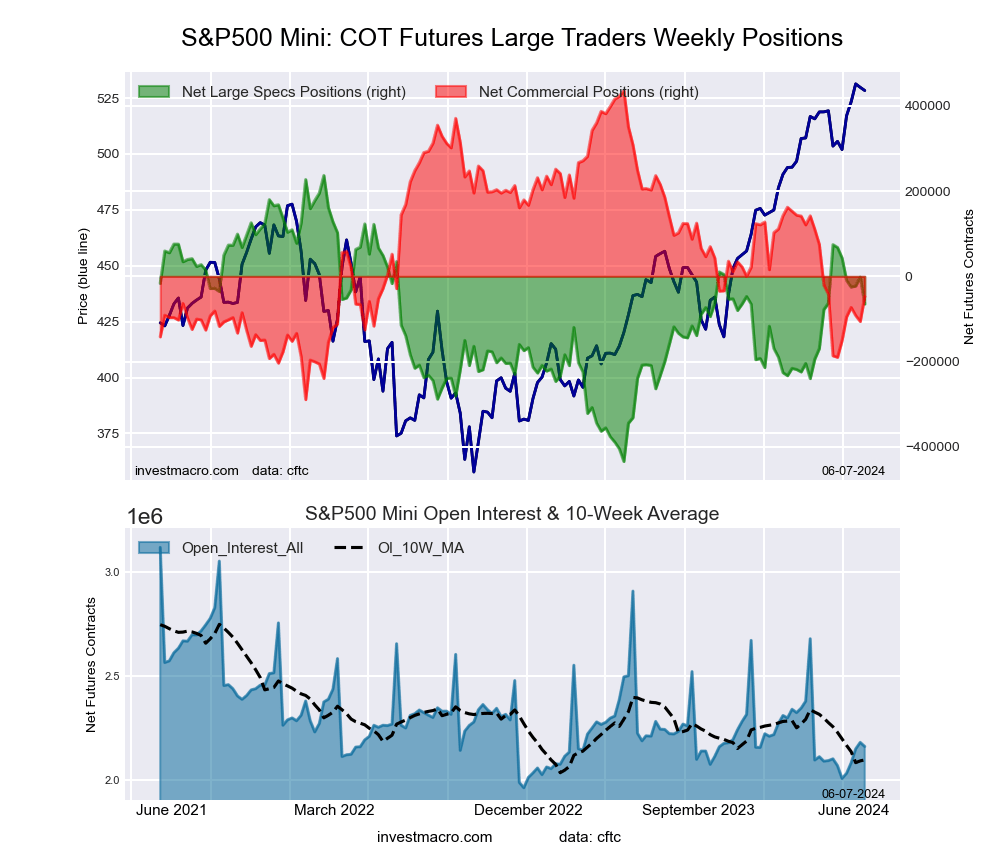
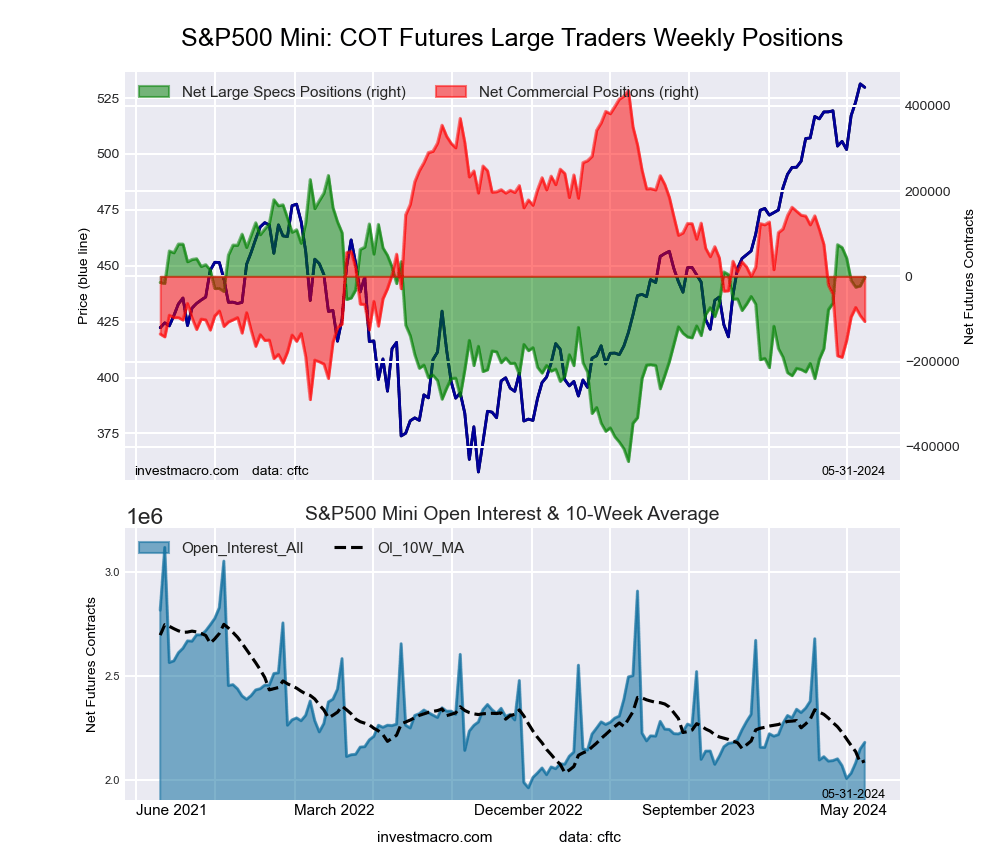
SP500 Mini Futures COT ChartThe S&P500 Mini large speculator standing this week resulted in a net position of -65,000 contracts in the data reported through Tuesday. This was a weekly decline of -62,792 contracts from the previous week which had a total of -2,208 net contracts.

This week’s current strength score (the trader positioning range over the past three years, measured from 0 to 100) shows the speculators are currently Bullish with a score of 55.0 percent. The commercials are Bearish with a score of 33.4 percent and the small traders (not shown in chart) are Bullish-Extreme with a score of 81.6 percent.

Price Trend-Following Model: Strong Uptrend

Our weekly trend-following model classifies the current market price position as: Strong Uptrend. The current action for the model is considered to be: Hold – Maintain Long Position.

S&P500 Mini Futures StatisticsSPECULATORSCOMMERCIALSSMALL TRADERS
– Percent of Open Interest Longs:12.371.013.3
– Percent of Open Interest Shorts:15.373.28.1
– Net Position:-65,000-47,092112,092
– Gross Longs:265,4331,534,557287,673
– Gross Shorts:330,4331,581,649175,581
– Long to Short Ratio:0.8 to 11.0 to 11.6 to 1
NET POSITION TREND:
– Strength Index Score (3 Year Range Pct):55.033.481.6
– Strength Index Reading (3 Year Range):BullishBearishBullish-Extreme
NET POSITION MOVEMENT INDEX:
– 6-Week Change in Strength Index:-19.819.7-4.0


Dow Jones Mini Futures:

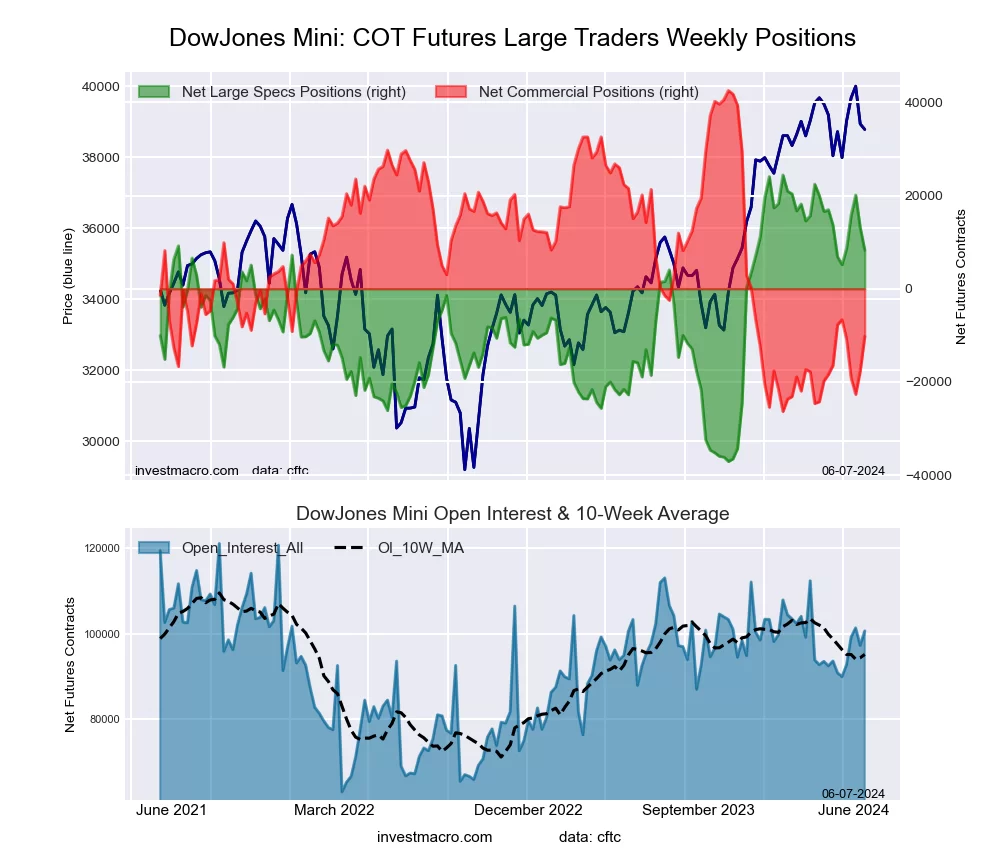
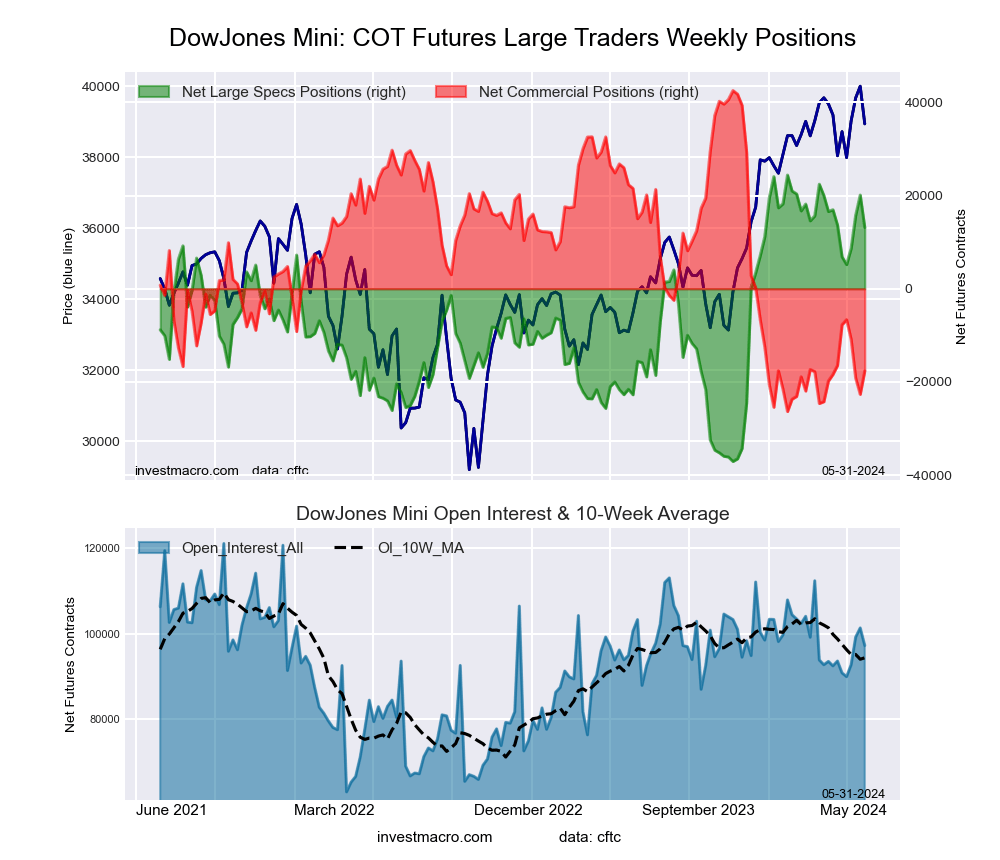
Dow Jones Mini Futures COT ChartThe Dow Jones Mini large speculator standing this week resulted in a net position of 8,286 contracts in the data reported through Tuesday. This was a weekly fall of -4,858 contracts from the previous week which had a total of 13,144 net contracts.

This week’s current strength score (the trader positioning range over the past three years, measured from 0 to 100) shows the speculators are currently Bullish with a score of 73.8 percent. The commercials are Bearish with a score of 23.4 percent and the small traders (not shown in chart) are Bullish with a score of 53.2 percent.

Price Trend-Following Model: Weak Uptrend

Our weekly trend-following model classifies the current market price position as: Weak Uptrend. The current action for the model is considered to be: Hold – Maintain Long Position.

Dow Jones Mini Futures StatisticsSPECULATORSCOMMERCIALSSMALL TRADERS
– Percent of Open Interest Longs:20.958.314.2
– Percent of Open Interest Shorts:12.668.512.3
– Net Position:8,286-10,1951,909
– Gross Longs:21,00858,70914,251
– Gross Shorts:12,72268,90412,342
– Long to Short Ratio:1.7 to 10.9 to 11.2 to 1
NET POSITION TREND:
– Strength Index Score (3 Year Range Pct):73.823.453.2
– Strength Index Reading (3 Year Range):BullishBearishBullish
NET POSITION MOVEMENT INDEX:
– 6-Week Change in Strength Index:2.3-3.65.0


Nasdaq Mini Futures:

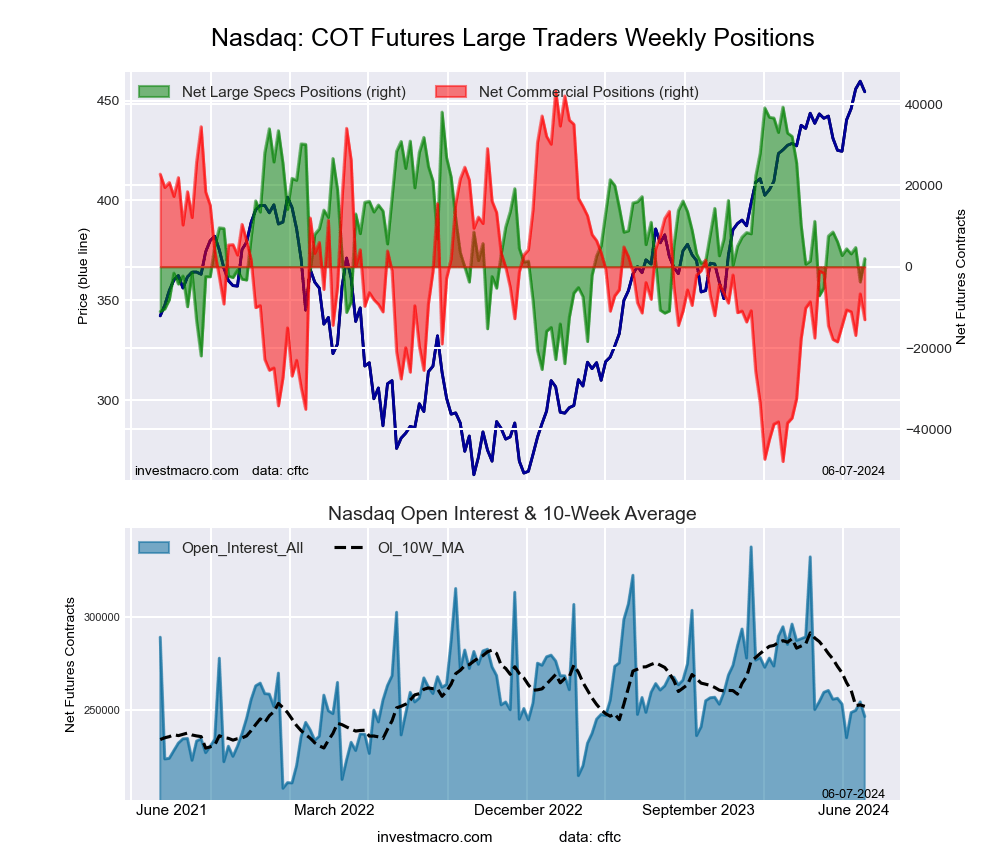
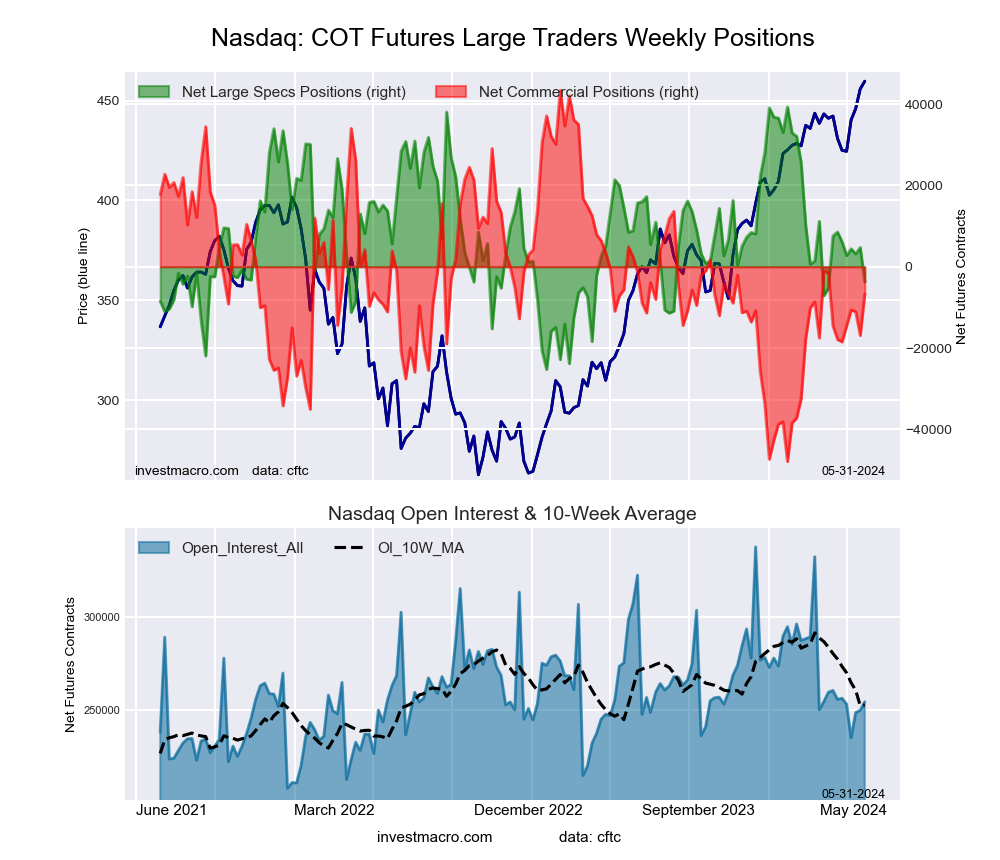
Nasdaq Mini Futures COT ChartThe Nasdaq Mini large speculator standing this week resulted in a net position of 1,997 contracts in the data reported through Tuesday. This was a weekly lift of 5,723 contracts from the previous week which had a total of -3,726 net contracts.

This week’s current strength score (the trader positioning range over the past three years, measured from 0 to 100) shows the speculators are currently Bearish with a score of 42.3 percent. The commercials are Bearish with a score of 38.2 percent and the small traders (not shown in chart) are Bullish-Extreme with a score of 96.8 percent.

Price Trend-Following Model: Strong Uptrend

Our weekly trend-following model classifies the current market price position as: Strong Uptrend. The current action for the model is considered to be: Hold – Maintain Long Position.

Nasdaq Mini Futures StatisticsSPECULATORSCOMMERCIALSSMALL TRADERS
– Percent of Open Interest Longs:24.456.417.6
– Percent of Open Interest Shorts:23.661.713.1
– Net Position:1,997-13,02711,030
– Gross Longs:60,252139,14243,392
– Gross Shorts:58,255152,16932,362
– Long to Short Ratio:1.0 to 10.9 to 11.3 to 1
NET POSITION TREND:
– Strength Index Score (3 Year Range Pct):42.338.296.8
– Strength Index Reading (3 Year Range):BearishBearishBullish-Extreme
NET POSITION MOVEMENT INDEX:
– 6-Week Change in Strength Index:-6.46.0-3.2


Russell 2000 Mini Futures:

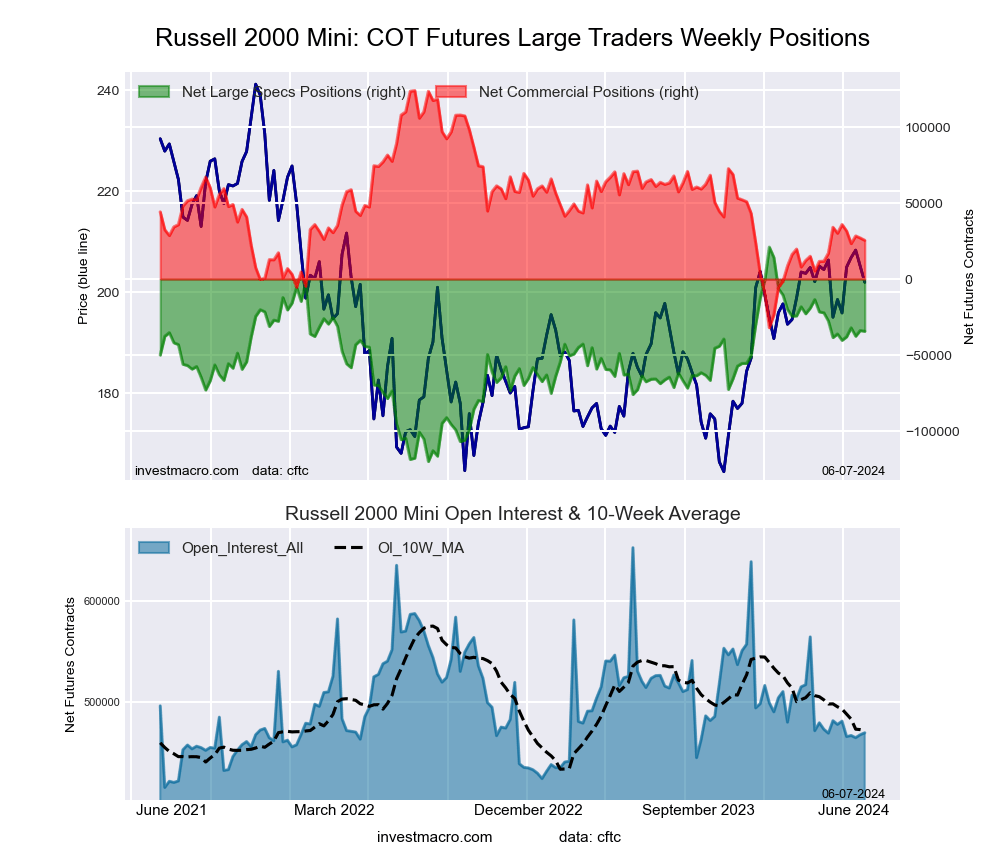
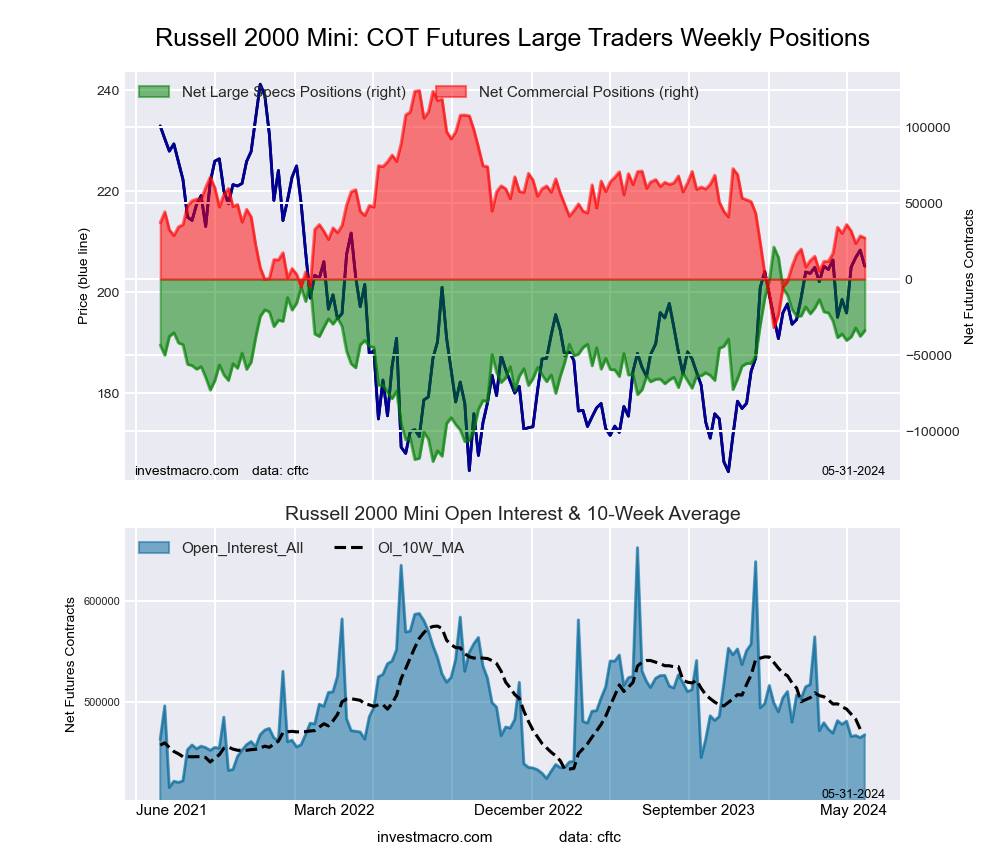
Russell 2000 Mini Futures COT ChartThe Russell 2000 Mini large speculator standing this week resulted in a net position of -34,355 contracts in the data reported through Tuesday. This was a weekly reduction of -510 contracts from the previous week which had a total of -33,845 net contracts.

This week’s current strength score (the trader positioning range over the past three years, measured from 0 to 100) shows the speculators are currently Bullish with a score of 60.7 percent. The commercials are Bearish with a score of 36.8 percent and the small traders (not shown in chart) are Bullish with a score of 58.9 percent.

Price Trend-Following Model: Weak Uptrend

Our weekly trend-following model classifies the current market price position as: Weak Uptrend. The current action for the model is considered to be: Hold – Maintain Long Position.

Russell 2000 Mini Futures StatisticsSPECULATORSCOMMERCIALSSMALL TRADERS
– Percent of Open Interest Longs:18.372.96.4
– Percent of Open Interest Shorts:25.767.54.5
– Net Position:-34,35525,4698,886
– Gross Longs:86,068342,25329,881
– Gross Shorts:120,423316,78420,995
– Long to Short Ratio:0.7 to 11.1 to 11.4 to 1
NET POSITION TREND:
– Strength Index Score (3 Year Range Pct):60.736.858.9
– Strength Index Reading (3 Year Range):BullishBearishBullish
NET POSITION MOVEMENT INDEX:
– 6-Week Change in Strength Index:1.2-3.09.9


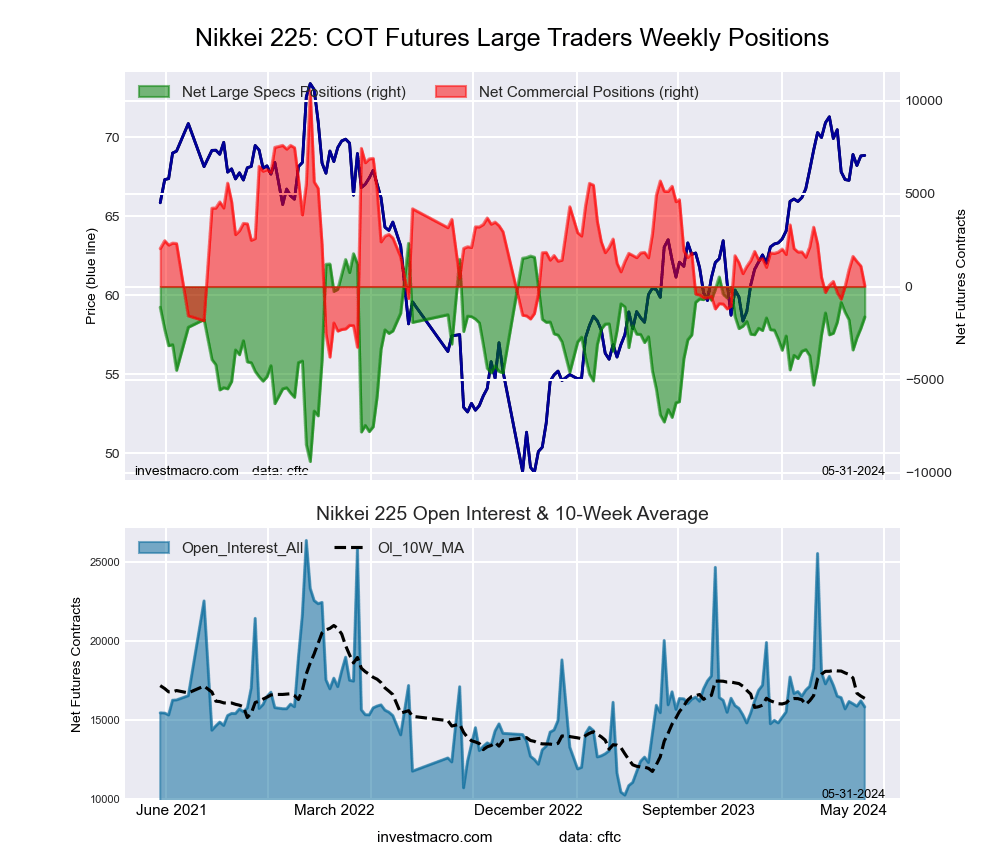
Nikkei Stock Average (USD) Futures:

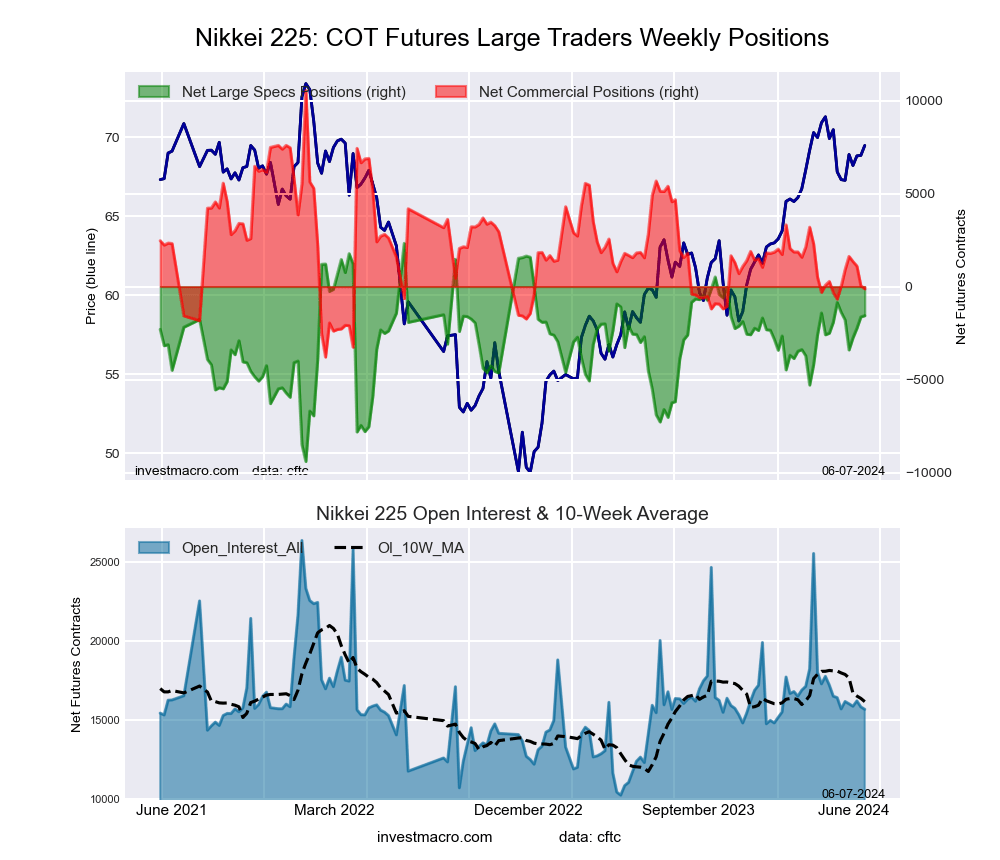
Nikkei Stock Average (USD) Futures COT ChartThe Nikkei Stock Average (USD) large speculator standing this week resulted in a net position of -1,563 contracts in the data reported through Tuesday. This was a weekly rise of 73 contracts from the previous week which had a total of -1,636 net contracts.

This week’s current strength score (the trader positioning range over the past three years, measured from 0 to 100) shows the speculators are currently Bullish with a score of 66.8 percent. The commercials are Bearish with a score of 25.6 percent and the small traders (not shown in chart) are Bullish with a score of 65.6 percent.

Price Trend-Following Model: Uptrend

Our weekly trend-following model classifies the current market price position as: Uptrend. The current action for the model is considered to be: Hold – Maintain Long Position.

Nikkei Stock Average Futures StatisticsSPECULATORSCOMMERCIALSSMALL TRADERS
– Percent of Open Interest Longs:10.063.823.9
– Percent of Open Interest Shorts:20.064.613.1
– Net Position:-1,563-1281,691
– Gross Longs:1,5699,9963,740
– Gross Shorts:3,13210,1242,049
– Long to Short Ratio:0.5 to 11.0 to 11.8 to 1
NET POSITION TREND:
– Strength Index Score (3 Year Range Pct):66.825.665.6
– Strength Index Reading (3 Year Range):BullishBearishBullish
NET POSITION MOVEMENT INDEX:
– 6-Week Change in Strength Index:-1.5-1.05.3


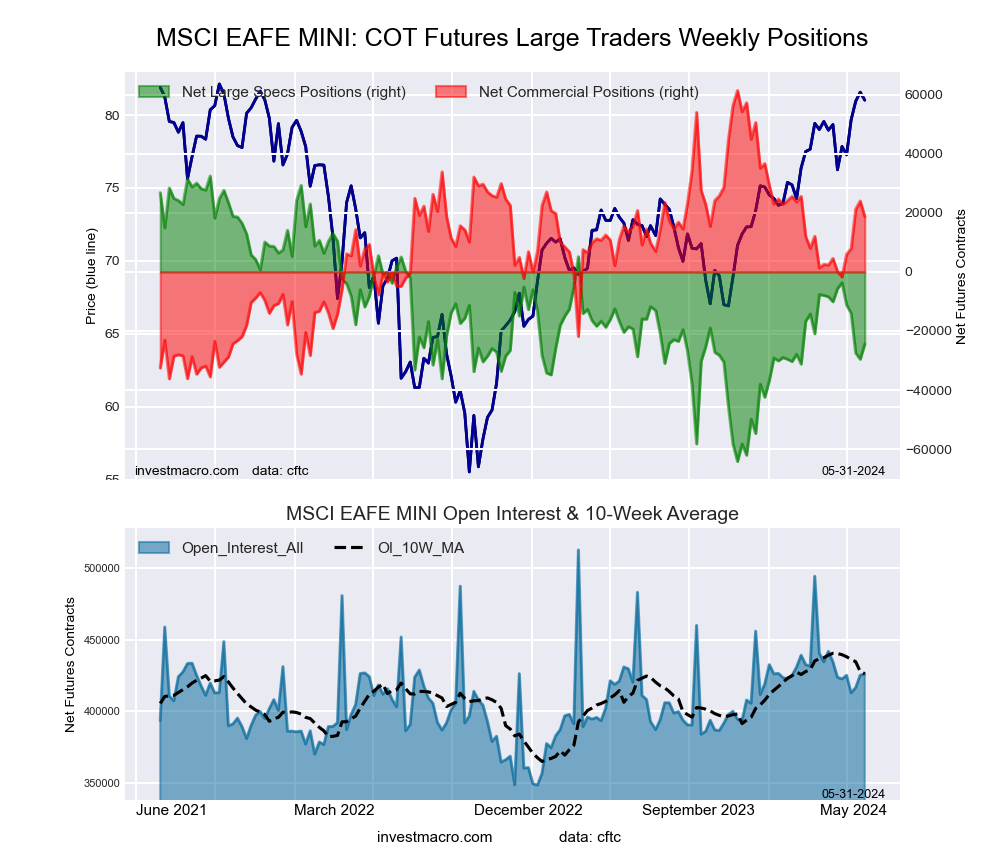
MSCI EAFE Mini Futures:

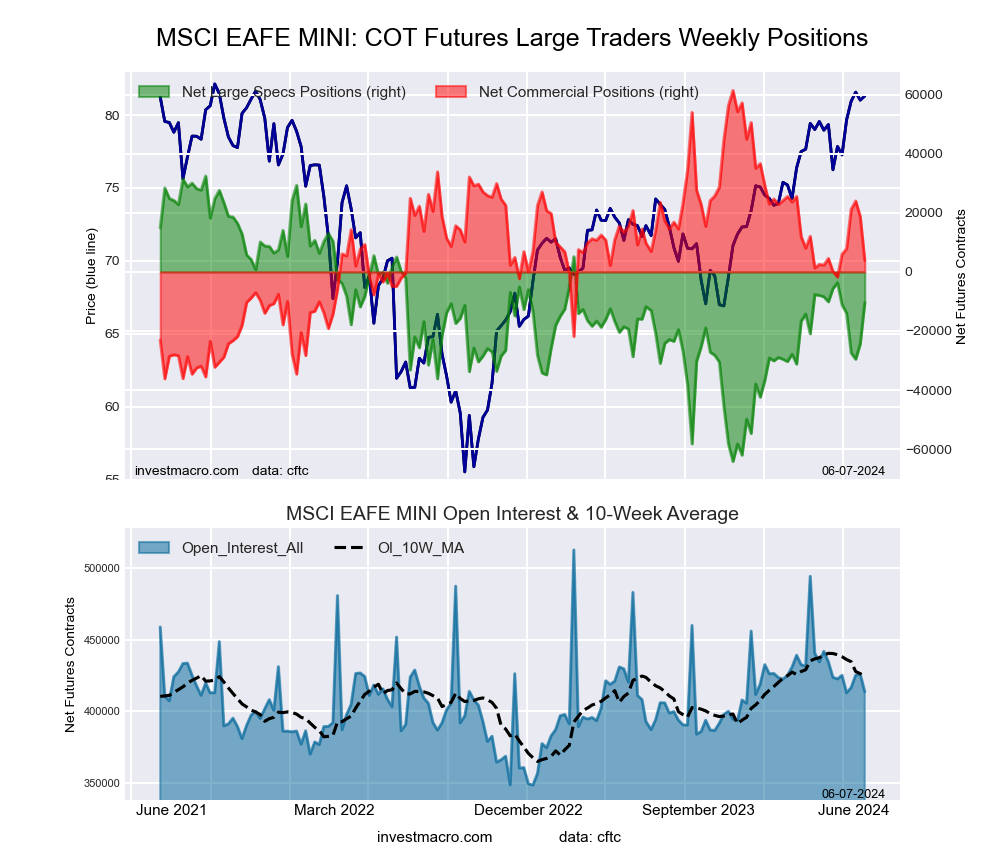
MSCI EAFE Mini Futures COT ChartThe MSCI EAFE Mini large speculator standing this week resulted in a net position of -10,414 contracts in the data reported through Tuesday. This was a weekly boost of 13,955 contracts from the previous week which had a total of -24,369 net contracts.

This week’s current strength score (the trader positioning range over the past three years, measured from 0 to 100) shows the speculators are currently Bullish with a score of 55.6 percent. The commercials are Bearish with a score of 41.0 percent and the small traders (not shown in chart) are Bearish with a score of 49.8 percent.

Price Trend-Following Model: Uptrend

Our weekly trend-following model classifies the current market price position as: Uptrend. The current action for the model is considered to be: Hold – Maintain Long Position.

MSCI EAFE Mini Futures StatisticsSPECULATORSCOMMERCIALSSMALL TRADERS
– Percent of Open Interest Longs:7.289.42.9
– Percent of Open Interest Shorts:9.788.41.3
– Net Position:-10,4143,8286,586
– Gross Longs:29,922369,75811,866
– Gross Shorts:40,336365,9305,280
– Long to Short Ratio:0.7 to 11.0 to 12.2 to 1
NET POSITION TREND:
– Strength Index Score (3 Year Range Pct):55.641.049.8
– Strength Index Reading (3 Year Range):BullishBearishBearish
NET POSITION MOVEMENT INDEX:
– 6-Week Change in Strength Index:-7.05.76.0


Article By InvestMacroReceive our weekly COT Newsletter

*COT Report: The COT data, released weekly to the public each Friday, is updated through the most recent Tuesday (data is 3 days old) and shows a quick view of how large speculators or non-commercials (for-profit traders) were positioned in the futures markets.

The CFTC categorizes trader positions according to commercial hedgers (traders who use futures contracts for hedging as part of the business), non-commercials (large traders who speculate to realize trading profits) and nonreportable traders (usually small traders/speculators) as well as their open interest (contracts open in the market at time of reporting). See CFTC criteria here.

Alibaba’s (BABA) Secret Weapon for Future Growth

By The Ino.com Team

Amid challenging regulatory pressures, economic headwinds, and fierce market competition, Alibaba Group Holding Limited (BABA) has showcased a resilient performance, as evidenced by its latest quarterly results. Shares of the Chinese e-commerce giant have gained more than 7% over the past three months. Moreover, the stock is trading above its 50-day and 200-day moving averages of $76.20 and $78.79, respectively, reflecting a solid momentum.

Alibaba’s diverse business portfolio continues to be a driving force behind its steady financial performance. For the fourth quarter that ended March 31, 2024, BABA’s revenue increased 7% year-over-year to $30.73 billion, beating the analysts’ estimate of $30.42 billion. The growth was driven by robust performances across its core e-commerce and cloud computing segments.

BABA’s strategic investments in Alibaba Cloud infrastructure and its domestic and international e-commerce platforms have spurred double-digit growth in key metrics such as gross merchandise value (GMV). Yet, the company’s income from operations dipped 3% from the prior-year quarter to $2.05 billion.

Navigating through cautious consumer spending in China, Alibaba has observed early signs of recovery in its primary e-commerce operations. Revenue from the Taobao and Tmall Group increased 4% year-over-year to $12.91 billion, while customer management revenue grew 5%, rebounding from a previously flat quarter. Also, revenue from the Alibaba International Digital Commerce Group (AIDC) surged 45% year-over-year to $3.80 billion.

BABA’s CEO Eddie Wu’s commitment to ‘reignite’ growth through further investments is beginning to yield results, as he noted the strategies were “working and we are returning to growth.”

But What’s Behind This Robust Growth?

Alibaba’s secret weapon lies in its digital technology and intelligence arm, Alibaba’s Cloud Intelligence Group, which stood as the company’s second-largest revenue generator last year. Revenue from this segment rose 3% year-over-year to $3.54 billion, driven by the double-digit growth of its public cloud business. Core offerings like elastic computing, databases, and AI products led to a notable triple-digit growth in AI-related revenue in the fourth quarter alone. This surge in demand for advanced AI solutions positions the company to capitalize on the burgeoning AI market.

To foster long-term growth and attract startups and small businesses, Alibaba aggressively slashed prices on over 100 core public cloud products (including Elastic Compute Service (ECS), Object Storage Service, and database product categories) in China. This initiative was later extended globally in April with a 23% average price reduction. Customers ordering through Alibaba’s official website can now enjoy discounts of up to 59% on computing, storage, network, database, and big data products.

“Cloud infrastructure is poised to be the key cornerstone for the future of AI, and our commitment lies in making sure that the foundation for AI development remains affordable,” said Selina Yuan, President of the International Business of Alibaba Cloud Intelligence.

Moreover, Alibaba Cloud’s AI capabilities have rapidly gained traction, with over 90,000 enterprises adopting the Qwen large language model (LLM) within a year of its debut and more than 7 million downloads on open-source platforms like Github. Alibaba Cloud introduced Qwen2.5, the latest addition to its Qwen model family, to meet the growing demand for AI solutions.

Furthermore, Alibaba Cloud recently launched a service to help companies customize and scale generative AI models, from consolidating multiple models to optimizing underlying infrastructure resources. The PAI-Lingjun Intelligent Computing Service, an AI computing platform tailored for high-performance computing tasks, also expanded its reach to Singapore for the first time this year.

Also, the group’s strategic focus on public cloud and operational efficiency resulted in an impressive 49% year-over-year increase in adjusted EBITDA to $848 million in fiscal year 2024. Such growth figures solidify Alibaba Cloud’s role as a crucial driver of the company’s future growth.

Is Price Cuts a Strategic Initiative or a Race to the Bottom?

Alibaba’s recent move to reduce prices across its cloud services has stirred the market. Some say it’s a smart move to attract more customers (especially with the growing demand for AI services), while others fear it could hurt profits in the long run.

With enterprises’ expenditure on generative AI services expected to reach $143 billion in 2027 globally, the timing of BABA’s price adjustments appears strategic, positioning the company to tap into this growing market.

Meanwhile, BABA’s price cuts have sparked a price war among Chinese tech giants, with Baidu Cloud and ByteDance quickly following suit with their competitive offerings. While these cuts benefit consumers, Alibaba’s footing in the global marketplace is tenuous. Despite holding over 30% of China’s Infrastructure as a Service market, Alibaba still trails behind AWS in the broader Asia Pacific region. Alibaba Cloud commands only a small fraction of the global cloud computing market, where AWS, Microsoft Azure, and Google Cloud dominate the landscape.

Making headway against these industry giants is not easy, especially considering their strong foothold in Western markets. While the price cuts may attract budget-conscious customers and bolster Alibaba’s presence in emerging markets, success hinges on maintaining high-quality service and innovation in the long run. Only time will tell if Alibaba’s gamble pays off.

Bottom Line

BABA reported a beat in revenue in the fourth quarter of fiscal 2024; however, the e-commerce giant’s earnings plunged. Despite a weak bottom line, CFO Toby Xu expressed confidence in the company’s business outlook, citing early positive results from strategic investments and partnerships. Alibaba sees AI as a significant driver of innovation and value creation within its ecosystem.

During the March quarter, AI-related revenue delivered “triple-digit growth year-over-year.” The revenue was generated from foundational model companies and internet companies, as well as customers from the financial services and automotive industries.

Analysts expect BABA’s revenue for the first quarter (ending June 2024) to increase 5.1% year-over-year to $34.10 billion. However, its EPS for the ongoing quarter is expected to decline by 15.6% year-over-year to $2.03. Further, for the fiscal year 2025, Alibaba’s revenue is forecasted to reach $140.92 billion (up 8.3% year-over-year), while the consensus EPS estimate of $8.23 indicates a 4.4% decline from the prior year.

In terms of forward non-GAAP P/E, BABA is trading at 9.61x, 39.5% lower than the industry average of 15.88x. Similarly, the stock’s forward EV/EBITDA and Price/Book multiples of 5.94 and 1.31 are 39% and 45.3% lower than the industry averages of 9.73 and 2.40, respectively.

In response to its low valuation, Alibaba’s management repurchased $4.8 billion worth of shares during the fourth quarter. Moreover, earlier this year, the company bolstered its share buyback program by an additional $25 billion, extending it through the end of March 2027.

In further demonstrating its commitment to returning value to shareholders, BABA approved a two-part dividend plan totaling $4 billion. This plan includes a regular cash dividend of $0.125 per ordinary share or $1 per ADS in FY24 and a one-time extraordinary cash dividend of $0.0825 per ordinary share or $0.66 per ADS. Both dividends will be paid out in U.S. dollars to holders of ordinary shares and ADS holders as of the close of business on June 13, 2024.

While the impact of price reductions on Alibaba’s bottom line remains to be seen, achieving double-digit revenue growth across its specific segments amid strategic pricing adjustments underscores the company’s resilience and adaptability in an ever-evolving market landscape.

By Ino.com – See our Trader Blog, INO TV Free & Market Analysis Alerts

Source: Alibaba’s (BABA) Secret Weapon for Future Growth

COT Stock Market Charts: Speculator bets led by S&P500 & VIX

By InvestMacro

Here are the latest charts and statistics for the Commitment of Traders (COT) data published by the Commodities Futures Trading Commission (CFTC).

The latest COT data is updated through Tuesday May 28th and shows a quick view of how large traders (for-profit speculators and commercial entities) were positioned in the futures markets.

Weekly Speculator Changes led by S&P500 & VIX

The COT stock markets speculator bets were higher this week as five out of the seven stock markets we cover had higher positioning while the other two markets had lower speculator contracts.

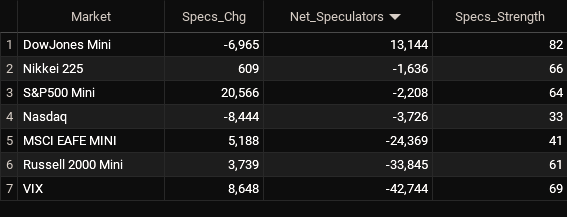
Leading the gains for the stock markets was with the S&P500-Mini (20,566 contracts), the VIX (8,648 contracts), the MSCI EAFE-Mini (5,188 contracts), the Russell-Mini (3,739 contracts) and the Nikkei 225 (609 contracts) also showing a positive week.

The markets with the declines in speculator bets this week were the Nasdaq-Mini (-8,444 contracts) with the DowJones-Mini (-6,965 contracts) also registering lower bets on the week.


Stock Market Net Speculators Leaderboard

Legend: Weekly Speculators Change | Speculators Current Net Position | Speculators Strength Score compared to last 3-Years (0-100 range)


Strength Scores led by DowJones-Mini

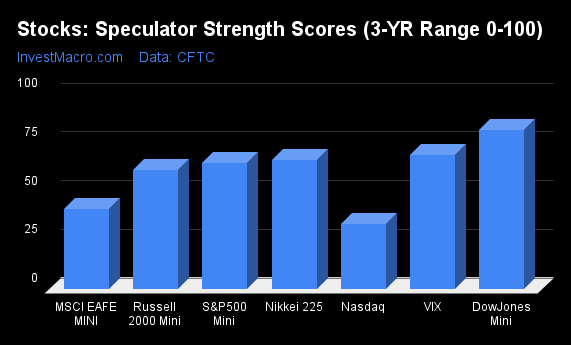
COT Strength Scores (a normalized measure of Speculator positions over a 3-Year range, from 0 to 100 where above 80 is Extreme-Bullish and below 20 is Extreme-Bearish) showed that the DowJones-Mini (82 percent) leads the stock markets this week. The VIX (69 percent) and Nikkei 225 (66 percent) came in as the next highest in the weekly strength scores.

On the downside, the Nasdaq-Mini (33 percent) comes in at the lowest strength level currently while the next lowest strength score is the MSCI EAFE-Mini (41 percent).

Strength Statistics:
VIX (68.9 percent) vs VIX previous week (59.5 percent)
S&P500-Mini (64.4 percent) vs S&P500-Mini previous week (61.3 percent)
DowJones-Mini (81.7 percent) vs DowJones-Mini previous week (93.0 percent)
Nasdaq-Mini (33.4 percent) vs Nasdaq-Mini previous week (46.5 percent)
Russell2000-Mini (61.1 percent) vs Russell2000-Mini previous week (58.4 percent)
Nikkei USD (66.2 percent) vs Nikkei USD previous week (61.0 percent)
EAFE-Mini (41.2 percent) vs EAFE-Mini previous week (35.8 percent)


Russell-Mini top the 6-Week Strength Trends

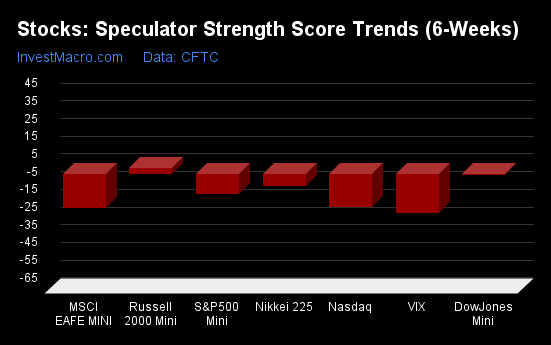
COT Strength Score Trends (or move index, calculates the 6-week changes in strength scores) showed that the Russell-Mini (3 percent) leads the past six weeks trends for the stock markets.

The VIX (-22 percent) leads the downside trend scores currently with the MSCI EAFE-Mini (-19 percent) coming in as the next market with lower trend scores.

Strength Trend Statistics:
VIX (-21.9 percent) vs VIX previous week (-21.7 percent)
S&P500-Mini (-11.4 percent) vs S&P500-Mini previous week (6.0 percent)
DowJones-Mini (-0.9 percent) vs DowJones-Mini previous week (5.1 percent)
Nasdaq-Mini (-19.0 percent) vs Nasdaq-Mini previous week (-4.4 percent)
Russell2000-Mini (3.3 percent) vs Russell2000-Mini previous week (-7.1 percent)
Nikkei USD (-6.7 percent) vs Nikkei USD previous week (-2.8 percent)
EAFE-Mini (-19.4 percent) vs EAFE-Mini previous week (-20.1 percent)


Individual Stock Market Charts:

VIX Volatility Futures:

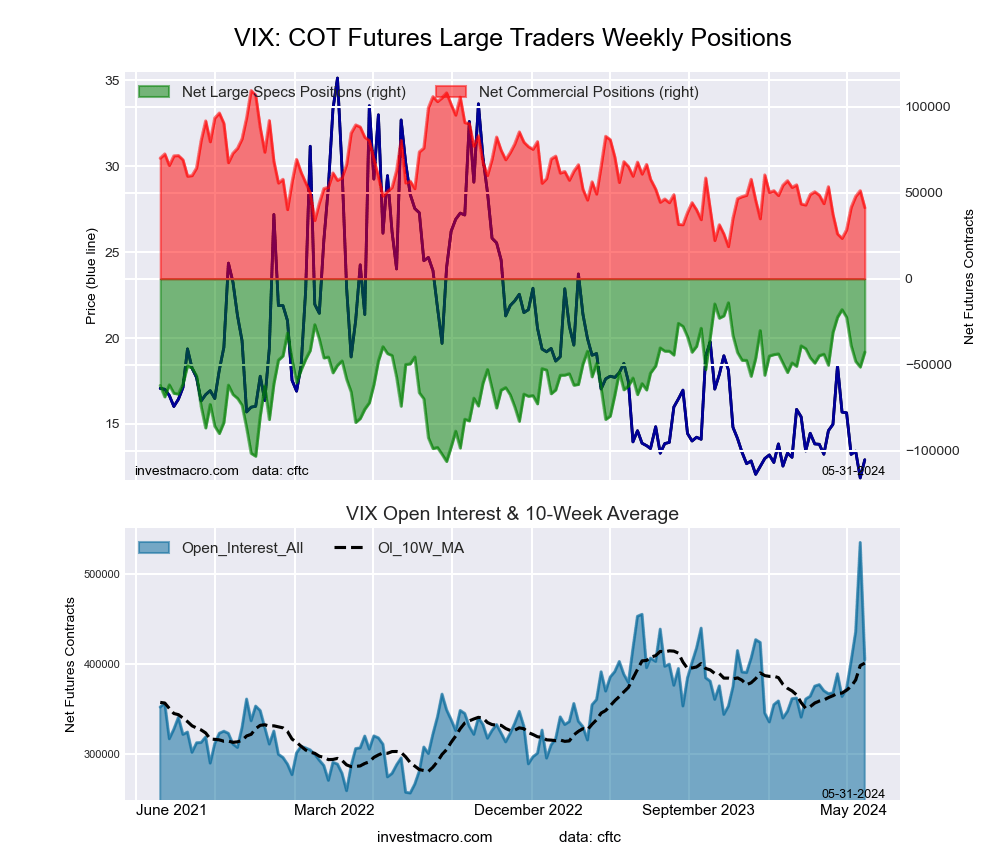
VIX Volatility Futures COT ChartThe VIX Volatility large speculator standing this week reached a net position of -42,744 contracts in the data reported through Tuesday. This was a weekly lift of 8,648 contracts from the previous week which had a total of -51,392 net contracts.

This week’s current strength score (the trader positioning range over the past three years, measured from 0 to 100) shows the speculators are currently Bullish with a score of 68.9 percent. The commercials are Bearish with a score of 25.0 percent and the small traders (not shown in chart) are Bullish-Extreme with a score of 100.0 percent.

Price Trend-Following Model: Strong Uptrend

Our weekly trend-following model classifies the current market price position as: Strong Uptrend. The current action for the model is considered to be: Hold – Maintain Long Position.

VIX Volatility Futures StatisticsSPECULATORSCOMMERCIALSSMALL TRADERS
– Percent of Open Interest Longs:20.540.87.5
– Percent of Open Interest Shorts:31.030.57.1
– Net Position:-42,74441,3981,346
– Gross Longs:82,966165,14330,267
– Gross Shorts:125,710123,74528,921
– Long to Short Ratio:0.7 to 11.3 to 11.0 to 1
NET POSITION TREND:
– Strength Index Score (3 Year Range Pct):68.925.0100.0
– Strength Index Reading (3 Year Range):BullishBearishBullish-Extreme
NET POSITION MOVEMENT INDEX:
– 6-Week Change in Strength Index:-21.916.824.6


S&P500 Mini Futures:

SP500 Mini Futures COT ChartThe S&P500 Mini large speculator standing this week reached a net position of -2,208 contracts in the data reported through Tuesday. This was a weekly advance of 20,566 contracts from the previous week which had a total of -22,774 net contracts.

This week’s current strength score (the trader positioning range over the past three years, measured from 0 to 100) shows the speculators are currently Bullish with a score of 64.4 percent. The commercials are Bearish with a score of 25.3 percent and the small traders (not shown in chart) are Bullish-Extreme with a score of 80.0 percent.

Price Trend-Following Model: Uptrend

Our weekly trend-following model classifies the current market price position as: Uptrend. The current action for the model is considered to be: Hold – Maintain Long Position.

S&P500 Mini Futures StatisticsSPECULATORSCOMMERCIALSSMALL TRADERS
– Percent of Open Interest Longs:15.269.013.3
– Percent of Open Interest Shorts:15.373.88.3
– Net Position:-2,208-105,944108,152
– Gross Longs:330,9371,503,708289,071
– Gross Shorts:333,1451,609,652180,919
– Long to Short Ratio:1.0 to 10.9 to 11.6 to 1
NET POSITION TREND:
– Strength Index Score (3 Year Range Pct):64.425.380.0
– Strength Index Reading (3 Year Range):BullishBearishBullish-Extreme
NET POSITION MOVEMENT INDEX:
– 6-Week Change in Strength Index:-11.411.1-1.6


Dow Jones Mini Futures:

Dow Jones Mini Futures COT ChartThe Dow Jones Mini large speculator standing this week reached a net position of 13,144 contracts in the data reported through Tuesday. This was a weekly decrease of -6,965 contracts from the previous week which had a total of 20,109 net contracts.

This week’s current strength score (the trader positioning range over the past three years, measured from 0 to 100) shows the speculators are currently Bullish-Extreme with a score of 81.7 percent. The commercials are Bearish-Extreme with a score of 12.6 percent and the small traders (not shown in chart) are Bullish with a score of 65.9 percent.

Price Trend-Following Model: Weak Uptrend

Our weekly trend-following model classifies the current market price position as: Weak Uptrend. The current action for the model is considered to be: Hold – Maintain Long Position.

Dow Jones Mini Futures StatisticsSPECULATORSCOMMERCIALSSMALL TRADERS
– Percent of Open Interest Longs:22.954.915.9
– Percent of Open Interest Shorts:9.473.111.3
– Net Position:13,144-17,6544,510
– Gross Longs:22,28553,40115,471
– Gross Shorts:9,14171,05510,961
– Long to Short Ratio:2.4 to 10.8 to 11.4 to 1
NET POSITION TREND:
– Strength Index Score (3 Year Range Pct):81.712.665.9
– Strength Index Reading (3 Year Range):Bullish-ExtremeBearish-ExtremeBullish
NET POSITION MOVEMENT INDEX:
– 6-Week Change in Strength Index:-0.9-1.78.4


Nasdaq Mini Futures:

Nasdaq Mini Futures COT ChartThe Nasdaq Mini large speculator standing this week reached a net position of -3,726 contracts in the data reported through Tuesday. This was a weekly lowering of -8,444 contracts from the previous week which had a total of 4,718 net contracts.

This week’s current strength score (the trader positioning range over the past three years, measured from 0 to 100) shows the speculators are currently Bearish with a score of 33.4 percent. The commercials are Bearish with a score of 45.2 percent and the small traders (not shown in chart) are Bullish-Extreme with a score of 95.3 percent.

Price Trend-Following Model: Uptrend

Our weekly trend-following model classifies the current market price position as: Uptrend. The current action for the model is considered to be: Hold – Maintain Long Position.

Nasdaq Mini Futures StatisticsSPECULATORSCOMMERCIALSSMALL TRADERS
– Percent of Open Interest Longs:26.954.417.3
– Percent of Open Interest Shorts:28.457.013.2
– Net Position:-3,726-6,68310,409
– Gross Longs:68,402138,38743,934
– Gross Shorts:72,128145,07033,525
– Long to Short Ratio:0.9 to 11.0 to 11.3 to 1
NET POSITION TREND:
– Strength Index Score (3 Year Range Pct):33.445.295.3
– Strength Index Reading (3 Year Range):BearishBearishBullish-Extreme
NET POSITION MOVEMENT INDEX:
– 6-Week Change in Strength Index:-19.012.32.6


Russell 2000 Mini Futures:

Russell 2000 Mini Futures COT ChartThe Russell 2000 Mini large speculator standing this week reached a net position of -33,845 contracts in the data reported through Tuesday. This was a weekly advance of 3,739 contracts from the previous week which had a total of -37,584 net contracts.

This week’s current strength score (the trader positioning range over the past three years, measured from 0 to 100) shows the speculators are currently Bullish with a score of 61.1 percent. The commercials are Bearish with a score of 37.8 percent and the small traders (not shown in chart) are Bullish with a score of 51.9 percent.

Price Trend-Following Model: Uptrend

Our weekly trend-following model classifies the current market price position as: Uptrend. The current action for the model is considered to be: Hold – Maintain Long Position.

Russell 2000 Mini Futures StatisticsSPECULATORSCOMMERCIALSSMALL TRADERS
– Percent of Open Interest Longs:17.773.55.9
– Percent of Open Interest Shorts:25.067.74.5
– Net Position:-33,84527,0366,809
– Gross Longs:82,901343,51427,628
– Gross Shorts:116,746316,47820,819
– Long to Short Ratio:0.7 to 11.1 to 11.3 to 1
NET POSITION TREND:
– Strength Index Score (3 Year Range Pct):61.137.851.9
– Strength Index Reading (3 Year Range):BullishBearishBullish
NET POSITION MOVEMENT INDEX:
– 6-Week Change in Strength Index:3.3-4.58.2


Nikkei Stock Average (USD) Futures:

Nikkei Stock Average (USD) Futures COT ChartThe Nikkei Stock Average (USD) large speculator standing this week reached a net position of -1,636 contracts in the data reported through Tuesday. This was a weekly gain of 609 contracts from the previous week which had a total of -2,245 net contracts.

This week’s current strength score (the trader positioning range over the past three years, measured from 0 to 100) shows the speculators are currently Bullish with a score of 66.2 percent. The commercials are Bearish with a score of 26.8 percent and the small traders (not shown in chart) are Bullish with a score of 63.9 percent.

Price Trend-Following Model: Uptrend

Our weekly trend-following model classifies the current market price position as: Uptrend. The current action for the model is considered to be: Hold – Maintain Long Position.

Nikkei Stock Average Futures StatisticsSPECULATORSCOMMERCIALSSMALL TRADERS
– Percent of Open Interest Longs:11.561.525.5
– Percent of Open Interest Shorts:21.961.215.5
– Net Position:-1,636491,587
– Gross Longs:1,8239,7394,033
– Gross Shorts:3,4599,6902,446
– Long to Short Ratio:0.5 to 11.0 to 11.6 to 1
NET POSITION TREND:
– Strength Index Score (3 Year Range Pct):66.226.863.9
– Strength Index Reading (3 Year Range):BullishBearishBullish
NET POSITION MOVEMENT INDEX:
– 6-Week Change in Strength Index:-6.75.10.9


MSCI EAFE Mini Futures:

MSCI EAFE Mini Futures COT ChartThe MSCI EAFE Mini large speculator standing this week reached a net position of -24,369 contracts in the data reported through Tuesday. This was a weekly gain of 5,188 contracts from the previous week which had a total of -29,557 net contracts.

This week’s current strength score (the trader positioning range over the past three years, measured from 0 to 100) shows the speculators are currently Bearish with a score of 41.2 percent. The commercials are Bullish with a score of 56.3 percent and the small traders (not shown in chart) are Bearish with a score of 45.1 percent.

Price Trend-Following Model: Uptrend

Our weekly trend-following model classifies the current market price position as: Uptrend. The current action for the model is considered to be: Hold – Maintain Long Position.

MSCI EAFE Mini Futures StatisticsSPECULATORSCOMMERCIALSSMALL TRADERS
– Percent of Open Interest Longs:7.089.62.9
– Percent of Open Interest Shorts:12.785.21.6
– Net Position:-24,36918,7425,627
– Gross Longs:29,861381,75612,467
– Gross Shorts:54,230363,0146,840
– Long to Short Ratio:0.6 to 11.1 to 11.8 to 1
NET POSITION TREND:
– Strength Index Score (3 Year Range Pct):41.256.345.1
– Strength Index Reading (3 Year Range):BearishBullishBearish
NET POSITION MOVEMENT INDEX:
– 6-Week Change in Strength Index:-19.419.10.5


Article By InvestMacroReceive our weekly COT Newsletter

*COT Report: The COT data, released weekly to the public each Friday, is updated through the most recent Tuesday (data is 3 days old) and shows a quick view of how large speculators or non-commercials (for-profit traders) were positioned in the futures markets.

The CFTC categorizes trader positions according to commercial hedgers (traders who use futures contracts for hedging as part of the business), non-commercials (large traders who speculate to realize trading profits) and nonreportable traders (usually small traders/speculators) as well as their open interest (contracts open in the market at time of reporting). See CFTC criteria here.

Why Nvidia’s Stock Surge Could Translate to Higher Dividends

By The Ino.com Team

With a $2.35 trillion market cap, NVIDIA Corporation (NVDA) has had an exceptional year so far. Following a stellar 2023, NVDA’s stock has already surged nearly 92% since January. Moreover, the stock has gained over 200% in the past year.

This surge in NVIDIA has been fueled by its explosive growth in the AI and data center markets, making it one of the most talked-about and desirable stocks. With a high of just under $955 in yesterday’s session, expectations are mounting for the stock to hit four digits soon.

Ahead of Nvidia’s earnings, Stifel analyst Ruben Roy increased his price target on the stock from $910 to $1,085, citing that he expects Nvidia to again surpass expectations on the top and bottom lines and raise its guidance for the next quarter.

The company’s results have been bolstered by solid demand for its chips from hyperscalers, including Amazon (AMZN), Alphabet Inc. (GOOGL), Meta Platforms, Inc. (META), Microsoft Corporation (MSFT), and others. As a result, the first-quarter earnings report will serve as a crucial gauge of the industry’s appetite for further AI investment.

Also, Bank of America analyst Vivek Arya raised his price target on NVDA stock from $925 to $1100 while maintaining a “Buy” rating.

Let’s analyze how Nvidia’s stock price appreciation could lead to higher dividend payouts.

Dominance in AI and Data Center Markets

The U.S., led by NVIDIA, dominates the generative AI (GenAI) tech market. With the launch of ChatGPT in November 2022, the rise of GenAI gained substantial momentum.

From consumer-facing applications, foundational technology such as large language models (LLMs), cloud infrastructure, and semiconductors crucial for operations, U.S. companies hold a market share ranging from 70% to an impressive 90% across several segments of the generative AI landscape.

According to Statista, the global generative AI market is expected to reach $36.06 billion in 2024. Further, the market is projected to grow at a CAGR of 46.5%, resulting in a market volume of $356.10 billion by 2030. In global comparison, the U.S. is estimated to have the largest market share, totaling $11.66 billion this year.

Moreover, NVDA, a leading tech player, commands a market share of around 92% in the data center GPU market for GenAI applications.

Nvidia’s success extends beyond its cutting-edge semiconductor performance, owing to its software capabilities. The widely adopted CUDA development platform, introduced in 2006, has become a fundamental tool for AI development, amassing a user base of more than 4 million developers.

The company’s chips are essential in powering technology like Google’s Gemini and OpenAI’s ChatGPT. Also, META has placed a sizable order of 350,000 H100 GPU graphics cards from Nvidia. In line, MSFT has spent billions of dollars buying chips from the chipmaker.

Unveiled New Generation AI Graphics Processors

In March 2024, NVDA announced its next-generation chip architecture named Blackwell and related products, including its latest AI chip, B200. The latest GPUs are expected to dramatically boost developers’ ability to build advanced AI models.

The new GPU platform succeeds the company’s Hopper architecture, which was launched two years earlier and helped send NVDA’s business and stock surging.

Blackwell GPUs, containing 208 billion transistors, can enable AI models to scale up to 10 trillion parameters. It will be incorporated in Nvidia’s GB200 Grace Blackwell Superchip, which connects two B200 Blackwell GPUs to a Grace CPU.

The new AI chips are expected to ship later this year.

“Generative AI is the defining technology of our time,” said Nvidia CEO Jensen Huang during a keynote address at the company’s developers conference in San Jose, California. “Blackwell GPUs are the engine to power this new industrial revolution. Working with the most dynamic companies in the world, we will realize the promise of AI for every industry.”

With Blackwell’s superior performance, the chipmaker aims to solidify its dominance in the data center GPU market.

Outstanding Fourth-Quarter Financials

For the fourth quarter that ended January 28, 2024, NVDA’s revenue increased 265.3% year-over-year to $22.10 billion. That exceeded analysts’ expectations of $20.55 billion. It reported a record revenue from the Data Center segment of $18.40 billion, up 409% from the prior year’s period.

“Accelerated computing and generative AI have hit the tipping point. Demand is surging worldwide across companies, industries and nations,” said Jensen Huang.

He added, “Our Data Center platform is powered by increasingly diverse drivers — demand for data processing, training and inference from large cloud-service providers and GPU-specialized ones, as well as from enterprise software and consumer internet companies. Vertical industries — led by auto, financial services and healthcare — are now at a multibillion-dollar level.

The chipmaker’s gross profit was $16.79 billion, an increase of 338.1% year-over-year. Its non-GAAP operating income rose 563.2% year-over-year to $14.75 billion. Its non-GAAP net income grew 490.6% from the previous year’s quarter to $12.84 billion.

Also, Nvidia posted non-GAAP earnings per share of $5.16, compared to the analysts’ estimate of $4.63, and up 486% year-over-year.

NVDA’s non-GAAP free cash flow was $11.22 billion, up 546.1% from the previous year’s period. The company’s total current assets were $44.35 billion as of January 28, 2024, compared to $23.07 billion as of January 29, 2023.

“Fundamentally, the conditions are excellent for continued growth” in 2025 and beyond, Huang told analysts. He noted that the robust demand for the company’s GPUs is expected to persist, fueled by the adoption of generative AI and an industry-wide shift from central processors to Nvidia’s accelerators.

Further, NVIDIA predicts revenue of $24 billion for the first quarter of fiscal 2025. The company’s non-GAAP gross margin is anticipated to be 77%.

Potential for Increased Dividend Payouts

As Nvidia’s revenue and profits soar significantly, the company will likely consider increasing its dividend payouts, benefiting long-term investors. NVIDIA paid its quarterly cash dividend of $0.04 per share on March 27 to shareholders of record on March 6. The company’s annual dividend of $0.16 translates to a yield of 0.02% at the current share price.

Currently, Nvidia’s dividend yield is modest compared to its tech peers, but its substantial cash flow and strong balance sheet provide ample room for growth. By increasing dividends, the company can attract a broader base of income-focused investors, further supporting its stock price.

Bottom Line

NVDA’s remarkable rise so far this year can be attributed to its dominance in the AI and data center markets, fueled by the growing demand for its chips from tech giants such as Amazon, Google, Meta, Microsoft, and more.

Moreover, Nvidia’s recent announcement of its next-generation chip architecture, Blackwell, and related products demonstrates its commitment to innovation and maintaining its competitive edge. With Blackwell’s superior performance, Nvidia aims to consolidate its dominance in the data center GPU market.

Analysts are highly optimistic about the chipmaker’s prospects. Analysts expect NVDA’s revenue and EPS for the fiscal 2025 first quarter (ended April 2024) to increase 242% and 411.9%year-over-year to $24.59 billion and $5.58, respectively. Also, the company topped consensus revenue and EPS estimates in all four trailing quarters, which is impressive.

As NVDA continues to expand its market share and generate higher revenue and profit, the company naturally accumulates more cash reserves. With ample cash in hand, it can increase its dividend payouts without compromising its ability to fund ongoing operations or invest in future growth opportunities.

Increased dividends will be a positive signal to the market, reflecting Nvidia’s confidence in its long-term prospects and its commitment to returning value to shareholders. This move can also enhance investor sentiment, particularly among those looking for stable income streams in addition to capital appreciation.

In conclusion, NVDA stands at the forefront of the tech industry, driving innovation and shaping the future of AI. Given its outstanding financial performance, technological leadership, and potential for dividend growth, Nvidia is an attractive investment opportunity for long-term investors.

By The Ino.com Team – See our Trader Blog, INO TV Free & Market Analysis Alerts

Source: Why Nvidia’s Stock Surge Could Translate to Higher Dividends
Why the US government is trying to break up Live Nation Entertainment – a music industry scholar explains

By David Arditi, University of Texas at Arlington 

The U.S. Justice Department, along with 29 states and the District of Columbia, have filed an antitrust lawsuit against Live Nation Entertainment, the parent company of Ticketmaster.

The lawsuit alleges that Live Nation “engaged in a variety of tactics to eliminate competition and monopolize markets,” which, according to U.S. Attorney General Merrick Garland, has allowed the entertainment giant to “suffocate the competition” through its control of ticket prices, venues and concert promotion.

In response, Live Nation said that the antitrust suit “ignores everything that is actually responsible for higher ticket prices, from increasing production costs to artist popularity, to 24/7 online ticket scalping that reveals the public’s willingness to pay far more than primary tickets cost.”

The Conversation U.S. asked David Arditi, a University of Texas at Arlington sociologist and former professional drummer who has researched the livelihoods of musicians, to explain what’s behind the government’s decision to intervene in the ticket-selling business.

What is the government accusing the company of doing?

The government alleges that Live Nation Entertainment’s sprawling business model is choking off competition and that the company is punishing venues that rely on other ticketing services.

Live Nation, the country’s largest concert promoter, and Ticketmaster, the nation’s biggest ticket seller, had long been major players in the music industry. After the Justice Department approved a merger in 2010 between the two enterprises, the new company, Live Nation Entertainment, became far more powerful.

Live Nation Entertainment now controls many of the functions associated with putting on a concert: It owns venues, promotes concerts, books acts, produces shows, manages artists, sells tickets, and more.

Why is the Biden administration doing this?

After winning the 2020 presidential election, President Joe Biden promised to use the Justice Department’s antitrust division to break up monopolies, and that’s exactly what the government is trying to do with Live Nation Entertainment.

The government has been investigating Live Nation Entertainment for decades. But after a botched Ticketmaster presale for Taylor Swift’s Eras Tour in late 2022 – which made it nearly impossible for fans to buy tickets at face value – government scrutiny intensified.

After that fiasco, fans started contacting their lawmakers, and the U.S. Senate even held a hearing on the issue. In May 2024, the governor of Minnesota, Tim Walz, signed a bill into law that will require all ticket sellers in the state to disclose their fees up front.

How did Ticketmaster change the ticket-buying experience?

For much of the 20th century, buying tickets to a show or sporting event required traveling to the venue’s box office.

In 1976, Albert Leffler, who worked at Arizona State University’s performing arts center, and Peter Gadwa, an IT staffer on the same campus, founded Ticketmaster with businessman Gordon Gunn III. The enterprise began to sell tickets a year later. As the company developed, it incorporated new technology to facilitate ticket sales at a growing list of locations outside of the venue where a show would be performed.

Ticketmaster ultimately acquired Ticketron, its predecessor and rival.

As a teen in the 1990s, I remember waiting in line at a local grocery store in Williamsburg, Virginia, to buy tickets to a Dave Matthews Band show at the Virginia Beach Amphitheater. I had to be at the grocery store at 9 a.m. to purchase the tickets, but because it was a local Ticketmaster vendor, it saved me an hourlong trip to the venue.

A couple of years later, Ticketmaster introduced the technology required to give concertgoers the opportunity to purchase tickets online. In 2008, the company permitted paperless entry.

However, that convenience comes with hidden fees. Suddenly, the cost of your US$25 ticket can balloon to $40, with that extra $15 relatively opaque until checkout. These fees used to be a matter of convenience; there wasn’t a fee when you went to the venue to buy a ticket.

Now, the fees are unavoidable and multiplying: There can be a service fee, an order processing charge, a facility charge and a delivery fee.

How has Live Nation affected artists’ ability to make a living?

In my research and my personal experience, I’ve observed a sea change in the roles that live music and recorded music are playing.

From the 1970s to the 1990s, recording artists with medium-sized and large fan bases toured to promote their albums. During that time, these musicians assumed that they would take a loss on their tours; the payoff would come from their ability to sell more albums. Less prominent musicians, meanwhile, have always relied on playing at small venues to earn any income at all.

With the advent of file-sharing services, which later gave way to streaming, recording artists began to rely more on touring revenue to supplement their income, as money earned from album sales fell.

With even the most popular musicians increasingly relying on income from touring, they count more on making sure they earn what is owed to them. Fans feel like they have a close relationship with their favorite musicians and are willing to support them financially.

But when Live Nation Entertainment adds fees or pressures musicians to take a smaller cut of concert revenue, it becomes apparent to fans that they and their favorite musicians are getting a raw deal.

What will happen moving forward?

The government will seek a jury trial to determine if Live Nation Entertainment is a monopoly. If the company is found to be violating the Sherman Anti-Trust Act, Live Nation Entertainment would be forced to restructure, or even split into two or more separate companies.

Of course, lawsuits take time to resolve, even if the parties settle before entering a courtroom. And any potential ruling could have to go through an appeals process. I believe it’s likely that this dispute won’t be resolved for several years.

Aside from the lawsuit, the Biden administration is working on banning so-called “junk fees.” Eliminating exorbitant or hidden fees on concert tickets would address some of these problems.

Unfortunately, no matter what happens to Live Nation Entertainment, the music industry as a whole – whether it’s the record labels, streaming services, music publishers or music venues – is trending toward more consolidation and monopolistic behavior.The Conversation

About the Author:

David Arditi, Associate Professor of Sociology, University of Texas at Arlington

This article is republished from The Conversation under a Creative Commons license. Read the original article.

Weather risk can move markets months in advance: Stock traders pay attention to these 2 long-range climate forecasts

By Derek Lemoine, University of Arizona 

To understand how important weather and climate risks are to the economy, watch investors. New research shows that two long-range seasonal weather forecasts in particular can move the stock market in interesting ways.

We often think about forecasts as telling us what the weather will bring in coming days, but the National Oceanic and Atmospheric Administration also predicts weather conditions several months out. These seasonal climate outlooks tell us whether the hurricane season is likely to be active, whether the winter is likely to be snowy or cold, and whether an El Niño or La Niña climate pattern is likely to emerge with the potential to influence weather across the U.S.

I study the impacts of weather on economic activity as an economist. In a new paper, an atmospheric scientist at NOAA and I analyzed the influence of long-range forecasts by looking at the changing prices of stock options over 10 years and thousands of companies.

We found that investors are paying millions of dollars to hedge the risks of what NOAA’s seasonal outlooks might say. Their bets suggest that seasonal climate matters for the success of companies throughout the economy, even in sectors that might not seem especially exposed to weather.

Betting on seasonal forecasts in options markets

When you buy a stock, you buy a share of ownership in a company. The value of that stock is tied to the company’s expected future profits.

When you buy a stock option, you pay for the right to buy a particular stock at a particular price on some particular future date. Importantly, the option is just that: an option to buy, not a requirement to buy. You’ll pay a premium for this flexibility.

If the stock’s value falls, then you can just let the option expire and all you’ve lost is the premium. But if the stock price rises enough, you can exercise the option and buy the stock at the lower price built into the option. Another type of option, called a “put,” lets you sell stock you already own in a similar way.

The prices of these options tell us how uncertain investors are about the future economy.

Imagine that you know NOAA will be releasing its winter seasonal outlook in 10 days. You are considering whether to invest in a ski resort whose profits are directly tied to having a snowy, skiable winter. You expect the forecast to affect the price of the ski resort’s stock, but you don’t know which way it will go.

The more uncertain investors are about a stock’s future price, the greater their expected gains from holding the option: They get all the potential gain from big increases in the stock’s price and none of the downside risk of falling stock prices. And the greater their expected gains, the more they are willing to pay for the option and the higher the option’s price in the market. So, knowing the winter seasonal outlook is coming can make one willing to pay more for an option on the ski resort’s stock and raise the option’s price in the market.

While there are now many forecasts and available data to provide clues about the coming seasons, two forecasts tend to move the market.

Winter, El Niño outlooks affect many companies

We found that, from 2010 through 2019, the prices of options on companies throughout U.S. markets tended to fall once NOAA released its Winter Outlook, in October, and the most important of its El Niño outlooks, released in June.

In other words, before the reports came out, traders were willing to pay a higher price for options that hedge, or protect against, whatever news was going to be released. So, traders must believe that seasonal climate matters for companies’ profits and that forecasters might say something important about the coming season’s climate.

We did not detect similar effects on option prices when either NOAA or Colorado State University released their Hurricane Outlooks in May and April, or when the Farmers’ Almanac released its Winter Outlook in August. Traders seem to distinguish among outlooks based on their perceived quality and on the importance of what these reports are able to predict, rather than on media attention.

The seasonal climate also matters for more than just outdoor industries. We found the June El Niño Outlook affects options on construction, transportation and utilities – all industries that can be directly affected by weather. It also affects options on other sectors, such as manufacturing and education, possibly reflecting spillovers from elsewhere in the economy. NOAA’s Winter Outlook has similarly broad effects.

The only sector that the June El Niño Outlook does not clearly affect is agriculture, which may just reflect that El Niño’s and La Niña’s strongest effects are on winter weather, when most agriculture is less vulnerable.

Traders pay money to wait for El Niño Outlook

Traders’ interest in the June El Niño Outlook is especially interesting because NOAA releases an El Niño outlook every month. Most months, the outlook changes little from the previous month’s forecast. But in June, once spring is past, the ability to accurately forecast future El Niño events suddenly jumps.

We found that traders value that jump in quality.

The June Outlook corresponds with a US$12 million premium each year on average, showing traders are willing to put real money on the line just to know what NOAA will say in its June forecast before they commit to a stock. That’s about four times higher than we found with the average May outlook.

The traders’ hedging shows that having high-quality seasonal climate forecasts matters to investors, just as it does to communities, companies and emergency responders who rely on these analyses to prepare for severe weather seasons.

It also supports the argument that there is value in investing in the technology to improve these forecasts. And it shows the importance of keeping these outlooks confidential until their official release, similar to how the U.S. government closely guards important economic statistics prior to making them public.The Conversation

About the Author:

Derek Lemoine, Professor of Economics, University of Arizona

This article is republished from The Conversation under a Creative Commons license. Read the original article.

Dow tops 40,000 as stock indexes continue to cross milestones − making many investors feel wealthier

By Alexander Kurov, West Virginia University 

The Dow Jones Industrial Average topped 40,000 for the first time on May 16, 2024. It spent the next few hours hovering around that mark, occasionally dipping under. But the breakthrough, even if fleeting, nonetheless marks another symbolic milestone in a monthslong bull market, coming three months after the S&P 500 index surpassed 5,000 for the first time.

The Conversation asked Alexander Kurov, a financial markets scholar, to explain what stock indexes are and to say whether these kinds of milestones are a big deal or not.

What are stock indexes?

Stock indexes measure the performance of a group of stocks. When prices rise or fall overall for the shares of those companies, so do stock indexes. The number of stocks in those baskets varies, as does the system for how this mix of shares gets updated.

The Dow Jones Industrial Average, also known as the Dow, includes shares in the 30 U.S. companies with the largest market capitalization – meaning the total value of all the stock belonging to shareholders. That list currently spans companies from Apple to Walt Disney Co.

The S&P 500 tracks shares in 500 of the largest U.S. publicly traded companies.

The Nasdaq composite tracks performance of more than 2,500 stocks listed on the Nasdaq stock exchange.

The DJIA, launched on May 26, 1896, is the oldest of these three popular indexes, and it was one of the first established.

Two enterprising journalists, Charles H. Dow and Edward Jones, had created a different index tied to the railroad industry a dozen years earlier. Most of the 12 stocks the DJIA originally included wouldn’t ring many bells today, such as Chicago Gas and National Lead. But one company that only got booted in 2018 had stayed on the list for 120 years: General Electric.

The S&P 500 index was introduced in 1957 because many investors wanted an option that was more representative of the overall U.S. stock market. The Nasdaq composite was launched in 1971.

You can buy shares in an index fund that mirrors a particular index. This approach can diversify your investments and make them less prone to big losses.

Index funds, which have existed only since Vanguard Group founder John Bogle launched the first one in 1976, now hold trillions of dollars.

Why are there so many?

There are hundreds of stock indexes in the world, but only about 50 major ones.

Most of them, including the Nasdaq composite and the S&P 500, are value-weighted. That means stocks with larger market values account for a larger share of the index’s performance.

In addition to these broad-based indexes, there are many less prominent ones. Many of those emphasize a niche by tracking stocks of companies in specific industries like energy or finance.

Do these milestones matter?

Stock prices move constantly in response to corporate, economic and political news, as well as changes in investor psychology. Because company profits will typically grow gradually over time, the market usually fluctuates in the short term while increasing in value over the long term.

The DJIA first reached 1,000 in November 1972, and it crossed the 10,000 mark on March 29, 1999. On Jan. 22, 2024, it surpassed 38,000 for the first time. Breaking through 40,000 on May 16 prompted a flurry of congratulatory news reports.

Because there’s a lot of randomness in financial markets, the significance of round-number milestones is mostly psychological. There is no evidence they portend any further gains.

For example, the Nasdaq composite first hit 5,000 on March 10, 2000, at the end of the dot-com bubble.

The index then plunged by almost 80% by October 2002. It took 15 years – until March 3, 2015 – for it to return to 5,000.

As 2024 has progressed, the Nasdaq composite has regularly closed at record highs.

Index milestones matter to the extent they pique investors’ attention and boost market sentiment.

Investors afflicted with a fear of missing out may then invest more in stocks, pushing stock prices to new highs. Chasing after stock trends may destabilize markets by moving prices away from their underlying values.

When a stock index passes a new milestone, investors become more aware of their growing portfolios. Feeling richer can lead them to spend more.

This is called the wealth effect. Many economists believe that the consumption boost that arises in response to a buoyant stock market can make the economy stronger.

Is there a best stock index to follow?

Not really. They all measure somewhat different things and have their own quirks.

For example, the S&P 500 tracks many different industries. However, because it is value-weighted, it’s heavily influenced by only seven stocks with very large market values.

Known as the “Magnificent Seven,” shares in Amazon, Apple, Alphabet, Meta, Microsoft, Nvidia and Tesla now account for over one-fourth of the S&P 500’s value. Nearly all are in the tech sector, and they played a big role in pushing the S&P across the 5,000 mark.

This makes the index more concentrated on a single sector than it appears.

But if you check out several stock indexes rather than just one, you’ll get a good sense of how the market is doing. If they’re all rising quickly or breaking records, that’s a clear sign that the market as a whole is gaining.

Sometimes the smartest thing is to not pay too much attention to any of them.

For example, after hitting record highs on Feb. 19, 2020, the S&P 500 plunged by 34% in just 23 trading days because of concerns about what COVID-19 would do to the economy. But the market rebounded, with stock indexes hitting new milestones and notching new highs by the end of that year.

Panicking in response to short-term market swings would have made investors more likely to sell off their investments in too big a hurry – a move they might have later regretted. This is why I believe advice from the immensely successful investor and fan of stock index funds Warren Buffett is worth heeding.

Buffett, whose stock-selecting prowess has made him one of the world’s 10 richest people, likes to say, “Don’t watch the market closely.”

If you’re reading this because stock prices are falling and you’re wondering if you should be worried about that, consider something else Buffett has said: “The light can at any time go from green to red without pausing at yellow.”

And the opposite is true as well.

This article is an updated version of a story that was first published on Feb. 15, 2024.The Conversation

About the Author:

Alexander Kurov, Professor of Finance and Fred T. Tattersall Excellence in Finance Research Chair, West Virginia University

This article is republished from The Conversation under a Creative Commons license. Read the original article.


Trade Of The Week: Nvidia headed for $1000 milestone?

By ForexTime 

  • Nvidia almost ↑ 90% year-to-date
  • Will chipmaker see new all-time high?
  • Pay close attention to Nvidia’s datacenter revenue forecasts
  • Shares could move 8.6% ↑ or ↓ post earnings on Thursday!    
  • Nvidia last earnings saw S&P 500’s biggest 1-day jump in over 12 months

In case you missed the memo, Nvidia is set to announce its latest earnings this week!

This is a major event for markets considering how the chipmaker is at the heart of the AI buzz. Investors will be looking for another round of stellar results to justify its whooping $2.3 trillion valuation.

Since the last earnings release in February, Nvidia shares have climbed about 37%, taking year-to-date gains to almost 90%!

  • When will earnings be published?

Nvidia will report its earnings for the first quarter of its 2025 fiscal year (3 months ending April 30th) after US markets close on Wednesday 22nd May.

  • Market expectations:

The darling of AI and tech investors is expected to post earnings of $5.53 compared to $1.09 a year ago.

Quarterly revenues are seen rising to $24.6 billion from $7.2 billion in the prior year – equating to a 242% increase!

Beyond the backward-looking numbers, markets will also be obsessed about what Nvidia conveys about its potential earnings in the future.

Markets are particularly focused on its revenue from data centers, which now account for over 80% of Nvidia’s total revenue.

Datacenters have now overtaken the gaming sector as the leading contributor to Nvidia’s total revenue.

Revenue from datacenters are expected to reach US$ 30 billion by 2026, which is a massive jump from the US$ 4.3 billion posted in the first quarter of its 2024 fiscal year.

Markets may need to see such projections revised higher in order to justify an even-higher price for this stock, based on its future earnings.

Otherwise, if markets can’t reconcile Nvidia’s 90% year-to-date gains with less-than-expected future earnings, markets may have zero qualms about triggering a massive selloff for this stock.

After all, markets are forward-looking in nature: today’s price reflects tomorrow’s hopes (or disappointments).

  • What is the big deal?

The company’s earnings and forward guidance may serve as a key gauge for the AI hype.

After delivering knockout results last quarter, Nvidia was able to satisfy investor expectations. However, this earnings season is showing that investors are becoming harder to impress.

Still, this could be one of the biggest moving events for the S&P 500 in 2024.

Looking at the charts, the S&P 500 saw its biggest 1-day percentage move in over 12 months back on February 22nd.

This was one day after Nvidia released its Q4 earnings with the S&P 500 soaring over 2%.

To be clear, we are not stating that history will repeat itself but simply highlighting how much muscle Nvidia has to move US markets and even other stock indexes globally.

  • Potential challenges…

Growing competition from other chipmakers and even its biggest customers – Amazon, Meta, Microsoft, and Alphabet.

Threat of disruptions from its major chip supplier Taiwan Semiconductor, after the deadly earthquake in Taiwan last month.

US-China Chip war: Can Nvidia’s earnings take such geopolitical risks in stride?

  • How will Nvidia react to earnings?

Markets are forecasting an 8.6% move, either Up or Down, for Nvidia stocks on Thursday post earnings. 

  • What does this mean for prices?

An 8.6% move up from $923 will take Nvidia’s shares to fresh all-time highs beyond the $1000 level.  

While an 8.6% move down will send prices back below $850.

  • How about wider markets?

Instruments that have a strong correlation with Nvidia could see some action.

Nvidia has shown a 70% correlation with the Nasdaq 100 and over 60% correlation with Taiwan Semiconductor (US listed) in the past 12 months.

But digger deeper, over a rolling 5-day period from the past 20 years:

  • S&P500: +0.94
  • Texas Instruments:  +0.84
  • Broadcom:  +0.84
  • QUALCOMM: +0.75
  • Advanced Micro Devices: +0.40
  • Analog Devices: +0.70
  • Micron Technology: +0.60


  • The bigger picture…

With a $2.3 trillion valuation, an 8.6% move in the price of its stock is almost $200 billion!

This is bigger than the entire market caps of many large companies in the S&P 500 and Nasdaq 100!

Heck, it’s even bigger than some of its competitors like Texas Instrument, Analog Devices, and Micron among others.

  • Ultimately a solid set of earnings along with a forward guidance that excites investors could push prices to all-time highs beyond 973.75.
  • If the chipmaker disappoints, the stocks could find itself on a slippery decline with the 50 SMA acting as the first point of interest.


Forex-Time-LogoArticle by ForexTime

ForexTime Ltd (FXTM) is an award winning international online forex broker regulated by CySEC 185/12 www.forextime.com

COT Stock Market Charts: Speculator bets led by DowJones-Mini & Russell-Mini

By InvestMacro

Here are the latest charts and statistics for the Commitment of Traders (COT) data published by the Commodities Futures Trading Commission (CFTC).

The latest COT data is updated through Tuesday May 14th and shows a quick view of how large traders (for-profit speculators and commercial entities) were positioned in the futures markets.

Weekly Speculator Changes led by DowJones-Mini & Russell-Mini

The COT stock markets speculator bets were slightly lower this week as three out of the seven stock markets we cover had higher positioning while the other four markets had lower speculator contracts.

Leading the gains for the stock markets was the DowJones-Mini (7,109 contracts) with the Russell-Mini (5,933 contracts) and the Nikkei 225 (651 contracts) also showing positive weeks.

The markets with the declines in speculator bets this week were the S&P500-Mini (-15,589 contracts), the MSCI EAFE-Mini (-13,427 contracts), the VIX (-9,182 contracts) and with the Nasdaq-Mini (-1,235 contracts) also registering lower bets on the week.


Stock Market Net Speculators Leaderboard

Legend: Weekly Speculators Change | Speculators Current Net Position | Speculators Strength Score compared to last 3-Years (0-100 range)


Strength Scores led by DowJones-Mini

COT Strength Scores (a normalized measure of Speculator positions over a 3-Year range, from 0 to 100 where above 80 is Extreme-Bullish and below 20 is Extreme-Bearish) showed that the DowJones-Mini (86 percent) leads the stock markets this week. The VIX (63 percent) and Russell-Mini (62 percent) come in as the next highest in the weekly strength scores.

On the downside, the MSCI EAFE-Mini (38 percent) comes in at the lowest strength level currently.

Strength Statistics:
VIX (63.1 percent) vs VIX previous week (73.0 percent)
S&P500-Mini (61.0 percent) vs S&P500-Mini previous week (63.3 percent)
DowJones-Mini (86.0 percent) vs DowJones-Mini previous week (74.4 percent)
Nasdaq-Mini (44.1 percent) vs Nasdaq-Mini previous week (46.0 percent)
Russell2000-Mini (62.3 percent) vs Russell2000-Mini previous week (58.1 percent)
Nikkei USD (56.7 percent) vs Nikkei USD previous week (51.1 percent)
EAFE-Mini (38.0 percent) vs EAFE-Mini previous week (51.9 percent)


Nasdaq-Mini tops the 6-Week Strength Trends

COT Strength Score Trends (or move index, calculates the 6-week changes in strength scores) showed that the Nasdaq-Mini (13 percent) and the S&P500-Mini (8 percent) lead the past six weeks trends for the stock markets.

The MSCI EAFE-Mini (-20 percent) leads the downside trend scores currently with the Russell-Mini (-7 percent) coming in as the next market with lower trend scores.

Strength Trend Statistics:
VIX (2.5 percent) vs VIX previous week (5.4 percent)
S&P500-Mini (7.9 percent) vs S&P500-Mini previous week (23.8 percent)
DowJones-Mini (-1.3 percent) vs DowJones-Mini previous week (-18.5 percent)
Nasdaq-Mini (13.0 percent) vs Nasdaq-Mini previous week (17.9 percent)
Russell2000-Mini (-7.0 percent) vs Russell2000-Mini previous week (-11.7 percent)
Nikkei USD (-2.1 percent) vs Nikkei USD previous week (-7.0 percent)
EAFE-Mini (-19.7 percent) vs EAFE-Mini previous week (-6.3 percent)


Individual Stock Market Charts:

VIX Volatility Futures:

VIX Volatility Futures COT ChartThe VIX Volatility large speculator standing this week equaled a net position of -48,061 contracts in the data reported through Tuesday. This was a weekly fall of -9,182 contracts from the previous week which had a total of -38,879 net contracts.

This week’s current strength score (the trader positioning range over the past three years, measured from 0 to 100) shows the speculators are currently Bullish with a score of 63.1 percent. The commercials are Bearish with a score of 32.1 percent and the small traders (not shown in chart) are Bullish-Extreme with a score of 97.3 percent.

Price Trend-Following Model: Weak Uptrend

Our weekly trend-following model classifies the current market price position as: Weak Uptrend. The current action for the model is considered to be: Hold – Maintain Long Position.

VIX Volatility Futures StatisticsSPECULATORSCOMMERCIALSSMALL TRADERS
– Percent of Open Interest Longs:22.241.56.9
– Percent of Open Interest Shorts:33.230.56.9
– Net Position:-48,06147,902159
– Gross Longs:96,769180,77530,036
– Gross Shorts:144,830132,87329,877
– Long to Short Ratio:0.7 to 11.4 to 11.0 to 1
NET POSITION TREND:
– Strength Index Score (3 Year Range Pct):63.132.197.3
– Strength Index Reading (3 Year Range):BullishBearishBullish-Extreme
NET POSITION MOVEMENT INDEX:
– 6-Week Change in Strength Index:2.5-6.217.3


S&P500 Mini Futures:

SP500 Mini Futures COT ChartThe S&P500 Mini large speculator standing this week equaled a net position of -25,284 contracts in the data reported through Tuesday. This was a weekly fall of -15,589 contracts from the previous week which had a total of -9,695 net contracts.

This week’s current strength score (the trader positioning range over the past three years, measured from 0 to 100) shows the speculators are currently Bullish with a score of 61.0 percent. The commercials are Bearish with a score of 29.8 percent and the small traders (not shown in chart) are Bullish with a score of 76.2 percent.

Price Trend-Following Model: Strong Uptrend

Our weekly trend-following model classifies the current market price position as: Strong Uptrend. The current action for the model is considered to be: Hold – Maintain Long Position.

S&P500 Mini Futures StatisticsSPECULATORSCOMMERCIALSSMALL TRADERS
– Percent of Open Interest Longs:13.171.013.4
– Percent of Open Interest Shorts:14.474.58.6
– Net Position:-25,284-73,04798,331
– Gross Longs:273,3981,477,881278,004
– Gross Shorts:298,6821,550,928179,673
– Long to Short Ratio:0.9 to 11.0 to 11.5 to 1
NET POSITION TREND:
– Strength Index Score (3 Year Range Pct):61.029.876.2
– Strength Index Reading (3 Year Range):BullishBearishBullish
NET POSITION MOVEMENT INDEX:
– 6-Week Change in Strength Index:7.9-7.2-0.2


Dow Jones Mini Futures:

Dow Jones Mini Futures COT ChartThe Dow Jones Mini large speculator standing this week equaled a net position of 15,773 contracts in the data reported through Tuesday. This was a weekly rise of 7,109 contracts from the previous week which had a total of 8,664 net contracts.

This week’s current strength score (the trader positioning range over the past three years, measured from 0 to 100) shows the speculators are currently Bullish-Extreme with a score of 86.0 percent. The commercials are Bearish-Extreme with a score of 10.4 percent and the small traders (not shown in chart) are Bullish with a score of 60.5 percent.

Price Trend-Following Model: Strong Uptrend

Our weekly trend-following model classifies the current market price position as: Strong Uptrend. The current action for the model is considered to be: Hold – Maintain Long Position.

Dow Jones Mini Futures StatisticsSPECULATORSCOMMERCIALSSMALL TRADERS
– Percent of Open Interest Longs:24.957.514.9
– Percent of Open Interest Shorts:9.076.811.5
– Net Position:15,773-19,1773,404
– Gross Longs:24,73957,00614,802
– Gross Shorts:8,96676,18311,398
– Long to Short Ratio:2.8 to 10.7 to 11.3 to 1
NET POSITION TREND:
– Strength Index Score (3 Year Range Pct):86.010.460.5
– Strength Index Reading (3 Year Range):Bullish-ExtremeBearish-ExtremeBullish
NET POSITION MOVEMENT INDEX:
– 6-Week Change in Strength Index:-1.30.90.9


Nasdaq Mini Futures:

Nasdaq Mini Futures COT ChartThe Nasdaq Mini large speculator standing this week equaled a net position of 3,170 contracts in the data reported through Tuesday. This was a weekly lowering of -1,235 contracts from the previous week which had a total of 4,405 net contracts.

This week’s current strength score (the trader positioning range over the past three years, measured from 0 to 100) shows the speculators are currently Bearish with a score of 44.1 percent. The commercials are Bearish with a score of 40.4 percent and the small traders (not shown in chart) are Bullish-Extreme with a score of 89.1 percent.

Price Trend-Following Model: Strong Uptrend

Our weekly trend-following model classifies the current market price position as: Strong Uptrend. The current action for the model is considered to be: Hold – Maintain Long Position.

Nasdaq Mini Futures StatisticsSPECULATORSCOMMERCIALSSMALL TRADERS
– Percent of Open Interest Longs:27.753.716.5
– Percent of Open Interest Shorts:26.458.213.3
– Net Position:3,170-11,0687,898
– Gross Longs:68,869133,54341,056
– Gross Shorts:65,699144,61133,158
– Long to Short Ratio:1.0 to 10.9 to 11.2 to 1
NET POSITION TREND:
– Strength Index Score (3 Year Range Pct):44.140.489.1
– Strength Index Reading (3 Year Range):BearishBearishBullish-Extreme
NET POSITION MOVEMENT INDEX:
– 6-Week Change in Strength Index:13.0-10.42.8


Russell 2000 Mini Futures:

Russell 2000 Mini Futures COT ChartThe Russell 2000 Mini large speculator standing this week equaled a net position of -32,067 contracts in the data reported through Tuesday. This was a weekly advance of 5,933 contracts from the previous week which had a total of -38,000 net contracts.

This week’s current strength score (the trader positioning range over the past three years, measured from 0 to 100) shows the speculators are currently Bullish with a score of 62.3 percent. The commercials are Bearish with a score of 35.5 percent and the small traders (not shown in chart) are Bullish with a score of 58.4 percent.

Price Trend-Following Model: Strong Uptrend

Our weekly trend-following model classifies the current market price position as: Strong Uptrend. The current action for the model is considered to be: Hold – Maintain Long Position.

Russell 2000 Mini Futures StatisticsSPECULATORSCOMMERCIALSSMALL TRADERS
– Percent of Open Interest Longs:17.673.76.3
– Percent of Open Interest Shorts:24.568.74.4
– Net Position:-32,06723,3328,735
– Gross Longs:82,124343,68729,283
– Gross Shorts:114,191320,35520,548
– Long to Short Ratio:0.7 to 11.1 to 11.4 to 1
NET POSITION TREND:
– Strength Index Score (3 Year Range Pct):62.335.558.4
– Strength Index Reading (3 Year Range):BullishBearishBullish
NET POSITION MOVEMENT INDEX:
– 6-Week Change in Strength Index:-7.07.4-5.7


Nikkei Stock Average (USD) Futures:

Nikkei Stock Average (USD) Futures COT ChartThe Nikkei Stock Average (USD) large speculator standing this week equaled a net position of -2,756 contracts in the data reported through Tuesday. This was a weekly gain of 651 contracts from the previous week which had a total of -3,407 net contracts.

This week’s current strength score (the trader positioning range over the past three years, measured from 0 to 100) shows the speculators are currently Bullish with a score of 56.7 percent. The commercials are Bearish with a score of 39.1 percent and the small traders (not shown in chart) are Bullish with a score of 60.0 percent.

Price Trend-Following Model: Uptrend

Our weekly trend-following model classifies the current market price position as: Uptrend. The current action for the model is considered to be: Hold – Maintain Long Position.

Nikkei Stock Average Futures StatisticsSPECULATORSCOMMERCIALSSMALL TRADERS
– Percent of Open Interest Longs:11.365.523.2
– Percent of Open Interest Shorts:28.757.014.3
– Net Position:-2,7561,3461,410
– Gross Longs:1,79810,3973,674
– Gross Shorts:4,5549,0512,264
– Long to Short Ratio:0.4 to 11.1 to 11.6 to 1
NET POSITION TREND:
– Strength Index Score (3 Year Range Pct):56.739.160.0
– Strength Index Reading (3 Year Range):BullishBearishBullish
NET POSITION MOVEMENT INDEX:
– 6-Week Change in Strength Index:-2.17.1-13.4


MSCI EAFE Mini Futures:

MSCI EAFE Mini Futures COT ChartThe MSCI EAFE Mini large speculator standing this week equaled a net position of -27,423 contracts in the data reported through Tuesday. This was a weekly lowering of -13,427 contracts from the previous week which had a total of -13,996 net contracts.

This week’s current strength score (the trader positioning range over the past three years, measured from 0 to 100) shows the speculators are currently Bearish with a score of 38.0 percent. The commercials are Bullish with a score of 58.8 percent and the small traders (not shown in chart) are Bearish with a score of 48.0 percent.

Price Trend-Following Model: Strong Uptrend

Our weekly trend-following model classifies the current market price position as: Strong Uptrend. The current action for the model is considered to be: Hold – Maintain Long Position.

MSCI EAFE Mini Futures StatisticsSPECULATORSCOMMERCIALSSMALL TRADERS
– Percent of Open Interest Longs:5.990.82.9
– Percent of Open Interest Shorts:12.585.81.4
– Net Position:-27,42321,2016,222
– Gross Longs:24,475378,43812,043
– Gross Shorts:51,898357,2375,821
– Long to Short Ratio:0.5 to 11.1 to 12.1 to 1
NET POSITION TREND:
– Strength Index Score (3 Year Range Pct):38.058.848.0
– Strength Index Reading (3 Year Range):BearishBullishBearish
NET POSITION MOVEMENT INDEX:
– 6-Week Change in Strength Index:-19.719.30.7


Article By InvestMacroReceive our weekly COT Newsletter

*COT Report: The COT data, released weekly to the public each Friday, is updated through the most recent Tuesday (data is 3 days old) and shows a quick view of how large speculators or non-commercials (for-profit traders) were positioned in the futures markets.

The CFTC categorizes trader positions according to commercial hedgers (traders who use futures contracts for hedging as part of the business), non-commercials (large traders who speculate to realize trading profits) and nonreportable traders (usually small traders/speculators) as well as their open interest (contracts open in the market at time of reporting). See CFTC criteria here.

Stoxx Europe 600: What Signs of Investor Exuberance Keep Telling Us

By Elliott Wave International

Every day, you read news stories about the state of the economy and the stock market affecting consumer and investor behavior. The story goes something like this: When the economy and financial markets show signs of improvement, consumers start to spend more, and investors buy stocks.

But if you’re a student of Elliott waves, you understand that this type of thinking is precisely backwards. It’s consumer optimism and the resulting consumer spending that elevates the economic markets; and it’s the investors’ bullish mood that translates into a rising stock market as investors buy stocks.

Social mood, in other words, comes first. Consumer and investor behavior — bullish or bearish — follows.

That’s why social trends can give you clues as to where the financial markets are likely heading next. For example, exuberant investor optimism often appears near major stock market tops, while deep pessimism accompanies major lows.

Let’s look at a key European market as an example. Back in March, the pan-European Stoxx Europe 600 index extended its rally to seven consecutive weeks. Most investors probably saw the strength as a reason to load up on European stocks. Readers of our European Financial Forecast, on the other hand, saw warning signs of exuberance flashing throughout society.

First, Lamborghini’s 2023 sales results showed an all-time record 10,112 cars sold last year. Lamborghini’s electric V12 Revuelto is sold out until late 2026 — a three-year wait! Luxury goods tend to be popular at extremes in positive social mood, as the stock market and economic prosperity approach major peaks. They tend to go out of favor when these trends reverse.

Second, a March 10 Bloomberg headline said, “One of the Most Infamous Trades on Wall Street Is Roaring Back.” The trade in question was the so-called short volatility trade, where traders sell products that track stock volatility. “Investors are sinking vast sums into strategies whose performance hinges on enduring equity calm.” According to data from Global X ETFs, short volatility bets nearly quadrupled in two years.

“Enduring equity calm” attitude among investors rang a bell. We had been here before. An earlier iteration of the same trade famously blew up on February 5, 2018, when the CBOE Volatility Index (VIX) suddenly spiked 20 points and destroyed vast numbers of professional and retail portfolios. The spike coincided with a global stock market sell-off and a two-and-a-half-year period of volatility that left the S&P 500 where it started. In Europe, the Stoxx 600 had peaked three years before the S&P, so the stretch of zero returns lasted nearly six years. This chart of Europe’s VIX equivalent, the VStoxx Implied Volatility Index, illustrates a few of the infamous volatility spikes over the past quarter century.

Vstoxx Implied Volatility Index

In our view, the re-emergence of the short-volatility casino is a much larger version of 2018. Five years ago, traders were gambling with a little more than $2 billion within a small handful of funds. Today, a mind-blowing $64 billion is being bet using “ETFs that sell options on stocks or indexes in order to juice returns” (Bloomberg, 3/10/24). Whether they know it or not, these traders are relying on smoothly functioning markets that behave the same way today and tomorrow as they did yesterday or the day before.

The warning signs we see in investor and consumer behavior are worth heeding.

To predict the next move in European markets, I’ll continue to monitor social trends for clues. But more importantly, I’ll compare the Elliott wave price structures in stock market indexes to previous major junctures in those indexes. Tune in to The European Financial Forecast for my ongoing analysis, or sign up for our free newsletter, and I’ll send you occasional updates like this.

This article was syndicated by Elliott Wave International and was originally published under the headline Stoxx Europe 600: What Signs of Investor Exuberance Keep Telling Us. EWI is the world’s largest market forecasting firm. Its staff of full-time analysts led by Chartered Market Technician Robert Prechter provides 24-hour-a-day market analysis to institutional and private investors around the world.