By InvestMacro

Here are the latest charts and statistics for the Commitment of Traders (COT) reports data published by the Commodities Futures Trading Commission (CFTC).
The latest COT data is updated through Tuesday September 2nd and shows a quick view of how large traders (for-profit speculators and commercial entities) were positioned in the futures markets.
Weekly Speculator Changes led by Corn, Lean Hogs & Wheat

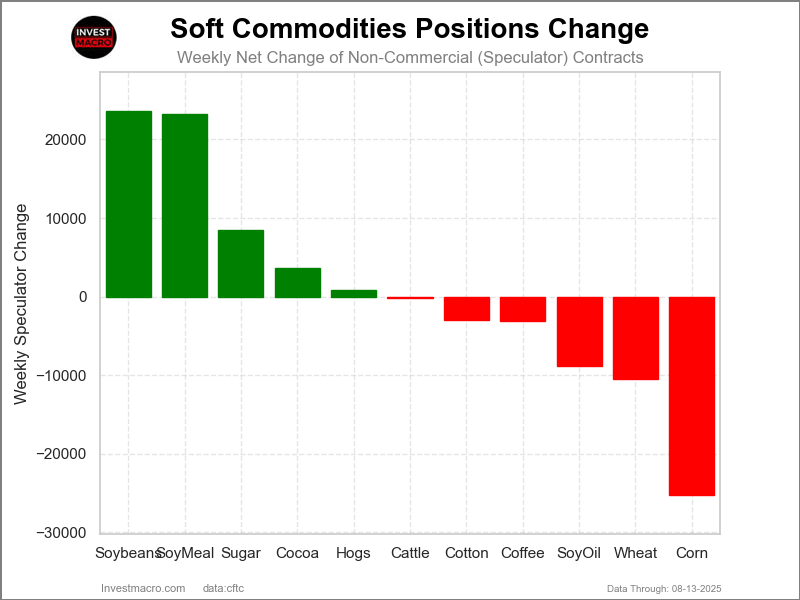
The COT soft commodities markets speculator bets were slightly higher overall this week as six out of the eleven softs markets we cover had higher positioning while the other five markets had lower speculator contracts.
Leading the gains for the softs markets was Corn (18,485 contracts) with Lean Hogs (7,272 contracts), Wheat (7,146 contracts), Live Cattle (3,958 contracts), Coffee (3,712 contracts) and Soybeans (3,231 contracts) also seeing positive weeks.
The markets with the declines in speculator bets this week were Soybean Meal (-21,568 contracts), Sugar (-11,067 contracts), Cotton (-10,606 contracts), Soybean Oil (-9,127 contracts) and with Cocoa (-1,299 contracts) also having lower bets on the week.
Cocoa leads Soft Commodities Weekly Price Gains
Leading the soft commodities gains this week was Cocoa, with a 9.3% rise for the last five days of trading. Cocoa has been up by almost 28% over the last 90 days.
Next up, Soybean Meal was up by 2.64% on the week. Soybean Meal, however, has been down by -3.5% over the last 30 days and is down by just -1.11% over the last 90 days.
Lean hogs came in third this week with a gain of 2.17%. Lean Hogs is up by 6.52% in the last 30 days and up by over 7% in the last 90 days.
Corn was the only other riser on the week, with a 1.56% gain. Despite this gain, Corn is down by -7.64% in the last 90 days.
On the downside, Soybean Oil saw a small decline by -0.43% this week. Cotton was down by -0.8% this week. Live cattle saw a decline by -1.53%, but has been up by 17.56% over the last 90 days.
Next up, Wheat was lower by -1.65%, and Soybeans were lower by -1.75%. Coffee saw a drop by -3.2% this week, and Sugar saw the biggest drop with a -4.82% decline. Sugar is now down by -10.36% over the last 90 days.
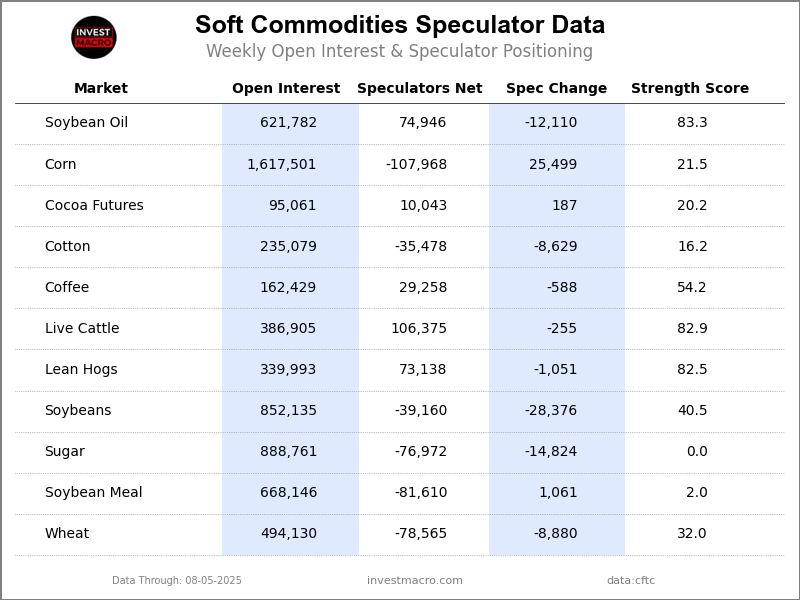
Soft Commodities Data:

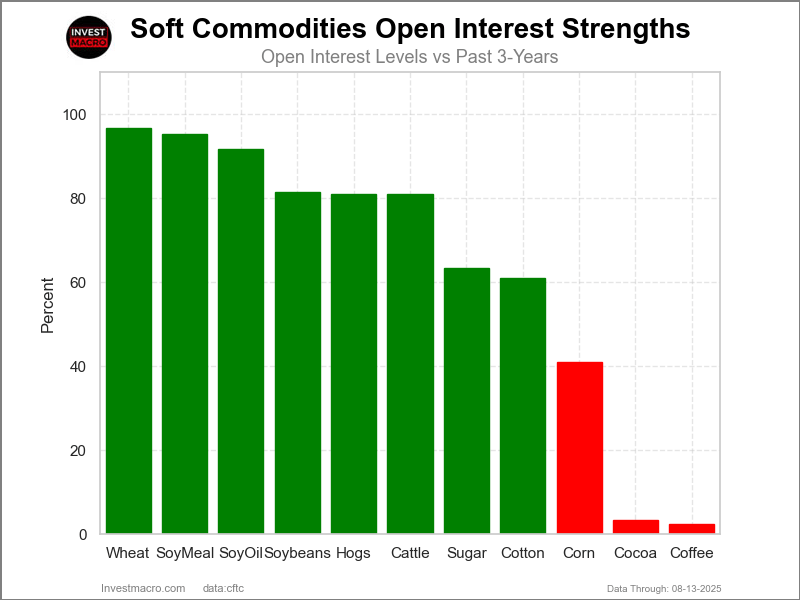
Legend: Weekly Speculators Change | Speculators Current Net Position | Speculators Strength Score compared to last 3-Years (0-100 range)
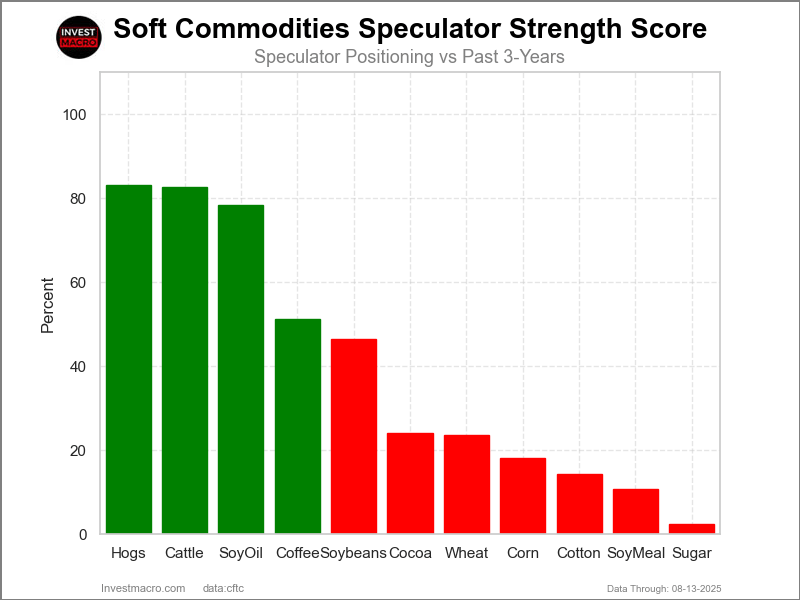
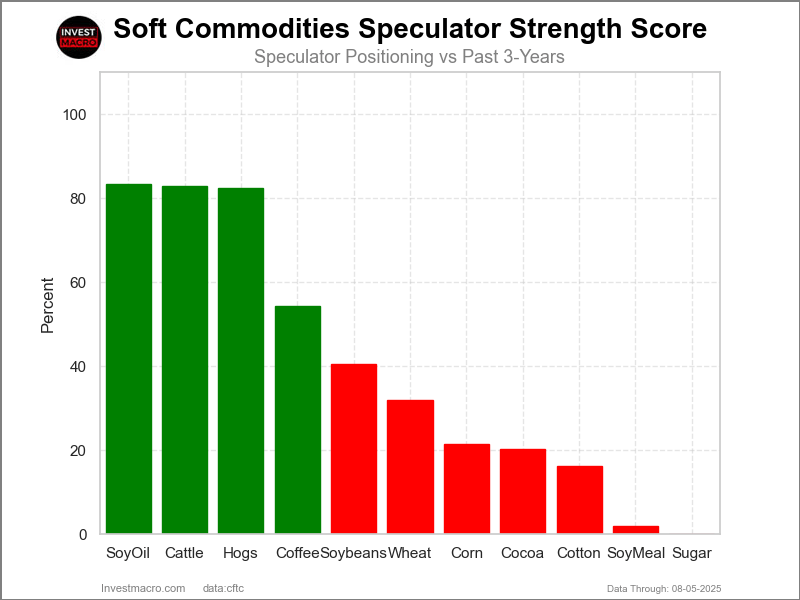
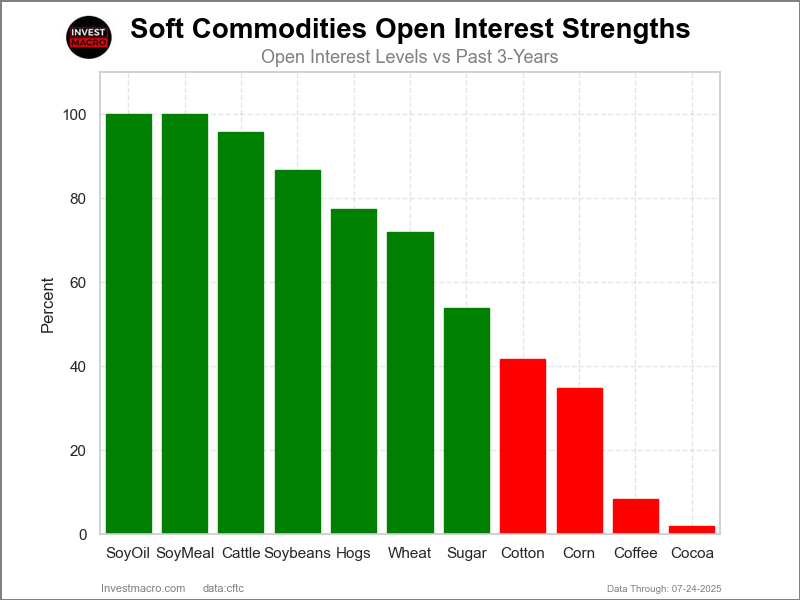
Strength Scores led by Lean Hogs & Live Cattle

COT Strength Scores (a normalized measure of Speculator positions over a 3-Year range, from 0 to 100 where above 80 is Extreme-Bullish and below 20 is Extreme-Bearish) showed that Lean Hogs (90 percent) and Live Cattle (87 percent) lead the softs markets this week. Soybean Oil (67 percent), Coffee (60 percent) and Soybeans (56 percent) come in as the next highest in the weekly strength scores.
On the downside, Sugar (0 percent), Cotton (8 percent), Soybean Meal (12 percent) and Cocoa (17 percent) come in at the lowest strength levels currently and are in Extreme-Bearish territory (below 20 percent).
Strength Statistics:
Corn (29.1 percent) vs Corn previous week (26.6 percent)
Sugar (0.0 percent) vs Sugar previous week (3.0 percent)
Coffee (59.8 percent) vs Coffee previous week (56.2 percent)
Soybeans (56.0 percent) vs Soybeans previous week (55.2 percent)
Soybean Oil (67.5 percent) vs Soybean Oil previous week (72.5 percent)
Soybean Meal (12.3 percent) vs Soybean Meal previous week (20.4 percent)
Live Cattle (86.7 percent) vs Live Cattle previous week (82.8 percent)
Lean Hogs (90.2 percent) vs Lean Hogs previous week (84.7 percent)
Cotton (8.5 percent) vs Cotton previous week (14.9 percent)
Cocoa (16.8 percent) vs Cocoa previous week (18.1 percent)
Wheat (37.6 percent) vs Wheat previous week (31.8 percent)
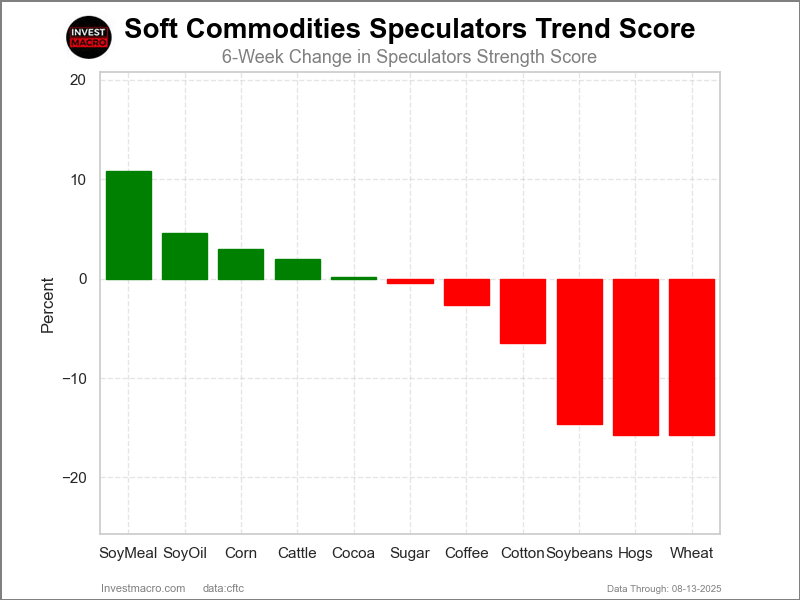
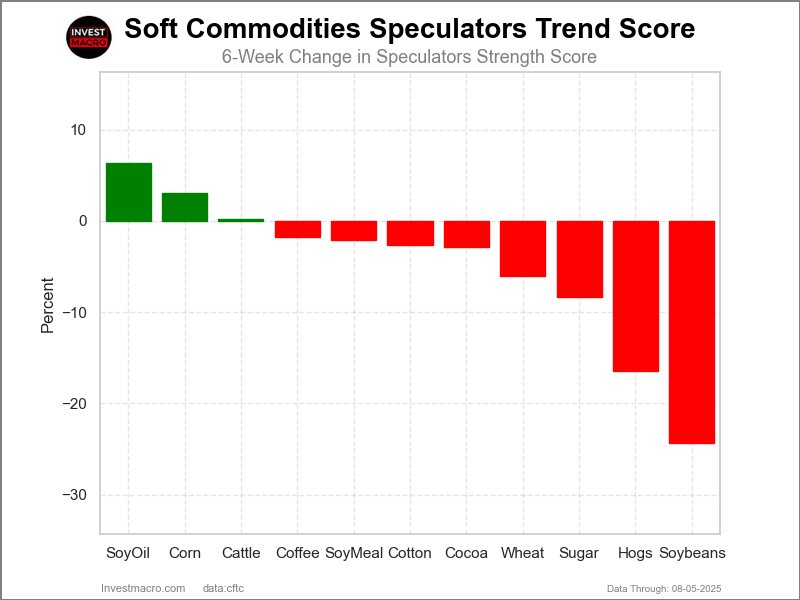
Corn & Soybean Meal top the 6-Week Strength Trends

COT Strength Score Trends (or move index, calculates the 6-week changes in strength scores) showed that Corn (11 percent) and Soybean Meal (7 percent) lead the past six weeks trends for soft commodities. Lean Hogs (6 percent), Coffee (4 percent) and Live Cattle (1 percent) are the next highest positive movers in the latest trends data.
Soybean Oil (-17 percent) leads the downside trend scores currently with Wheat (-14 percent), Cotton (-13 percent) and Sugar (-7 percent) following next with lower trend scores.
Strength Trend Statistics:
Corn (11.1 percent) vs Corn previous week (8.0 percent)
Sugar (-7.1 percent) vs Sugar previous week (-6.2 percent)
Coffee (3.7 percent) vs Coffee previous week (0.1 percent)
Soybeans (-3.7 percent) vs Soybeans previous week (0.7 percent)
Soybean Oil (-16.6 percent) vs Soybean Oil previous week (-4.8 percent)
Soybean Meal (7.2 percent) vs Soybean Meal previous week (17.8 percent)
Live Cattle (1.4 percent) vs Live Cattle previous week (1.8 percent)
Lean Hogs (6.2 percent) vs Lean Hogs previous week (-5.1 percent)
Cotton (-12.7 percent) vs Cotton previous week (-7.6 percent)
Cocoa (-1.7 percent) vs Cocoa previous week (-3.9 percent)
Wheat (-14.3 percent) vs Wheat previous week (-10.7 percent)
Individual Soft Commodities Markets:
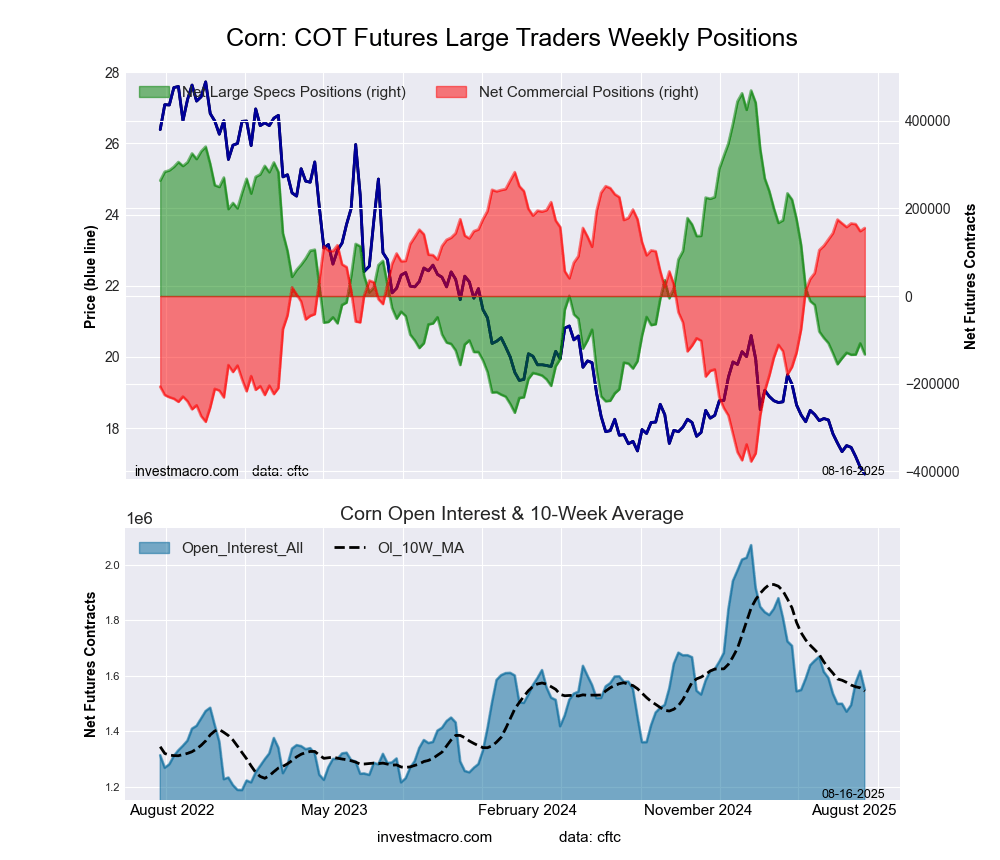
CORN Futures:
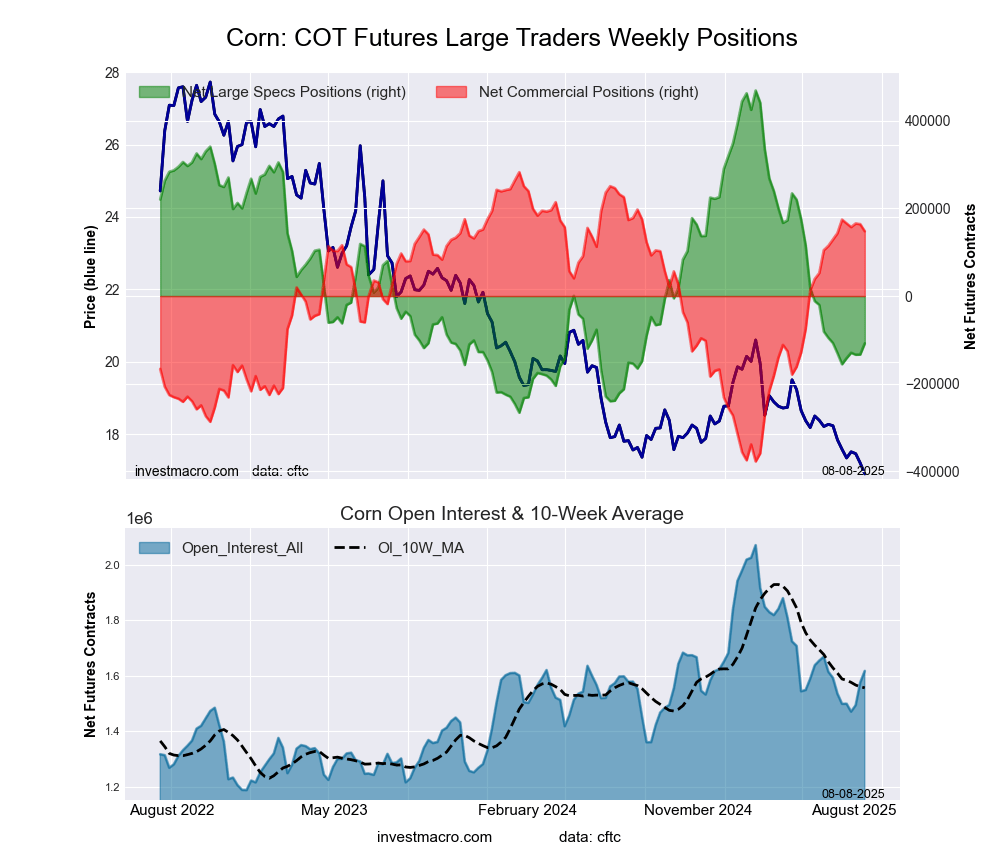
 The CORN large speculator standing this week recorded a net position of -52,455 contracts in the data reported through Tuesday. This was a weekly rise of 18,485 contracts from the previous week which had a total of -70,940 net contracts.
This week’s current strength score (the trader positioning range over the past three years, measured from 0 to 100) shows the speculators are currently Bearish with a score of 29.1 percent. The commercials are Bullish with a score of 70.5 percent and the small traders (not shown in chart) are Bullish with a score of 65.4 percent.
Price Trend-Following Model: Downtrend
Our weekly trend-following model classifies the current market price position as: Downtrend.
| CORN Futures Statistics | SPECULATORS | COMMERCIALS | SMALL TRADERS |
| – Percent of Open Interest Longs: | 24.1 | 46.2 | 8.5 |
| – Percent of Open Interest Shorts: | 27.7 | 40.2 | 10.9 |
| – Net Position: | -52,455 | 87,814 | -35,359 |
| – Gross Longs: | 350,610 | 672,040 | 123,585 |
| – Gross Shorts: | 403,065 | 584,226 | 158,944 |
| – Long to Short Ratio: | 0.9 to 1 | 1.2 to 1 | 0.8 to 1 |
| NET POSITION TREND: | | | |
| – Strength Index Score (3 Year Range Pct): | 29.1 | 70.5 | 65.4 |
| – Strength Index Reading (3 Year Range): | Bearish | Bullish | Bullish |
| NET POSITION MOVEMENT INDEX: | | | |
| – 6-Week Change in Strength Index: | 11.1 | -11.8 | -4.3 |
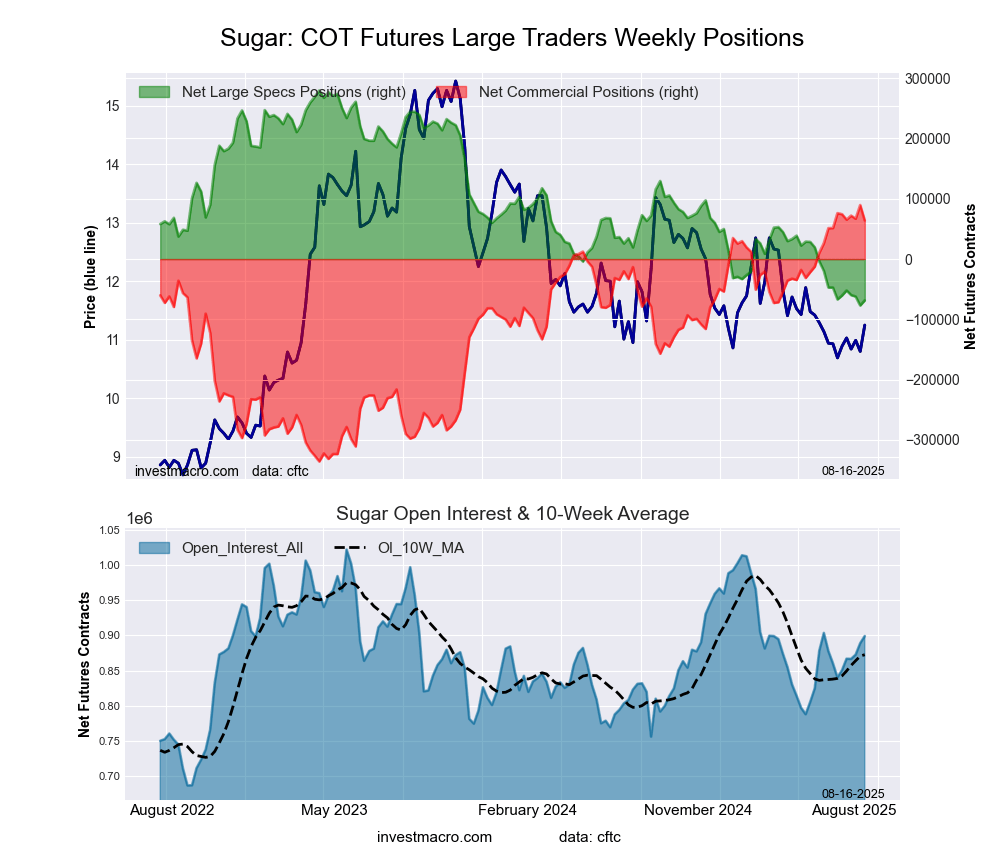
SUGAR Futures:
 The SUGAR large speculator standing this week recorded a net position of -85,805 contracts in the data reported through Tuesday. This was a weekly reduction of -11,067 contracts from the previous week which had a total of -74,738 net contracts.
This week’s current strength score (the trader positioning range over the past three years, measured from 0 to 100) shows the speculators are currently Bearish-Extreme with a score of 0.0 percent. The commercials are Bullish-Extreme with a score of 99.8 percent and the small traders (not shown in chart) are Bearish-Extreme with a score of 16.9 percent.
Price Trend-Following Model: Strong Downtrend
Our weekly trend-following model classifies the current market price position as: Strong Downtrend.
| SUGAR Futures Statistics | SPECULATORS | COMMERCIALS | SMALL TRADERS |
| – Percent of Open Interest Longs: | 19.6 | 53.7 | 7.5 |
| – Percent of Open Interest Shorts: | 28.7 | 44.3 | 7.8 |
| – Net Position: | -85,805 | 88,575 | -2,770 |
| – Gross Longs: | 184,300 | 505,407 | 70,352 |
| – Gross Shorts: | 270,105 | 416,832 | 73,122 |
| – Long to Short Ratio: | 0.7 to 1 | 1.2 to 1 | 1.0 to 1 |
| NET POSITION TREND: | | | |
| – Strength Index Score (3 Year Range Pct): | 0.0 | 99.8 | 16.9 |
| – Strength Index Reading (3 Year Range): | Bearish-Extreme | Bullish-Extreme | Bearish-Extreme |
| NET POSITION MOVEMENT INDEX: | | | |
| – 6-Week Change in Strength Index: | -7.1 | 3.9 | 13.1 |
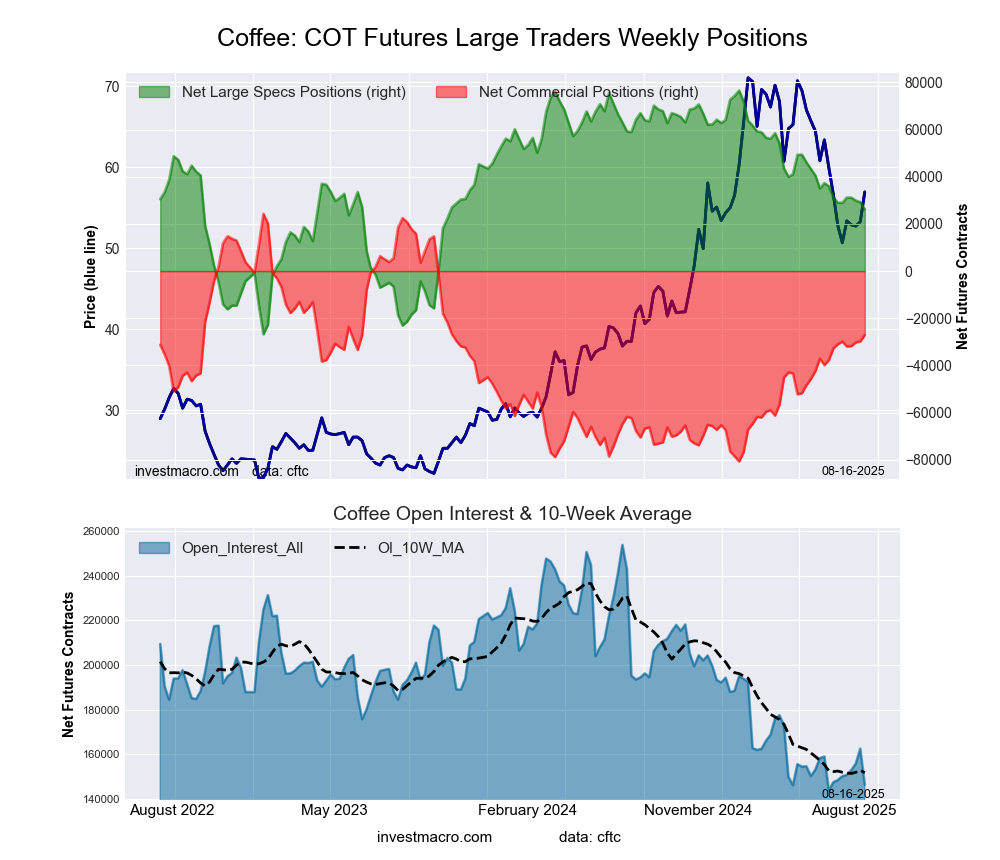
COFFEE Futures:
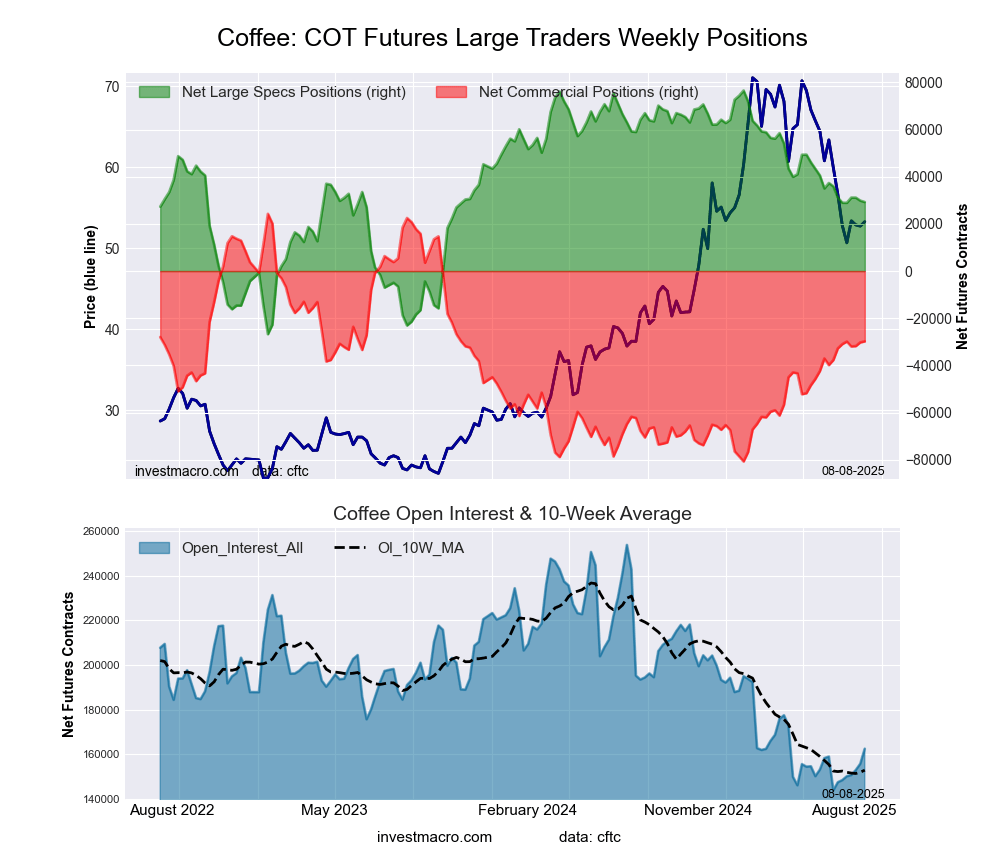
 The COFFEE large speculator standing this week recorded a net position of 34,986 contracts in the data reported through Tuesday. This was a weekly rise of 3,712 contracts from the previous week which had a total of 31,274 net contracts.
This week’s current strength score (the trader positioning range over the past three years, measured from 0 to 100) shows the speculators are currently Bullish with a score of 59.8 percent. The commercials are Bearish with a score of 41.2 percent and the small traders (not shown in chart) are Bullish with a score of 60.4 percent.
Price Trend-Following Model: Weak Downtrend
Our weekly trend-following model classifies the current market price position as: Weak Downtrend.
| COFFEE Futures Statistics | SPECULATORS | COMMERCIALS | SMALL TRADERS |
| – Percent of Open Interest Longs: | 33.9 | 38.4 | 5.3 |
| – Percent of Open Interest Shorts: | 13.3 | 60.4 | 3.9 |
| – Net Position: | 34,986 | -37,500 | 2,514 |
| – Gross Longs: | 57,564 | 65,225 | 9,080 |
| – Gross Shorts: | 22,578 | 102,725 | 6,566 |
| – Long to Short Ratio: | 2.5 to 1 | 0.6 to 1 | 1.4 to 1 |
| NET POSITION TREND: | | | |
| – Strength Index Score (3 Year Range Pct): | 59.8 | 41.2 | 60.4 |
| – Strength Index Reading (3 Year Range): | Bullish | Bearish | Bullish |
| NET POSITION MOVEMENT INDEX: | | | |
| – 6-Week Change in Strength Index: | 3.7 | -5.4 | 30.8 |
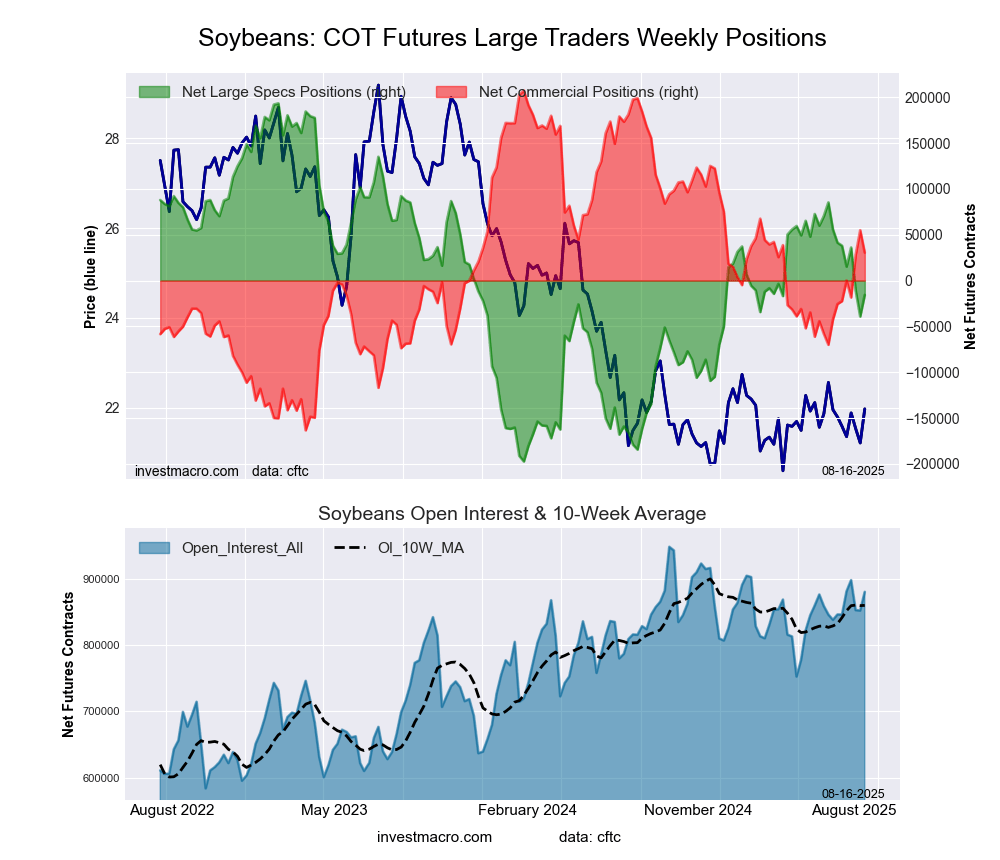
SOYBEANS Futures:
 The SOYBEANS large speculator standing this week recorded a net position of 21,420 contracts in the data reported through Tuesday. This was a weekly rise of 3,231 contracts from the previous week which had a total of 18,189 net contracts.
This week’s current strength score (the trader positioning range over the past three years, measured from 0 to 100) shows the speculators are currently Bullish with a score of 56.0 percent. The commercials are Bearish with a score of 42.3 percent and the small traders (not shown in chart) are Bullish with a score of 73.9 percent.
Price Trend-Following Model: Uptrend
Our weekly trend-following model classifies the current market price position as: Uptrend.
| SOYBEANS Futures Statistics | SPECULATORS | COMMERCIALS | SMALL TRADERS |
| – Percent of Open Interest Longs: | 18.2 | 56.0 | 5.8 |
| – Percent of Open Interest Shorts: | 15.8 | 56.8 | 7.5 |
| – Net Position: | 21,420 | -6,672 | -14,748 |
| – Gross Longs: | 157,352 | 483,406 | 49,895 |
| – Gross Shorts: | 135,932 | 490,078 | 64,643 |
| – Long to Short Ratio: | 1.2 to 1 | 1.0 to 1 | 0.8 to 1 |
| NET POSITION TREND: | | | |
| – Strength Index Score (3 Year Range Pct): | 56.0 | 42.3 | 73.9 |
| – Strength Index Reading (3 Year Range): | Bullish | Bearish | Bullish |
| NET POSITION MOVEMENT INDEX: | | | |
| – 6-Week Change in Strength Index: | -3.7 | 3.2 | 7.5 |
SOYBEAN OIL Futures:
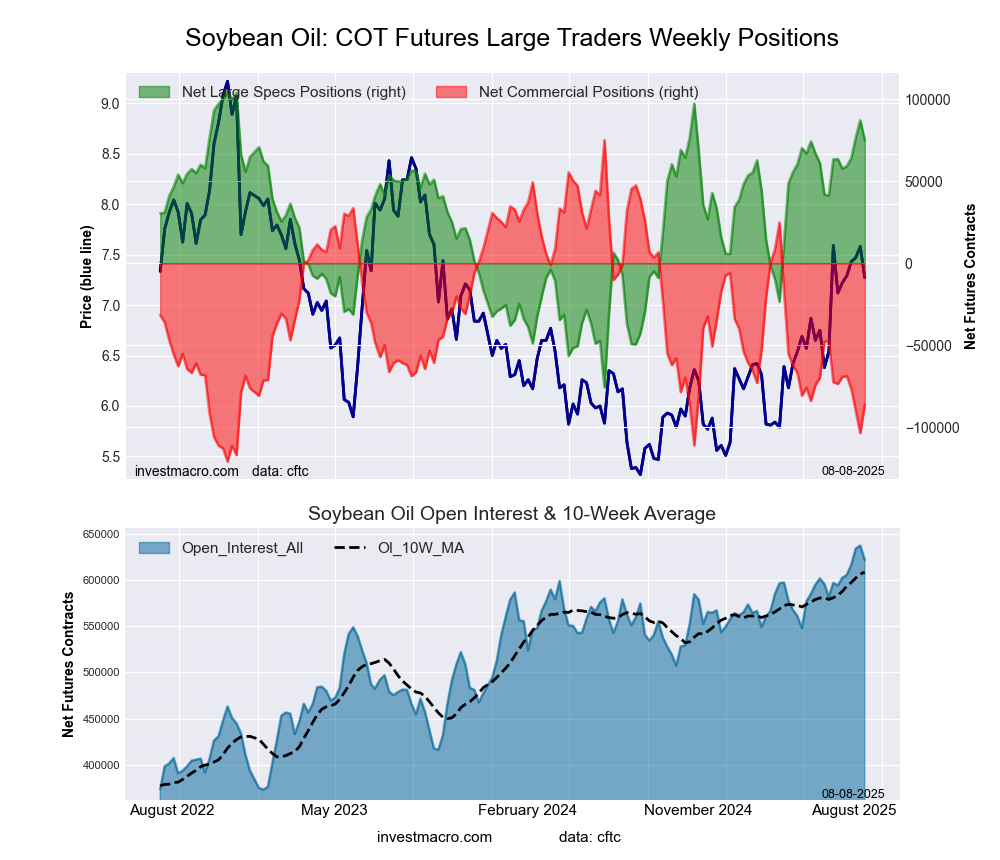
 The SOYBEAN OIL large speculator standing this week recorded a net position of 46,383 contracts in the data reported through Tuesday. This was a weekly decline of -9,127 contracts from the previous week which had a total of 55,510 net contracts.
This week’s current strength score (the trader positioning range over the past three years, measured from 0 to 100) shows the speculators are currently Bullish with a score of 67.5 percent. The commercials are Bearish with a score of 33.7 percent and the small traders (not shown in chart) are Bullish with a score of 59.6 percent.
Price Trend-Following Model: Weak Uptrend
Our weekly trend-following model classifies the current market price position as: Weak Uptrend.
| SOYBEAN OIL Futures Statistics | SPECULATORS | COMMERCIALS | SMALL TRADERS |
| – Percent of Open Interest Longs: | 22.2 | 44.3 | 5.6 |
| – Percent of Open Interest Shorts: | 14.5 | 53.3 | 4.2 |
| – Net Position: | 46,383 | -54,688 | 8,305 |
| – Gross Longs: | 134,545 | 268,814 | 33,950 |
| – Gross Shorts: | 88,162 | 323,502 | 25,645 |
| – Long to Short Ratio: | 1.5 to 1 | 0.8 to 1 | 1.3 to 1 |
| NET POSITION TREND: | | | |
| – Strength Index Score (3 Year Range Pct): | 67.5 | 33.7 | 59.6 |
| – Strength Index Reading (3 Year Range): | Bullish | Bearish | Bullish |
| NET POSITION MOVEMENT INDEX: | | | |
| – 6-Week Change in Strength Index: | -16.6 | 18.1 | -26.3 |
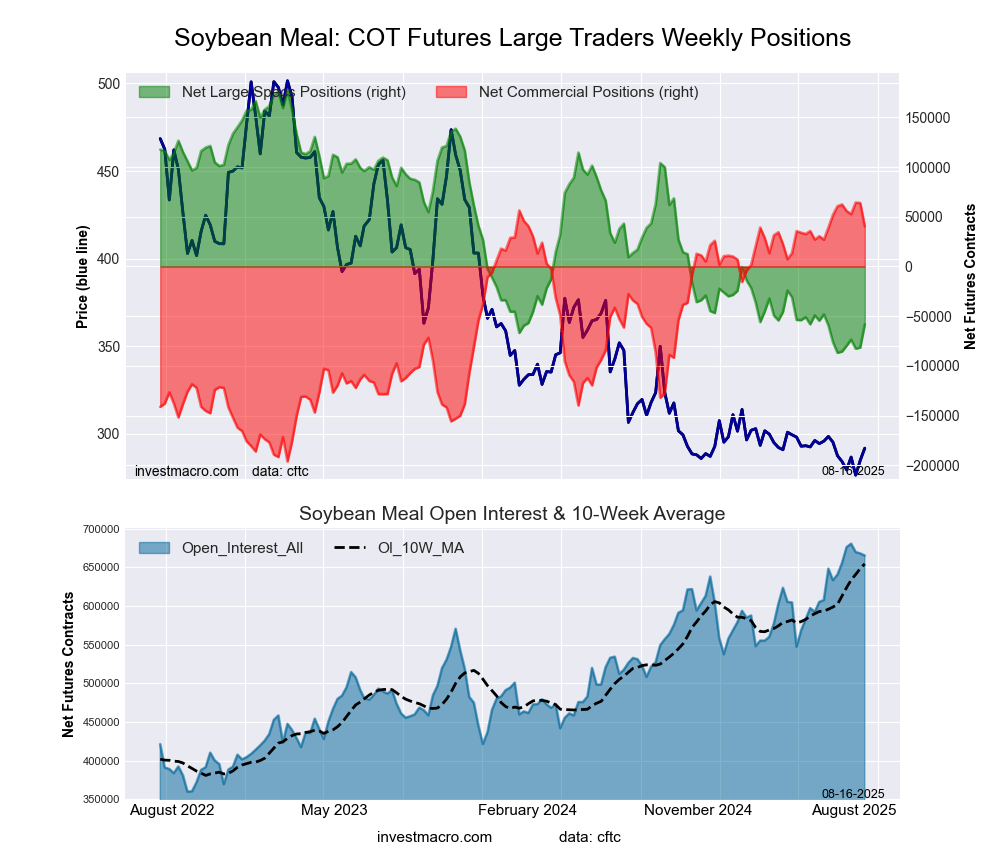
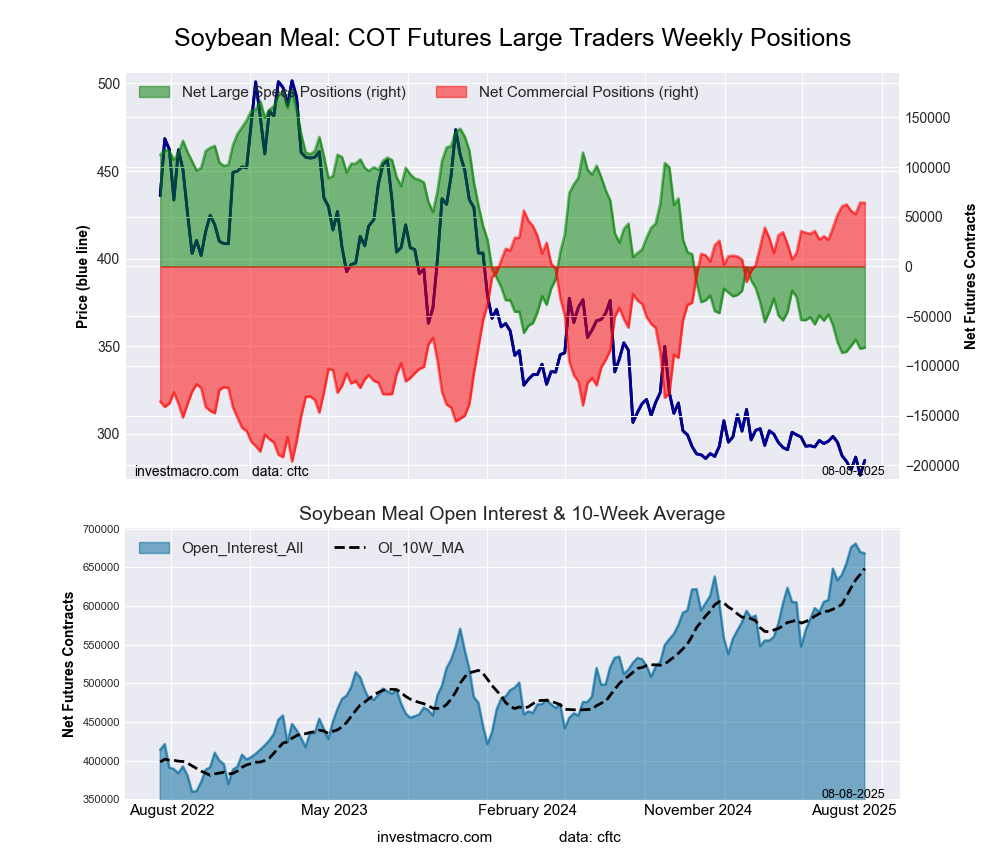
SOYBEAN MEAL Futures:
 The SOYBEAN MEAL large speculator standing this week recorded a net position of -54,464 contracts in the data reported through Tuesday. This was a weekly lowering of -21,568 contracts from the previous week which had a total of -32,896 net contracts.
This week’s current strength score (the trader positioning range over the past three years, measured from 0 to 100) shows the speculators are currently Bearish-Extreme with a score of 12.3 percent. The commercials are Bullish-Extreme with a score of 91.4 percent and the small traders (not shown in chart) are Bearish-Extreme with a score of 14.9 percent.
Price Trend-Following Model: Strong Downtrend
Our weekly trend-following model classifies the current market price position as: Strong Downtrend.
| SOYBEAN MEAL Futures Statistics | SPECULATORS | COMMERCIALS | SMALL TRADERS |
| – Percent of Open Interest Longs: | 18.6 | 53.0 | 8.1 |
| – Percent of Open Interest Shorts: | 27.9 | 45.8 | 5.9 |
| – Net Position: | -54,464 | 41,895 | 12,569 |
| – Gross Longs: | 108,170 | 308,856 | 47,190 |
| – Gross Shorts: | 162,634 | 266,961 | 34,621 |
| – Long to Short Ratio: | 0.7 to 1 | 1.2 to 1 | 1.4 to 1 |
| NET POSITION TREND: | | | |
| – Strength Index Score (3 Year Range Pct): | 12.3 | 91.4 | 14.9 |
| – Strength Index Reading (3 Year Range): | Bearish-Extreme | Bullish-Extreme | Bearish-Extreme |
| NET POSITION MOVEMENT INDEX: | | | |
| – 6-Week Change in Strength Index: | 7.2 | -4.1 | -46.1 |
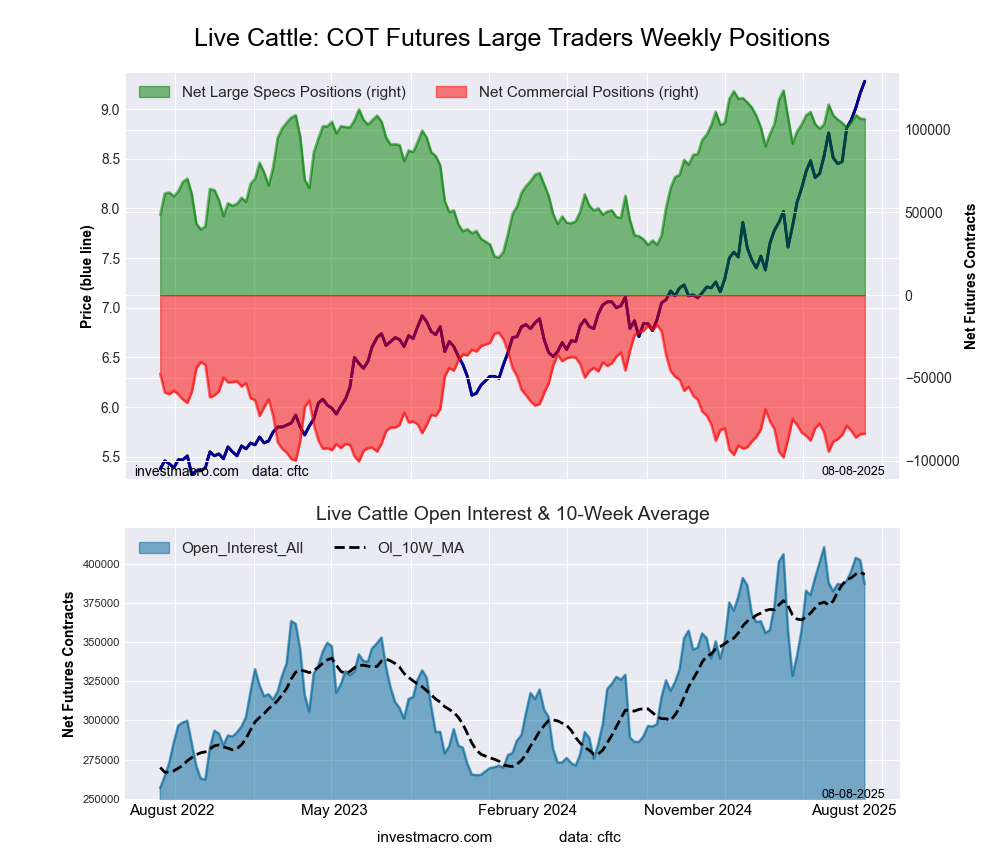
LIVE CATTLE Futures:
 The LIVE CATTLE large speculator standing this week recorded a net position of 110,235 contracts in the data reported through Tuesday. This was a weekly boost of 3,958 contracts from the previous week which had a total of 106,277 net contracts.
This week’s current strength score (the trader positioning range over the past three years, measured from 0 to 100) shows the speculators are currently Bullish-Extreme with a score of 86.7 percent. The commercials are Bearish-Extreme with a score of 13.3 percent and the small traders (not shown in chart) are Bearish with a score of 24.1 percent.
Price Trend-Following Model: Strong Uptrend
Our weekly trend-following model classifies the current market price position as: Strong Uptrend.
| LIVE CATTLE Futures Statistics | SPECULATORS | COMMERCIALS | SMALL TRADERS |
| – Percent of Open Interest Longs: | 48.4 | 27.9 | 7.3 |
| – Percent of Open Interest Shorts: | 20.6 | 50.4 | 12.5 |
| – Net Position: | 110,235 | -89,518 | -20,717 |
| – Gross Longs: | 192,249 | 110,848 | 28,932 |
| – Gross Shorts: | 82,014 | 200,366 | 49,649 |
| – Long to Short Ratio: | 2.3 to 1 | 0.6 to 1 | 0.6 to 1 |
| NET POSITION TREND: | | | |
| – Strength Index Score (3 Year Range Pct): | 86.7 | 13.3 | 24.1 |
| – Strength Index Reading (3 Year Range): | Bullish-Extreme | Bearish-Extreme | Bearish |
| NET POSITION MOVEMENT INDEX: | | | |
| – 6-Week Change in Strength Index: | 1.4 | -4.2 | 7.1 |
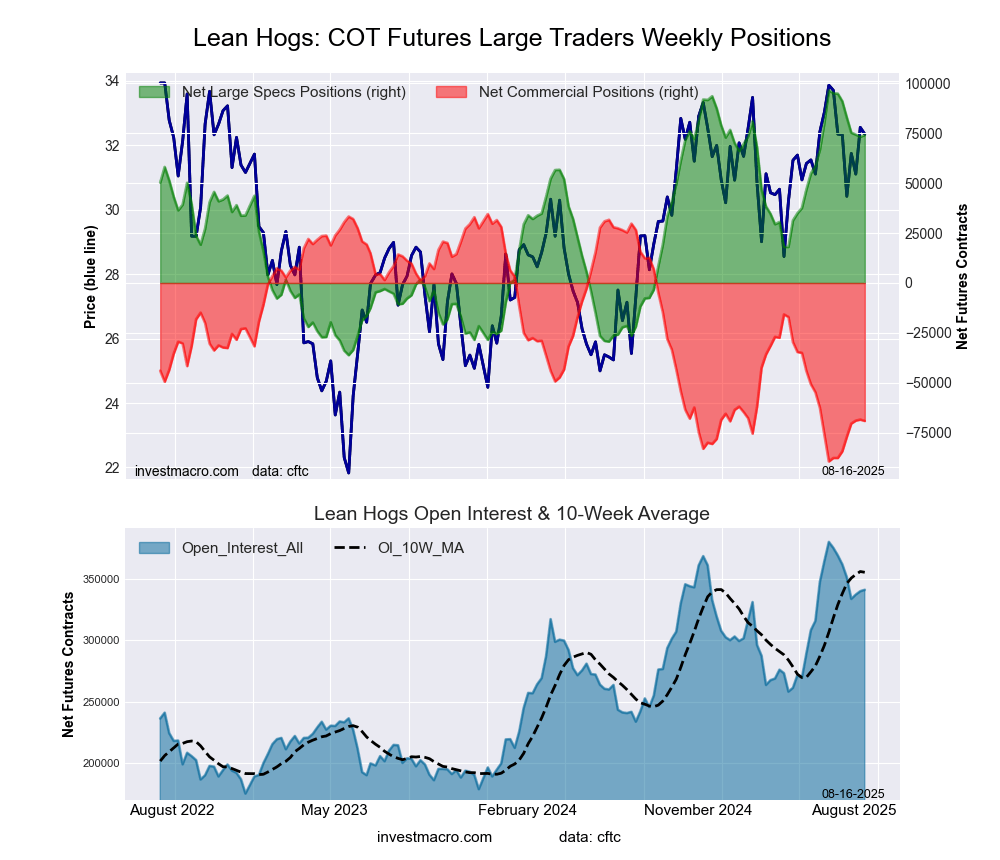
LEAN HOGS Futures:
 The LEAN HOGS large speculator standing this week recorded a net position of 83,340 contracts in the data reported through Tuesday. This was a weekly advance of 7,272 contracts from the previous week which had a total of 76,068 net contracts.
This week’s current strength score (the trader positioning range over the past three years, measured from 0 to 100) shows the speculators are currently Bullish-Extreme with a score of 90.2 percent. The commercials are Bearish-Extreme with a score of 8.2 percent and the small traders (not shown in chart) are Bullish with a score of 52.5 percent.
Price Trend-Following Model: Strong Uptrend
Our weekly trend-following model classifies the current market price position as: Strong Uptrend.
| LEAN HOGS Futures Statistics | SPECULATORS | COMMERCIALS | SMALL TRADERS |
| – Percent of Open Interest Longs: | 45.0 | 26.5 | 6.5 |
| – Percent of Open Interest Shorts: | 22.1 | 48.3 | 7.6 |
| – Net Position: | 83,340 | -79,175 | -4,165 |
| – Gross Longs: | 163,887 | 96,532 | 23,591 |
| – Gross Shorts: | 80,547 | 175,707 | 27,756 |
| – Long to Short Ratio: | 2.0 to 1 | 0.5 to 1 | 0.8 to 1 |
| NET POSITION TREND: | | | |
| – Strength Index Score (3 Year Range Pct): | 90.2 | 8.2 | 52.5 |
| – Strength Index Reading (3 Year Range): | Bullish-Extreme | Bearish-Extreme | Bullish |
| NET POSITION MOVEMENT INDEX: | | | |
| – 6-Week Change in Strength Index: | 6.2 | -7.1 | 4.1 |
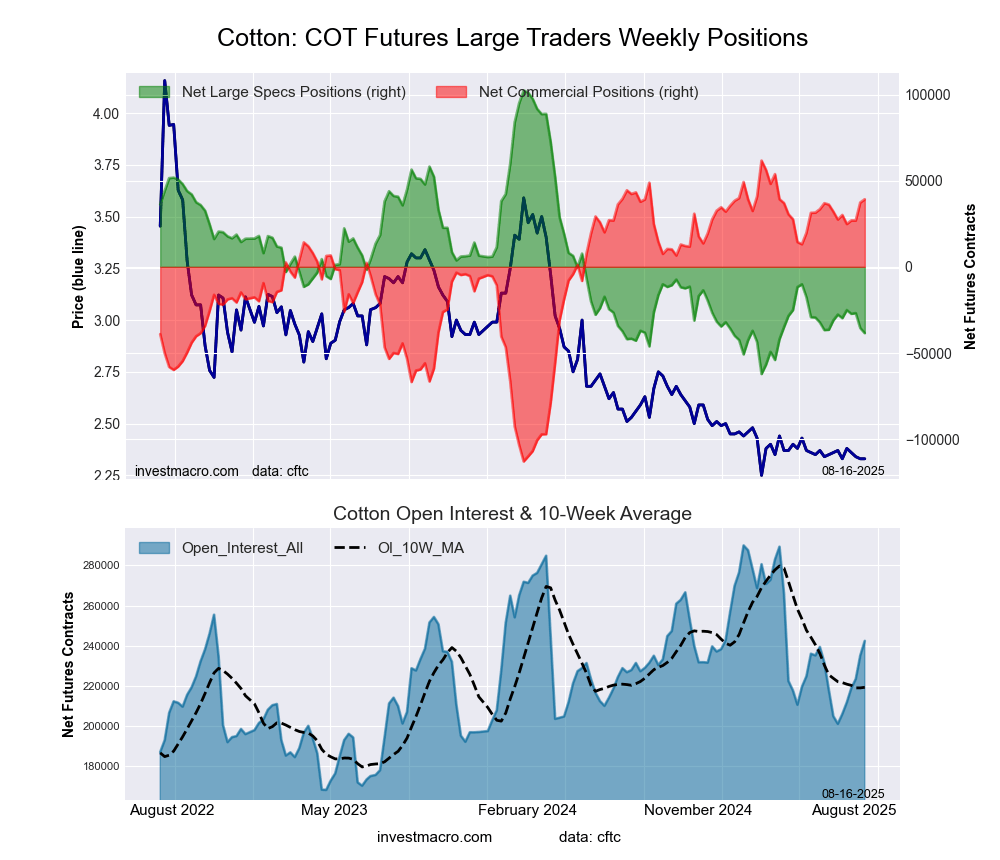
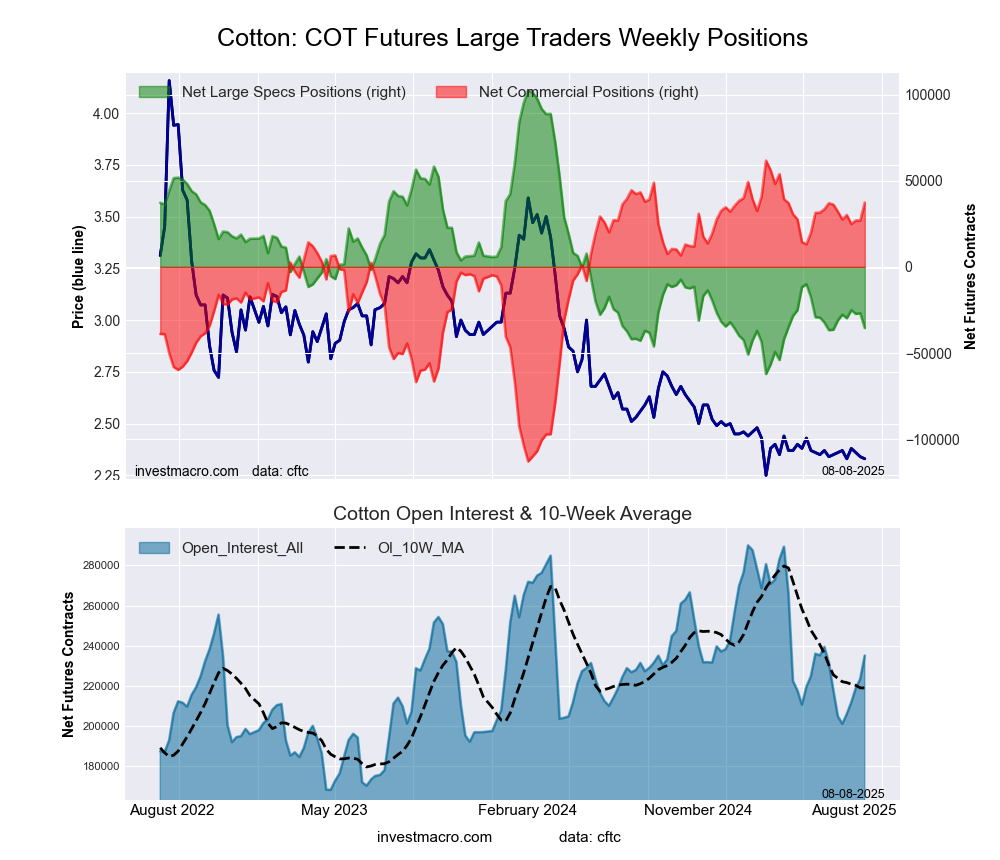
COTTON Futures:
 The COTTON large speculator standing this week recorded a net position of -48,212 contracts in the data reported through Tuesday. This was a weekly decline of -10,606 contracts from the previous week which had a total of -37,606 net contracts.
This week’s current strength score (the trader positioning range over the past three years, measured from 0 to 100) shows the speculators are currently Bearish-Extreme with a score of 8.5 percent. The commercials are Bullish-Extreme with a score of 92.7 percent and the small traders (not shown in chart) are Bearish-Extreme with a score of 16.9 percent.
Price Trend-Following Model: Strong Downtrend
Our weekly trend-following model classifies the current market price position as: Strong Downtrend.
| COTTON Futures Statistics | SPECULATORS | COMMERCIALS | SMALL TRADERS |
| – Percent of Open Interest Longs: | 27.8 | 49.9 | 5.0 |
| – Percent of Open Interest Shorts: | 46.8 | 30.5 | 5.3 |
| – Net Position: | -48,212 | 48,968 | -756 |
| – Gross Longs: | 70,472 | 126,343 | 12,788 |
| – Gross Shorts: | 118,684 | 77,375 | 13,544 |
| – Long to Short Ratio: | 0.6 to 1 | 1.6 to 1 | 0.9 to 1 |
| NET POSITION TREND: | | | |
| – Strength Index Score (3 Year Range Pct): | 8.5 | 92.7 | 16.9 |
| – Strength Index Reading (3 Year Range): | Bearish-Extreme | Bullish-Extreme | Bearish-Extreme |
| NET POSITION MOVEMENT INDEX: | | | |
| – 6-Week Change in Strength Index: | -12.7 | 12.6 | -7.8 |
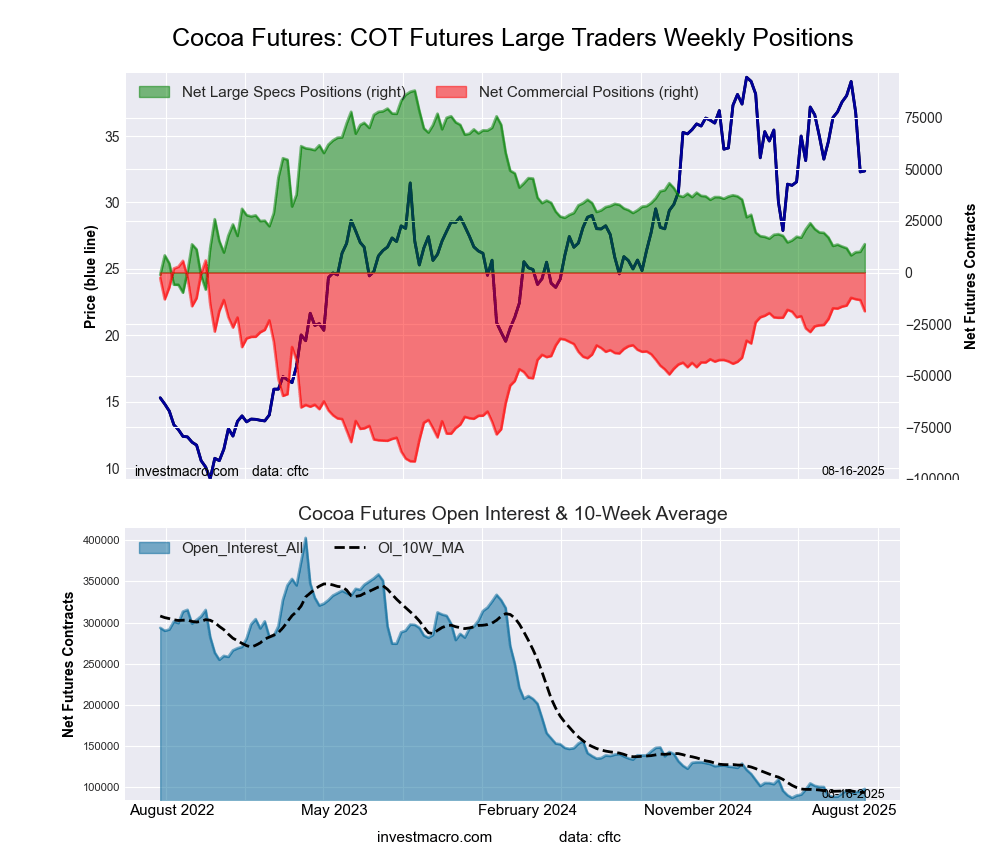
COCOA Futures:
 The COCOA large speculator standing this week recorded a net position of 6,697 contracts in the data reported through Tuesday. This was a weekly reduction of -1,299 contracts from the previous week which had a total of 7,996 net contracts.
This week’s current strength score (the trader positioning range over the past three years, measured from 0 to 100) shows the speculators are currently Bearish-Extreme with a score of 16.8 percent. The commercials are Bullish-Extreme with a score of 83.2 percent and the small traders (not shown in chart) are Bullish with a score of 58.3 percent.
Price Trend-Following Model: Strong Uptrend
Our weekly trend-following model classifies the current market price position as: Strong Uptrend.
| COCOA Futures Statistics | SPECULATORS | COMMERCIALS | SMALL TRADERS |
| – Percent of Open Interest Longs: | 26.6 | 47.0 | 12.2 |
| – Percent of Open Interest Shorts: | 19.2 | 58.7 | 8.0 |
| – Net Position: | 6,697 | -10,548 | 3,851 |
| – Gross Longs: | 24,029 | 42,365 | 11,040 |
| – Gross Shorts: | 17,332 | 52,913 | 7,189 |
| – Long to Short Ratio: | 1.4 to 1 | 0.8 to 1 | 1.5 to 1 |
| NET POSITION TREND: | | | |
| – Strength Index Score (3 Year Range Pct): | 16.8 | 83.2 | 58.3 |
| – Strength Index Reading (3 Year Range): | Bearish-Extreme | Bullish-Extreme | Bullish |
| NET POSITION MOVEMENT INDEX: | | | |
| – 6-Week Change in Strength Index: | -1.7 | 1.8 | -1.0 |
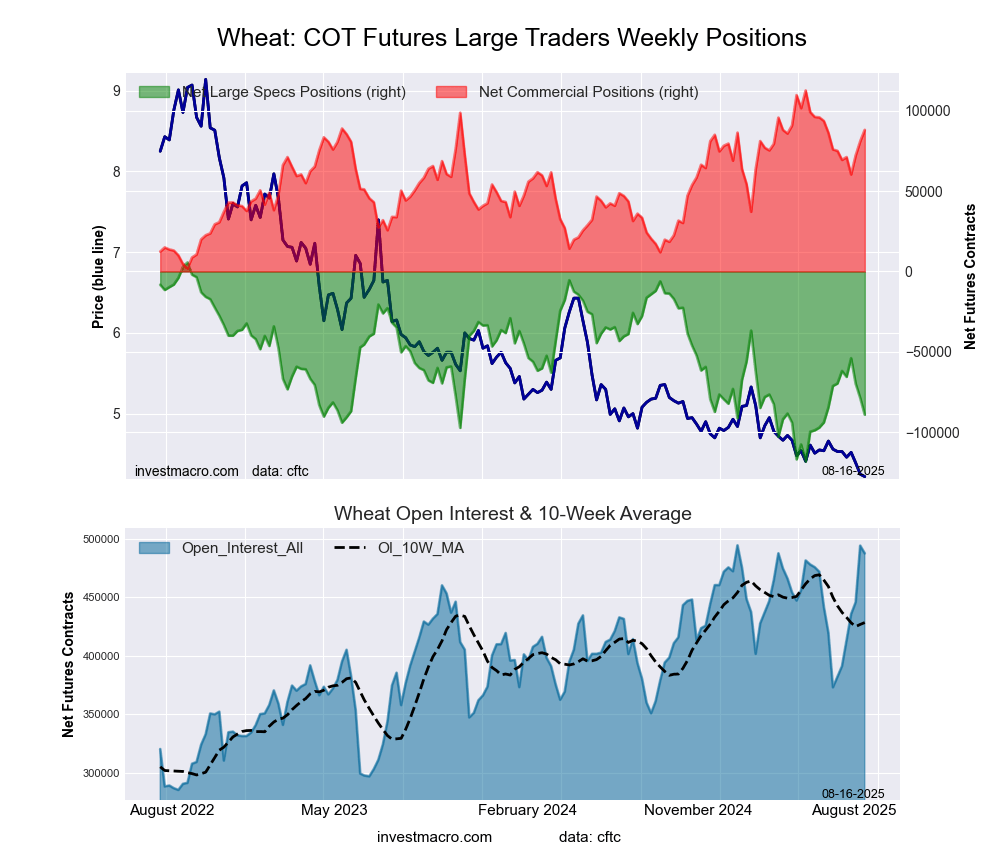
WHEAT Futures:
 The WHEAT large speculator standing this week recorded a net position of -71,636 contracts in the data reported through Tuesday. This was a weekly lift of 7,146 contracts from the previous week which had a total of -78,782 net contracts.
This week’s current strength score (the trader positioning range over the past three years, measured from 0 to 100) shows the speculators are currently Bearish with a score of 37.6 percent. The commercials are Bullish with a score of 63.1 percent and the small traders (not shown in chart) are Bullish with a score of 53.7 percent.
Price Trend-Following Model: Strong Downtrend
Our weekly trend-following model classifies the current market price position as: Strong Downtrend.
| WHEAT Futures Statistics | SPECULATORS | COMMERCIALS | SMALL TRADERS |
| – Percent of Open Interest Longs: | 29.8 | 37.4 | 7.6 |
| – Percent of Open Interest Shorts: | 46.6 | 20.5 | 7.6 |
| – Net Position: | -71,636 | 71,701 | -65 |
| – Gross Longs: | 126,625 | 159,079 | 32,467 |
| – Gross Shorts: | 198,261 | 87,378 | 32,532 |
| – Long to Short Ratio: | 0.6 to 1 | 1.8 to 1 | 1.0 to 1 |
| NET POSITION TREND: | | | |
| – Strength Index Score (3 Year Range Pct): | 37.6 | 63.1 | 53.7 |
| – Strength Index Reading (3 Year Range): | Bearish | Bullish | Bullish |
| NET POSITION MOVEMENT INDEX: | | | |
| – 6-Week Change in Strength Index: | -14.3 | 10.3 | 37.1 |
Article By InvestMacro – Receive our weekly COT Newsletter
*COT Report: The COT data, released weekly to the public each Friday, is updated through the most recent Tuesday (data is 3 days old) and shows a quick view of how large speculators or non-commercials (for-profit traders) were positioned in the futures markets.
The CFTC categorizes trader positions according to commercial hedgers (traders who use futures contracts for hedging as part of the business), non-commercials (large traders who speculate to realize trading profits) and nonreportable traders (usually small traders/speculators) as well as their open interest (contracts open in the market at time of reporting). See CFTC criteria here.