“Despite yesterday’s pop, I expect that collateral and margin calls are going to keep stocks under pressure right through month-end, but there is little doubt that yesterday’s outside reversal day (defined by a real technical analyst David Chapman as “a two-day pattern is observed in which a security’s high and low prices for the day exceed the high and low of the previous day’s trading session.”) was a major bullish event.
We had a positive outside day for gold and stocks and a negative outside day for the UST 10-year yield, and while these cannot be discounted, the headline shown above may be a portent of an impending shift in Fed policy. The reason for this lies in my “pigs in the barnyard” analogy regarding money managers and the banks from whom they obtain leverage.
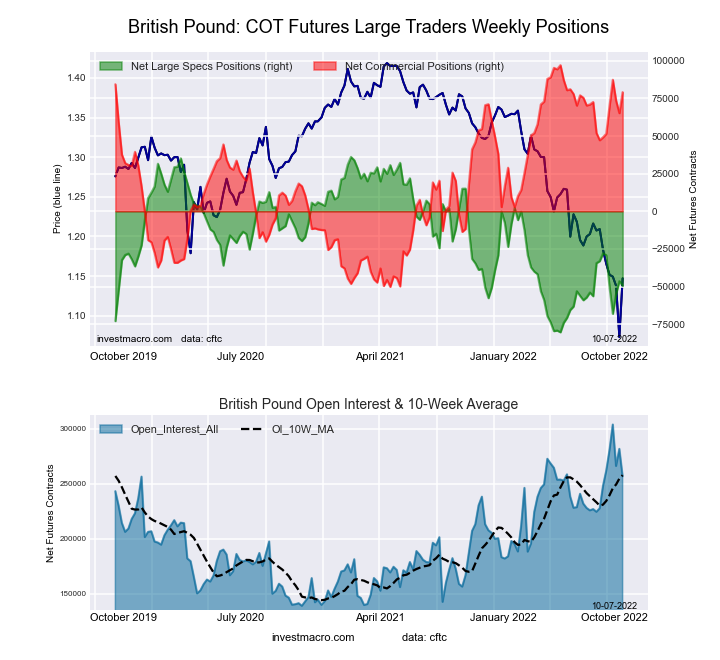
With yields so compressed over the past decade, many pension funds have been forced to implement large dollops of leverage in order to squeeze out a minimum 8% return to pensioners. In the case of the British gilts (10-year sovereign bonds), they sported a negative yield late last year and are now over 4%. The destruction to bond portfolios overweighted in these gilts must be enormous, but when you stack leverage on top of the losses, it is no wonder that the Bank of England had to step up and take on billions of pounds worth of paper lest the entire U.K. banking system become vaporized.
Now, returning to the “pigs in the barnyard,” when you gaze upon a herd of pigs in a barnyard, there will be pink pigs and mottled grey and brown pigs and black and white pigs and, of course, brown pigs, but when the farmer’s wife clangs the triangle with her ladle, all those pigs sidle up to the trough together.
In the same manner, the banks, hedge funds, and pension funds all feed at the same trough, so when I read that the BOE had to step in and buy gilts when their stated intent is to sell gilts as part of the globally-led (read: “Fed-Ordered”) quantitative tightening (“QT”) operation designed to curb inflation, you can bet that there are also American and Canadian and a boatload of European and Asian entities leveraged to the nines in government debt whose face value has been crushed in 2022.
So as refreshing as the rally on Wednesday was, we have three more full trading sessions before the month comes to a close. If the lows hold by Friday at 4:00 p.m. EST, then there is a strong probability of a tradable rally in risk-on assets, which includes precious metals and commodities.
However, if calls for additional collateral accelerate and this liquidity-starved financial environment persists, there remains a significant risk that one of the other highly-leveraged pension or hedge funds tip the boat over again.
The Fed’s dual mandate includes maximum full employment and price stability with the current focus on the latter, but there is only one condition that countermands the dual mandate, and that condition is “financial system stability,” and what happened with those British gilts is that very condition.
Margin calls are the ultimate form of financial contagion, so to say that we are at a critical inflection point is an understatement.
Watch the Fed like a hawk for signs of dovish rhetoric or an overt acknowledgment of stresses finally arriving on Wall Street. The “pivot” only occurs if the Fed’s owners, the big U.S. banks that have been feeding at the same leverage trough as their British counterparts, start getting collateral calls.
Then, and only then, will it be safe to go in the water again. . .”
Coast Not Clear
I sent out that missive at 9:22 a.m. (pre-opening Thursday) to make the emphatic point that “the coast” was not exactly “clear.” Eight minutes later, stocks opened down and proceeded to completely erase the near-600-point advance in the Dow and, at one point, were at new lows for the year.
“Fade every rally until the Fed goes officially neutral-positive. . .” I tweeted out a few weeks back, and Thursday’s crushing reversal confirmed that advice, all a function of the most significant four-letter-word in the history of modern markets: Debt.
Truly the only collateral is gold.
I launched my advisory service in January of 2020 with the GGMA 2020 Forecast Issue and proceeded to offer the premise that the ultimate arbiter of all pricing structures would eventually be determined by the value of the collateral held by those that control the currency.
Since the treasury departments of most sovereign nations control the collateral and since the central banks are the entities that extend credit to the treasuries, then the collateral that coerces people to believe in the “Full Faith and Credit” of government must be related to a higher mark.
That collateral, and truly the only collateral, is gold.
Gold, Gold, Gold
In that piece written by and large in the fourth quarter of 2019, I provided a chart illustrating how much-maligned nations like Italy and Russia were actually more solvent than the United States.
Dividing the national debt by the value of their stated central bank or treasury holdings, Russia (thanks largely to the art of default in 1998) had the lowest national-debt-to-gold ratio of any country on the planet, while resource-rich Canada had the highest — as in infinity — because there was then and exists today zero gold at the Bank of Canada nor anywhere close to the Royal Canadian Mint.
Gold enthusiasts have been eating the exhaust fumes of the mainstream media since 2011, and I suspect that with the events in the U.K. this week, a huge regime change is about to arrive.
As a commodity-rich country anchored by the Rule Of Law, I find that an astounding act of national embarrassment. It is funny how generational hardship affects behavior but also comprises the bulk of the wisdom passed down from grandfather to father to son, which amplifies one’s attention to the causes of said hardship.
My mother was taught by her mother never to throw away day-old bread because it had great healing powers in the mold. My father was told by his grandmother to “avoid debt at all costs” because of the farm they lost to foreclosure in Saskatchewan in the 1930s, which prompted my father to avoid taking on debt when a piece of land located at the mouth of the Credit River on Lake Ontario became available for US$2,500.
It is easy to chastise those that opted for conservation over speculation, but it all falls under the category of “right time, right place,” and there is no better time than the present to truly appreciate this truism.
Ask the cryptojunkies to take out ads beseeching us to “sell your gold and buy crypto!” back in 2021.
Gold enthusiasts have been eating the exhaust fumes of the mainstream media since 2011, and I suspect that with the events in the U.K. this week, a huge regime change is about to arrive.
The Fed Mandate
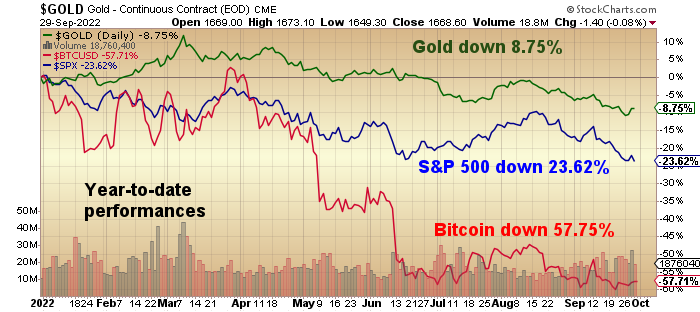
The chart shown above is a perfectly-timed illustration of what happens when bubbles crack wide open and spill the hopes and dreams of a generation onto an odious and steaming sidewalk.
Sexagenarians like me know how the twin demons of government profligacy and mainstream media deception combine to mold investor optimism to a predetermined advantage, all while unelected and very powerful quasi-government officials milk the system largely insulated from either the forces of moral suasion or penal scrutiny.
Is it any coincidence that the stock market was rolling along “just fine” until Fed governors Kaplan, Rosengren, and Clarida were all caught front-running Fed decisions?
Shortly thereafter, the Fed mandate shifted, and once the Wall Street traders finally received and actually read the memo, they finally sold their positions, got shot, and then pulled every bid imaginable until the bear market finally arrived.
Now, we are in a full-blown bear market in every single asset class in existence which is what occurs when the management of currency moves from the ridiculous to the sublime.
Here is a brief pecking order of how households manage their monthly income. Dad and Mom pool their paycheques into a joint account. Nothing gets withdrawn until rent (or mortgage), groceries, utilities, loans (auto, credit cards, etc.) Dad then has to ask Mom if he can grab a few quid to hit the track with “the boys.”
Knowing full well that she will have a resentful and ungrateful hubby if she refuses, she gives him a few quid and then cancels her hair appointment because her three sons need shoes, and there is a dental appointment for one of them that surely is not covered by anything other than the piggy-bank up behind the fridge.
Shortly thereafter, the Fed mandate shifted, and once the Wall Street traders finally received and actually read the memo, they finally sold their positions, got shot, and then pulled every bid imaginable until the bear market finally arrived.
These are the challenges of the average working family.
Now, contrast that with the political class that preaches climate change and “Tax the Rich” while they sip champagne in the front section of the aircraft taking them to Davos for a “Climate Change Conference” as the chartered jet spews out more carbon crossing the Atlantic than a coal-carrying steamer in the 1920s.
They will then be police-escorted (at taxpayer expense) to a five-star hotel, where they will sip more champagne and scarf down Beluga Caviar (of Russian origin) while debating how to free the Ukrainians from Putin’s aggression.
This entire farce confronting the world we face today is a function of public apathy and voter ambivalence to issues that once appeared trivial but which have now metamorphosed in combination and coincident with staccato-like repetition into a leviathan-sized problem.
And it all arrives around the fact that while Mom and Dad cannot ask their banker to increase their credit lines to pay for my little brother’s tuition, the politicians can legislate without recourse any amount they so choose with no entity empowered to say “HALT!” and order House Arrest.
Whether the politicians are Liberal or Conservative, Whig or Labour, or Republican or Democrat, they are all in the same barnyard, and when the farmer’s wife clangs that huge iron triangle just above the trough, they all come running, regardless of color, tone, race, creed, or party and they feed with the gusto of Mr. Creosote in that famous Python sketch where he “has a mint” and then explodes.
Politicians are the minions of the elite, but that is a discussion for another day.
As disgusting as the above picture appears, there is no better graphic available to adequately describe today’s political narrative. The politician of the year 2022 enters into a career not because he (or she) feels a need to change the world but more as a need to feel important.
As a student of history, I always run the risk of believing in the neutrality of the author, but biographies of the great (and not-so-great) statesmen like Churchill, Bismarck, Lincoln, and Gandhi would reveal a common thread of invincibility against media scrutiny.
They gave the middle finger to the journalist, irrespective of stature and notoriety, and went on their merry ways. There are far too many Mr. Creosote’s in today’s congressional and parliamentary gatherings; once they at once both discredited and removed, the government will improve.
Getchell Gold Last Man Standing
Markets will undoubtedly head into October with the greatest of fear and reverence. I know from conversations with my wonderful subscribers that they are terrified that our “last man standing,”
Getchell Gold Corp. (GTCH:CSE; GGLDF:OTCQB), stunned but not staggered, will finally get victimized by this most ruthless of canine predators. My response has always been the same; if the company does nothing else but deliver their revised resource estimate, then we can park our money into Getchell with the full expectation that it will eventually be rerated at “par.”
In this case, “par” is a euphemism for “fair value,” which is between 7.5-and-15-times current pricing. Forget the arrival of “the new paradigm” or the “ultimate demise of the bullion bank naked shorters”; gold mining stocks are bound for a regression to the mean of historical valuation.
When that happens, all boats shall rise.
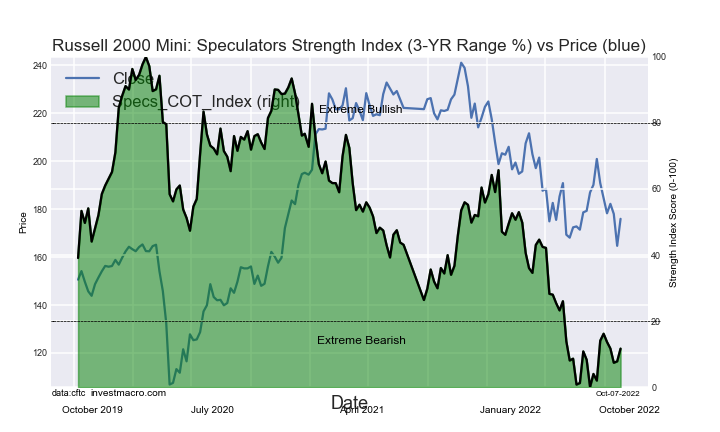
My observation on the state of markets is this: we are at a point of extreme pessimism and headline bearishness, both historically the starter pistol “CRACK!” of a new bull market advance. The problem is that we do not yet have anything close to a confirmation by Fed policy that they give a hoot about anything but lagging deflationary indicators, so until they acknowledge the protests from the Bank of England or the screams from the U.S. pension fund clients underwater at Goldman or JPM or BofA, it will be “Preservation of Capital” at all costs.
Nord Stream Gas Pipelines
My final comment on the week revolves around the far more significant geopolitical headline that involves the sabotage of Nord Stream gas pipelines, the conduits for Russian gas transmission into Germany.
Like always, the mainstream media are so far behind the curve on this event that it begs the question: “Who actually reports the news?”
With winter approaching, the energy crisis in Europe has just ratcheted up several notches because now the Russians have ZERO leverage over the European decision-makers. As long as Vlad the Impaler carried the threat of shutting down gas flows to Europe, he had leverage in his battle for control of Ukraine but, more importantly, in his battle to wrest control of Europe from the NATO forces.
That leverage has now evaporated, and Putin knows it. The reason this is a much larger story than U.K. pension funds imploding is that it has launched the globe directly back to the Cold War of the 1960s, but since the Russians are already entangled in their Hot War in Ukraine, the loss of leverage as winter approaches has forced a desperate Europe back into the arms of NATO — meaning — the U.S.
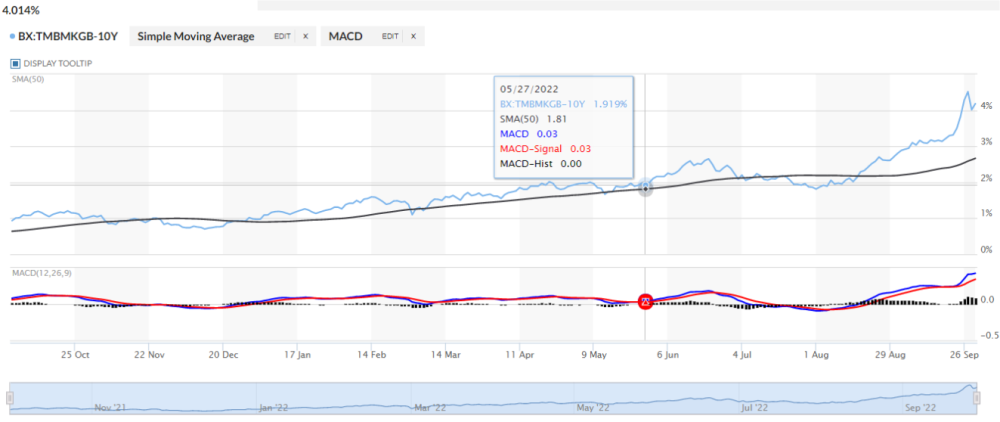
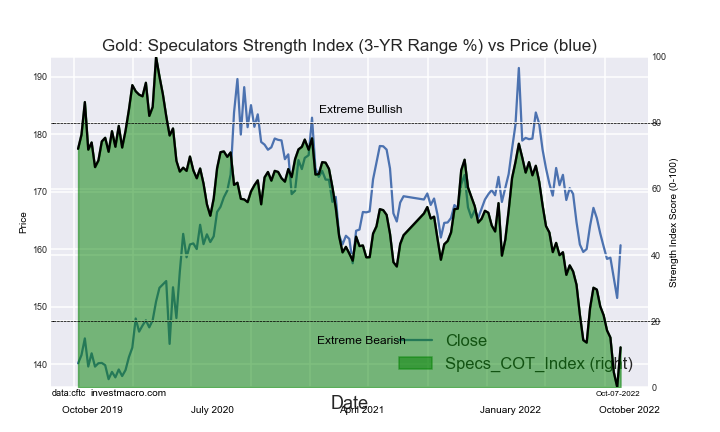
Look for gold prices to be a dark night lighthouse, and as we sail into the outer perimeters of a possible new precious metals bull, the safe arrival will be annotated with calm seas but clear night skies full of watchful stars and suspicious moon. Watch the U.S. 10-year treasury yield as your night sextant.
So, logic dictates that on a scale of one to ten, with one being “maximum benefit of a Russian gas shutdown” and ten being “minimum (or no) benefit of a Russian gas shutdown,” Russia and all of Europe would be a “one” as Russia gets no gas revenue from Europe and Europe freezes this winter while those loyal to NATO and the U.S. would get a “ten” as Europe reaches out in desperation for assistance (“rescue”) from the West.
This was a game-changer, and the danger is that Putin, being a chess grandmaster, knows that a retaliatory move is absolutely required in order to even the playing field and to maintain favor in the court of public opinion, in the Duma, and the Russian Federal Assembly.
With the campaign in Ukraine going badly awry and certainly not the turnkey operation that was originally formatted in their war game modeling, Putin’s vice-grip on power is certainly not strengthening. We all know that there is nothing more dangerous than a wounded, cornered animal, and as a child who grew up with air raid sirens and “Duck-and-cover” drills in the 1960s, I am far more sensitive to the prospect of a nuclear option currently at the disposal of Vlad the Impaler.
Somewhere out there is a retaliatory move being planned, and while markets creaked and shuddered at the specter of a massive pension fund default earlier this week, it will most certainly break in half at a sinking of a large LNG freighter carrying a U.S. flag or something (god forbid) even direr.
Look for gold prices to be a dark night lighthouse, and as we sail into the outer perimeters of a possible new precious metals bull, the safe arrival will be annotated with calm seas but clear night skies full of watchful stars and suspicious moon.
Watch the U.S. 10-year treasury yield as your night sextant. It looks like it has been “taken” lower this week — always the first clue for a cynical man trying to make sense of the world growing increasingly mad by the day, hour, and minute.
Michael Ballanger Disclaimer:
This letter makes no guarantee or warranty on the accuracy or completeness of the data provided. Nothing contained herein is intended or shall be deemed to be investment advice, implied or otherwise. This letter represents my views and replicates trades that I am making but nothing more than that. Always consult your registered advisor to assist you with your investments. I accept no liability for any loss arising from the use of the data contained on this letter. Options and junior mining stocks contain a high level of risk that may result in the loss of part or all invested capital and therefore are suitable for experienced and professional investors and traders only. One should be familiar with the risks involved in junior mining and options trading and we recommend consulting a financial adviser if you feel you do not understand the risks involved.
Disclosures:
1) Michael J. Ballanger: I, or members of my immediate household or family, own securities of the following companies mentioned in this article: Getchell Gold Corp. I personally am, or members of my immediate household or family are, paid by the following companies mentioned in this article: None. My company, Bonaventure Explorations Ltd., has a consulting relationship with Getchell Gold Corp.
2) The following companies mentioned in this article are billboard sponsors of Streetwise Reports: None. Click here for important disclosures about sponsor fees.
3) Statements and opinions expressed are the opinions of the author and not of Streetwise Reports or its officers. The author is wholly responsible for the validity of the statements. The author was not paid by Streetwise Reports for this article. Streetwise Reports was not paid by the author to publish or syndicate this article. Streetwise Reports requires contributing authors to disclose any shareholdings in, or economic relationships with, companies that they write about. Streetwise Reports relies upon the authors to accurately provide this information and Streetwise Reports has no means of verifying its accuracy.
4) This article does not constitute investment advice. Each reader is encouraged to consult with his or her individual financial professional and any action a reader takes as a result of information presented here is his or her own responsibility. By opening this page, each reader accepts and agrees to Streetwise Reports’ terms of use and full legal disclaimer. This article is not a solicitation for investment. Streetwise Reports does not render general or specific investment advice and the information on Streetwise Reports should not be considered a recommendation to buy or sell any security. Streetwise Reports does not endorse or recommend the business, products, services or securities of any company mentioned on Streetwise Reports.
5) From time to time, Streetwise Reports LLC and its directors, officers, employees or members of their families, as well as persons interviewed for articles and interviews on the site, may have a long or short position in securities mentioned. Directors, officers, employees or members of their immediate families are prohibited from making purchases and/or sales of those securities in the open market or otherwise from the time of the decision to publish an article until three business days after the publication of the article. The foregoing prohibition does not apply to articles that in substance only restate previously published company releases.
As of the date of this article, officers and/or employees of Streetwise Reports LLC (including members of their household) own securities of Getchell Gold Corp., a company mentioned in this article.


