
By Ganesh Viswanath-Natraj, Warwick Business School, University of Warwick
The pound has recovered from a recent record dip after the chancellor’s mini-budget announcement. But it is still at low levels versus many other currencies.
The recent decline can be mostly attributed to the tax cuts announced during Chancellor Kwasi Kwarteng’s recent mini-budget. The £45 billion package caused concern among investors by considerably increasing future government debt, although Kwarteng has since announced a U-turn on the £2 billion plans to abolish cuts for the highest earners. More generally, escalating inflation expectations from this increased fiscal expansion, coupled with ongoing rising energy costs, have had a negative impact on the UK economy and therefore the value of sterling.
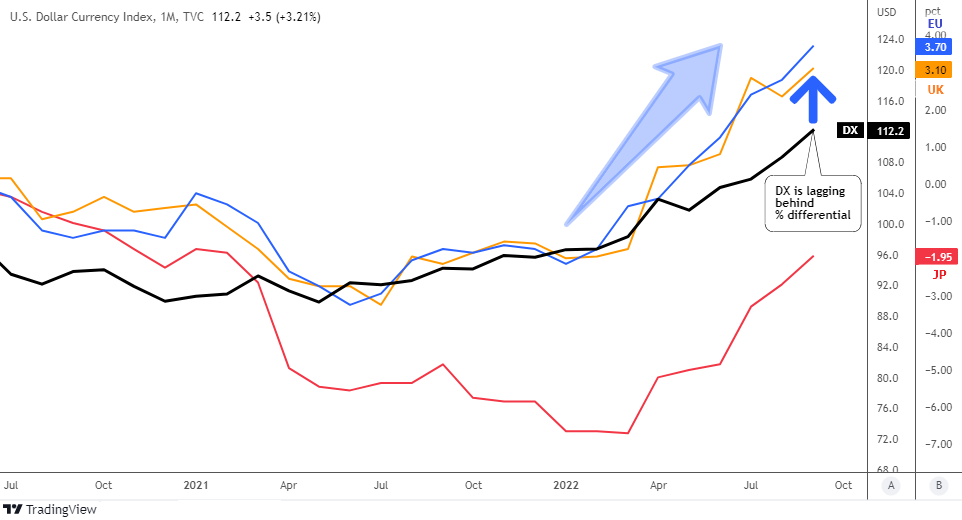
The weakening of the pound is also part of a global phenomenon. The US dollar has appreciated by 12% since the end of 2021 against a broad index of currencies, and by more than 20% against the pound. This broad appreciation is attributed to a tightening of US monetary policy and a shift in the risk appetite of investors towards US dollar assets, currently viewed as more of a safe haven.
Given these underlying pressures, questions about the long-term valuation of pound sterling abound, including whether it will settle at parity with the US dollar. An analysis by Bloomberg has shown financial markets believe there is a 60% probability that sterling will reach dollar parity by the end of 2022. A long-term decline in the valuation of the pound increases the price of imported goods, which can feed into consumer price inflation.
If policy makers want to shore up the currency’s strength, several economic theories suggest they must address high inflation expectations, the impacts of Brexit and the various supply chain issues plaguing the economy at present.
Comparing burgers with burgers
Ever heard of the Big Mac Index? Research about long-term movements in exchange rates shows they tend to change in line with relative inflation rates in many countries. This theory, known as purchasing power parity (PPP), uses the price of specific products or baskets of goods to compare currencies and standards of living in different countries.
As such, we can examine the value of the pound compared to other currencies by looking at a single good such as a McDonald’s Big Mac burger. Since this product is the same across countries, the Big Mac can be used to calculate a PPP-implied exchange rate by comparing its price in the UK and the US. In July 2022, the Big Mac Index showed the pound was undervalued by around 14%, based on the exchange rate implied by Big Mac prices in the US versus the UK.
Forecasts by the Bank of England put inflation at 14% by the fourth quarter of 2022, however it is expected to decline to 5% by the end of 2023. The relative fall in UK inflation in 2023 should strengthen the pound, reducing the undervaluation predicted by the Big Mac Index.
Another theory that can help us understand the long-term value of the pound is the link between the sustainability of public debt, sovereign risk and exchange rates. A large increase in the ratio of government debt to gross domestic product (GDP) can trigger a weakening of the currency as financial markets expect more risk, that is, concerns increase about the government being able to repay this debt.
Before the second world war, when sterling was the world’s reserve currency, the government could borrow at low cost. Present-day sterling no longer has the same privileges, however, particularly in recent weeks when sterling has even been compared to emerging market currencies. This theory would dictate that the debt-to-GDP ratio and corresponding sovereign risk must decrease for sterling to recover its value.
Long-term exchange rate movements can also be assessed by comparing productivity differences across countries. Known as the Balassa-Samuelson hypothesis, this theory links productivity slowdowns in a country’s tradeable sector – the industries that produce items that are traded internationally – to a weakening in its real exchange rate (that is, after accounting for differences in inflation).
This theory would therefore link supply chain disruptions resulting from Brexit and the war in Ukraine with fundamental declines in the UK’s productivity, causing the long-term value of the pound to depreciate.
Protecting the pound
Rescuing the pound from long-term parity with the dollar will require action from policy makers. The Bank of England oversees monetary policy – using interest rates, among other tools to control the supply of money to the economy – and has a mandate from the government to tackle price stability by using interest rate increases to bring down inflation. Futures markets forecast an interest rate increase of 4% to 6.25% by May 2023 , showing an expectation that the Bank will continue to hike rates to tackle inflation.
The government takes care of fiscal policy – spending and taxation decisions – and recommendations from markets and organisations such as the International Monetary Fund point towards a need for more prudence and fiscal restraint in light of current inflationary pressures. The UK government will announce a medium-term fiscal plan on November 23 that should aim to address the government debt to GDP ratio and shore up investor confidence in the economy.
Perhaps the most difficult challenge, however, will be tackling structural change as a result of the recent productivity slowdown due to Brexit and pandemic-related supply chain disruptions. Facilitating post-Brexit trade relations with the European Union could provide the necessary support to the UK’s tradeable sector to help boost the pound.
Without firm plans on these issues, the outlook for the long-term valuation of the pound remains uncertain. While global factors like the risk appetite of investors may continue to keep the dollar strong, domestic factors could mitigate these effects. Monetary tightening, fiscal consolidation and structural reform of the tradeable sector will all contribute to a revaluation of the pound, providing a route for policy makers to shore up its value on the international stage.![]()
About the Author:
Ganesh Viswanath-Natraj, Assistant professor, Warwick Business School, University of Warwick
This article is republished from The Conversation under a Creative Commons license. Read the original article.


