Source: Ron Struthers (10/15/22)
Markets will remain in a bear market for some time, and it is best to look for short trades. Lumber stocks ran up in price with high lumber prices and a post-Covid-19 recovery in the economy. They are priced too high and not reflecting lower lumber prices and a softer housing market induced by a coming recession.
Canada Bank Stocks
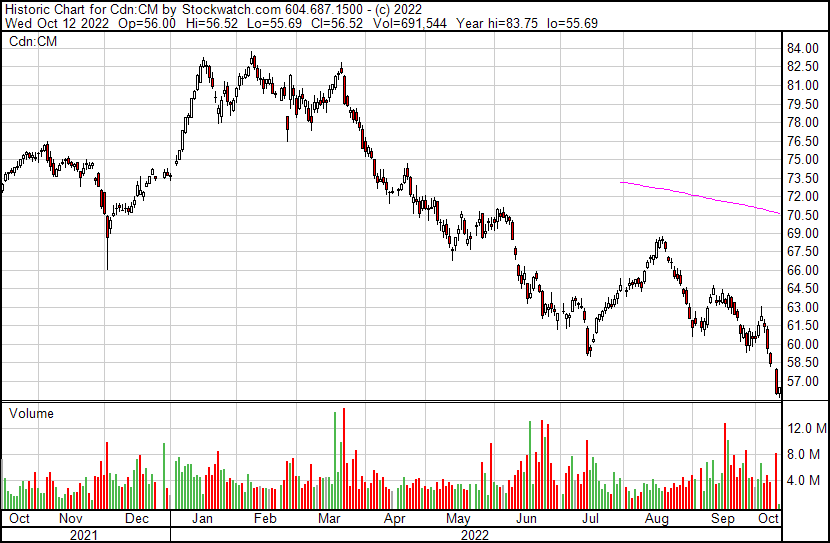
I will try to pinpoint that. This past Tuesday, the Canadian bank stocks broke down on the charts, except for Royal Bank, which managed to hold at its July low. I show the chart here on CIBC where we have the March 2023 $65 Put option that has a good gain now.
I suggested selling half our Bank of Nova Scotia in March 2023 for $80 Put where we have a 100% gain. The bank stocks are starting to price in a recession and a plunging real estate market. I expect they could test their 2020 Covid lows.
TD Bank had forecast that Canadian house prices would fall -19% by end of 2022. Now they are predicting another -11.2% in 2023. That works out to about a -28% drop, coming in line with my -30% or more prediction. TD’s Sondhi expects home sales to drop -20% below pre-pandemic levels.
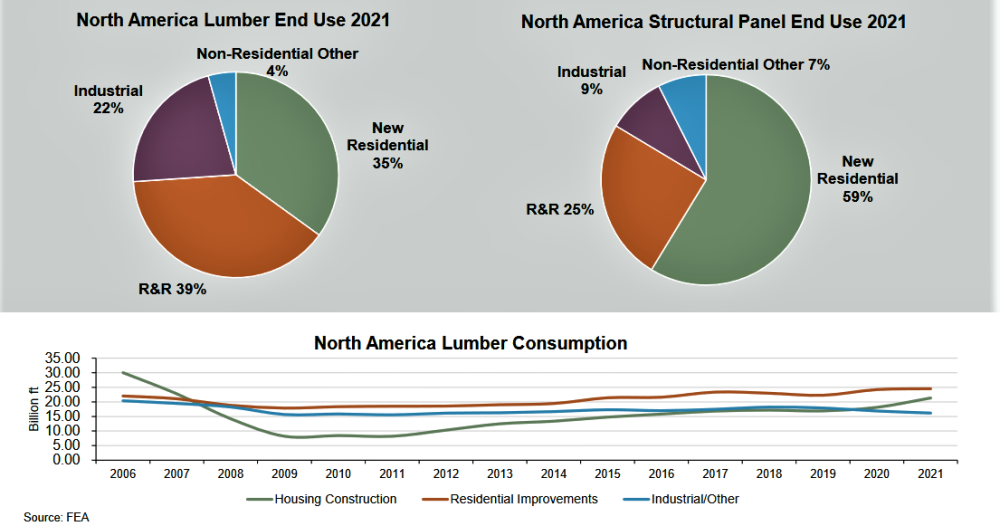
That will probably mean a drop in housing construction and lumber prices that have already fallen to pre-pandemic levels. The housing in the U.S. is a different story as it was not so highly leveraged as Canada, but U.S. housing starts have fallen with a combination of a weaker market with labor and supply shortages.
US Housing
That said, an economic slowdown and recession will negatively affect U.S. housing too. Surprise, surprise, surprise, as Gomer Pyle would say.
Well, you should not be, as I have been warning for a year. The September report is the seventh out of nine CPI readings this year to have topped expectations, according to Michael Brown, the senior market analyst at Caxton.
As I have been commenting numerous times, this inflation is entrenched and will be very tough to tame. Year-over-year CPI retreated to 8.2% last month from 8.3% in August, while the annualized increase in core CPI, which strips out volatile food and energy prices, rose to 6.6% from 6.3%. Both numbers came in higher than economists polled by the Wall Street Journal had expected.
The 0.6% core versus a Wall Street forecast of 0.4% was a big shock. The increase in the core rate over the past year climbed to a new peak of 6.6% from 6.3%, marking the biggest gain in 40 years. Take note, it is the core (PCE) that the Fed focuses on.
Markets initially plunged Thursday on the bad inflation report and then rallied in one of the biggest reversals I have ever witnessed. S&P futures peaked +1.57% ahead of the CPI release, bottomed out -2.4%, and the S&P 500 closed +2.6% with a round trip intraday range of 5.52%, according to Deutsche Bank.
The reversal is impressive, and I show a chart on the popular Spyder ETF that represents the S&P 500. What is noteworthy, the volume was not very impressive for such a move. This is a powerful reversal from a new low indicated by a strong engulfing bullish white candle.
All the talk I heard was about this is peak inflation, the market has bottomed, blah blah blah. We could have a bear market rally, and that is it. Bear markets bottom when everyone is bearish and calling for new lows, not bottoms and reversals. This alone convinces me this is no bottom but could be another bear trap a rally emerges.
Thursday could just be a one-day wonder, but if we do get a bear rally, I marked in resistance levels that would relate to 3,700 and 3,900 on the S&P 500. Friday, markets bounced lower off the 3,700 area. I would be surprised if the market could move much above 3,900; all the problems facing the economy and markets have not improved and will probably get worse before they get better.
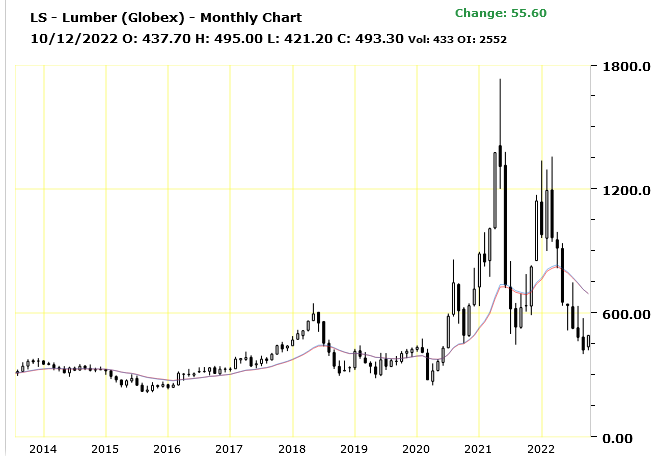
I commented and had a chart on lumber in May 2021 and called it a bubble top. As it turned out, I was within days of calling that top. Times then were too unpredictable to suggest a way to benefit from lumber decline, but not today.
Lumber
This is a monthly chart until the end of September, and the current lumber price has rallied a little to about US$500. With a recession and weak housing, I expect we will see a drop to $300 and possibly lower.
Lumber prices are back to pre-pandemic levels, but the lumber stocks are still at lofty levels and not priced in a weaker market. They are great short candidates now. U.S. housing starts in June were down to 1.6 million annualized units, their lowest level since September 2021. In July, U.S. housing starts fell further to 1.45 million annualized units but rebounded in August to 1.58 million. Weaker numbers are in store with a Fed-induced recession. I think the best two to short are West Fraser Timber (WFG:NYSE) and Boise Cascade (BCC:NYSE).
Both companies are focused a lot on the lumber market, with West Frazer affected more by Canada and the Canadian housing market than Boise.
The U.S. Commerce Department said Thursday it will decrease the duty rate for most Canadian lumber producers to 8.59%, compared with the current 17.91%.
The Commerce Department had made its intentions known in January to reduce tariffs, proposing a preliminary duty rate of 11.64%, and has now reduced that amount further with the final rate of 8.59%.
This has probably been accounted for in the recent rally in lumber prices.
West Fraser has grown beyond the company’s original base in British Columbia and today is one of the largest lumber and OSB manufacturers in the world.
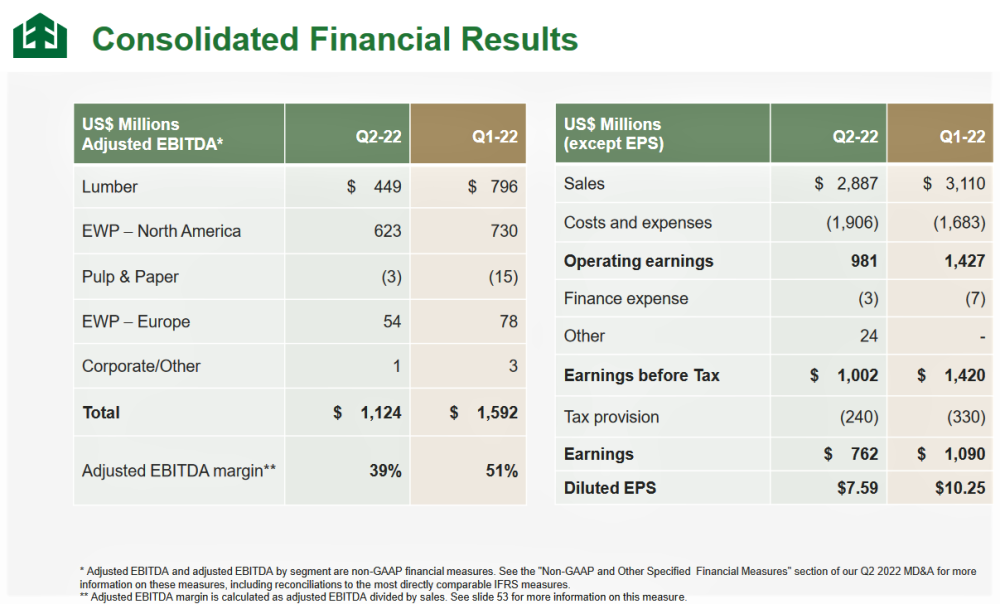
You can see from the slide above from West Frazer’s Q2 presentation that CA$ earnings are about 100% lumber and Engineered Wood Products (EWP), which are strands, fibers, veneers, or particle boards bound together with strong adhesive.
Currently, Boise looks like a very solid company.
There was a substantial earnings decline from Q1 to Q2, and lumber prices have seen a further decline in Q3.
West Frazer also shipped a lot more volume in Q2 over Q1, with lumber shipments up +17% as transportation constraints eased in Western Canada. OSB (board) shipments were also up 10%. This was shown on slide six of their presentation, with slide 16 below showing huge dependence on housing.
The Housing Market
It does not take a rocket scientist to know that a recession and rapidly rising interest rates will crush the housing markets. Credit Suisse says.
“Our lower estimates reflect our expectation of a sharp slowing of housing turnover and a reduction in home improvement spending in 2023 based on this lower turnover,” wrote analyst Dan Oppenheim in a note to clients Friday.
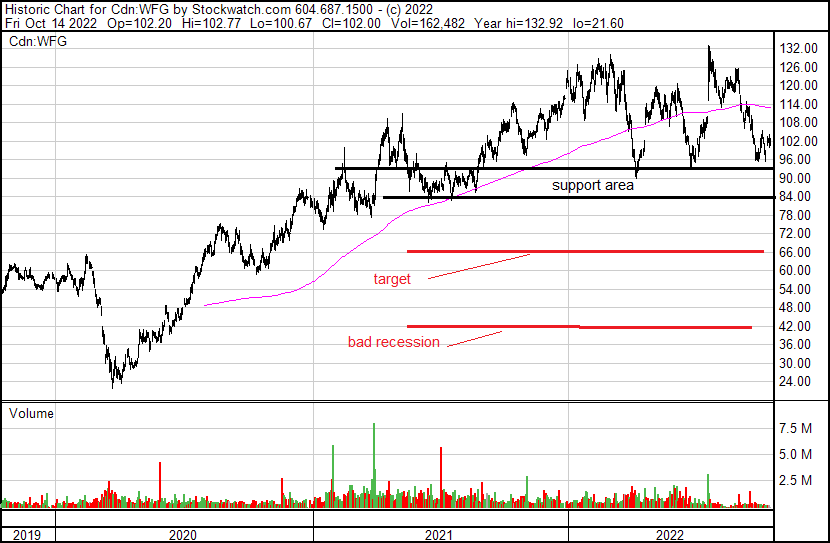
West Frazer stock ran up in price because of the housing boom and high lumber prices caused by Covid-19 policies. Lumber prices have come down, and the housing boom is ending as North America falls into a recession.
The stock ran up about 120% from around CA$60 in 2019 to the 2022 high of CA$132, and it is currently not reflecting lower lumber prices and a looming recession with a housing slowdown.
I expect the stock can easily drop to around $66 and, with a bad recession, could easily see prices back to around $40. I would sell the stock, short it, and/or buy Put Options.
I like the February 2023 $110 Put for about $14. There is little activity on these, but on the U.S. side, in February 2023, $70 Put around $5.00 has more trading, showing huge dependence on housing.
Boise Cascade’s recent price was $58.60.
Boise is totally focused on the U.S., and that is why I prefer West Frazer more of a short because of the Canadian market exposure.
Nevertheless, I expect Boise stock will take quite a haircut in a poor housing market driven by high-interest rates and a U.S. recession. Boise also has a big focus on residential real estate and home improvements.
What I am saying is the good times are over, so sales and profits have peaked and will soon decline.
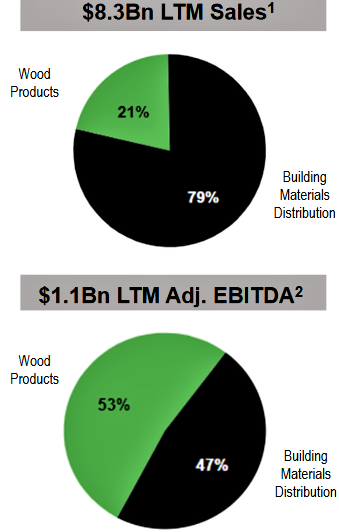
They are one of the largest U.S. wholesale building products distributors, with 38 warehouse centers and one truss plant.
This partial slide on the right from their presentation is interesting because it shows that 79% of sales were from their Building Materials distribution segment but only accounted for 49% of profits. It is a clear sign that high lumber prices have driven high profits in their Wood Products Division. As I mentioned above, lumber prices have dropped further in Q3.
Currently, Boise looks like a very solid company, as shown in the slide below from their presentation, and had strong sales and earnings growth since 2020. What I am saying is the good times are over, so sales and profits have peaked and will soon decline.
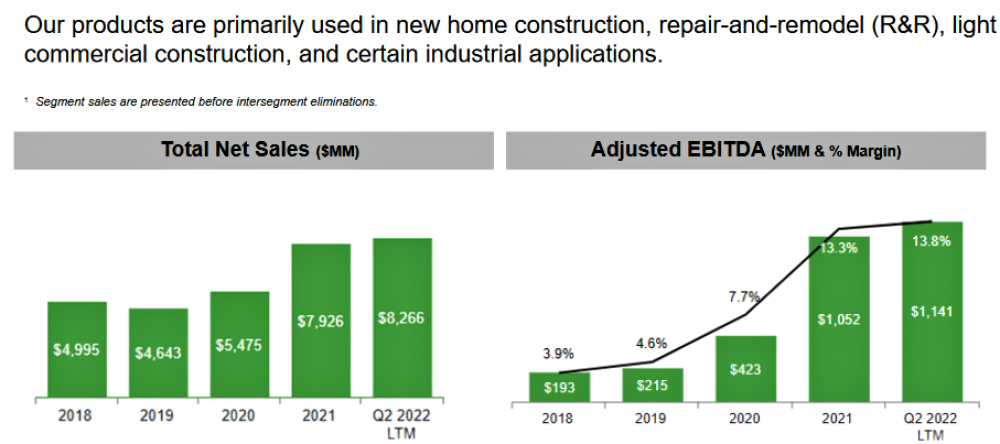
Boise gives this warning in their Q2 financials: “As a manufacturer of certain commodity products, we have sales and profitability exposure to declines in commodity product prices and rising input costs. Our distribution business purchases and resells a broad mix of commodity products with periods of increasing prices, providing the opportunity for higher sales and increased margins, while declining price environments expose us to declines in sales and profitability. We expect future commodity product pricing and commodity input costs to be volatile in response to economic uncertainties, industry operating rates, transportation constraints or disruptions, net import and export activity, inventory levels in various distribution channels, and seasonal demand patterns. EWP and general line products have historically experienced limited price volatility but are also subject to price erosion as economic activity slows. “
Boise has a very similar chart to West Frazer, just at a different price level. The percentage gain from 2019 and the potential percentage drop are around the same. For Put options, I like January 2023, $60 Put for around $6.00.
Struthers Stock Report Disclaimers:
All forecasts and recommendations are based on opinion. Markets change direction with consensus beliefs, which may change at any time and without notice. The author/publisher of this publication has taken every precaution to provide the most accurate information possible. The information & data were obtained from sources believed to be reliable, but because the information & data source are beyond the author’s control, no representation or guarantee is made that it is complete or accurate.
The reader accepts information on the condition that errors or omissions shall not be made the basis for any claim, demand or cause for action. Because of the ever-changing nature of information & statistics the author/publisher strongly encourages the reader to communicate directly with the company and/or with their personal investment adviser to obtain up to date information.
Past results are not necessarily indicative of future results. Any statements non-factual in nature constitute only current opinions, which are subject to change. The author/publisher may or may not have a position in the securities and/or options relating thereto, & may make purchases and/or sales of these securities relating thereto from time to time in the open market or otherwise. Neither the information, nor opinions expressed, shall be construed as a solicitation to buy or sell any stock, futures or options contract mentioned herein. The author/publisher of this letter is not a qualified financial adviser & is not acting as such in this publication.
Charts provided by author.
Disclosures:
1) Ron Struthers: I, or members of my immediate household or family, own shares of the following companies mentioned in this article: None. I personally am, or members of my immediate household or family are, paid by the following companies mentioned in this article: None. My company currently has a financial relationship with the following companies mentioned in this article: None. I determined which companies would be included in this article based on my research and understanding of the sector.
2) The following companies mentioned in this article are billboard sponsors of Streetwise Reports: None. Click here for important disclosures about sponsor fees. The information provided above is for informational purposes only and is not a recommendation to buy or sell any security.
3) Statements and opinions expressed are the opinions of the author and not of Streetwise Reports or its officers. The author is wholly responsible for the validity of the statements. The author was not paid by Streetwise Reports for this article. Streetwise Reports was not paid by the author to publish or syndicate this article. Streetwise Reports requires contributing authors to disclose any shareholdings in, or economic relationships with, companies that they write about. Streetwise Reports relies upon the authors to accurately provide this information and Streetwise Reports has no means of verifying its accuracy.
4) This article does not constitute investment advice. Each reader is encouraged to consult with his or her individual financial professional and any action a reader takes as a result of information presented here is his or her own responsibility. By opening this page, each reader accepts and agrees to Streetwise Reports’ terms of use and full legal disclaimer. This article is not a solicitation for investment. Streetwise Reports does not render general or specific investment advice and the information on Streetwise Reports should not be considered a recommendation to buy or sell any security. Streetwise Reports does not endorse or recommend the business, products, services, or securities of any company mentioned on Streetwise Reports.
5) From time to time, Streetwise Reports LLC and its directors, officers, employees, or members of their families, as well as persons interviewed for articles and interviews on the site, may have a long or short position in the securities mentioned. Directors, officers, employees, or members of their immediate families are prohibited from making purchases and/or sales of those securities in the open market or otherwise from the time of the decision to publish an article until three business days after the publication of the article. The foregoing prohibition does not apply to articles that in substance only restate previously published company releases.


