By InvestMacro
Here are the latest charts and statistics for the Commitment of Traders (COT) data published by the Commodities Futures Trading Commission (CFTC).
The latest COT data is updated through Tuesday September 9th and shows a quick view of how large traders (for-profit speculators and commercial entities) were positioned in the futures markets.
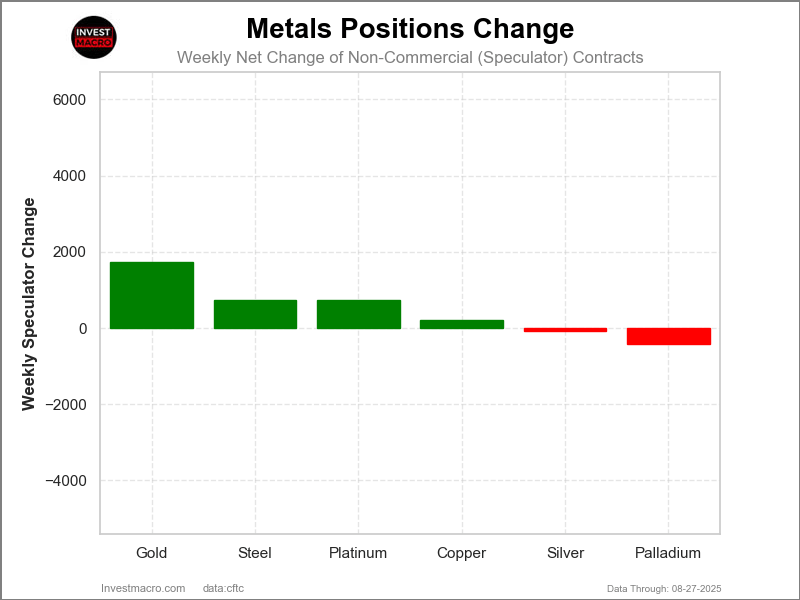
Weekly Speculator Changes led by Gold

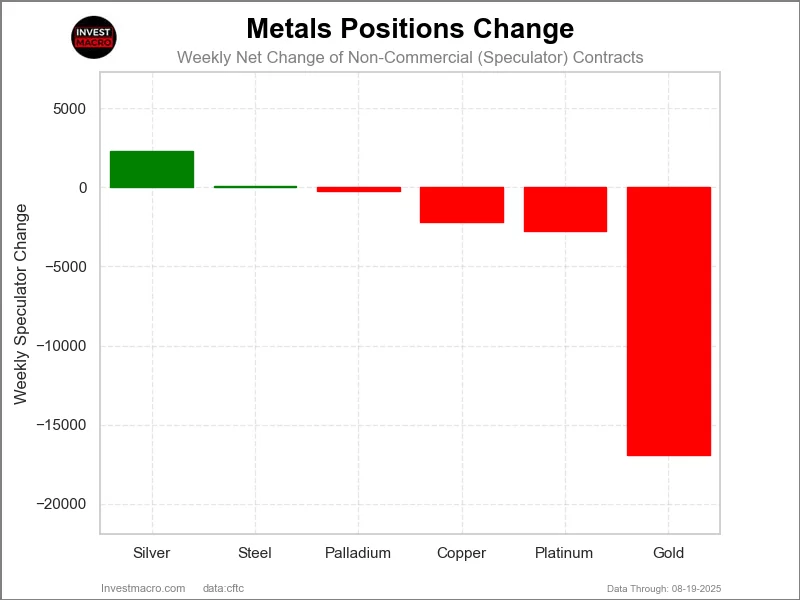
The COT metals markets speculator bets were mixed this week as three out of the six metals markets we cover had higher positioning while the other three markets had lower speculator contracts.
Leading the gains for the metals was Gold (12,210 contracts) with Copper (1,583 contracts) and Palladium (306 contracts) also showing positive weeks.
The markets with declines in speculator bets for the week were Platinum (-2,642 contracts), Silver (-1,986 contracts) and Steel (-383 contracts) also registering lower bets on the week.
Gold Bets rise to 29-Week High
Gold speculator bets were up for the third straight week this week and for the eighth time out of the last 11 weeks. Gold speculator bets have now risen by almost +50,000 contracts just in the last two weeks alone.
This boost in speculator bets has pushed the current speculator net position to a total of +261,740 net contracts. This marks the highest level in 29 weeks, dating back to February 18th of 2025. The gold speculator position has now been above the +200,000 contract level for 11 consecutive weeks.
Palladium Leads the Metals Price Performance
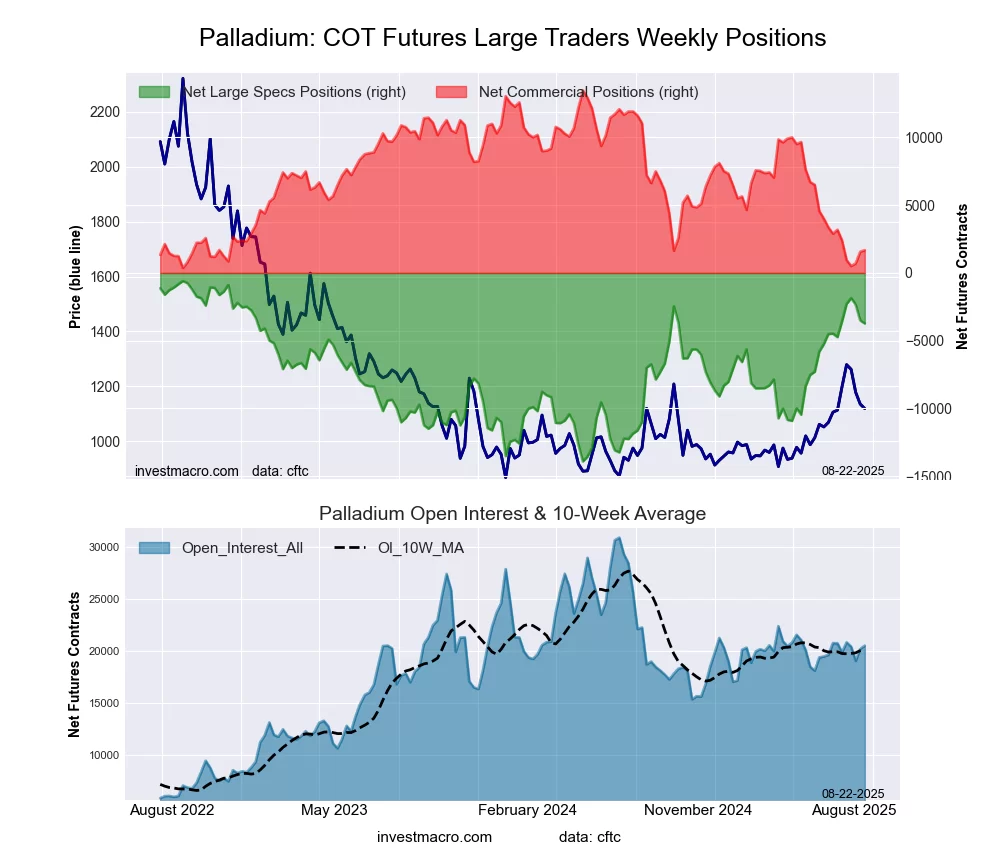
The metals market’s performance this week was led by Palladium, which jumped by over 9%. Palladium has now been up by roughly 25% over the past 90 days.
Silver was up by 3% this week, and has now been up by 15% over the past 30 days, while racing higher by almost 30% in the past 90 days.
Copper came in third with a 2.51% gain on the week. Copper is the only metal that has been down over the last 90 days, with a -2.05% decrease.
Platinum rose this week by 1.59%, and has been up by a significant 40.25% over the past 90 days. Gold rose by 1.34% this week, and has been up by roughly 9% in the past 90 days.
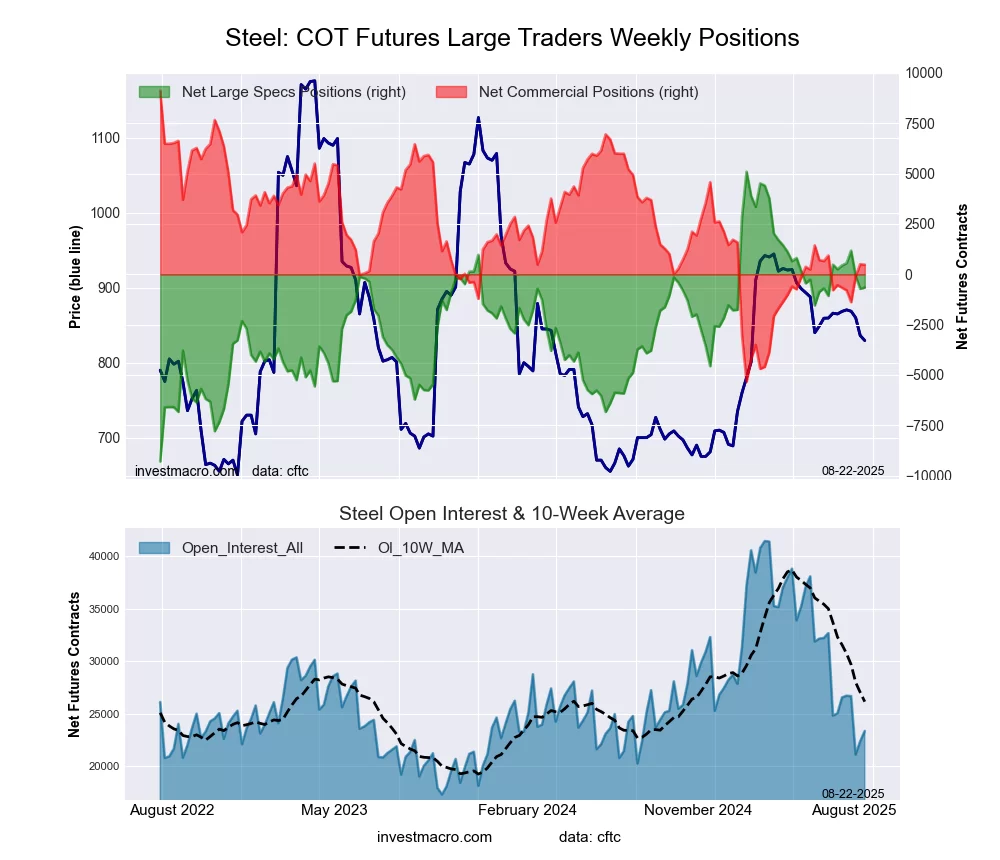
Steel was the only metal to see a weekly decline. Steel dropped by -4.65%, although Steel has been up by roughly 7% in the past 30 days, and has been higher by 19.53% over the last 90 days.
Metals Data:

Legend: Weekly Speculators Change | Speculators Current Net Position | Speculators Strength Score compared to last 3-Years (0-100 range)
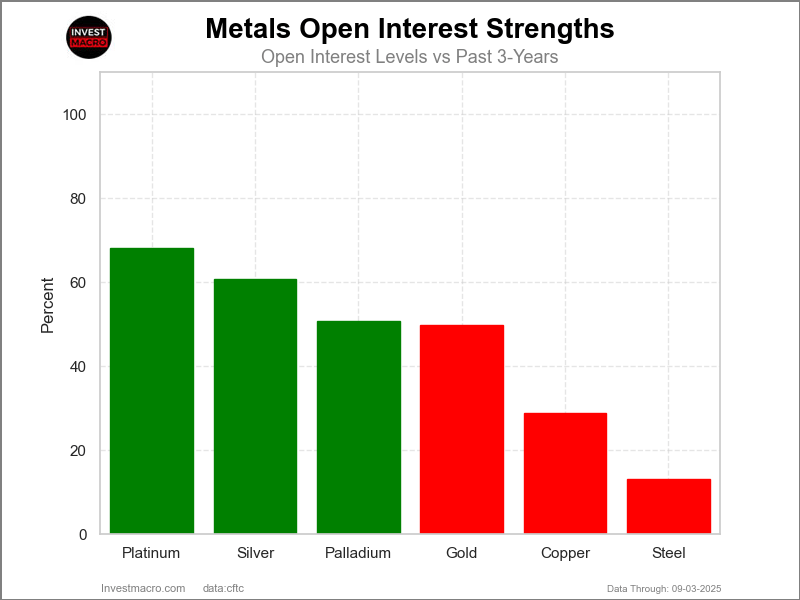
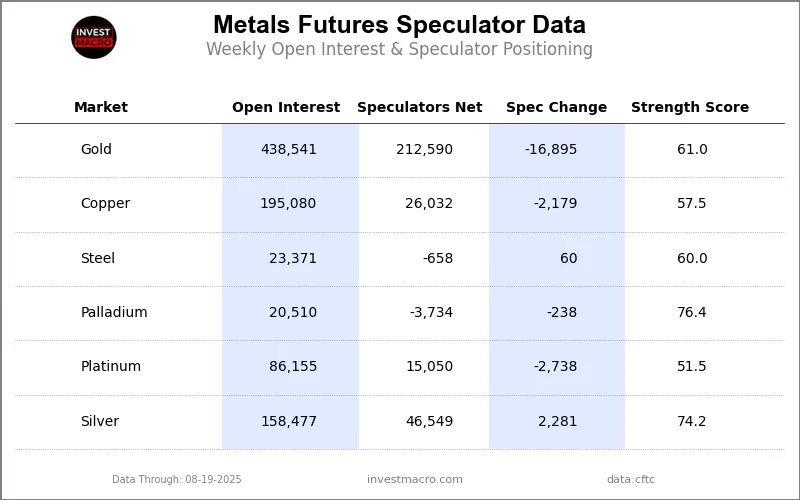
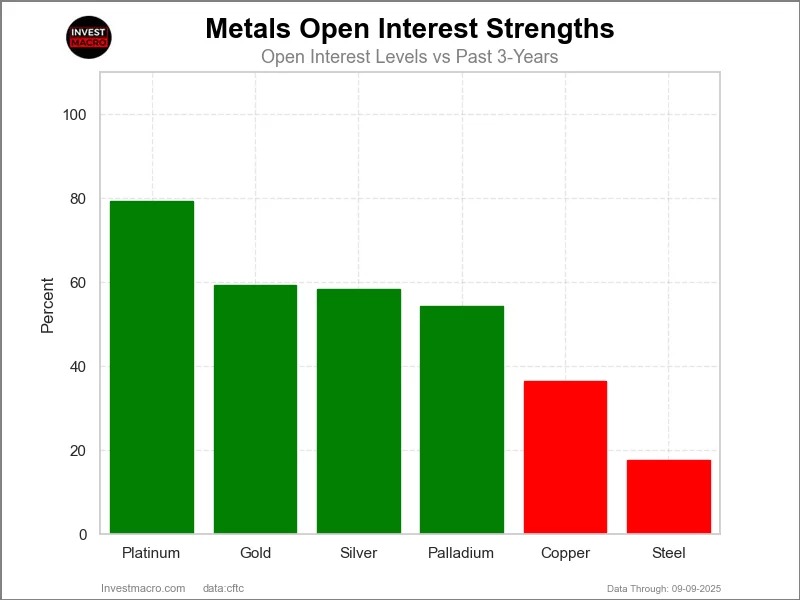
Strength Scores led by Silver & Gold

COT Strength Scores (a normalized measure of Speculator positions over a 3-Year range, from 0 to 100 where above 80 is Extreme-Bullish and below 20 is Extreme-Bearish) showed that Silver (82 percent) and Gold (80 percent) lead the metals markets this week. Palladium (76 percent) comes in as the next highest in the weekly strength scores.
On the downside, Platinum (47 percent) comes in at the lowest strength level currently.
Strength Statistics:
Gold (79.6 percent) vs Gold previous week (75.0 percent)
Silver (82.3 percent) vs Silver previous week (85.0 percent)
Copper (58.6 percent) vs Copper previous week (57.1 percent)
Platinum (46.9 percent) vs Platinum previous week (53.5 percent)
Palladium (76.4 percent) vs Palladium previous week (74.1 percent)
Steel (60.0 percent) vs Steel previous week (63.0 percent)
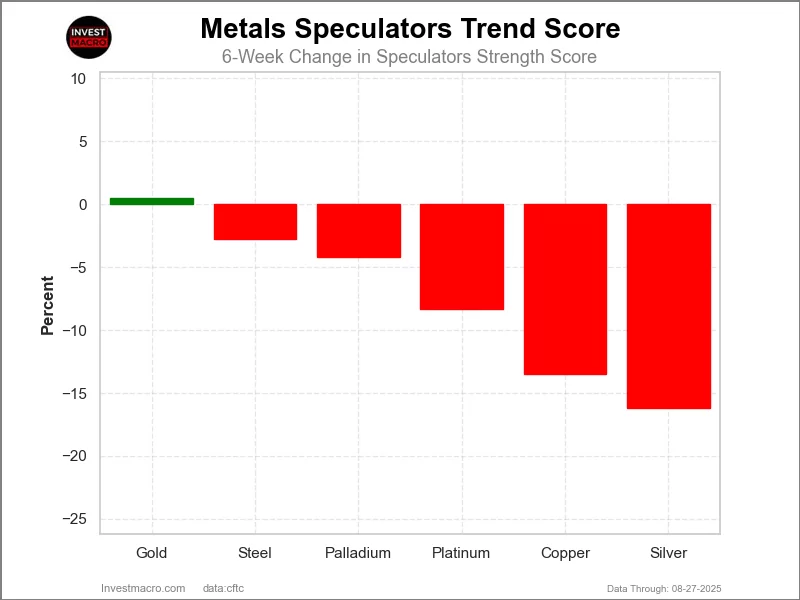
Gold & Silver top the 6-Week Strength Trends

COT Strength Score Trends (or move index, calculates the 6-week changes in strength scores) showed that Gold (14 percent) leads the past six weeks trends for metals.
Platinum (-16 percent) leads the downside trend scores currently with Palladium (-14 percent) as the next market with lower trend scores.
Move Statistics:
Gold (14.5 percent) vs Gold previous week (-1.3 percent)
Silver (-7.3 percent) vs Silver previous week (-6.3 percent)
Copper (-9.4 percent) vs Copper previous week (-13.2 percent)
Platinum (-15.6 percent) vs Platinum previous week (-9.2 percent)
Palladium (-14.2 percent) vs Palladium previous week (-13.1 percent)
Steel (-9.5 percent) vs Steel previous week (-1.7 percent)
Individual Markets:
Gold Comex Futures:
 The Gold Comex Futures large speculator standing this week equaled a net position of 261,740 contracts in the data reported through Tuesday. This was a weekly boost of 12,210 contracts from the previous week which had a total of 249,530 net contracts.
This week’s current strength score (the trader positioning range over the past three years, measured from 0 to 100) shows the speculators are currently Bullish with a score of 79.6 percent. The commercials are Bearish with a score of 23.9 percent and the small traders (not shown in chart) are Bearish-Extreme with a score of 12.2 percent.
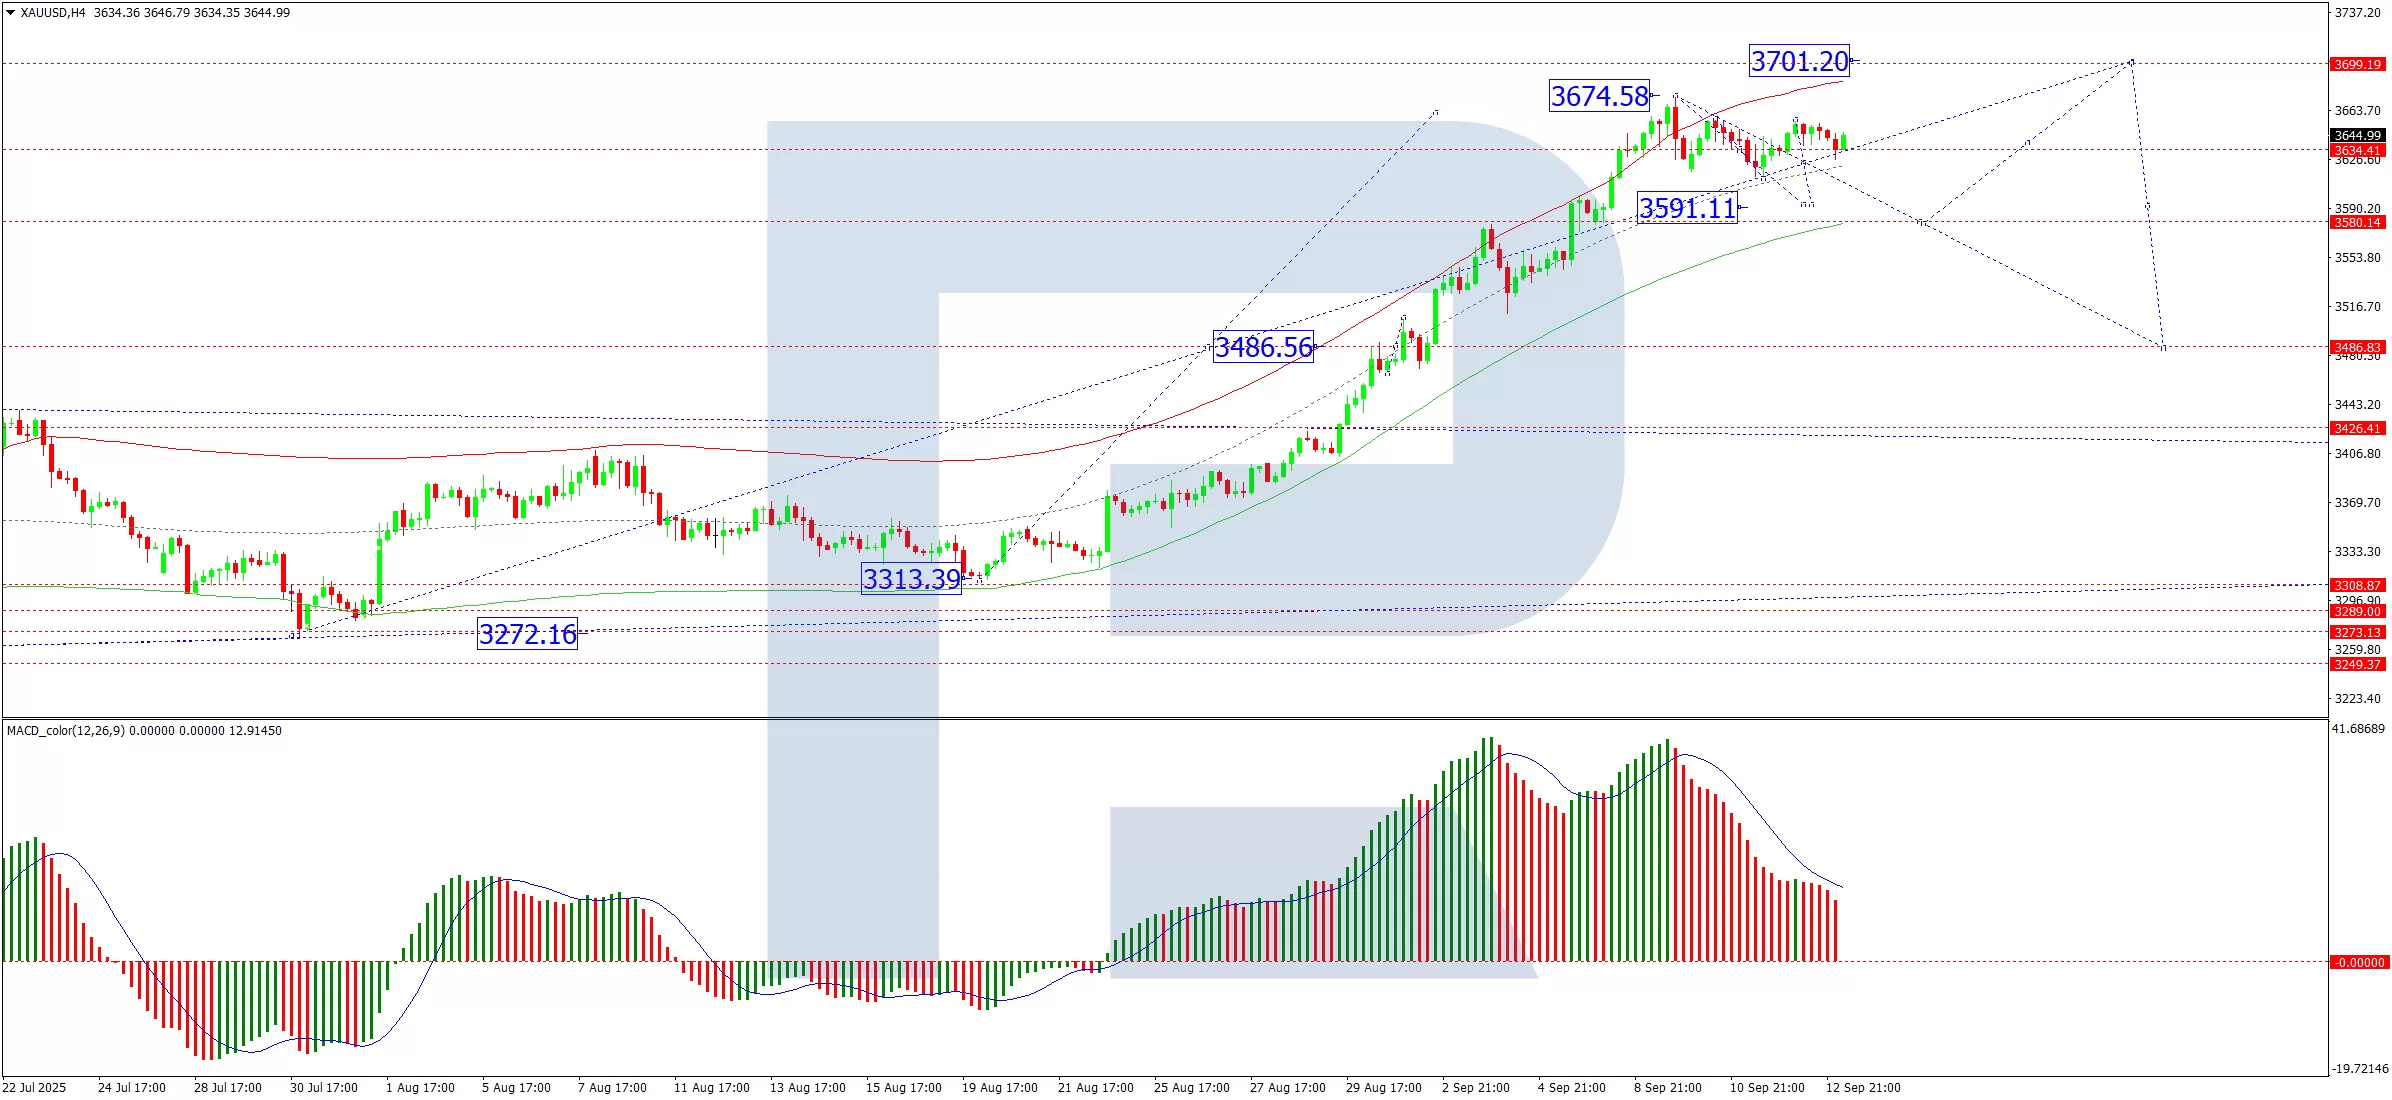
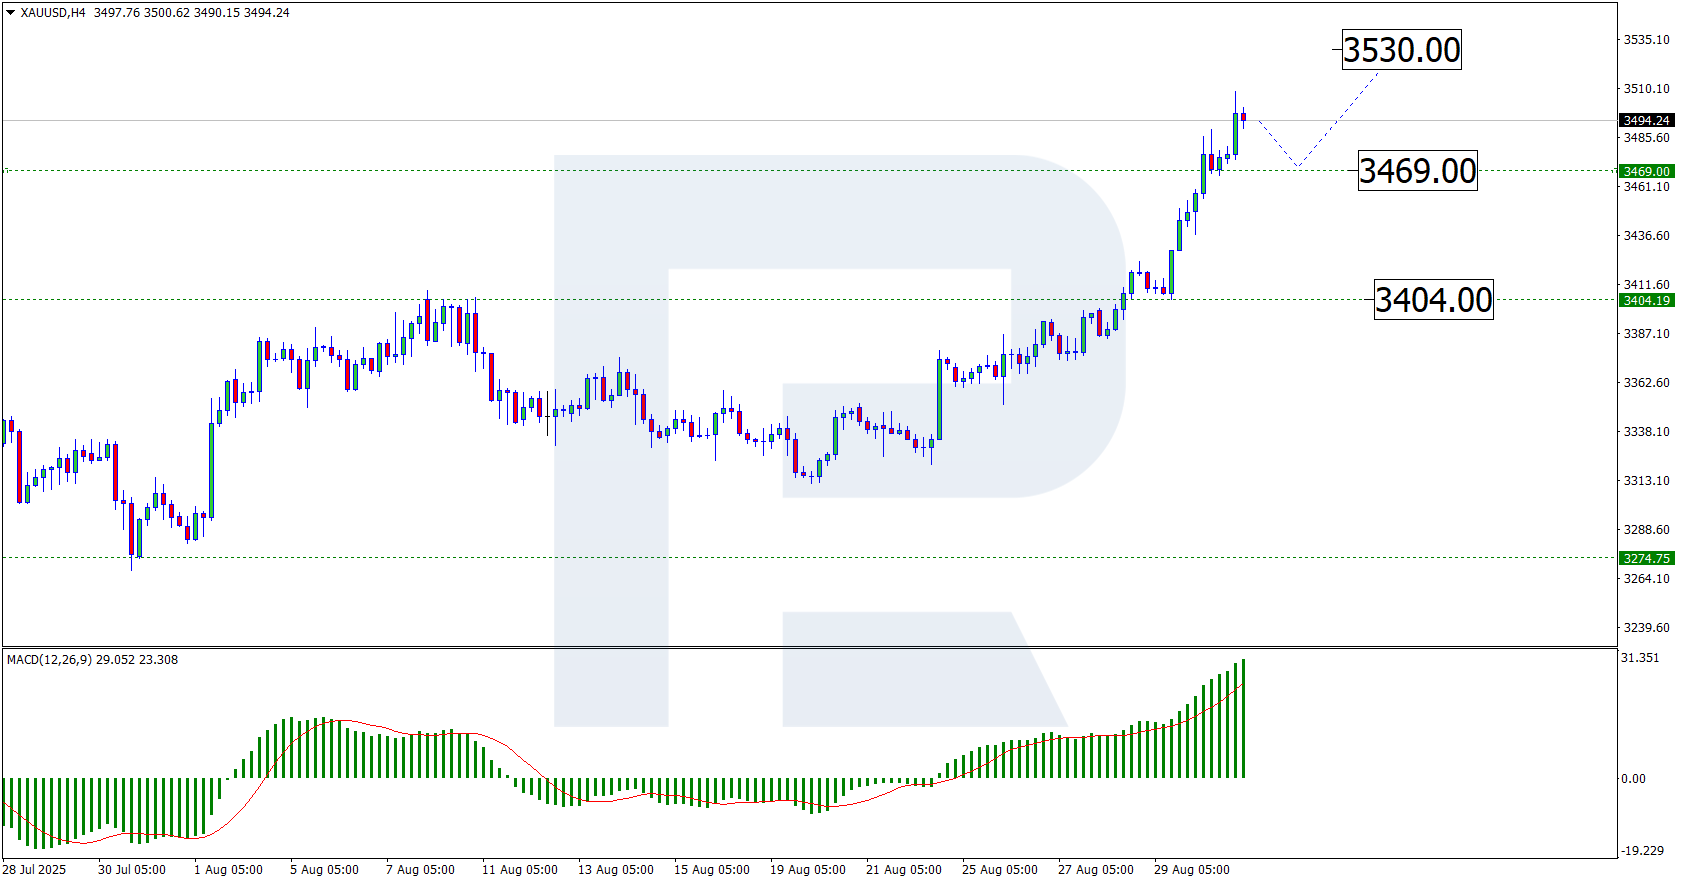
Price Trend-Following Model: Strong Uptrend
Our weekly trend-following model classifies the current market price position as: Strong Uptrend.
| Gold Futures Statistics | SPECULATORS | COMMERCIALS | SMALL TRADERS |
| – Percent of Open Interest Longs: | 63.7 | 14.5 | 11.6 |
| – Percent of Open Interest Shorts: | 12.4 | 68.1 | 9.3 |
| – Net Position: | 261,740 | -273,375 | 11,635 |
| – Gross Longs: | 324,875 | 73,850 | 58,990 |
| – Gross Shorts: | 63,135 | 347,225 | 47,355 |
| – Long to Short Ratio: | 5.1 to 1 | 0.2 to 1 | 1.2 to 1 |
| NET POSITION TREND: | | | |
| – Strength Index Score (3 Year Range Pct): | 79.6 | 23.9 | 12.2 |
| – Strength Index Reading (3 Year Range): | Bullish | Bearish | Bearish-Extreme |
| NET POSITION MOVEMENT INDEX: | | | |
| – 6-Week Change in Strength Index: | 14.5 | -5.2 | -80.7 |
Silver Comex Futures:
 The Silver Comex Futures large speculator standing this week equaled a net position of 53,937 contracts in the data reported through Tuesday. This was a weekly reduction of -1,986 contracts from the previous week which had a total of 55,923 net contracts.
This week’s current strength score (the trader positioning range over the past three years, measured from 0 to 100) shows the speculators are currently Bullish-Extreme with a score of 82.3 percent. The commercials are Bearish-Extreme with a score of 15.6 percent and the small traders (not shown in chart) are Bullish with a score of 64.9 percent.
Price Trend-Following Model: Strong Uptrend
Our weekly trend-following model classifies the current market price position as: Strong Uptrend.
| Silver Futures Statistics | SPECULATORS | COMMERCIALS | SMALL TRADERS |
| – Percent of Open Interest Longs: | 46.2 | 25.6 | 20.5 |
| – Percent of Open Interest Shorts: | 11.8 | 72.5 | 8.1 |
| – Net Position: | 53,937 | -73,402 | 19,465 |
| – Gross Longs: | 72,450 | 40,163 | 32,191 |
| – Gross Shorts: | 18,513 | 113,565 | 12,726 |
| – Long to Short Ratio: | 3.9 to 1 | 0.4 to 1 | 2.5 to 1 |
| NET POSITION TREND: | | | |
| – Strength Index Score (3 Year Range Pct): | 82.3 | 15.6 | 64.9 |
| – Strength Index Reading (3 Year Range): | Bullish-Extreme | Bearish-Extreme | Bullish |
| NET POSITION MOVEMENT INDEX: | | | |
| – 6-Week Change in Strength Index: | -7.3 | 6.9 | -0.3 |
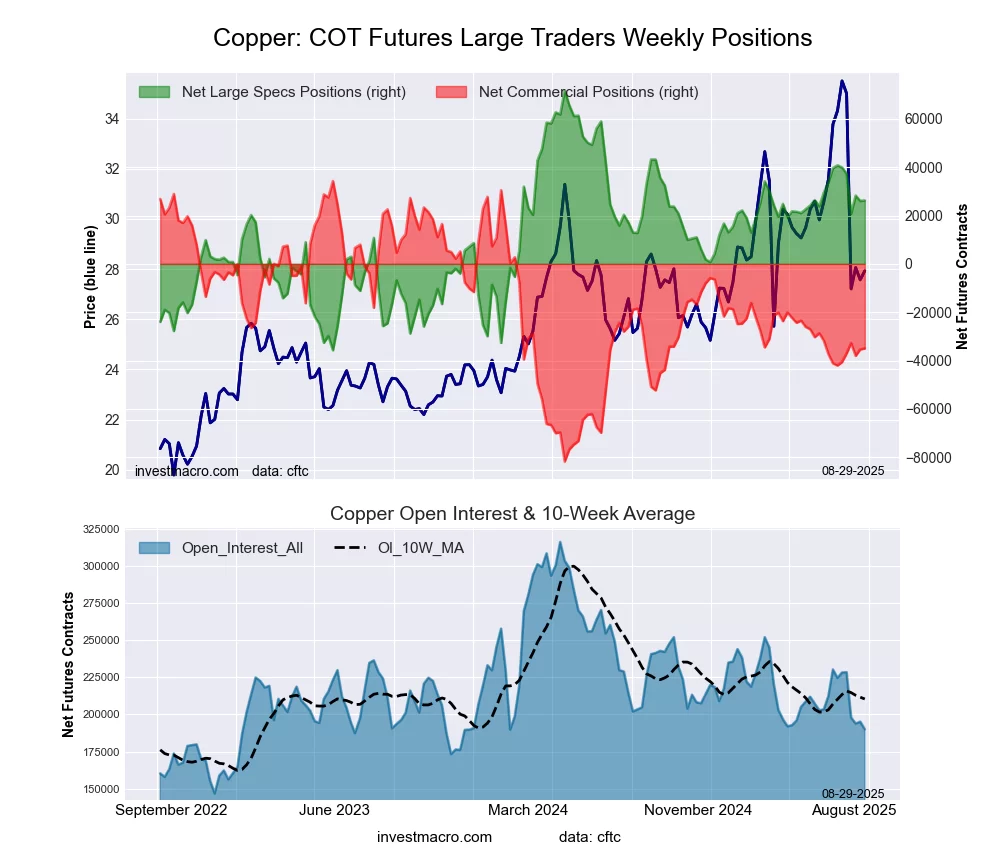
Copper Grade #1 Futures:
 The Copper Grade #1 Futures large speculator standing this week equaled a net position of 27,241 contracts in the data reported through Tuesday. This was a weekly lift of 1,583 contracts from the previous week which had a total of 25,658 net contracts.
This week’s current strength score (the trader positioning range over the past three years, measured from 0 to 100) shows the speculators are currently Bullish with a score of 58.6 percent. The commercials are Bearish with a score of 39.4 percent and the small traders (not shown in chart) are Bullish with a score of 70.9 percent.
Price Trend-Following Model: Strong Downtrend
Our weekly trend-following model classifies the current market price position as: Strong Downtrend.
| Copper Futures Statistics | SPECULATORS | COMMERCIALS | SMALL TRADERS |
| – Percent of Open Interest Longs: | 30.9 | 31.2 | 8.2 |
| – Percent of Open Interest Shorts: | 17.8 | 48.5 | 4.0 |
| – Net Position: | 27,241 | -36,015 | 8,774 |
| – Gross Longs: | 64,293 | 65,052 | 17,170 |
| – Gross Shorts: | 37,052 | 101,067 | 8,396 |
| – Long to Short Ratio: | 1.7 to 1 | 0.6 to 1 | 2.0 to 1 |
| NET POSITION TREND: | | | |
| – Strength Index Score (3 Year Range Pct): | 58.6 | 39.4 | 70.9 |
| – Strength Index Reading (3 Year Range): | Bullish | Bearish | Bullish |
| NET POSITION MOVEMENT INDEX: | | | |
| – 6-Week Change in Strength Index: | -9.4 | 0.9 | 54.8 |
Platinum Futures:
 The Platinum Futures large speculator standing this week equaled a net position of 14,356 contracts in the data reported through Tuesday. This was a weekly decrease of -2,642 contracts from the previous week which had a total of 16,998 net contracts.
This week’s current strength score (the trader positioning range over the past three years, measured from 0 to 100) shows the speculators are currently Bearish with a score of 46.9 percent. The commercials are Bullish with a score of 54.3 percent and the small traders (not shown in chart) are Bullish with a score of 66.0 percent.
Price Trend-Following Model: Uptrend
Our weekly trend-following model classifies the current market price position as: Uptrend.
| Platinum Futures Statistics | SPECULATORS | COMMERCIALS | SMALL TRADERS |
| – Percent of Open Interest Longs: | 56.0 | 21.6 | 11.3 |
| – Percent of Open Interest Shorts: | 40.8 | 43.0 | 5.1 |
| – Net Position: | 14,356 | -20,210 | 5,854 |
| – Gross Longs: | 53,057 | 20,511 | 10,723 |
| – Gross Shorts: | 38,701 | 40,721 | 4,869 |
| – Long to Short Ratio: | 1.4 to 1 | 0.5 to 1 | 2.2 to 1 |
| NET POSITION TREND: | | | |
| – Strength Index Score (3 Year Range Pct): | 46.9 | 54.3 | 66.0 |
| – Strength Index Reading (3 Year Range): | Bearish | Bullish | Bullish |
| NET POSITION MOVEMENT INDEX: | | | |
| – 6-Week Change in Strength Index: | -15.6 | 12.3 | 16.1 |
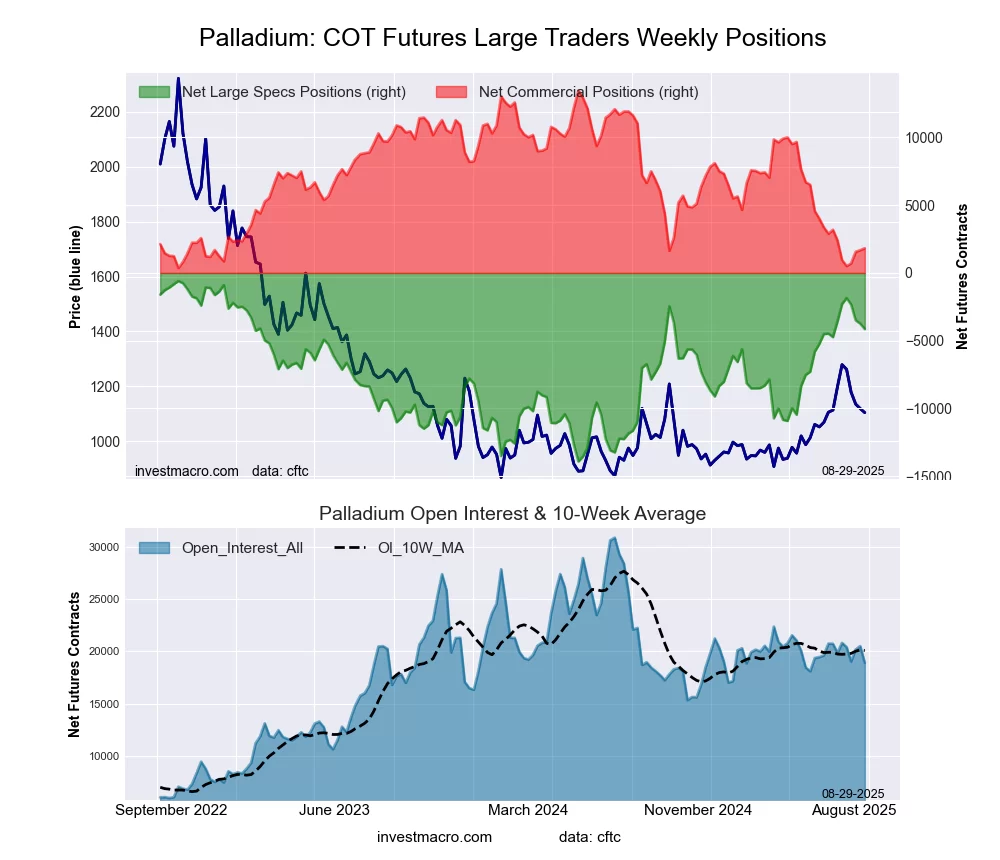
Palladium Futures:
 The Palladium Futures large speculator standing this week equaled a net position of -3,742 contracts in the data reported through Tuesday. This was a weekly lift of 306 contracts from the previous week which had a total of -4,048 net contracts.
This week’s current strength score (the trader positioning range over the past three years, measured from 0 to 100) shows the speculators are currently Bullish with a score of 76.4 percent. The commercials are Bearish-Extreme with a score of 12.2 percent and the small traders (not shown in chart) are Bullish-Extreme with a score of 81.5 percent.
Price Trend-Following Model: Strong Uptrend
Our weekly trend-following model classifies the current market price position as: Strong Uptrend.
| Palladium Futures Statistics | SPECULATORS | COMMERCIALS | SMALL TRADERS |
| – Percent of Open Interest Longs: | 43.4 | 36.5 | 15.0 |
| – Percent of Open Interest Shorts: | 62.6 | 26.4 | 5.9 |
| – Net Position: | -3,742 | 1,963 | 1,779 |
| – Gross Longs: | 8,453 | 7,113 | 2,931 |
| – Gross Shorts: | 12,195 | 5,150 | 1,152 |
| – Long to Short Ratio: | 0.7 to 1 | 1.4 to 1 | 2.5 to 1 |
| NET POSITION TREND: | | | |
| – Strength Index Score (3 Year Range Pct): | 76.4 | 12.2 | 81.5 |
| – Strength Index Reading (3 Year Range): | Bullish | Bearish-Extreme | Bullish-Extreme |
| NET POSITION MOVEMENT INDEX: | | | |
| – 6-Week Change in Strength Index: | -14.2 | 11.1 | 14.9 |
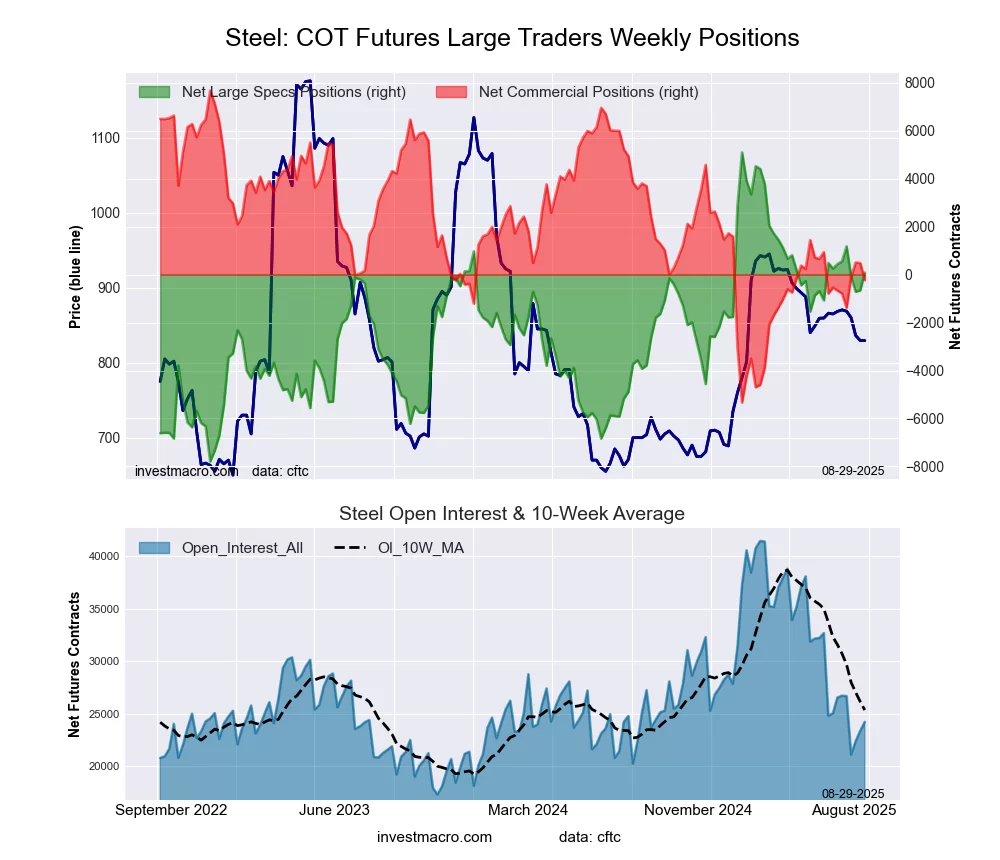
Steel Futures Futures:
 The Steel Futures large speculator standing this week equaled a net position of -56 contracts in the data reported through Tuesday. This was a weekly decrease of -383 contracts from the previous week which had a total of 327 net contracts.
This week’s current strength score (the trader positioning range over the past three years, measured from 0 to 100) shows the speculators are currently Bullish with a score of 60.0 percent. The commercials are Bearish with a score of 40.2 percent and the small traders (not shown in chart) are Bullish with a score of 56.9 percent.
Price Trend-Following Model: Strong Downtrend
Our weekly trend-following model classifies the current market price position as: Strong Downtrend.
| Steel Futures Statistics | SPECULATORS | COMMERCIALS | SMALL TRADERS |
| – Percent of Open Interest Longs: | 20.6 | 74.4 | 2.2 |
| – Percent of Open Interest Shorts: | 20.9 | 74.9 | 1.5 |
| – Net Position: | -56 | -107 | 163 |
| – Gross Longs: | 4,453 | 16,054 | 477 |
| – Gross Shorts: | 4,509 | 16,161 | 314 |
| – Long to Short Ratio: | 1.0 to 1 | 1.0 to 1 | 1.5 to 1 |
| NET POSITION TREND: | | | |
| – Strength Index Score (3 Year Range Pct): | 60.0 | 40.2 | 56.9 |
| – Strength Index Reading (3 Year Range): | Bullish | Bearish | Bullish |
| NET POSITION MOVEMENT INDEX: | | | |
| – 6-Week Change in Strength Index: | -9.5 | 9.8 | -5.5 |
Article By InvestMacro – Receive our weekly COT Newsletter
*COT Report: The COT data, released weekly to the public each Friday, is updated through the most recent Tuesday (data is 3 days old) and shows a quick view of how large speculators or non-commercials (for-profit traders) were positioned in the futures markets.
The CFTC categorizes trader positions according to commercial hedgers (traders who use futures contracts for hedging as part of the business), non-commercials (large traders who speculate to realize trading profits) and nonreportable traders (usually small traders/speculators) as well as their open interest (contracts open in the market at time of reporting). See CFTC criteria here.