Archive for Metals – Page 3

Why Is This the Perfect Silver Trade To Invest In?

Source: Michael Ballanger (1/7/26) 

Michael Ballanger of GGM Advisory Inc. explains why he thinks Silver North Resources Ltd. (SNAG:TSX.V; TARSF:OTCQB) might be the perfect silver trade to invest in.

Subscribers purchased Silver North Resources Ltd. (SNAG:TSX.V; TARSF:OTCQB) by way of two private placements in 2025 at prices of CA$0.10 and CA$0.15 per share. This is a junior silver explorer with projects in Canada’s Yukon Territories, with one being proximitous to the legendary Keno Hill Silver District where historical mining operations yielded over 200 million ounces of silver.

The two main projects are the Haldane Project, located 25 km. west of the main Keno Hill silver deposits and Tim Project, located 72 km west of Watson Lake, Yukon, and 19 km northeast of Coeur Mining’s Silvertip deposit.

Coeur Mining Inc. (CDE:NYSE) is funding exploration under an option agreement to earn a 51% interest in Tim from Silver North by completing $3.55 million in exploration over 5 years and making staged cash payments totalling $575,000. Coeur can increase its interest to 80% by funding a positive feasibility study at Tim by the eighth anniversary of the agreement.

To date, Coeur has funded approximately $1.6 million in exploration, which has included SkyTEM, magnetics, radiometrics, and mobile MT geophysical surveys, property-wide geochemical sampling and mapping, re-examination of historical trenches, and drilling. Coeur is the project operator, applying the expertise of its geological team at Silvertip to the Tim exploration.

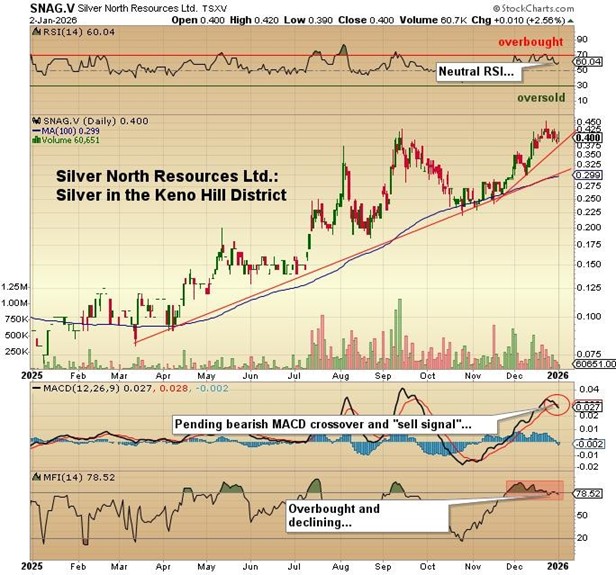
In November, the company reported the following from the Haldane Property: Silver North Intersects 13.15 meters Averaging 818 g/t Silver and 1.39 g/t Gold From 249.9 m Depth at the Haldane Silver Property, Keno District, Yukon. Elevated gold values really got my attention, as well as the rest of the market, as the stock moved sharply higher in combination with robust silver prices.

I like almost everything about this name, including a crackerjack management group and a great land package in the vicinity of one of the truly legendary silver camps: Keno Hill.

Of course, I am biased as I was one of those lucky souls who owned shares in the mighty United Keno Hill Silver Mines in the 1970s as it soared from $0.60 to $60 in less than a year. The only possible negative is seasonality, as it is not so much the sub-zero temperatures that force companies to shut down in the Canadian winter, but the lack of sunlight, which creates safety issues.

Nonetheless, as a proxy for the silver trade, it is a perfect place to invest, and at a US$22m market cap, it is worthy of a target price in the US$100m range driven by further exploration and development at Haldane and Tim. No one knows for sure where silver prices will top out, but if the raving bulls are correct, this could be another United Keno HillAccordingly, an initial target price of CA$1.00 per share is where I will reassess.


Important Disclosures:

  1. Silver North Resources. is a billboard sponsor of Streetwise Reports and pays SWR a monthly sponsorship fee between US$3,000 and US$6,000.
  2. As of the date of this article, officers, contractors, shareholders, and/or employees of Streetwise Reports LLC (including members of their household) own securities of Silver North Resources.
  3. Michael Ballanger: I, or members of my immediate household or family, own securities of: Silver North Resources. My company has a financial relationship with: None. My company has purchased stocks mentioned in this article for my management clients: None. I determined which companies would be included in this article based on my research and understanding of the sector.
  4. Statements and opinions expressed are the opinions of the author and not of Streetwise Reports, Street Smart, or their officers. The author is wholly responsible for the accuracy of the statements. Streetwise Reports was not paid by the author to publish or syndicate this article. Streetwise Reports requires contributing authors to disclose any shareholdings in, or economic relationships with, companies that they write about. Any disclosures from the author can be found  below. Streetwise Reports relies upon the authors to accurately provide this information and Streetwise Reports has no means of verifying its accuracy.
  5. This article does not constitute investment advice and is not a solicitation for any investment. Streetwise Reports does not render general or specific investment advice and the information on Streetwise Reports should not be considered a recommendation to buy or sell any security. Each reader is encouraged to consult with his or her personal financial adviser and perform their own comprehensive investment research. By opening this page, each reader accepts and agrees to Streetwise Reports’ terms of use and full legal disclaimer. Streetwise Reports does not endorse or recommend the business, products, services or securities of any company.

For additional disclosures, please click here.

Michael Ballanger Disclosures

This letter makes no guarantee or warranty on the accuracy or completeness of the data provided. Nothing contained herein is intended or shall be deemed to be investment advice, implied or otherwise. This letter represents my views and replicates trades that I am making but nothing more than that. Always consult your registered advisor to assist you with your investments. I accept no liability for any loss arising from the use of the data contained on this letter. Options and junior mining stocks contain a high level of risk that may result in the loss of part or all invested capital and therefore are suitable for experienced and professional investors and traders only. One should be familiar with the risks involved in junior mining and options trading and we recommend consulting a financial adviser if you feel you do not understand the risks involved.

Gold surges as Trump invades Venezuela

By ForexTime 

  • Gold ↑ 2% on mounting geopolitical tensions
  • US invades Venezuela and captures it’s president
  • Ongoing Ukraine talks and US data could add to gold volatility
  • Gold forecasted to move ↑ 0.8% or ↓ 1.2% post NFP
  • Technical levels – $4400, $4500 and ATH at $4550

Markets head into the first full trading week of the year with a bang.

Over the weekend, the US carried out large-scale strikes against Venezuela, capturing its president and flying him out of the country.

President Nicolás Maduro will stand trial on criminal charges in the United States.

This heightened geopolitical risk could spark a wave of risk aversion, prompting investors to seek safe-haven destinations.

In the equity space the reaction has been muted so far, but oil prices could see volatility considering how Trump stated that the US plans to take over Venezuela’s oil.

One of the biggest movers so far has been gold, which gapped higher from Friday’s close as investors reacted to the weekend turmoil.

Prices are currently up over 2%.

A graph of candlesticks and numbers  AI-generated content may be incorrect.

Interestingly, gold fell as much as 6% last week, dipping below $4300 before staging this strong rebound.

A wave of profit-taking triggered the selloff after hitting fresh all-time highs ($4549.92) and a stabilizing dollar.

WHAT COULD MOVE XAUUSD THIS WEEK?

Geopolitics and key US data may shape the outlook for the precious metal.

Beyond the developments in Venezuela, the ongoing Ukraine peace talks will be in focus.

According to Ukrainian President Volodymyr Zelensky, the peace agreement to end the war with Russia is “90% ready”.

However, recent drone strikes in Russia have rekindled tensions between the two nations despite diplomats expressing optimism over peace talks.

On the data front, it’s all about the US NFP report on Friday.

Friday 9th January

US December NFP report – (13:30 PM GMT)

XAUUSD is forecasted to move 0.8% up or 1.2% down in a 6-hour window after the US initial jobless claims.

Note: Traders are pricing in a 51% probability that the Fed cuts rates by March 2026.

A screen shot of a computer  AI-generated content may be incorrect.


POTENTIAL SCENARIOS:

BULLISH – A solid daily close above $4400 may trigger an incline toward $4500 and $4541.79 the upper bound of Bloomberg FX model.

BEARISH – Weakness below $4400 could see prices decline toward $4320 and $4269.41 the lower bound of Bloomberg’s FX model.

A graph with numbers and lines  AI-generated content may be incorrect.

A screen shot of a graph  AI-generated content may be incorrect.


Forex-Time-LogoArticle by ForexTime


ForexTime Ltd (FXTM) is an award winning international online forex broker regulated by CySEC 185/12 www.forextime.com

XAG/USD: After Hitting Fresh Highs, Silver Tumbles Over 15%

By RoboForex Analytical Department 

Silver posted its strongest weekly gain since 1998, surging 18%, driven by the “China factor”—specifically, Beijing’s announcement of mandatory export licensing effective from 2026. This echoes the 1979 silver squeeze, when inflation soared and the Hunt brothers attempted to corner the market.

An ounce of silver now costs more than a barrel of oil, and daily trading volume in the SLV ETF reached USD 9.6 billion, a frenzy not seen since the peaks of 2011 and 2021. Octavio Costa of Crescat Capital even interprets this rally as a sign of hidden hyperinflation, largely overlooked by mainstream financial media.

The shift in sentiment has been extraordinary: silver has outperformed the British pound in market capitalisation terms and has soared 300% since October 2022, outpacing even high-flying AI stocks—a potent signal of speculative excess. However, the precious metals complex sold off sharply in the latter part of the session, with silver reaching a new daily low despite holding gains during Asian hours. The move appeared driven by forced short covering, a phenomenon often seen near market tops.

Underlying the volatility, silver inventories remain critically low, posing a potential supply threat to several key industries that rely on the metal in manufacturing.

Technical Analysis: XAG/USD

H4 Chart:

On the H4 chart, XAG/USD completed an impulsive wave up to 83.70 USD. The market is now developing a corrective decline toward 66.80 USD. Upon reaching this level, a subsequent upward wave toward 75.30 USD may materialise.

The MACD indicator supports the near-term bearish view, as its signal line—positioned above zero but having diverged from the histogram—suggests further downside momentum.

H1 Chart:

On the H1 chart, silver completed a downward impulse to 74.85 USD, followed by a correction to 80.60 USD. The market is currently forming another bearish impulse targeting 69.90 USD. A corrective bounce toward 75.30 USD is expected afterward, potentially setting the stage for another leg lower toward 66.80 USD.

The Stochastic oscillator aligns with this outlook, with its signal line above 80 but turning decisively downward.

Conclusion

Silver’s parabolic rise and subsequent sharp correction highlight extreme volatility and speculative positioning. While long-term fundamentals—including structural supply deficits and industrial demand—remain supportive, the near-term technical picture points to further downside toward 66.80–69.90 USD. The current pullback may offer a healthier foundation before the next sustained rally, but traders should monitor inventory data and Chinese policy signals closely. Expect elevated volatility to persist as the market digests recent extremes.


Disclaimer:

Any forecasts contained herein are based on the author’s particular opinion. This analysis may not be treated as trading advice. RoboForex bears no responsibility for trading results based on trading recommendations and reviews contained herein.

Humbling Hubris

Source: Michael Ballanger (12/16/25)

Michael Ballanger of GGM Advisory Inc. shares some words of wisdom and his 2026 outlook.

Originating in Greek mythology as a challenge to divine order, the term “hubris” remains a significant theme in literature and life, representing a dangerous belief in one’s own invincibility or superiority. Strictly defined, it is “excessive pride, arrogance, or overconfidence that leads to a person’s downfall, often by causing them to overstep limits, defy gods, or ignore warnings.

Mark Twain had a different definition that we as humans know all too well. Twain once wrote, “It ain’t what you don’t know that gits ya into trouble. It’s what you know for sure that ain’t exactly so.”

I had a teacher who reminded me at a very young age that making blind assumptions without checking one’s facts is a recipe for disaster and, worse still, embarrassment. “You know what you do when you ‘ASSUME’ something? You make an “ASS” of “U” and “ME.”

In the practice of writing newsletters, one tends to get elevated to the undeserved role of “authority,” as in, “he/she is an authority on gold and silver.” Sometimes, authors of financial newsletters are assigned designations like “guru” or “pundit” or “expert” but the reality of this pastime (as opposed to profession) is that most of us are simply common folks that for some unworldly reason have the intestinal fortitude and rhinoceros-like skin to put their opinions, expert or not, out there in full view for all the world to judge and rejoice or judge and condemn. The rejoicing comes after a particularly good guess (as opposed to calculation) at the future direction and amplitude of a particular stock or commodity. The condemnation occurs when one’s stab at the future direction and amplitude of a particular stock or commodity winds up in the trash bin. Reward or punishment for well-executed speculations is either more or fewer followers, and depending on whether one is paid as a “content provider” or under the subscriber model, loss or gain of people that grew accustomed to one’s accurate (or inaccurate) guesses.

As a young boy, I used to sell papers in the wee hours of weekend mornings at Woodbine Racetrack in northwest Toronto where the industry professionals such as trainers and grooms and jockeys would all arrive as the sun was rising and pay a dime for the “Daily Racing Form” which had all the races and the horses listed along with a list of their last three heats on either the turf (grass) or mud (dirt). One section of the paper featured the section where the handicappers wrote a column with their “touts” for the day’s races, which is where the term “tout sheet” was first derived. There was “Peter’s Picks,” “The Trackman,” and “The OddsMaker” all picking winners, placers, and showers for the expressed benefit of the amateur handicapper or weekend gambler who would lay down their minimum $2 bets with absolute certainty after reading through the hieroglyphics contained in the form.

One day, I decided to keep track of all the picks made by the “expert” race appraisers, so for the next few months of the summer, I wrote down the names of all the horses and where they finished each race. At the same time, I would pick three horses to win, place, and show in the same races, all based on their “colours” which were bay, chestnut, black, brown, or gray. At the end of the season, I tallied up all the results, and to no one’s particular surprise (except mine), a 12-year-old boy picking horses based on the colour of their coats outperformed the “experts” all equipped with 30-odd years of bookmaking and handicapping under their belts.

That is eerily similar to the late 1970s when newsletter guru and former E.F. Hutton Senior Technical Analyst Joe Granville would ask chimpanzees (dressed up as Wall Street bankers) to throw darts at the stock pages of the Wall Street Journal and then compare their track records to those of the “bank trust officers” that are today’s “market strategists.

The results were all the same. Sometimes the monkeys would be on top of the pack (usually in down markets), and sometimes they would be in the middle of the pack, but rarely did they trail the pack, once again proving that “A Random Walk down Wall Street” author Burton G. Malkiel was more than just a theorist but more of a statistician.

Over the years, I have found that investment success was more common in areas in which I was familiar, such as the junior mining space. I think the reason that my career evolved around commodities and mining was my fascination with those horses at Woodbine. You could look at two dozen horses under two dozen different jockeys, and only in the manner in which both horse and rider displayed a certain “swagger” could one recognize the importance of “presence” in the sport of kings. In a similar manner, CEO’s of successful mining and or exploration companies would emit a similar “swagger” when they entered a boardroom.

The firmness of a handshake or the directness of focus when being introduced seemed to accompany the great ones. However, at the end of the day, even the great ones (like Friedland, Beattie, or Netolitzky) would be the first to admit that really great geologists need an ample serving of good fortune in order to amass enviable track records. Luck does play a big part in any discovery because even the most sophisticated technology in geophysics or geochemistry cannot prevent Mother Nature and Lady Luck from playing a cruel trick with ruthless regularity and tempestuous timing.

Technical analysts would have us believe that all those squiggly lines on a graph are infinitely more predictive than the soggy leaves at the bottom of a teacup or a wishbone-shaped piece of driftwood in locating subsurface water. However, despite finding personal success in using the tool called “technical analysis” (“TA”) in improving returns, I learned a valuable lesson this past week. About a month ago, with gold prices approaching $4,400, I used TA to identify a series of extreme readings that, in past eras, have led to trend reversals.

As a result, on October 17, I sent out an email alert calling for a top in gold, which resulted in an outside key reversal day followed by a retest the following Monday that also failed. As a result, my call for the near-term top in gold was then and remains today as a solid one, with February gold still $213 below the top of $4,433 seen the prior Friday.

Inflated with inner peace and burgeoning with the pride one feels when a particular call goes well, I waited with the patience of a lion-hunter for another popular metal to display characteristics similar to that of gold. I lurked silently in the bushes until late November, and with all the hubris and swagger of a Secretariat or Northern Dancer approaching the starting gate, I elected to make the call that I now regret, and that call was “Sell silver.” The price was around $57.00 per ounce basis March.

During the week immediately following that call, I began to sense that there had been a kind of shift, as in “there’s been a shift in the force, Luke” from Star Wars fame, as silver spat in the face of GGMA “expertise” and drove northward through $59. On Monday, March silver gapped through $60, and by Thursday, it hit $65.

What changed?

As I sat in my office overlooking the lovely and now-frozen Scugog Swamp listening intently to Fed Chairman Jerome Powell, I decided to write the following to my subscribers:

“In keeping with the Fed’s dual mandates of “price stability” and “maximum full employment,” their clandestine third mandate “protecting Wall Street” was delivered wonderfully today by Fed Chairman Jerome Powell as he walked the world through the 2:30 presser with nary a thought about inflation but ample comments about the “weakening jobs market.” Wall Street took that as a “dovish” tilt and took the DJIA to a 600-point gain and the S&P 500 to a 55-point gain. Traders also took the U.S. dollar down with the DXY down .568 to 98.632, and gold from down $30 to up $27, and silver from down $0.27 to up $1.36.

With this kind of cheerleading, the Fed has given traders an early Christmas gift, so my speculation of a weaker, 2018-style close to 2025 must be shuttered. Also, the hedges on gold and silver being used in the GGMA 2025 Trading Account have to be re-examined as the dovish Fed has now thrown the U.S. dollar overboard in favour of easier money. The Fed has also reintroduced a mild form of quantitative easing, or as the commentators called it, “soft QE.” In a scenario of Fed purchases of $40 billion of T-bills every month, we are back to a stimulative environment, which, from where I sit, is patently absurd given the S&P within a chip shot of record highs. Any time the Fed engineers a “risk on” policy move, stocks and the metals always move higher, so to be hedged against a stimulative Fed is at once dangerous and stupid.

I look for traders to now have a free rein to take stocks and the metals higher into year-end. While I will not move to add to any new long positions in the gold or silver space, I now expect February gold to re-test the high of October 19th at $4,433. Gold traders cannot ignore the breathtaking breakout in silver, so I suspect that there will be a lot of short-covering by the end of the month. I will be looking at the RSI and the HUI:US to see if we get a confirmed new high for gold. If we get one, I will open new speculative positions in the leveraged ETFs and in options.”

This week, the HUI:US broke out above the October 15 high of 693.10 and moved to a new record high of 715.70. All that is required for there to be a confirmed new “leg” of the precious metals bull is for February gold to close above $4,433. At Friday’s high, it was $4,387.80, so we are banging on the proverbial door.

I used a phrase in this Thursday’s alert that should be recalled and recited, and that is this: “It is not a sin to be wrong, but it IS a sin to STAY wrong.”

May we never forget the wisdom of that adage.

2026

Moving into 2026 is going to be a very interesting endeavour as I am now forced to begin to formulate the GGMA 2026 Forecast Issue, which seems to be getting more difficult each and every year. The newsletter I write focuses on a given theme each year, after starting off in 2020 with the idea that escalating debt levels in the West would eventually require collateralization of sovereign debt with gold reserves, and whether it was pandemics or regional bank problems, each crisis was met with monetization.

Debt has remained a dominant theme and rationale for gold and silver ownership every year since the service was founded, but in the past two years, the electrification movement and the macroeconomic outlook for copper sent me scurrying for senior and junior opportunities in the northern and southern hemispheres. I used my beloved Freeport-McMoRan Inc. (FCX:NYSE) as a proxy for not only copper but also gold, as the globe’s premier producer of the red metal is also a significant member of the gold club, thanks largely to its part-ownership of the mighty Grasberg Mine in Indonesia.

With great trepidation and fear verging upon abject guilt, I exited FCX in early July based largely on my concern that the huge gap between London Metals Exchange copper (at $4.40/lb.) was too much of a discount to CME (U.S.) copper, which had been “tariffed” into a $1.50 premium over London due solely to political posturing. A seminal event occurred in July when the Trump Administration elected to remove tariffs on imports of “raw copper,” causing a cataclysmic crash in U.S. copper prices to align perfectly with London prices. I bought back my position in July at sub-$40 and then exited again in September when copper prices had rebounded into overbought conditions.

Then the news hit of the Grasberg “mud rush”  accident that caused a halt in operations in that portion of the mine complex, after which the stock cratered to just above $35. I fully expected that overvalued equity markets would weaken during the seasonally soft August-October period, but resilient equities and a stubbornly strong copper price prevented the target price of “sub-$30” from ever being achieved. So, here I sit, with 13 trading sessions left in 2025, and I am bereft of my beloved FCX as it steams northward at $47.38 after hitting $49 earlier today. Every single time I exit FCX, karma bites me in the backside, shaking its skeletal finger while shrieking “Sacrilege!

The good news is that I have been blessed with a couple of junior copper deals that caught my attention in 2025. One is not new in that I have been an investor in Australian Campbell Smyth’s

Fitzroy Minerals Inc. (FTZ:TSX.V; FTZFF:OTCQB) since 2019, when he launched Norseman Silver into what we both thought could be a rip-roaring silver market in 2020. The company went through growing pains in 2020-2022 and then went “dark” in 2023 before finding a new team of managers and projects in U.K.-based CEO Merlin Marr-Johnson and Santiago-based COO Gilberto Schubert and after bottoming in late 2023 at $.035, the shares responded favourably to the management change and since then have not had time to even glance into the rear-view mirror.

Smyth has put together one superb team of highly-skilled professionals and is now backed by Crux Investor founder Matt Gordon as a major shareholder as well as Technical Advisor Craig Perry in their quest for copper stardom in the Atacama Region of the Chilean Andes. Searching for copper in Chile is like looking for seashells in the Bahamas in that, despite declining grade and reserves in some of the legendary state-run Codelco operations, it is the prime locale for copper discoveries. Blessed with a wonderfully hospitable mining environment, only the province of Quebec in Canada is friendlier to people with money looking to find metals while employing people, a notion that the Canadian provinces of Ontario and B.C. might consider. Smyth and friends have raised over CA$20 million since the lows of 2023 and have since come up with a brand new copper-gold-molybdenum discovery in their Caballos project that serves as a wonderful complement to their oxide copper deposit at Buen Retiro.

However, the seriously underpromoted and underemphasized component of that property is what may or may not be lurking under that massive oxide copper-bearing cap. Management has been quite “coy” about revealing anything about drilling intentions until their press release of December 2, where they reported: “Hole 43, 150 metres north of hole 42, is currently underway. Crucially, the core photographs look very similar to the style of mineralization from within the resource zone at Candelaria. These holes are the first time that Fitzroy has seen consistent sulphide mineralization of this nature, which further enhances the exploration model at this project.

Followers of this publication are quite familiar with my contention that Buen Retiro is one of those projects where management has — most appropriately — de-risked the project by drilling of the easily fundable oxide cap, where CAPEX requirements are relatively low, while carefully and very much under the cloak of darkness, valiantly trying to unlock the secrets of the deeper regions of Andean geology. All I can say is that it is exciting to be a shareholder, and we will leave it at that.

The other Chilean project is Grafton Resources Inc. (GFT:CSE; PMSXF:OTC), where essentially the same management group as Fitzroy has attempted to firewall the two main projects (Buen Retiro and Caballos) from further dilution by way of the creation of this new company.

New prospects that come across Schubert’s desk are funnelled into Grafton while the team focuses 100% on near-term production for Fitzroy, which is somewhat akin to one car driving in the middle lane of the Autobahn while the other is in the outside lane with full throttle, taking the moniker of “aggressive exploration.

With a capital structure time-warped from the 1980s, GFT has only 25 million shares issued, $4m in the bank, and a project (Alicahue) approved for drilling in January. All that needs to be completed is an airborne MMT survey to be completed in the very early New Year, and then it is “Game on.”

Many of the people who follow me are asking questions about Getchell Gold Corp. (GTCH:CSE; GGLDF:OTCQB) and the dismal lack of performance in this latest move in the mining stocks, as evidenced by the HUI:US move to 715 this week.

As a starter, the promotions of the last few years are not exactly at new highs. Let’s start with the greatest promotion in eastern Canada since the Hibernia oil discoveries in the late 1970s —

New Found Gold Corp. (NFG:TSX.V; NFGC:NYSE.American) — a highly publicized holding of billionaire Eric Sprott, who loves to have his name on private placements in order to attract institutional accompaniment.

The stock topped in 2021 at CA$13.50 per share, only to go through a series of disappointing resource calculations and board-level resignations. The stock is now at $3.93 despite an advance in gold from $1,700 in the month it topped in 2021 to the current level of $4,329.

Those who bought shares in NFG in 2021 as a proxy for a) gold and b) Eric Sprott’s brain have been squarely left in the camp of the “Bagholder Blues.” Let us take another look at the famous gold promotions of the past few years.

How about Novo Resources Corp. (NVO:TSX.V; NSRPF:OTCQX).

This company is touted by both Eric Sprott and legendary geoscientist Quentin Hennigh.

It topped at over $8.00 in 2017 and now resides at $0.12.

I would ask you all: Is it any wonder why a company staffed with solid management and loyal shareholders, developing an economically-viable project in an infinitely-promotable jurisdiction (Nevada), cannot cop a bid from the Sprotts or Rules of this world? Why does it take years to attract the favor of really well-intentioned and seasoned influencers?

Of my subscriber base, every single one has a story of some beautifully-promoted Canadian mining stock that sounds wonderful with really wealthy people talking it up that wound up with a frying-pan forehead from an irate wife that found out what hubby did with her inheritance money from Uncle Buck. Everyone has a New Found Gold or Novo skeleton hiding in their closet so when a real company with a real story comes along and asks new investors to look at the PEA which suggest that the stock should trade north of $1.00 at $2,250 gold and probably $5.00 at $4,000 gold and is available “on offer” at CA$0.385, their first instinct is to run for the hills as this story MUST be “too good to be true.

I could sit here and write another ten paragraphs, but it would be a wasted effort as I have been a loyal shareholder since 2018 and watched the company go from near-disintegration to virtual ecstasy earlier this month. Relative to other well-managed and well-sponsored juniors, GTCH/GGLDF is a takeover waiting to happen — a classic example where management is powerless to attract the value-add investor that takes a big position and then brings in his billionaire friends to take out all the weak hands. Make no mistake, CEO Mike Sieb has done a superb job finding gold and is fully capable of finding more, but finding gold and finding investors are two mutually exclusive exercises. It is one thing to find a mineralized trend, but it is many times as difficult to find a self-multiplying group of buyers of stock.

Nonetheless, Getchell Gold Corp.’s Fondaway Canyon asset is a jewel of an asset and will get bought at some price by some entity, especially at $4,400 gold that could easily be $8,400 gold in the next year, as I have been suggesting since 2020, when I first launched this letter. Chairman Robert Bass and his family own over 20% of issued capital and are staunch believers in the integrity of the project. So do I.

End of discussion.


Important Disclosures:

  1. As of the date of this article, officers, contractors, shareholders, and/or employees of Streetwise Reports LLC (including members of their household) own securities of Fitzroy Minerals Inc., Grafton Resources Inc., and Getchell Gold Corp.
  2. Michael Ballanger: I, or members of my immediate household or family, own securities of: Fitzroy Minerals Inc., Grafton Resources Inc., and Getchell Gold Corp. My company has a financial relationship with: None. My company has purchased stocks mentioned in this article for my management clients: None. I determined which companies would be included in this article based on my research and understanding of the sector.
  3. Statements and opinions expressed are the opinions of the author and not of Streetwise Reports, Street Smart, or their officers. The author is wholly responsible for the accuracy of the statements. Streetwise Reports was not paid by the author to publish or syndicate this article. Streetwise Reports requires contributing authors to disclose any shareholdings in, or economic relationships with, companies that they write about. Any disclosures from the author can be found  below. Streetwise Reports relies upon the authors to accurately provide this information and Streetwise Reports has no means of verifying its accuracy.
  4.  This article does not constitute investment advice and is not a solicitation for any investment. Streetwise Reports does not render general or specific investment advice and the information on Streetwise Reports should not be considered a recommendation to buy or sell any security. Each reader is encouraged to consult with his or her personal financial adviser and perform their own comprehensive investment research. By opening this page, each reader accepts and agrees to Streetwise Reports’ terms of use and full legal disclaimer. Streetwise Reports does not endorse or recommend the business, products, services or securities of any company.

For additional disclosures, please click here.

Michael Ballanger Disclosures

This letter makes no guarantee or warranty on the accuracy or completeness of the data provided. Nothing contained herein is intended or shall be deemed to be investment advice, implied or otherwise. This letter represents my views and replicates trades that I am making but nothing more than that. Always consult your registered advisor to assist you with your investments. I accept no liability for any loss arising from the use of the data contained on this letter. Options and junior mining stocks contain a high level of risk that may result in the loss of part or all invested capital and therefore are suitable for experienced and professional investors and traders only. One should be familiar with the risks involved in junior mining and options trading and we recommend consulting a financial adviser if you feel you do not understand the risks involved.

Silver Hits Record High on Demand and Data

By RoboForex Analytical Department 

On Wednesday, silver surged past 66 USD per ounce, setting a new all-time high. The rally was driven by a mixed US employment report, which sparked investor interest in alternative high-return assets for portfolio diversification.

The November labour market data revealed the unemployment rate climbing to 4.6% – its highest level since 2021 – even as job creation exceeded expectations.

Silver’s year-to-date gain of nearly 130% is further supported by declining inventories and robust demand from both retail investors and industrial users. In particular, expanding sectors such as solar energy, electric vehicles, and data centres are driving increased industrial consumption.

Technical Analysis: XAG/USD

H4 Chart:

On the H4 chart, XAG/USD established a consolidation range around 57.65 USD. Following an upward breakout, the market has extended to 66.72 USD, with scope for further gains towards 69.79 USD. Having completed a growth impulse to 66.51 USD, a minor correction towards 64.64 USD appears possible before the uptrend resumes.

The MACD indicator supports the bullish outlook, with its signal line firmly above zero, indicating sustained upward momentum.

H1 Chart:

On the H1 chart, silver completed a growth wave to 65.30 USD and has since formed a consolidation range around this level. An upward breakout has extended the move to 66.51 USD. A technical pullback towards 65.65 USD may occur; a break below this level could extend the correction towards 60.85 USD. Conversely, a rebound from 65.65 USD would favour a continuation of the uptrend toward 66.72 USD.

The Stochastic oscillator aligns with this view, with its signal line above 80 and trending upward, though nearing overbought territory.

Conclusion

Silver’s record rally reflects strong fundamentals – tightening supply, robust industrial demand, and its appeal as a hedge amid economic uncertainty. While the near-term trend remains bullish, the market is approaching overextended levels, increasing the likelihood of a short-term correction. Key support lies around 65.65 USD, with a break below potentially signalling a deeper pullback. Until then, the momentum favours further tests towards 66.72 USD and possibly 69.79 USD.


Disclaimer:

Any forecasts contained herein are based on the author’s particular opinion. This analysis may not be treated as trading advice. RoboForex bears no responsibility for trading results based on trading recommendations and reviews contained herein.

Gold on Pause Awaiting the Fed’s Verdict

By RoboForex Analytical Department

Gold is trading in a holding pattern near 4,200 USD per ounce on Tuesday, as markets remain in a state of suspended animation ahead of the Federal Reserve’s policy decision.

While a 25-basis-point rate cut is almost fully priced in, investors will scrutinise the updated economic projections and Chair Jerome Powell’s subsequent press conference for clarity on the policy trajectory into 2026 and beyond.

Market-implied probabilities currently assign an 87% likelihood to a cut today. However, expectations for future easing have moderated, with just two rounds of cuts now anticipated for next year, down from three a week ago.

Before the Fed announcement, traders will also assess the latest JOLTS job openings data for additional labour market insights.

In a supportive development for the metal, the People’s Bank of China expanded its gold reserves for the 13th consecutive month, bringing its total holdings to 74.12 million troy ounces.

Technical Analysis: XAU/USD

H4 Chart:

On the H4 chart, XAU/USD continues to consolidate in a sideways range following its late-November advance. The price is currently trading below the middle Bollinger Band, suggesting a gradual loss of bullish momentum. The upper band has flattened, confirming the consolidation phase within the 4,163–4,240 USD zone.

Support at 4,163 USD remains critical, with the price having rebounded from this level multiple times in recent sessions. A decisive break below would open the way to the next significant support near 4,136 USD, which aligns with the lower Bollinger Band.

Resistance is clearly defined at 4,240 USD. A sustained move above this level would provide the first strong signal for a renewed upward move, initially targeting 4,265 USD.

H1 Chart:

On the H1 chart, gold shows a near-term bearish bias after failing to break above resistance at 4,240 USD. The price is consistently positioned below the middle Bollinger Band, with the lower band reinforcing the selling pressure. Local support has solidified around 4,163 USD, a level tested repeatedly in recent trading.

The Stochastic oscillator remains near oversold territory, indicating weak momentum, though a clear reversal signal has yet to emerge.

Should buyers defend the 4,163 USD support and propel the price back above the middle Bollinger Band, a recovery toward 4,200 USD and later 4,240 USD would become likely. Conversely, a breakdown below 4,163 USD would signal a deeper corrective move toward 4,136–4,100 USD.

Conclusion

Gold remains in a state of cautious equilibrium as traders await the Fed’s policy signal and updated economic forecasts. While underlying physical demand – particularly from central banks – continues to provide a supportive floor, the technical picture reflects consolidation with a slight near-term bearish tilt.


Disclaimer:

Any forecasts contained herein are based on the author’s particular opinion. This analysis may not be treated as trading advice. RoboForex bears no responsibility for trading results based on trading recommendations and reviews contained herein.

Gold Steady Near 4,200 USD as Markets Await Key Data

By RoboForex Analytical Department

Gold prices held close to 4,200 USD per ounce on Friday, with investors focused on a significant, delayed inflation report ahead of next week’s Federal Reserve policy decision.

All attention is on the release of the September Personal Consumption Expenditures (PCE) index, the Fed’s preferred inflation gauge. The data could be decisive in shaping expectations for the timing and scale of upcoming monetary easing.

Earlier in the week, further signs of a cooling labour market emerged. ADP reported an unexpected decline of 32,000 in private sector payrolls, while the Challenger report recorded 71,000 layoffs in November – bringing the year-to-date total to nearly 1.17 million.

This combination of soft employment figures has reinforced investor conviction that the Fed will cut rates as early as next week, with the market-implied probability now standing at approximately 87%.

Adding to the dovish narrative are reports that White House economic adviser Kevin Hassett may succeed Jerome Powell as Fed Chair in May. Markets interpret this as a potential tilt towards more aggressive policy easing.

Despite a moderately lower weekly close, gold remains well-supported heading into the critical data release.

Technical Analysis: XAU/USD

H4 Chart:

On the H4 chart, gold (XAU/USD) is consolidating after its recent advance toward 4,220–4,230 USD. The price remains above the middle Bollinger Band, with the upper band turning slightly upward, suggesting an attempt to recover from recent weakness.

Key resistance is around 4,265 USD, a level the market has repeatedly tested without securing a decisive breakout. A sustained move above this level would clear the path towards 4,300 USD and beyond.

Immediate support is marked at 4,163 USD. A break below this level would increase selling pressure and raise the risk of a decline towards the next demand zone near 4,136 USD. A close below 4,136 USD would signal a transition into a deeper corrective phase.

H1 Chart:

On the H1 chart, XAU/USD is trading within a tightening range between 4,188 USD and 4,220 USD, reflecting mixed short-term momentum. The middle Bollinger Band is providing near-term equilibrium, confirming the absence of a clear directional bias.

The upper Bollinger Band is capping advances near 4,220–4,225 USD, with several rejections from this zone indicating local overbought conditions. The lower band is offering support around 4,185–4,190 USD.

A sustained move above 4,220 USD would signal a resumption of bullish momentum, initially targeting 4,235–4,240 USD, and potentially 4,265 USD. Conversely, a break below 4,185 USD would open the way towards 4,163 USD. A loss of this support could intensify corrective pressure and expose the 4,136 USD level.

Conclusion

Gold remains in a holding pattern near 4,200 USD as traders await the delayed PCE inflation report. While labour market softness has bolstered expectations for Fed easing, the technical picture reflects consolidation within a defined range. A decisive reaction to today’s data is likely to set the tone ahead of next week’s FOMC meeting, with a break above 4,265 USD opening the door to further gains, while a drop below 4,163 USD risks a deeper correction.


Disclaimer:

Any forecasts contained herein are based on the author’s particular opinion. This analysis may not be treated as trading advice. RoboForex bears no responsibility for trading results based on trading recommendations and reviews contained herein.

Gold Hits Five-Week High on Dovish Fed Bets

By RoboForex Analytical Department

Gold climbed to 4,240 USD per ounce on Monday, reaching its highest level in five weeks, as expectations solidified for an imminent Federal Reserve interest rate cut. Markets have priced in an 87% probability of a 25 basis point reduction at this month’s policy meeting.

The dovish shift has been reinforced by commentary from Fed officials and a string of weaker-than-expected macroeconomic data following the prolonged US government shutdown.

Investor focus now turns to manufacturing and private-sector employment data due this week, which may deliver final signals before the Fed convenes.

The precious metal has advanced nearly every month this year and is on track for its strongest annual performance since 1979. Sustained demand from central bank purchases and ongoing inflows into gold-backed ETFs continue to underpin the rally, having previously propelled prices to a record high above 4,380 USD.

Technical Analysis: XAU/USD

H4 Chart:

On the H4 chart, XAU/USD continues to advance within a bullish impulse and is now testing the upper boundary of a Double Bottom reversal pattern, where buyers are meeting resistance. A decisive break above this zone would open the path for sustained gains toward 4,385 USD.

The Stochastic Oscillator supports the upward bias, with its signal lines positioned above 80 and yet to cross, indicating persistent bullish momentum. A deeper correction would require a break and close below the lower boundary of the bullish channel, particularly below 4,185 USD.

H1 Chart:

On the H1 chart, the pair is rising after bouncing from local support at 4,215 USD. Buyers are attempting to secure a close above the key resistance level of 4,245 USD. A swift rebound and sustained trading above the EMA-65 confirm buyer dominance and signal potential for a short-term continuation higher.

The session’s technical outlook suggests the potential for a minor bearish correction, followed by a renewed push toward 4,345 USD, where the upper boundary of the bullish channel lies. The Stochastic Oscillator provides an additional positive signal, as its signal lines are rebounding from an ascending trendline, supporting the potential for further gains.

Conclusion

Gold continues to draw strength from growing expectations of Fed easing, positioning the metal for a potential test of record highs. The technical structure remains constructive, favouring further gains toward 4,385–4,345 USD on a sustained break above 4,245 USD. While a brief, shallow pullback cannot be ruled out, the broader uptrend appears intact, supported by strong fundamentals and sustained institutional demand.


Disclaimer:

Any forecasts contained herein are based on the author’s particular opinion. This analysis may not be treated as trading advice. RoboForex bears no responsibility for trading results based on trading recommendations and reviews contained herein.

Gold Treads Water Amid Mixed Signals

By RoboForex Analytical Department

Gold edged lower to 4,060 USD per ounce on Friday, positioning the metal for a modest weekly decline. The shift in sentiment follows a stronger-than-anticipated delayed US employment report, which has tempered expectations for a Federal Reserve rate cut in December.

The Labour Department’s data, delayed by the recent government shutdown, significantly exceeded forecasts: September non-farm payrolls rose by 119,000, well above the expected 50,000. Markets interpreted the report as confirming the Fed’s October assessment—that the labour market is cooling gradually but remains fundamentally stable. However, the unemployment rate climbed to 4.4%, its highest level since 2021, while wage growth came in slightly above expectations at 3.8%.

Notably, the October employment report will not be published separately; the Bureau of Labor Statistics will combine the data with November’s release.

Amid these mixed labour market signals and cautious commentary from Fed officials, markets now price the probability of a December rate cut at just 40%, maintaining downward pressure on gold.

Interestingly, despite a broad shift away from risk assets across global capital markets, gold has yet to see significant safe-haven inflows.

Technical Analysis: XAU/USD

H4 Chart:

On the H4 chart, XAU/USD is forming a consolidation range around 4,076 USD. The pair may first extend this range downward toward 4,019 USD before resuming an upward move to 4,141 USD. A decisive break above this level would open the path for a fifth wave of growth targeting 4,285 USD. The MACD indicator supports this view, with its signal line below zero, suggesting the current correction has further to run before the next leg higher.

H1 Chart:

On the H1 chart, the market has established a consolidation range around 4,075 USD. A downward wave is expected to develop toward at least 4,020 USD, which would complete the first phase of a larger pattern. This would be followed by a growth wave toward 4,131 USD, a correction back toward 4,020 USD, and then a final advance targeting 4,263 USD. The Stochastic oscillator aligns with this outlook, with its signal line at 20 and beginning to turn upward, suggesting potential for a near-term bounce.

Conclusion

Gold remains range-bound as conflicting labour market data and diminished rate cut expectations counterbalance its traditional safe-haven appeal. The technical picture suggests further consolidation is likely, with a potential dip toward 4,019–4,020 USD offering a buying opportunity for a subsequent move toward 4,141 USD and beyond. The metal’s inability to attract significant safe-haven flows despite equity market weakness remains a concern for bulls, leaving the near-term trajectory heavily dependent on upcoming US economic data and Fed communications.


Disclaimer:

Any forecasts contained herein are based on the author’s particular opinion. This analysis may not be treated as trading advice. RoboForex bears no responsibility for trading results based on trading recommendations and reviews contained herein.

Gold Dips in Healthy Correction

By RoboForex Analytical Department

Gold prices eased to 4,060 USD per ounce on Wednesday, marking a technical correction following the previous session’s gains. Investor caution prevails ahead of a series of high-impact macroeconomic releases, with particular focus on today’s FOMC meeting minutes and Thursday’s US employment report. These publications are expected to provide crucial insights into the Federal Reserve’s future interest rate path.

US agencies have resumed data publication following the government shutdown. Recent figures showed initial jobless claims climbed to a two-month high in mid-October, while continuing claims rose to 1.9 million. This softness in the labour market has modestly bolstered expectations for a December rate cut. However, markets remain wary that stronger subsequent reports could constrain the Fed’s ability to ease policy, particularly amid persistent hawkish rhetoric from officials.

A further factor supporting gold is the growing unease over stretched valuations in the technology sector. This is fuelling a mild risk-off sentiment and supporting demand for gold as a safe-haven asset, offsetting some of the metal’s recent weakness.

Technical Analysis: XAU/USD

H4 Chart:

On the H4 chart, XAU/USD is forming a consolidation range around 4,060 USD. An upward breakout is anticipated, targeting 4,140 USD as part of a fifth wave within a larger growth structure aiming for 4,284 USD. The MACD indicator supports this constructive view. Its signal line is below zero but has diverged from the histogram and is turning upward, suggesting building bullish momentum.

H1 Chart:

On the H1 chart, the market has established a consolidation range around 4,060 USD. With the upper boundary at 4,082 USD now breached, the path is open for the next leg higher. The initial target is 4,122 USD, potentially followed by a corrective pullback to retest 4,060 USD from above. A successful retest could catalyse a further advance towards 4,188 USD and ultimately 4,284 USD. The Stochastic oscillator confirms this near-term bullish bias, with its signal line positioned above 50 and pointing firmly upward.

Conclusion

Gold’s current pullback appears corrective within a broader uptrend, driven by cautious positioning ahead of key US data. The technical structure suggests underlying strength, with a clear setup for a potential rally towards 4,284 USD upon a sustained break above 4,082 USD. While the immediate direction hinges on the FOMC minutes and jobs data, the metal’s role as a portfolio hedge continues to provide underlying support amidst equity market jitters.


Disclaimer:

Any forecasts contained herein are based on the author’s particular opinion. This analysis may not be treated as trading advice. RoboForex bears no responsibility for trading results based on trading recommendations and reviews contained herein.