By InvestMacro
Here are the latest charts and statistics for the Commitment of Traders (COT) data published by the Commodities Futures Trading Commission (CFTC).
The latest COT data is updated through Tuesday May 5th and shows a quick view of how large traders (for-profit speculators and commercial entities) were positioned in the futures markets.
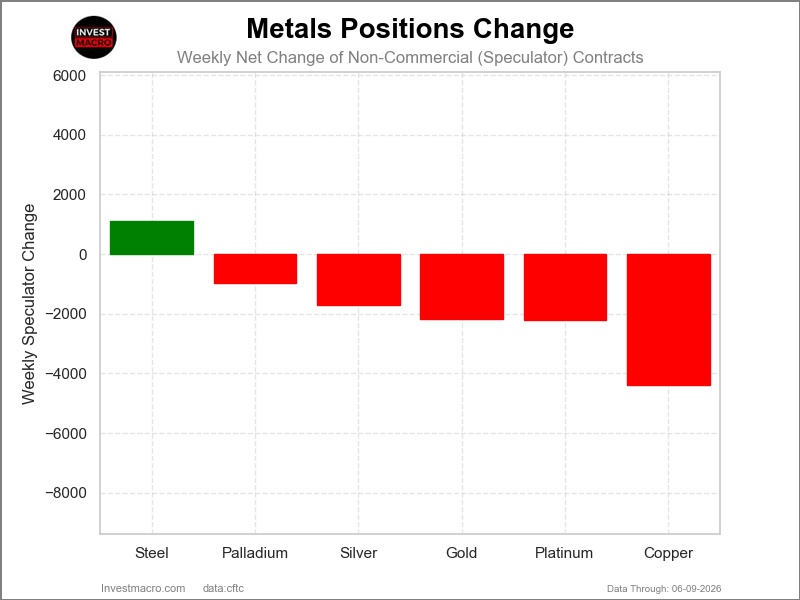
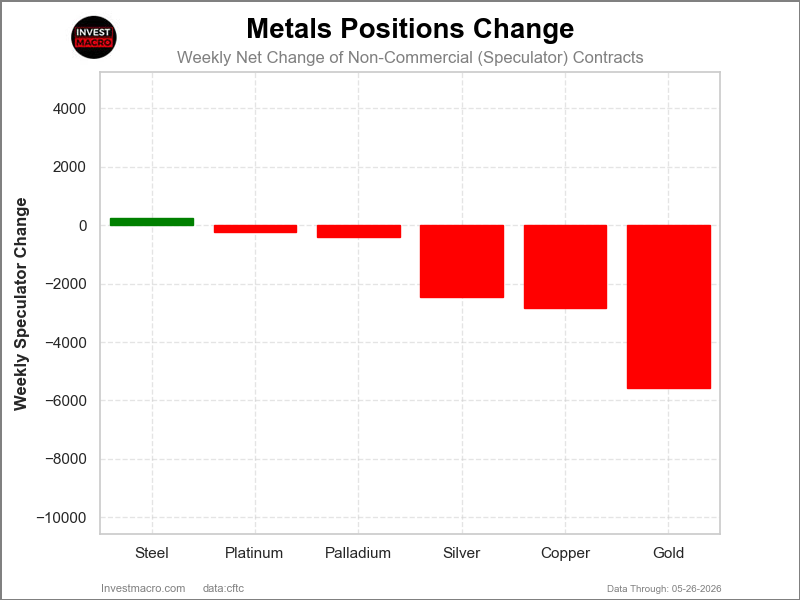
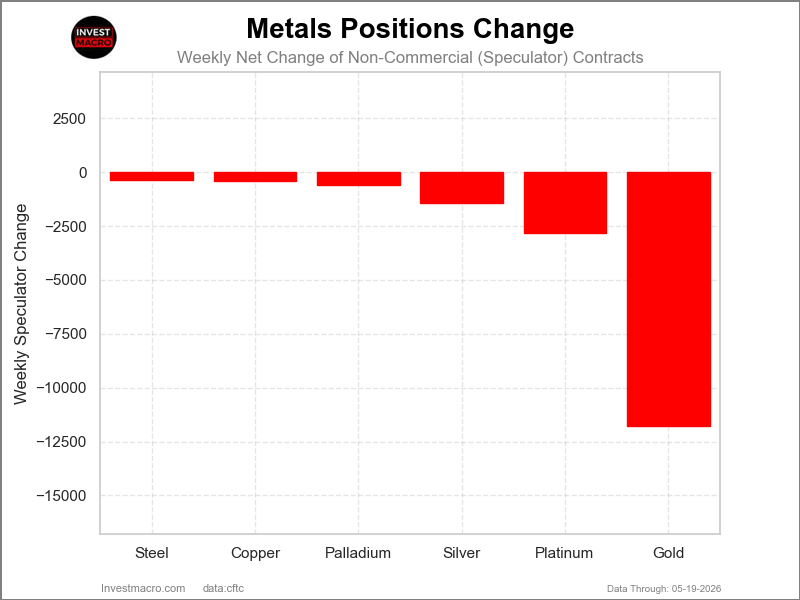
Weekly Speculator Changes led by Gold
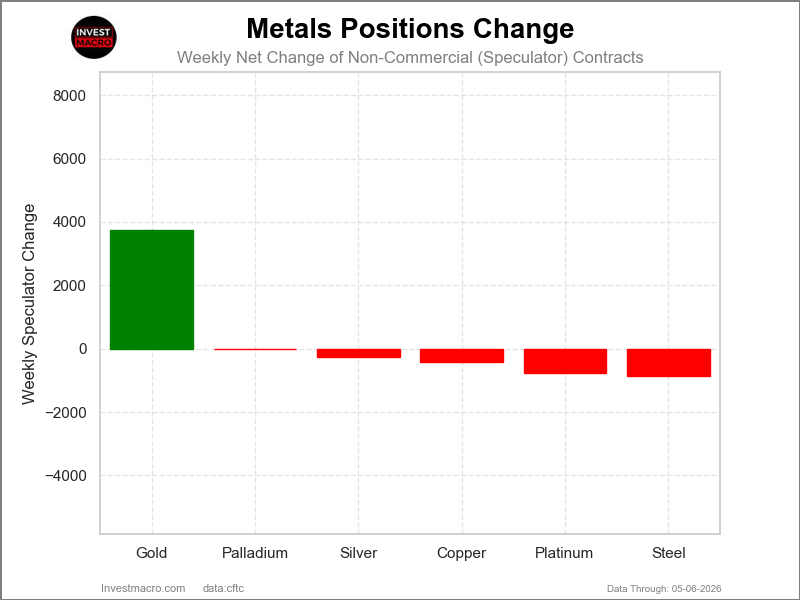
The COT metals markets speculator bets were overall lower this week as just one out of the six metals markets we cover had higher positioning while the other five markets had lower speculator contracts.
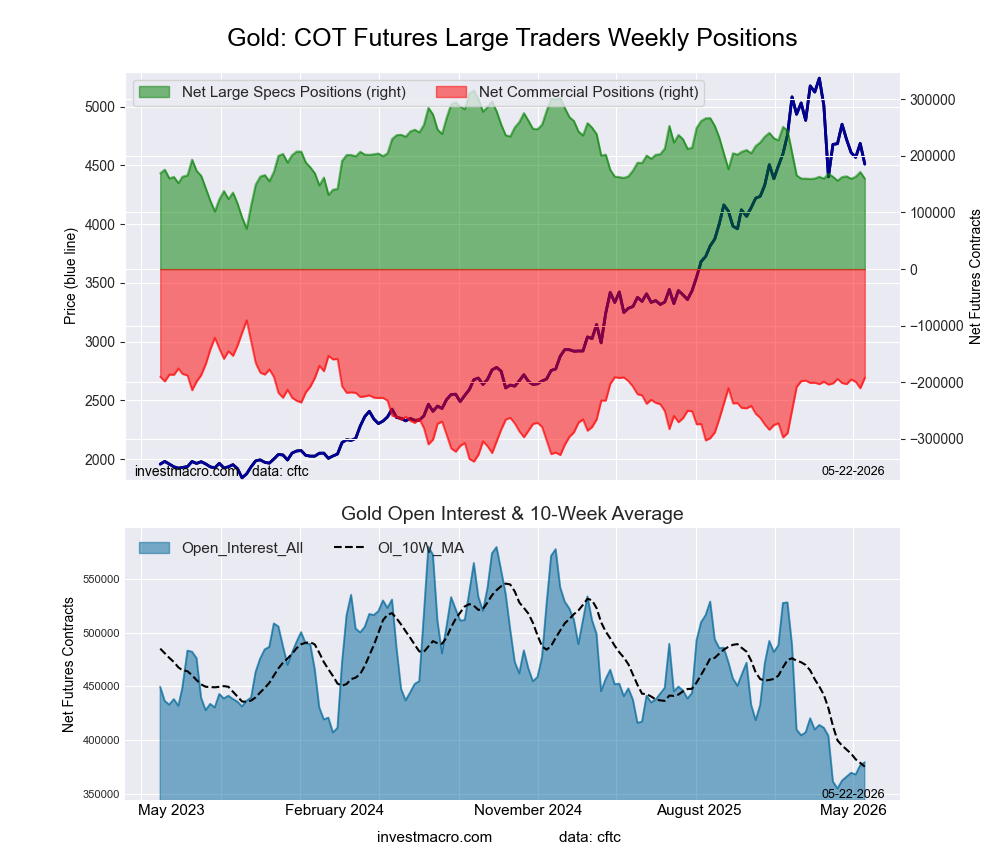
Leading the gains for the metals was Gold with a gain of 3,732 contracts on the week.
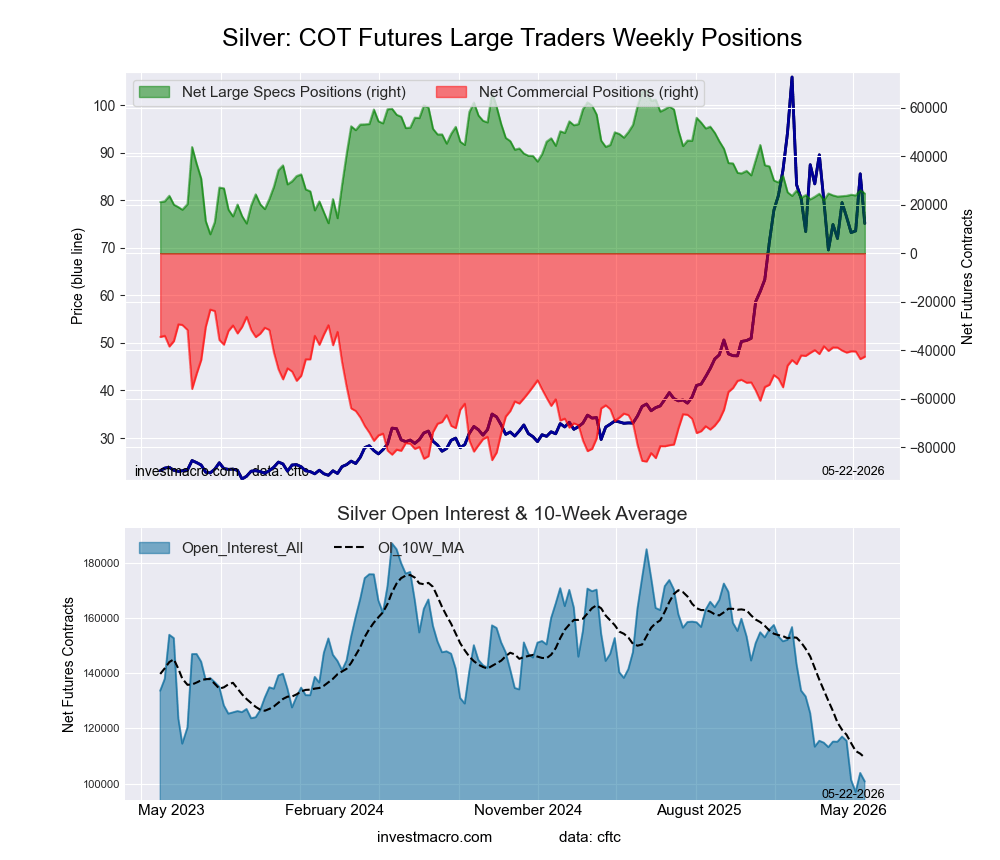
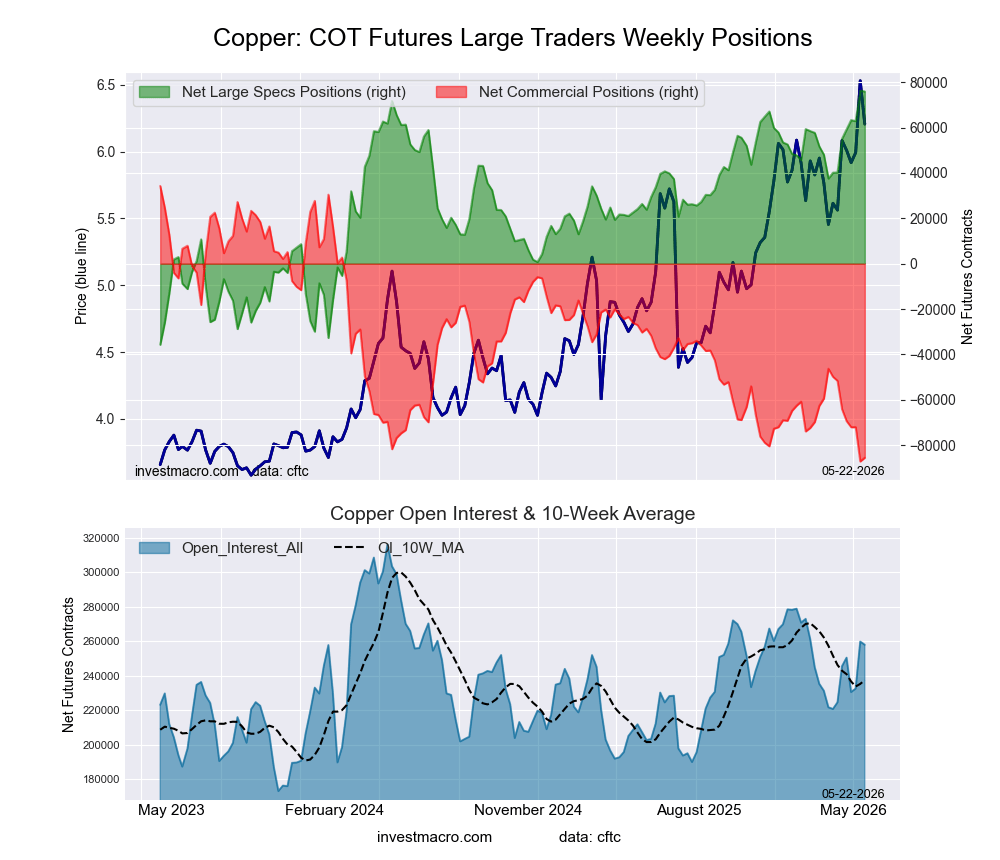
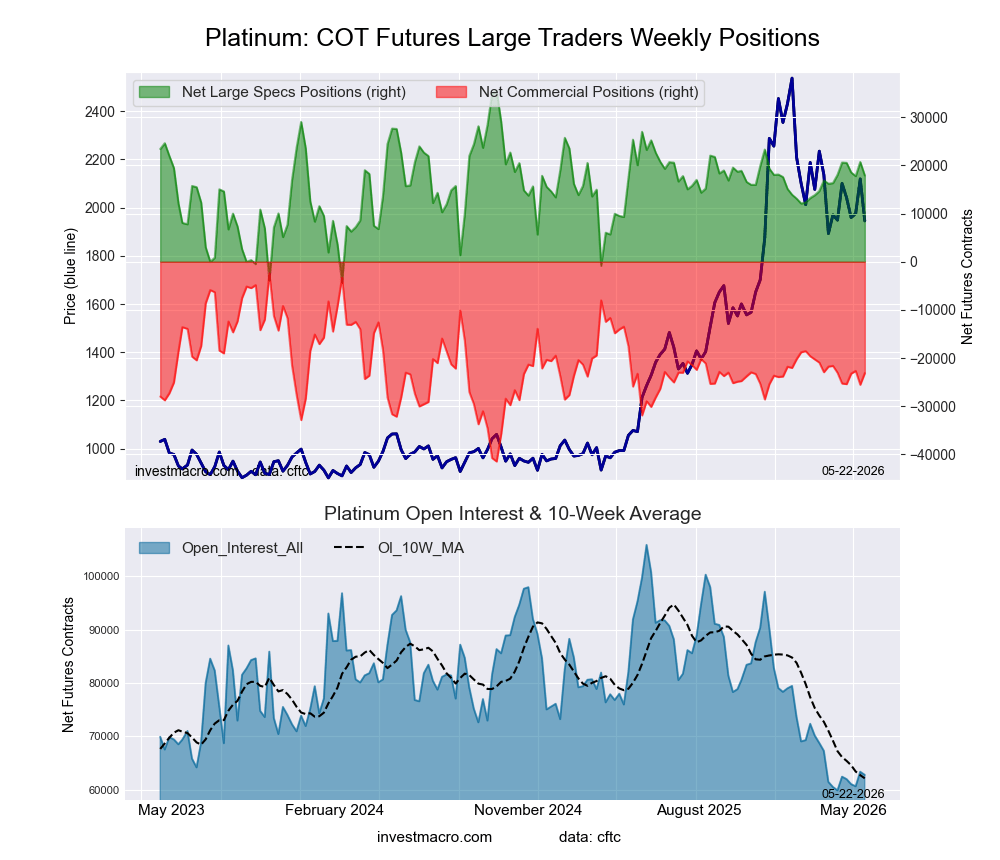
The markets with declines in speculator bets for the week were Steel (-849 contracts), Platinum (-765 contracts), Copper (-432 contracts), Silver (-268 contracts) and with Palladium (-12 contracts) also registering lower bets on the week.
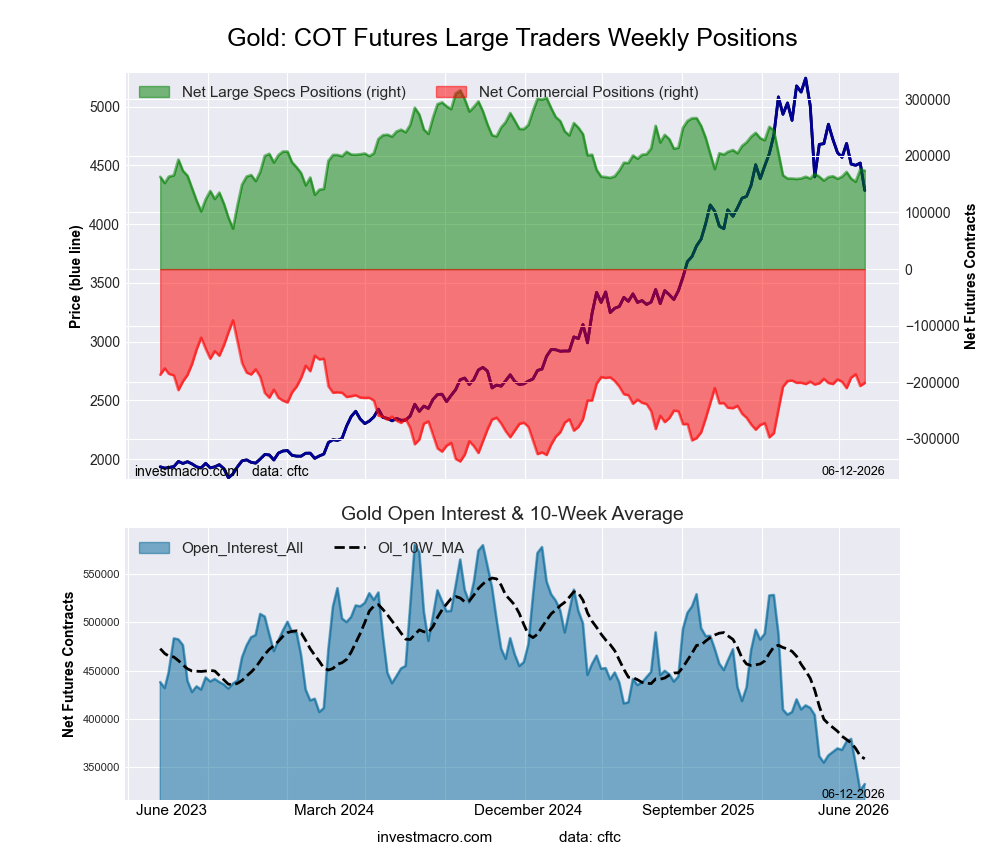
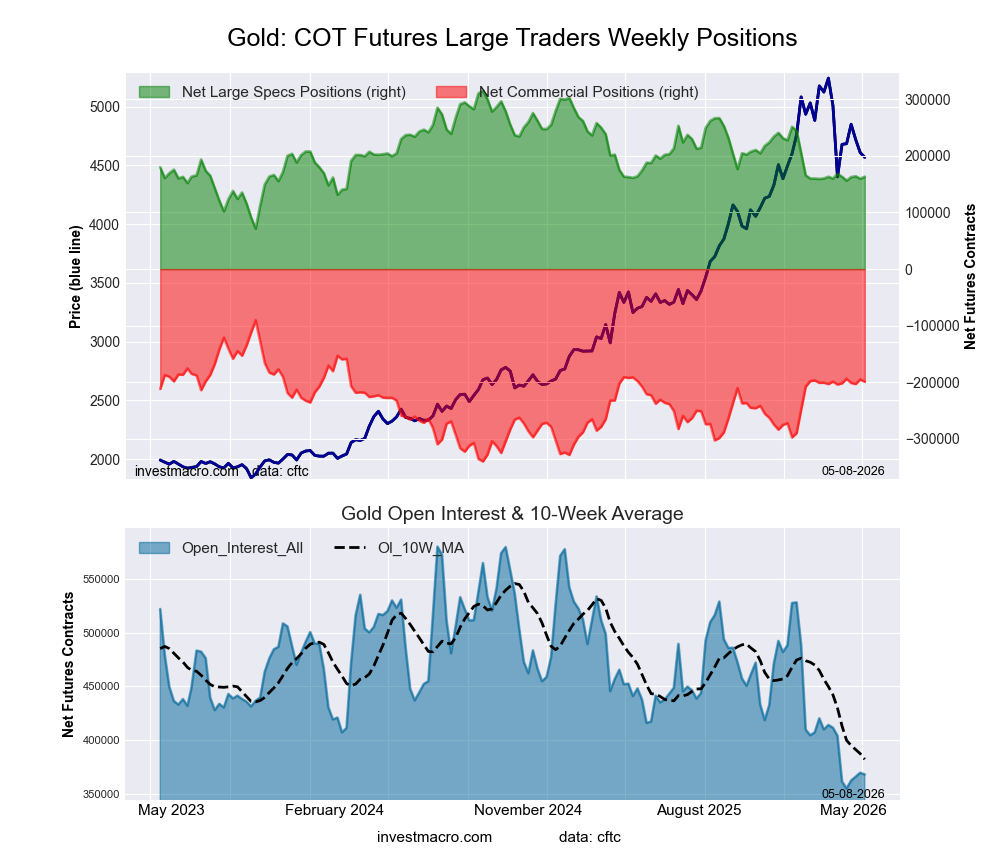
Gold Bets stable around +160,000 net contracts
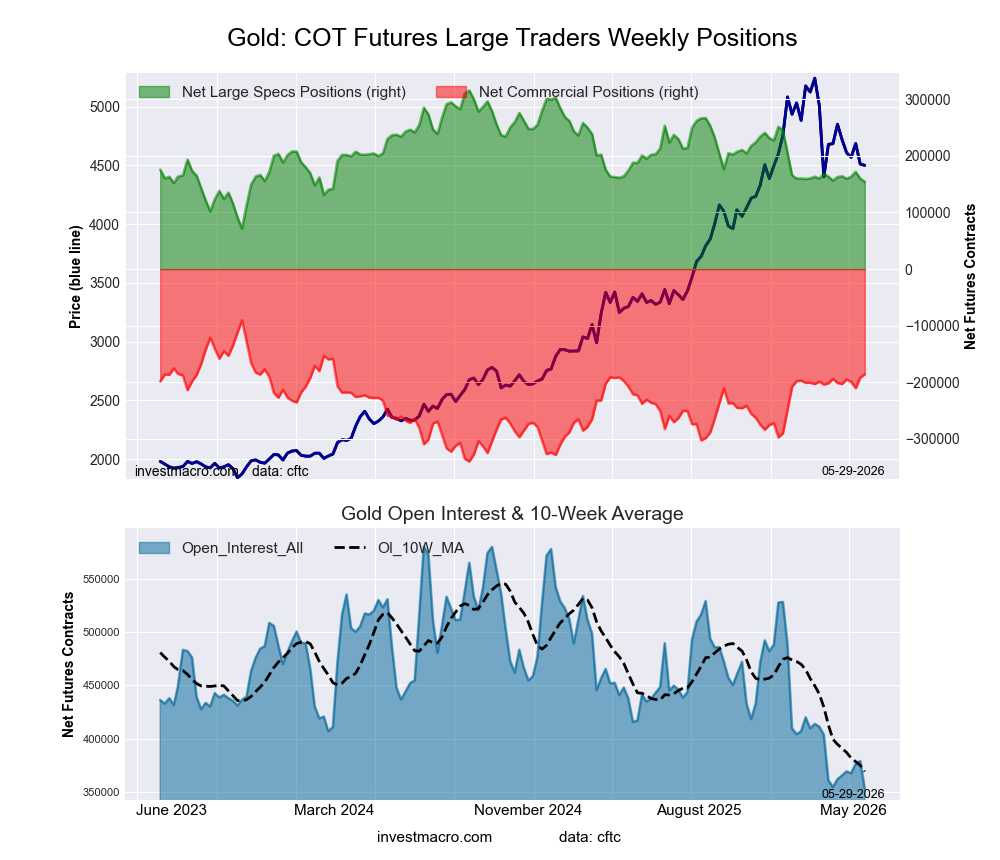
Highlighting the Metals markets today: This week saw speculator bets in Gold rise very modestly by a little under +4,000 net contracts. Gold positioning has stabilized right around the +160,000 to +165,000 net contract standing over the past 15 or so weeks. Previously, Gold bullish contracts had been over 200,000 net contracts week in and week out before falling lower in late January.
Open interest levels for Gold have fallen off dramatically and are around 360,000 contracts this week. The average open interest contracts since the beginning of 2025 have been around 460,000 contracts, illustrating that the market interest has cooled off in these past few months.
The Gold’s futures price closed this week around the $4,730 level and is still in a long-term strong uptrend. It has bounced back by almost 15% from the recent fall in March to the $4,100 level.
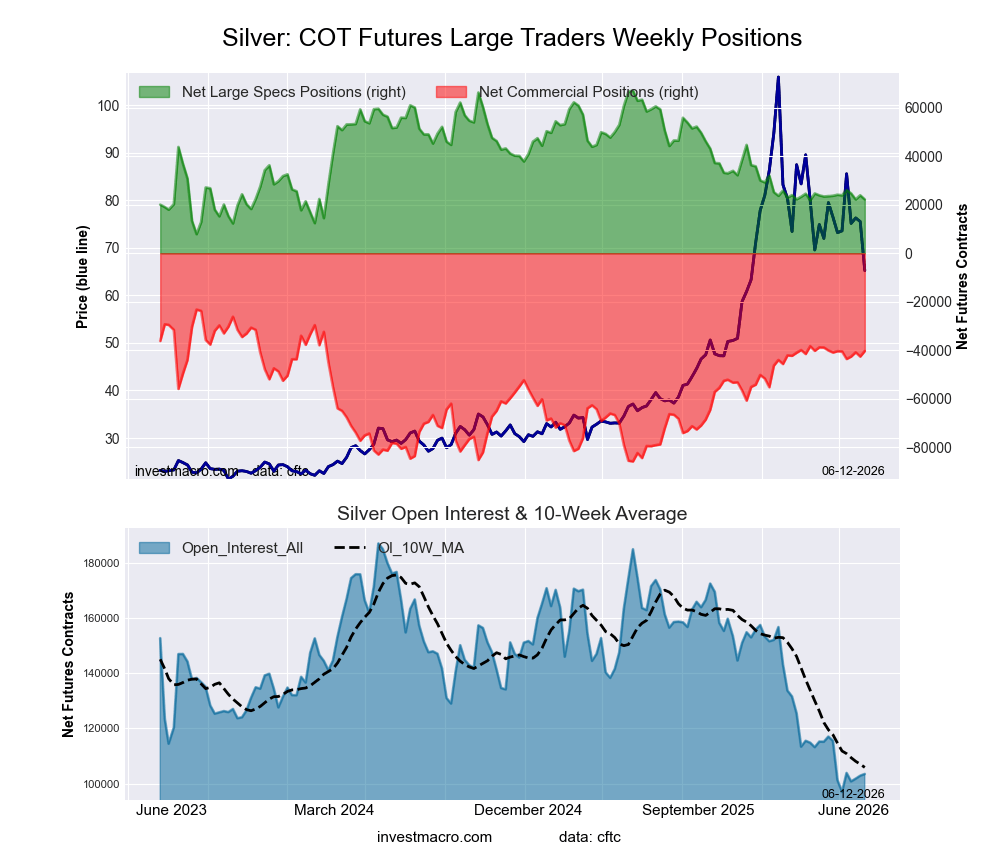
Silver leads the Metals markets price performance.
The last five days saw Silver come in with the biggest return in price performance for the overall Metals market. Silver rose by 6.08% for the week and has now notched a 10.86% increase over the past 30 days. Copper came in second with a 4.95% rise on the week and has been higher by 12.77% over the past 30 days.
Gold comes in third with a 2.38% gain on the week and has been just a bit higher at a 1.09% return over the past 30 days.
Platinum followed with a 1.96% gain this week, and Steel rounded out the weekly gainers with a 1.74% rise.
On the downside, Palladium dipped by -3.55%. Palladium is now also down by -0.24% over the past 30 days and has fallen by -26.62% in the past 90 days.
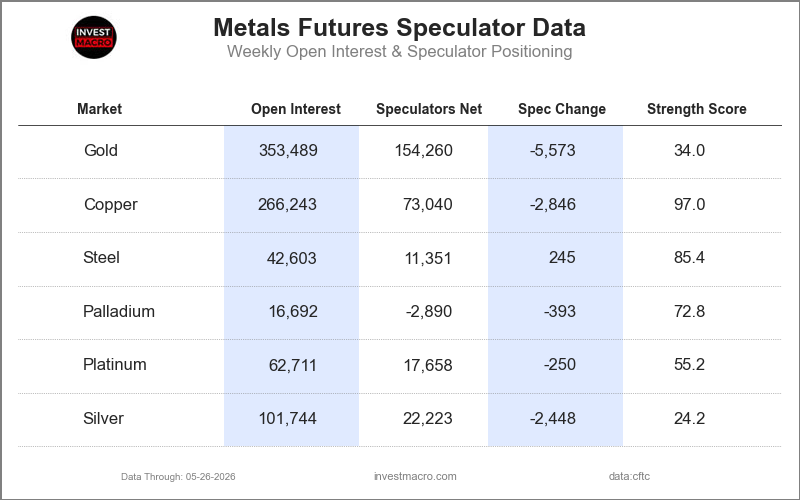
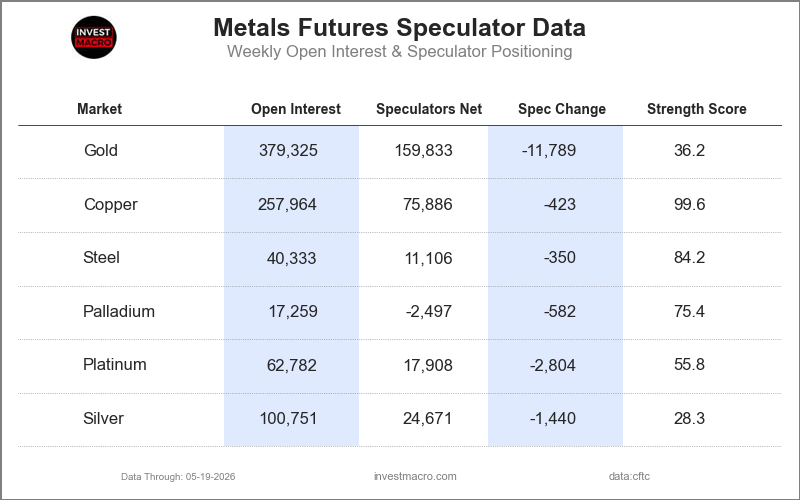
Metals Data:
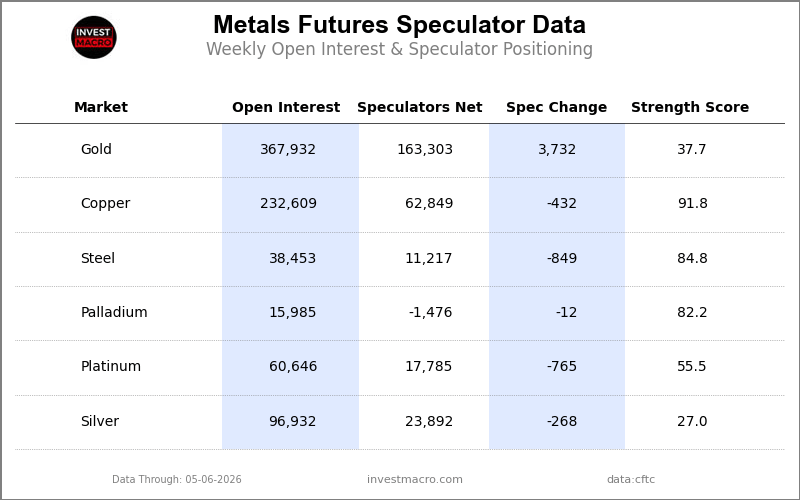
Legend: Weekly Speculators Change | Speculators Current Net Position | Speculators Strength Score compared to last 3-Years (0-100 range)
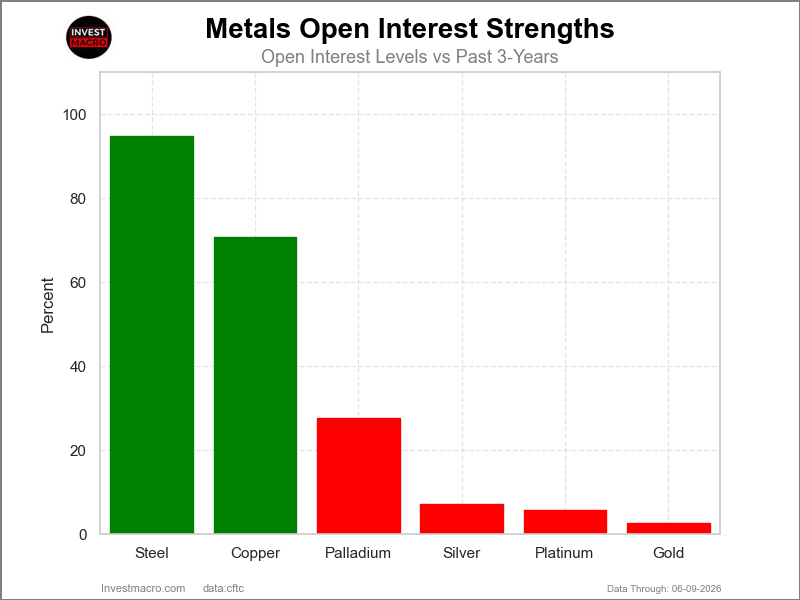
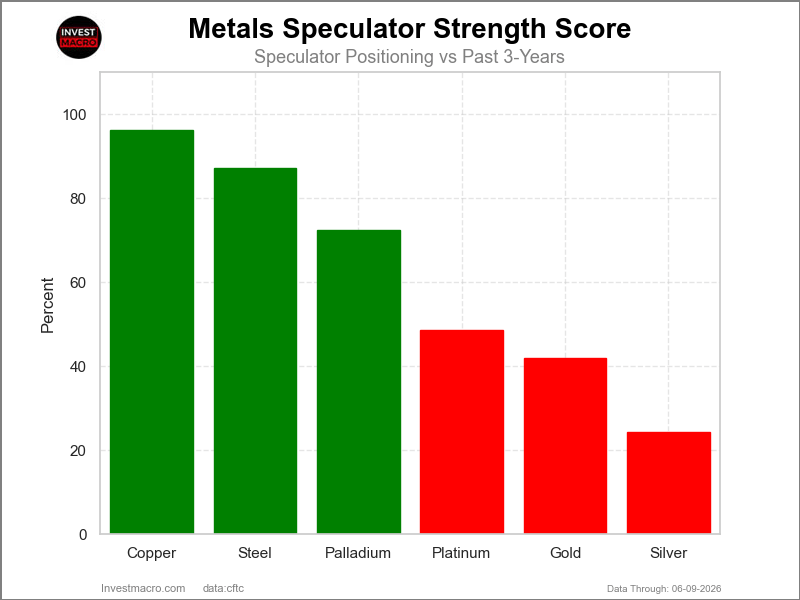
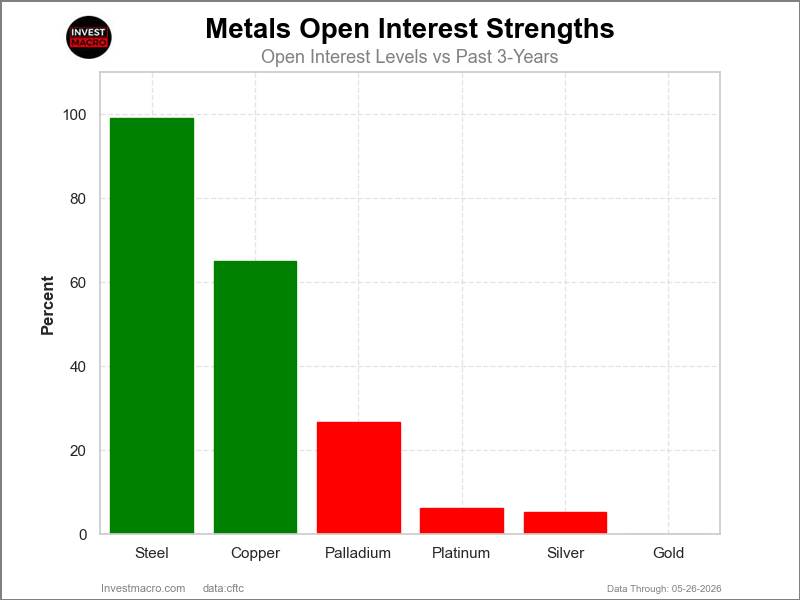
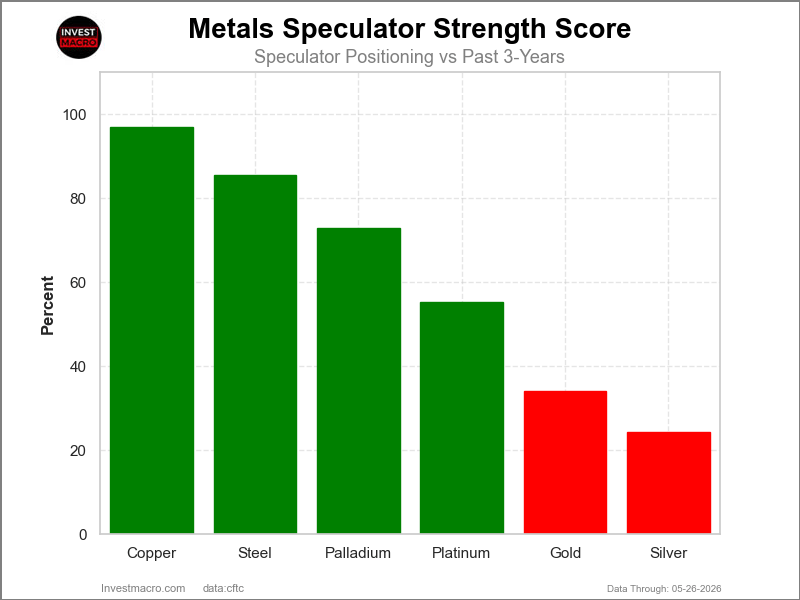
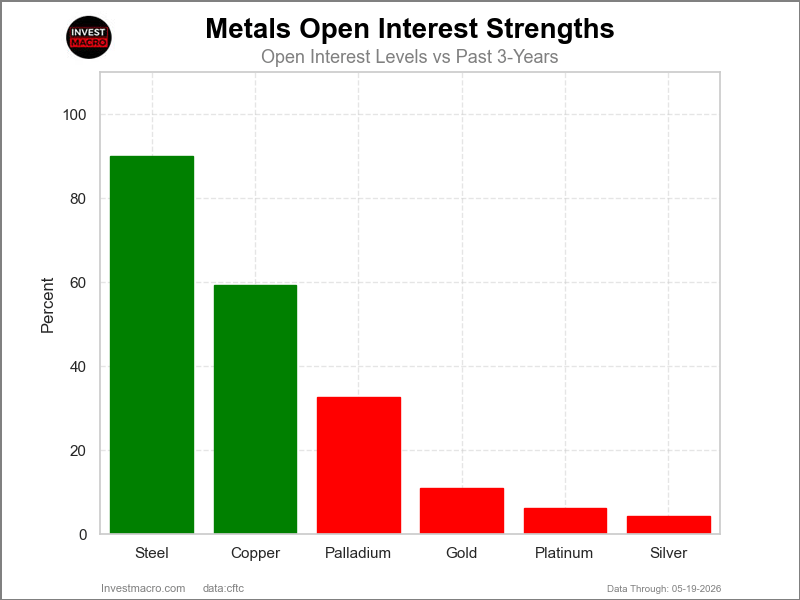
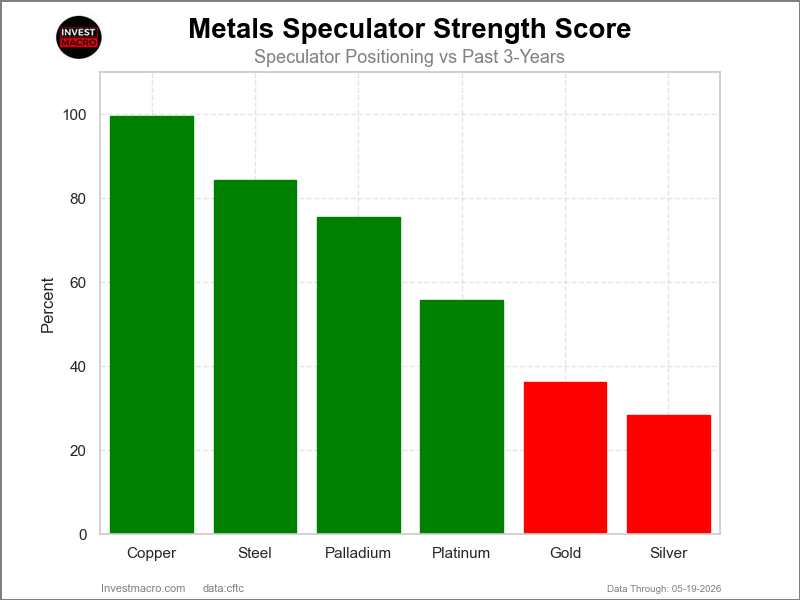
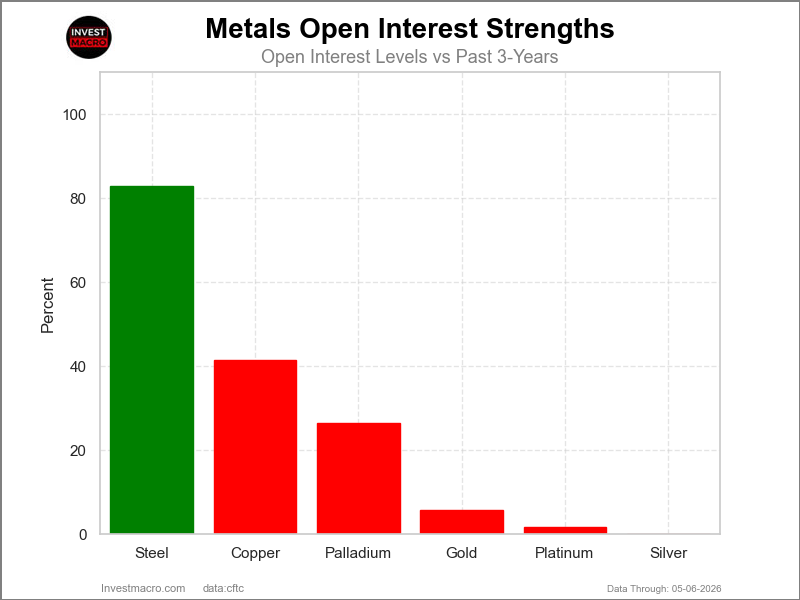
Strength Scores led by Copper & Steel
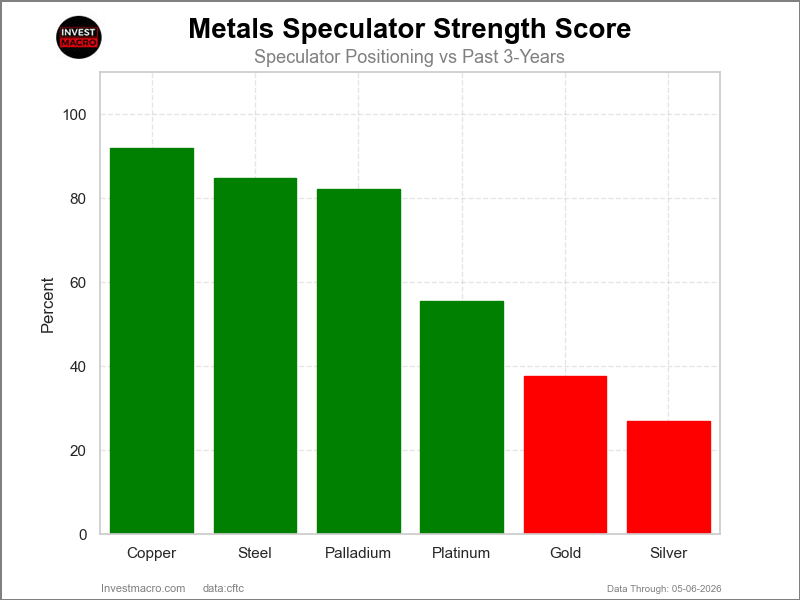
COT Strength Scores (a normalized measure of Speculator positions over a 3-Year range, from 0 to 100 where above 80 is Extreme-Bullish and below 20 is Extreme-Bearish) showed that Copper (92 percent) and Steel (85 percent) lead the metals markets this week. Palladium (82.2 percent) comes in as the next highest in the weekly strength scores.
On the downside, Silver (27 percent) and Gold (38 percent) come in at the lowest strength level currently.
Strength Statistics:
Gold (37.7 percent) vs Gold previous week (36.1 percent)
Silver (27.0 percent) vs Silver previous week (27.5 percent)
Copper (91.8 percent) vs Copper previous week (92.2 percent)
Platinum (55.5 percent) vs Platinum previous week (57.4 percent)
Palladium (82.2 percent) vs Palladium previous week (82.2 percent)
Steel (84.8 percent) vs Steel previous week (88.7 percent)
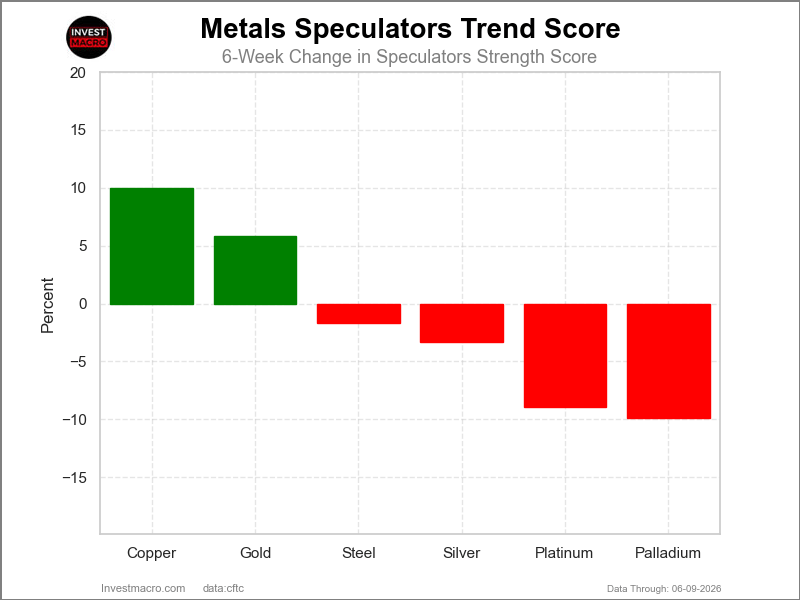
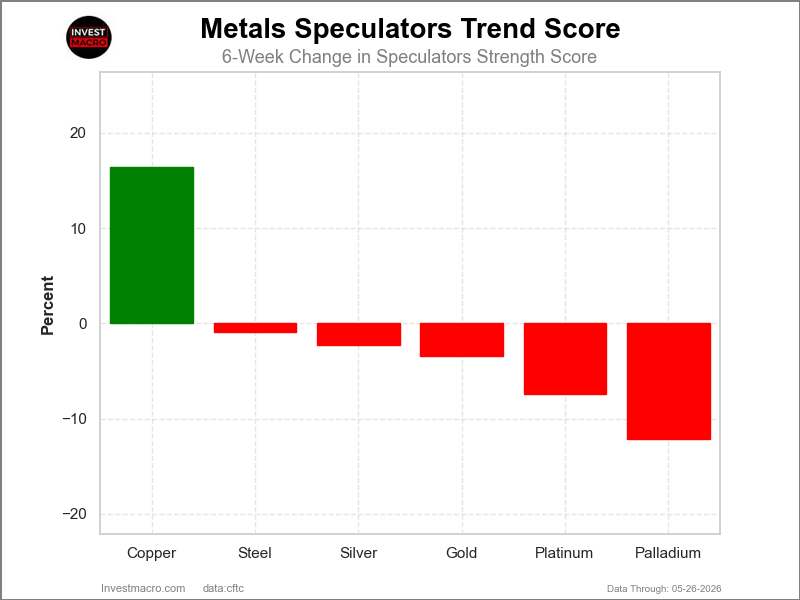
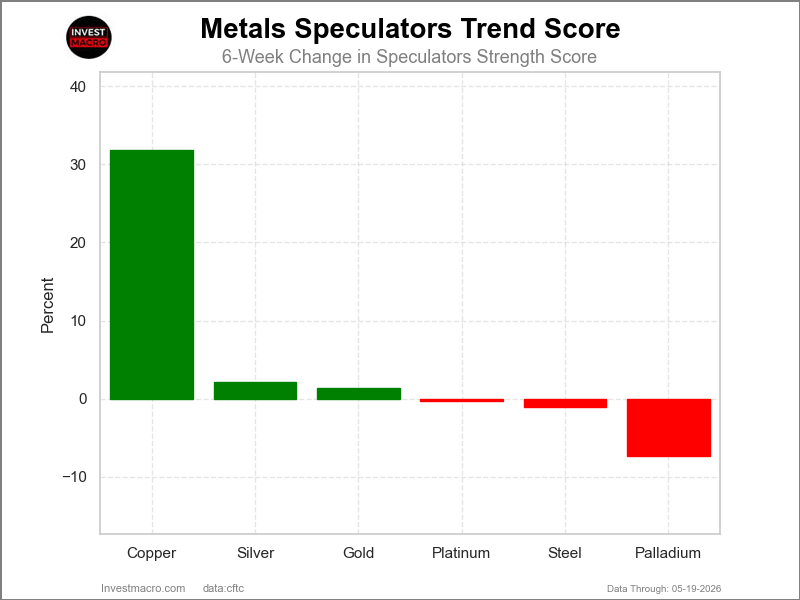
Copper & Platinum top the 6-Week Strength Trends
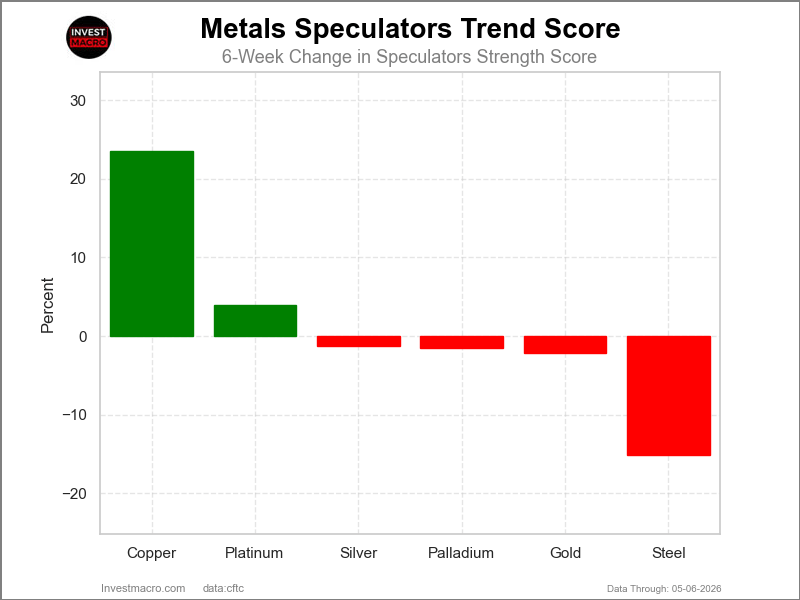
COT Strength Score Trends (or move index, calculates the 6-week changes in strength scores) showed that Copper (24 percent) and Platinum (4 percent) lead the past six weeks trends for metals.
Steel (-15 percent) leads the downside trend scores currently with Gold (-2.1 percent) as the next market with lower trend scores.
Move Statistics:
Gold (-2.1 percent) vs Gold previous week (-0.1 percent)
Silver (-1.3 percent) vs Silver previous week (3.8 percent)
Copper (23.6 percent) vs Copper previous week (14.2 percent)
Platinum (4.0 percent) vs Platinum previous week (4.1 percent)
Palladium (-1.5 percent) vs Palladium previous week (-8.4 percent)
Steel (-15.2 percent) vs Steel previous week (-8.5 percent)
Individual Markets:
Gold Comex Futures Futures:
 Positioning Notes:
- Gold Comex Futures large speculator standing this week resulted in a net position of 163,303 contracts in the data reported through Tuesday.
- Weekly Speculator position rise of 3,732 contracts from the previous week which had a total of 159,571 net contracts.
- This week’s current strength score (range over the past 3 years, measured from 0 to 100) shows the speculators are currently Bearish with a score of 37.7 percent.
- The Commercials are Bullish with a score of 56.5 percent.
- The Small Traders (not shown in chart) are Bullish with a score of 70.1 percent.
Price Trend-Following Model: Weak Uptrend
Our weekly trend-following model classifies the current market price position as: Weak Uptrend.
| Gold Futures Statistics | SPECULATORS | COMMERCIALS | SMALL TRADERS |
| – Percent of Open Interest Longs: | 57.6 | 15.8 | 13.4 |
| – Percent of Open Interest Shorts: | 13.2 | 69.9 | 3.7 |
| – Net Position: | 163,303 | -198,935 | 35,632 |
| – Gross Longs: | 211,814 | 58,230 | 49,252 |
| – Gross Shorts: | 48,511 | 257,165 | 13,620 |
| – Long to Short Ratio: | 4.4 to 1 | 0.2 to 1 | 3.6 to 1 |
| NET POSITION TREND: | | | |
| – Strength Index Score (3 Year Range Pct): | 37.7 | 56.5 | 70.1 |
| – Strength Index Reading (3 Year Range): | Bearish | Bullish | Bullish |
| NET POSITION MOVEMENT INDEX: | | | |
| – 6-Week Change in Strength Index: | -2.1 | 2.0 | 0.4 |
Silver Comex Futures Futures:
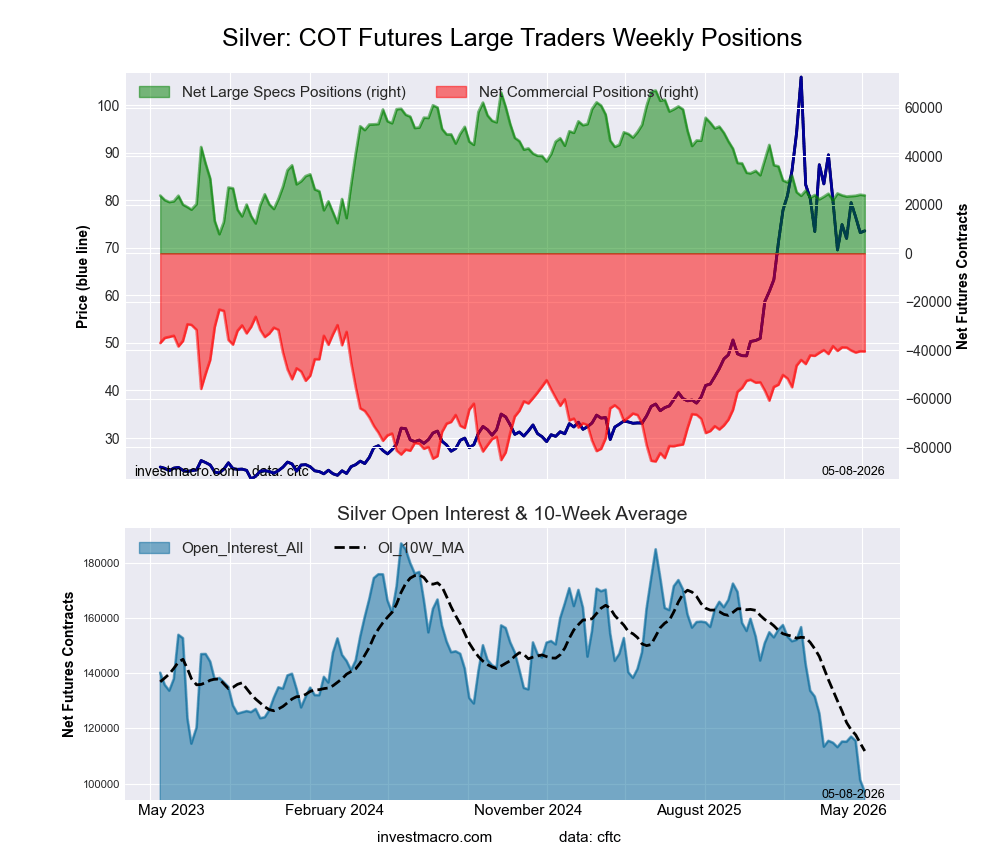 Positioning Notes:
- Silver Comex Futures large speculator standing this week resulted in a net position of 23,892 contracts in the data reported through Tuesday.
- Weekly Speculator position decrease of -268 contracts from the previous week which had a total of 24,160 net contracts.
- This week’s current strength score (range over the past 3 years, measured from 0 to 100) shows the speculators are currently Bearish with a score of 27.0 percent.
- The Commercials are Bullish with a score of 72.4 percent.
- The Small Traders (not shown in chart) are Bearish with a score of 44.3 percent.
Price Trend-Following Model: Weak Downtrend
Our weekly trend-following model classifies the current market price position as: Weak Downtrend.
| Silver Futures Statistics | SPECULATORS | COMMERCIALS | SMALL TRADERS |
| – Percent of Open Interest Longs: | 34.0 | 26.9 | 26.6 |
| – Percent of Open Interest Shorts: | 9.4 | 68.7 | 9.5 |
| – Net Position: | 23,892 | -40,535 | 16,643 |
| – Gross Longs: | 32,965 | 26,094 | 25,811 |
| – Gross Shorts: | 9,073 | 66,629 | 9,168 |
| – Long to Short Ratio: | 3.6 to 1 | 0.4 to 1 | 2.8 to 1 |
| NET POSITION TREND: | | | |
| – Strength Index Score (3 Year Range Pct): | 27.0 | 72.4 | 44.3 |
| – Strength Index Reading (3 Year Range): | Bearish | Bullish | Bearish |
| NET POSITION MOVEMENT INDEX: | | | |
| – 6-Week Change in Strength Index: | -1.3 | -0.4 | 5.7 |
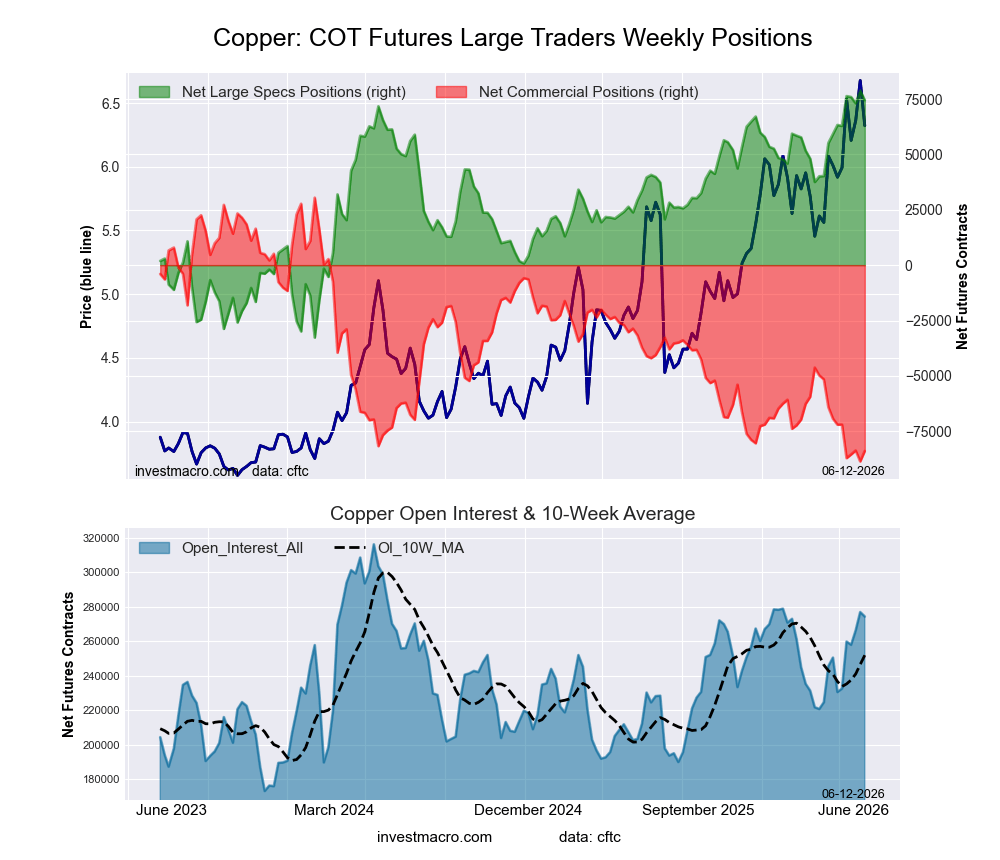
Copper Grade #1 Futures Futures:
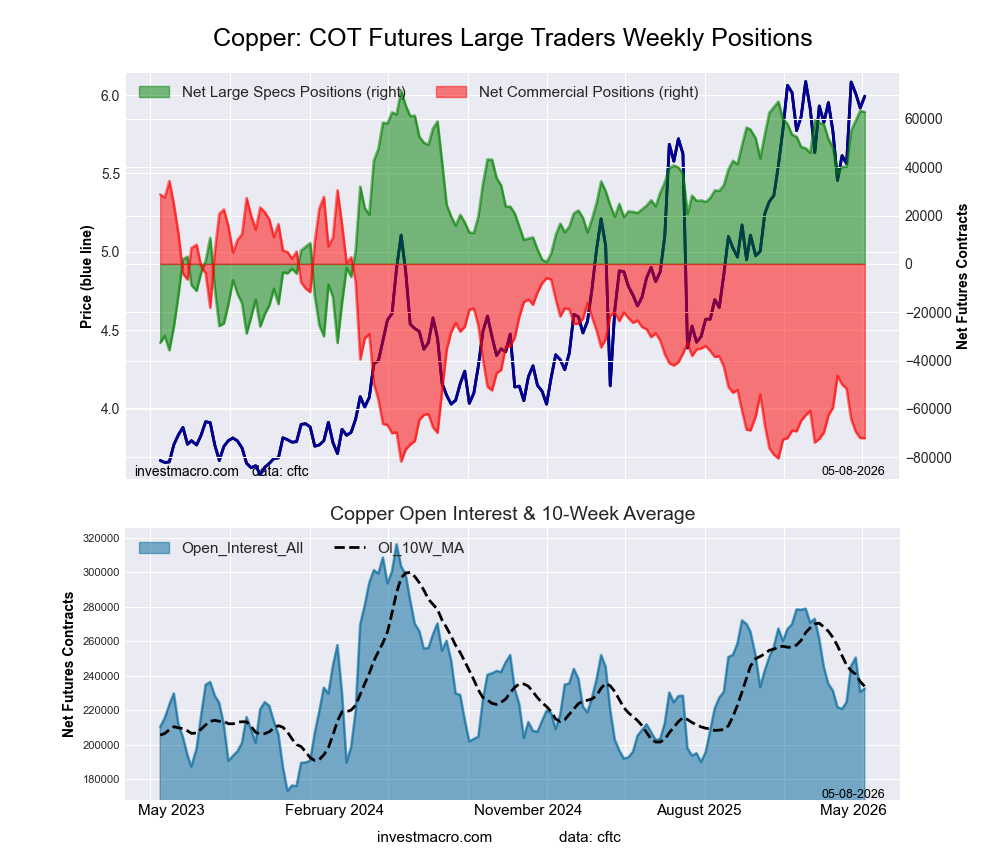 Positioning Notes:
- Copper Grade #1 Futures large speculator standing this week resulted in a net position of 62,849 contracts in the data reported through Tuesday.
- Weekly Speculator position reduction of -432 contracts from the previous week which had a total of 63,281 net contracts.
- This week’s current strength score (range over the past 3 years, measured from 0 to 100) shows the speculators are currently Bullish-Extreme with a score of 91.8 percent.
- The Commercials are Bearish-Extreme with a score of 8.4 percent.
- The Small Traders (not shown in chart) are Bullish with a score of 61.7 percent.
Price Trend-Following Model: Strong Uptrend
Our weekly trend-following model classifies the current market price position as: Strong Uptrend.
| Copper Futures Statistics | SPECULATORS | COMMERCIALS | SMALL TRADERS |
| – Percent of Open Interest Longs: | 41.4 | 35.6 | 7.7 |
| – Percent of Open Interest Shorts: | 14.4 | 66.6 | 3.7 |
| – Net Position: | 62,849 | -72,017 | 9,168 |
| – Gross Longs: | 96,261 | 82,829 | 17,854 |
| – Gross Shorts: | 33,412 | 154,846 | 8,686 |
| – Long to Short Ratio: | 2.9 to 1 | 0.5 to 1 | 2.1 to 1 |
| NET POSITION TREND: | | | |
| – Strength Index Score (3 Year Range Pct): | 91.8 | 8.4 | 61.7 |
| – Strength Index Reading (3 Year Range): | Bullish-Extreme | Bearish-Extreme | Bullish |
| NET POSITION MOVEMENT INDEX: | | | |
| – 6-Week Change in Strength Index: | 23.6 | -22.2 | 2.1 |
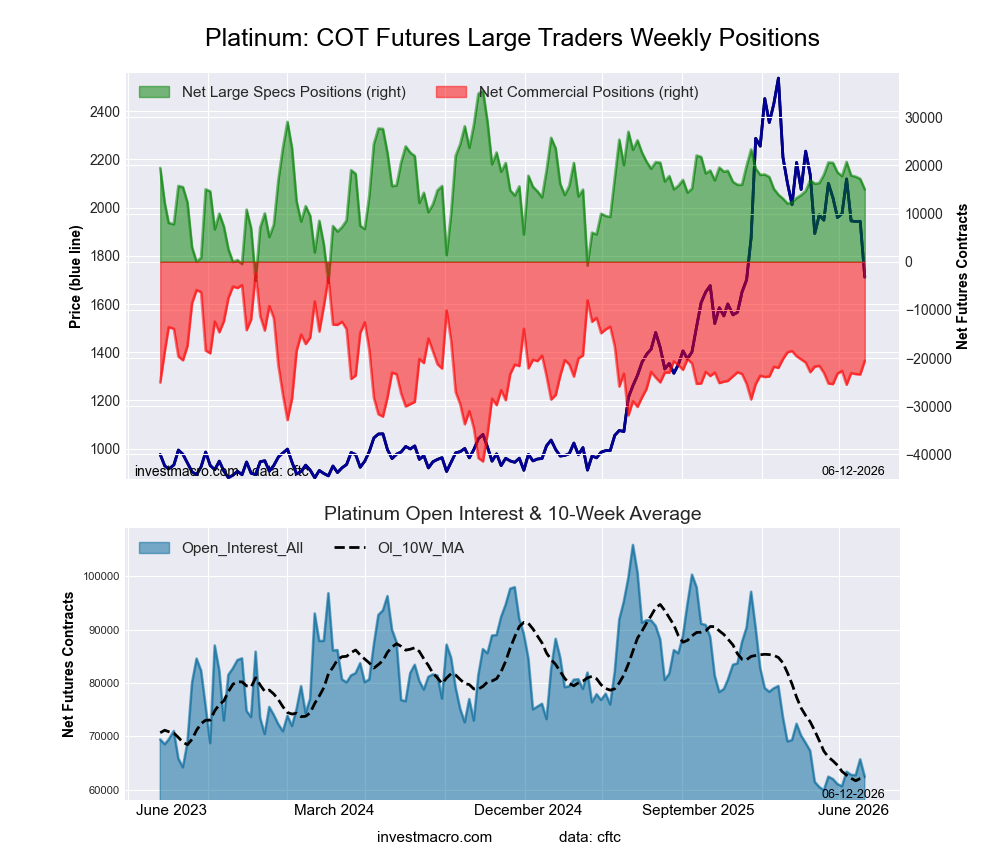
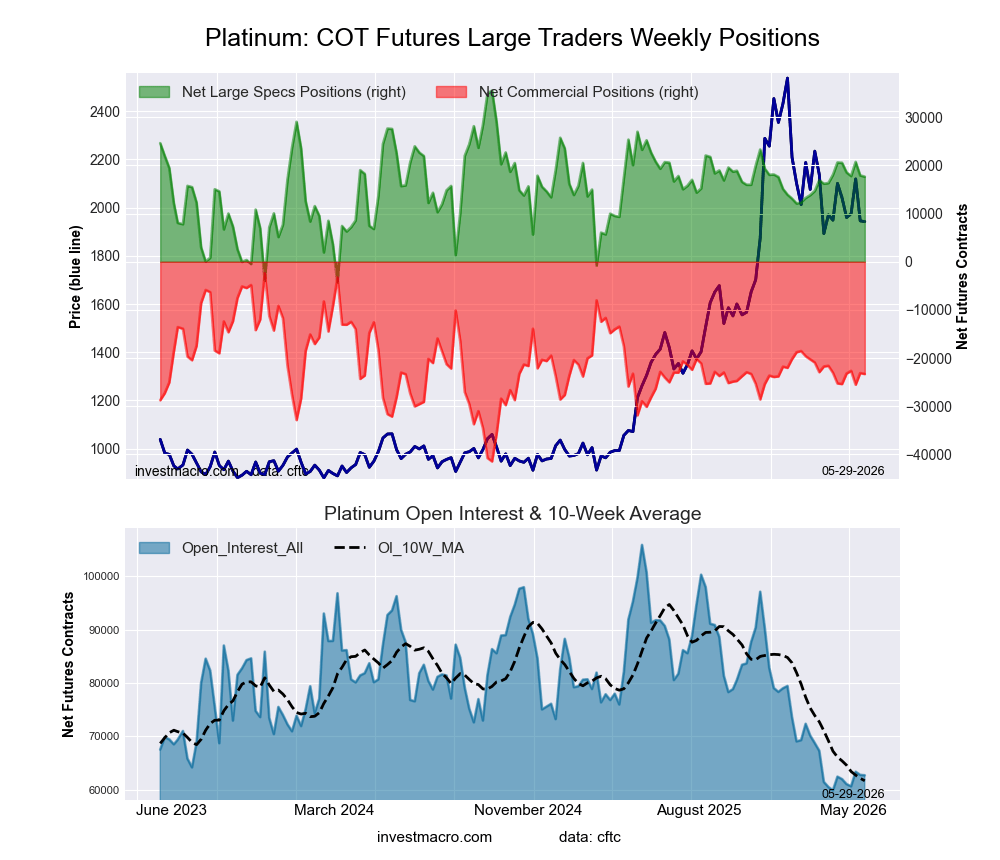
Platinum Futures Futures:
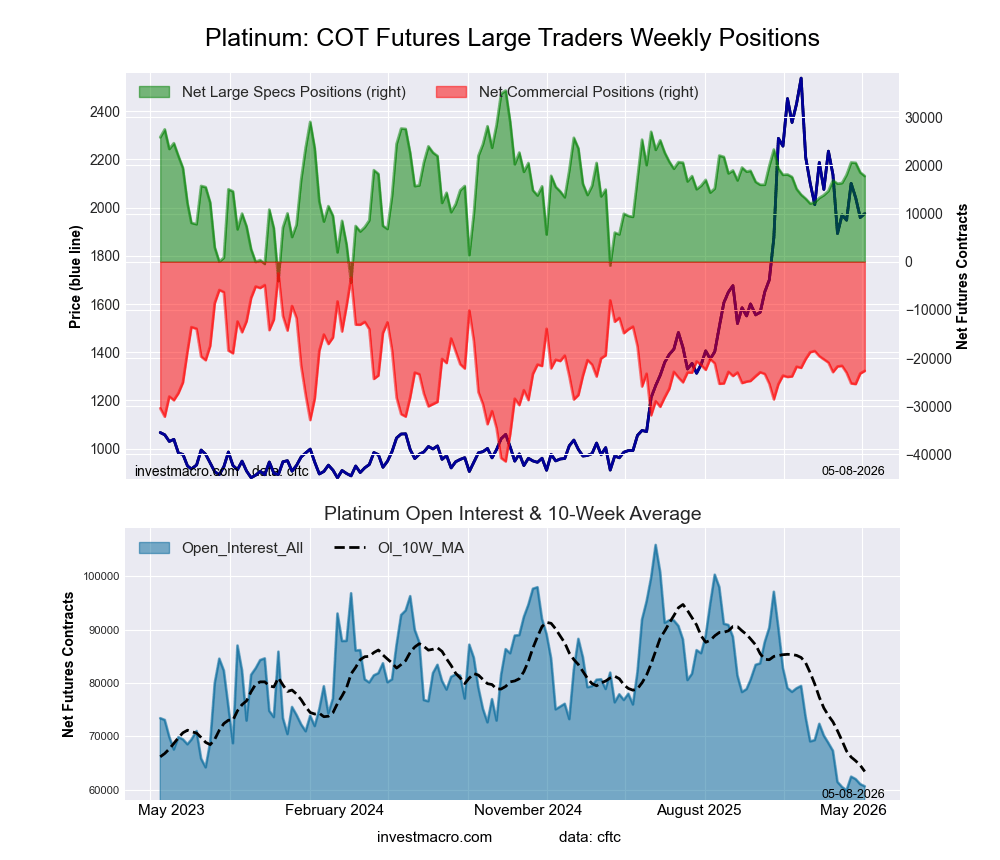 Positioning Notes:
- Platinum Futures large speculator standing this week resulted in a net position of 17,785 contracts in the data reported through Tuesday.
- Weekly Speculator position lowering of -765 contracts from the previous week which had a total of 18,550 net contracts.
- This week’s current strength score (range over the past 3 years, measured from 0 to 100) shows the speculators are currently Bullish with a score of 55.5 percent.
- The Commercials are Bearish with a score of 48.1 percent.
- The Small Traders (not shown in chart) are Bullish with a score of 54.6 percent.
Price Trend-Following Model: Downtrend
Our weekly trend-following model classifies the current market price position as: Downtrend.
| Platinum Futures Statistics | SPECULATORS | COMMERCIALS | SMALL TRADERS |
| – Percent of Open Interest Longs: | 44.0 | 29.1 | 13.4 |
| – Percent of Open Interest Shorts: | 14.6 | 66.5 | 5.4 |
| – Net Position: | 17,785 | -22,651 | 4,866 |
| – Gross Longs: | 26,668 | 17,659 | 8,130 |
| – Gross Shorts: | 8,883 | 40,310 | 3,264 |
| – Long to Short Ratio: | 3.0 to 1 | 0.4 to 1 | 2.5 to 1 |
| NET POSITION TREND: | | | |
| – Strength Index Score (3 Year Range Pct): | 55.5 | 48.1 | 54.6 |
| – Strength Index Reading (3 Year Range): | Bullish | Bearish | Bullish |
| NET POSITION MOVEMENT INDEX: | | | |
| – 6-Week Change in Strength Index: | 4.0 | -2.3 | -7.9 |
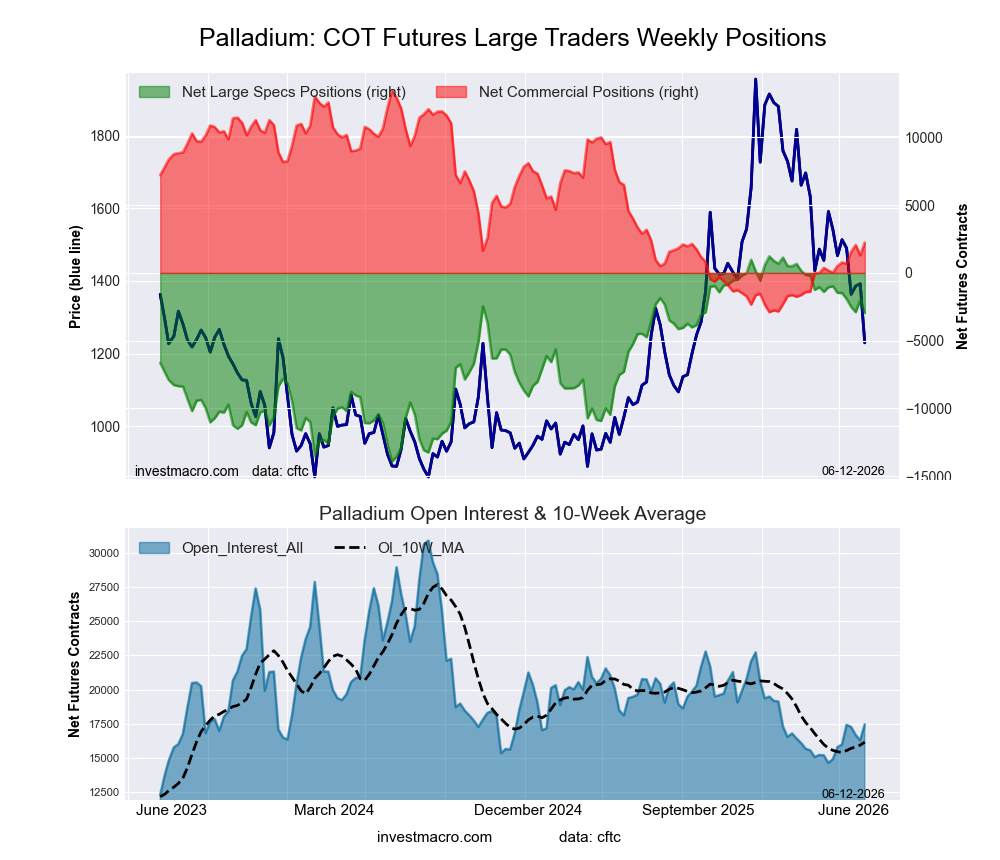
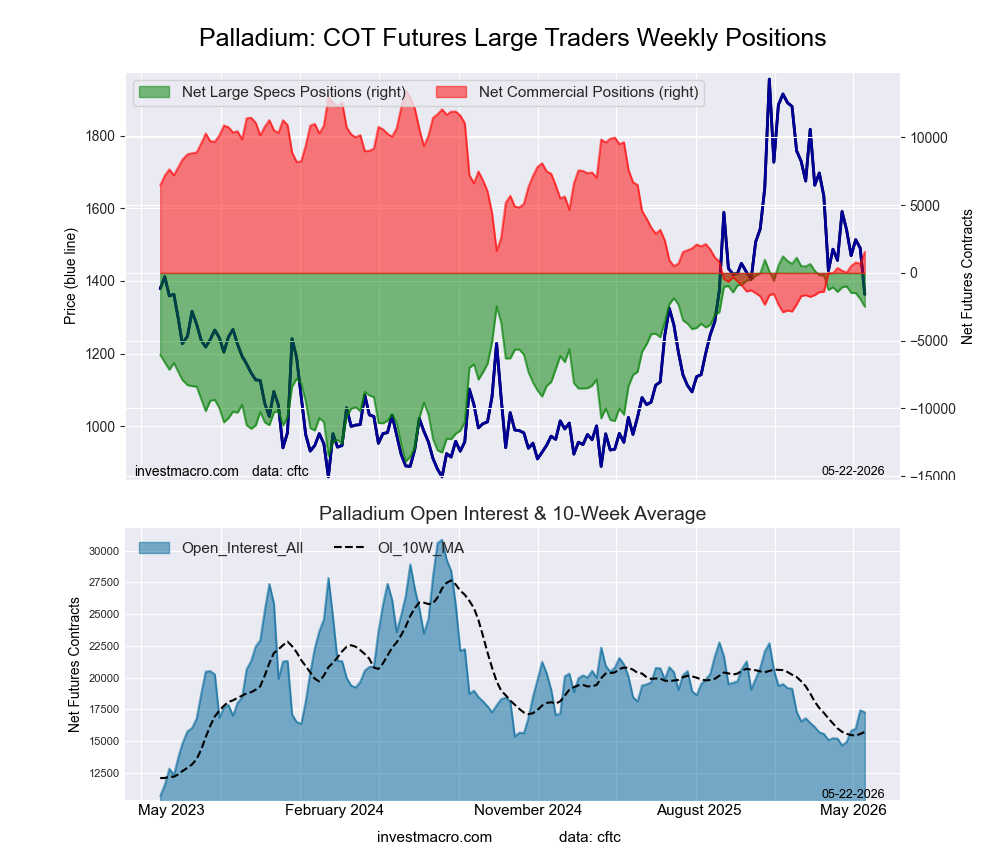
Palladium Futures Futures:
 Positioning Notes:
- Palladium Futures large speculator standing this week resulted in a net position of -1,476 contracts in the data reported through Tuesday.
- Weekly Speculator position decline of -12 contracts from the previous week which had a total of -1,464 net contracts.
- This week’s current strength score (range over the past 3 years, measured from 0 to 100) shows the speculators are currently Bullish-Extreme with a score of 82.2 percent.
- The Commercials are Bearish with a score of 22.4 percent.
- The Small Traders (not shown in chart) are Bearish with a score of 44.4 percent.
Price Trend-Following Model: Downtrend
Our weekly trend-following model classifies the current market price position as: Downtrend.
| Palladium Futures Statistics | SPECULATORS | COMMERCIALS | SMALL TRADERS |
| – Percent of Open Interest Longs: | 40.0 | 39.3 | 14.4 |
| – Percent of Open Interest Shorts: | 49.3 | 34.5 | 10.0 |
| – Net Position: | -1,476 | 775 | 701 |
| – Gross Longs: | 6,402 | 6,289 | 2,307 |
| – Gross Shorts: | 7,878 | 5,514 | 1,606 |
| – Long to Short Ratio: | 0.8 to 1 | 1.1 to 1 | 1.4 to 1 |
| NET POSITION TREND: | | | |
| – Strength Index Score (3 Year Range Pct): | 82.2 | 22.4 | 44.4 |
| – Strength Index Reading (3 Year Range): | Bullish-Extreme | Bearish | Bearish |
| NET POSITION MOVEMENT INDEX: | | | |
| – 6-Week Change in Strength Index: | -1.5 | 4.8 | -19.1 |
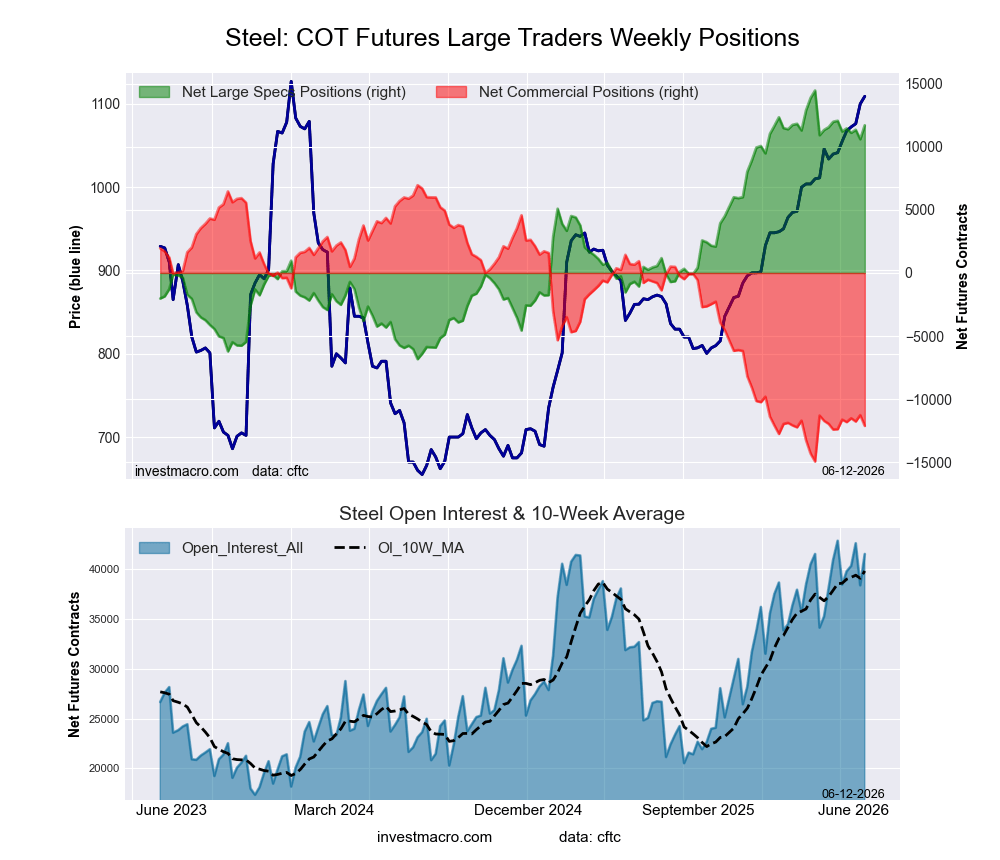
Steel Futures Futures:
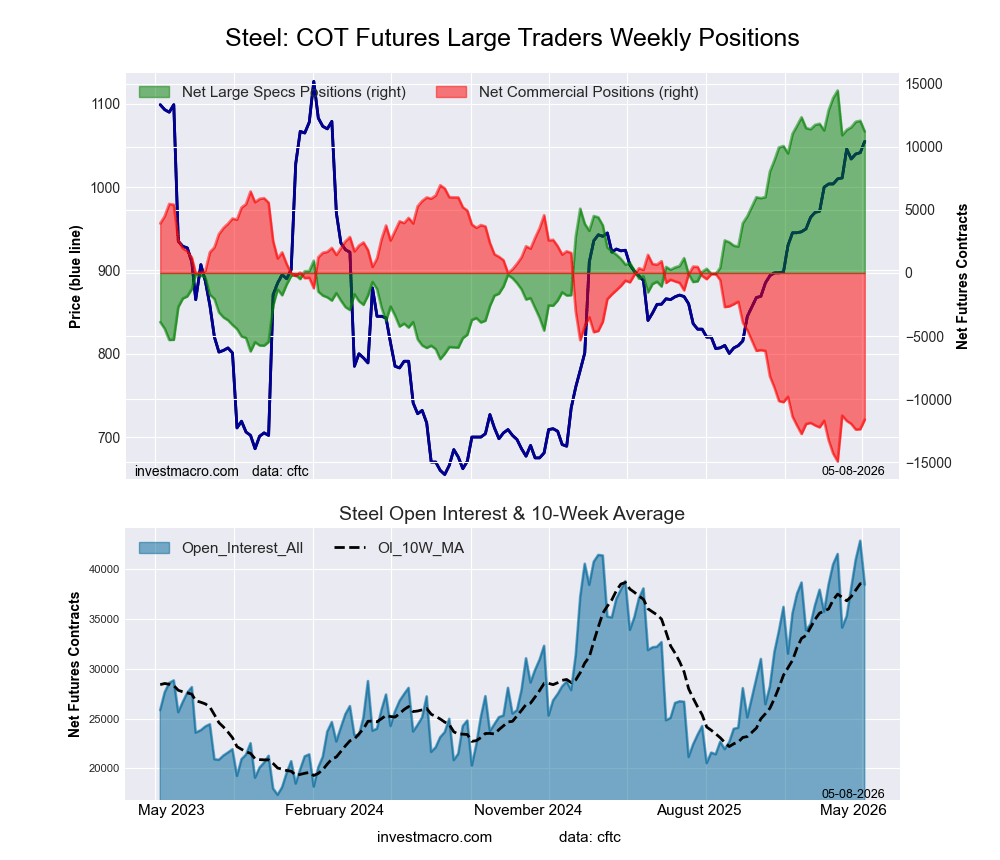 Positioning Notes:
- Steel Futures large speculator standing this week resulted in a net position of 11,217 contracts in the data reported through Tuesday.
- Weekly Speculator position lowering of -849 contracts from the previous week which had a total of 12,066 net contracts.
- This week’s current strength score (range over the past 3 years, measured from 0 to 100) shows the speculators are currently Bullish-Extreme with a score of 84.8 percent.
- The Commercials are Bearish-Extreme with a score of 15.1 percent.
- The Small Traders (not shown in chart) are Bullish-Extreme with a score of 89.9 percent.
Price Trend-Following Model: Uptrend
Our weekly trend-following model classifies the current market price position as: Uptrend.
| Steel Futures Statistics | SPECULATORS | COMMERCIALS | SMALL TRADERS |
| – Percent of Open Interest Longs: | 32.5 | 64.3 | 1.3 |
| – Percent of Open Interest Shorts: | 3.4 | 94.6 | 0.2 |
| – Net Position: | 11,217 | -11,631 | 414 |
| – Gross Longs: | 12,516 | 24,734 | 483 |
| – Gross Shorts: | 1,299 | 36,365 | 69 |
| – Long to Short Ratio: | 9.6 to 1 | 0.7 to 1 | 7.0 to 1 |
| NET POSITION TREND: | | | |
| – Strength Index Score (3 Year Range Pct): | 84.8 | 15.1 | 89.9 |
| – Strength Index Reading (3 Year Range): | Bullish-Extreme | Bearish-Extreme | Bullish-Extreme |
| NET POSITION MOVEMENT INDEX: | | | |
| – 6-Week Change in Strength Index: | -15.2 | 15.1 | -8.9 |
Article By InvestMacro – Receive our weekly COT Newsletter
*COT Report: The COT data, released weekly to the public each Friday, is updated through the most recent Tuesday (data is 3 days old) and shows a quick view of how large speculators or non-commercials (for-profit traders) were positioned in the futures markets.
The CFTC categorizes trader positions according to commercial hedgers (traders who use futures contracts for hedging as part of the business), non-commercials (large traders who speculate to realize trading profits) and nonreportable traders (usually small traders/speculators) as well as their open interest (contracts open in the market at time of reporting). See CFTC criteria here.