
By RoboForex Analytical Department
Gold soared towards 2,800 USD per ounce on Friday, setting a new all-time high. The surge comes as investors seek refuge in safe-haven assets amid renewed trade war threats from US President Donald Trump. His latest statements have heightened concerns over economic slowdowns and potential disruptions to global trade.
Key drivers of Gold’s record rally
Global monetary easing is reinforcing Gold’s rally. Several major central banks have adopted a softer stance, increasing liquidity and keeping interest rates low, further supporting the appeal of non-yielding assets like Gold.
- The European Central Bank (ECB) cut rates as expected, leaving room for further easing
- The Bank of Canada (BoC) halted quantitative tightening
- Sweden’s Riksbank also cut rates earlier in the week
- The People’s Bank of China (PBoC) and the Reserve Bank of India (RBI) signalled their willingness to ease policy further and inject liquidity
Meanwhile, the US Federal Reserve kept rates unchanged this week, maintaining expectations for at least two rate cuts later this year.
With all these factors, Gold is on track for its biggest monthly gain since March 2024.
Free Reports:
 Get our Weekly Commitment of Traders Reports - See where the biggest traders (Hedge Funds and Commercial Hedgers) are positioned in the futures markets on a weekly basis.
 Sign Up for Our Stock Market Newsletter – Get updated on News, Charts & Rankings of Public Companies when you join our Stocks Newsletter
Technical analysis of XAU/USD

On the H4 chart, Gold found support at 2,731 USD and extended its rally to 2,797 USD. A consolidation range is forming around this level.
- If the range breaks downward, a correction to 2,772 USD is possible
- If the range breaks upward, a growth wave towards 2,818 USD may develop, potentially extending further to 2,839 USD
This scenario is supported by the MACD indicator, which has its signal line above zero and points upwards, confirming bullish momentum.
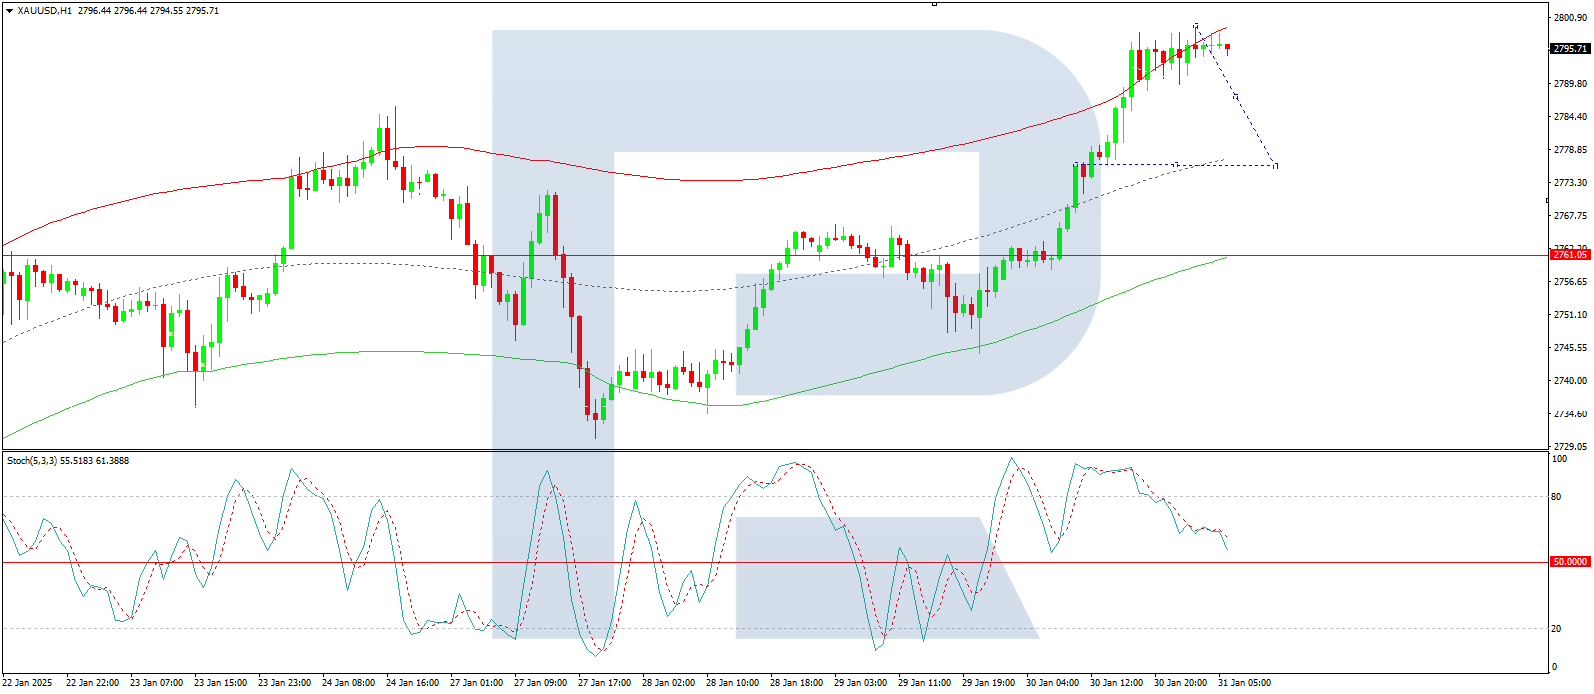
On the H1 chart, Gold initially formed a consolidation range near 2,772 USD before breaking upwards, reaching 2,797 USD.
- A continuation of the rally towards 2,808 USD is likely.
- After reaching 2,808 USD, a pullback to 2,777 USD (testing support) is possible
- Following the correction, further growth towards 2,818 USD and potentially 2,839 USD is expected
The Stochastic oscillator supports this XAU/USD outlook, with its signal line above 50 and preparing for an upward move towards 80, indicating more upside potential.
Conclusion
Gold’s record-high surge reflects heightened risk aversion and global monetary easing. With central banks cutting rates and Trump’s trade threats unsettling markets, demand for Gold remains strong. Technical indicators suggest further upside, with key resistance levels at 2,818 USD and 2,839 USD. However, short-term corrections towards 2,772 USD or 2,777 USD could provide buying opportunities before the uptrend resumes.
Disclaimer
Any forecasts contained herein are based on the author’s particular opinion. This analysis may not be treated as trading advice. RoboForex bears no responsibility for trading results based on trading recommendations and reviews contained herein.

- The US Tech sector hit by sell‑off. Oil prices decline on renewed negotiations Jul 28, 2026
- Gold Declines, Focus on Fed and Falling Oil Prices Jul 28, 2026
- This week will be one of the most crowded for central‑bank meetings Jul 27, 2026
- EUR/USD Ahead of a Key Week: Holding Near Lows Jul 27, 2026
- COT Metals Charts: Weekly Speculator Changes led by Copper Jul 26, 2026
- COT Bonds Charts: Speculator Bets led by SOFR 3-Months & 5-Year Bonds Jul 26, 2026
- COT Energy Charts: Weekly Speculator Bets led by WTI Crude & Natural Gas Jul 26, 2026
- COT Soft Commodities Charts: Weekly Speculator Bets led by Corn & Soybeans Jul 26, 2026
- The US introduces new import tariffs for 60 countries. Brent crude surpasses $100 per barrel Jul 24, 2026
- USD/JPY Breaks Records: Nothing Slows the Yen’s Decline Jul 24, 2026