
By Analytical Department RoboForex
Gold is holding at around 4,611 USD per ounce on Monday as markets assess Donald Trump’s proposal to escort commercial vessels through the Strait of Hormuz, alongside tentative signs of progress in US–Iran negotiations.
The plan involves assisting civilian ships from neutral countries in safely leaving the conflict zone and restoring access to the shipping route. At the same time, Iran has stated that it is reviewing the US response to its latest proposal, which has helped support hopes for a diplomatic resolution.
However, the conflict, now entering its tenth week, continues to drive energy prices higher and intensify inflationary pressures. This has reinforced expectations that central banks may keep interest rates elevated for longer, or even tighten policy further if inflation risks persist.
Since the beginning of the confrontation, gold has remained under pressure and has lost around 12% of its value. At the same time, data from the World Gold Council show that central banks continue to increase their gold reserves, providing underlying support for long-term demand.
Technical Analysis
Free Reports:
 Sign Up for Our Stock Market Newsletter – Get updated on News, Charts & Rankings of Public Companies when you join our Stocks Newsletter
 Get our Weekly Commitment of Traders Reports - See where the biggest traders (Hedge Funds and Commercial Hedgers) are positioned in the futures markets on a weekly basis.
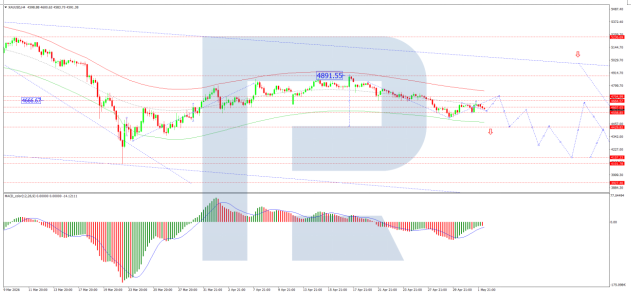
On the H4 chart, XAU/USD is consolidating above the 4,600 USD evel. A move higher could open the way for a corrective rebound towards 4,704 USD. On the downside, a fresh decline towards 4,430 USD cannot be ruled out. The MACD indicator supports the current recovery bias: the signal line remains below the zero mark but continues to point firmly upwards, indicating strengthening bullish momentum.
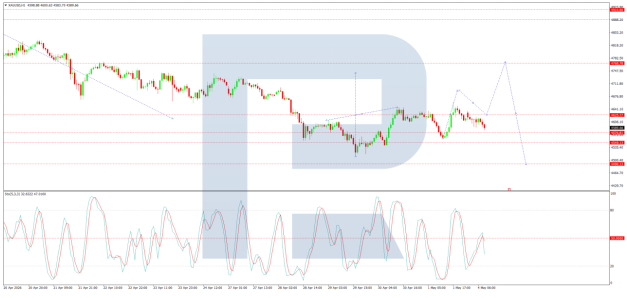
On the H1 chart, the market has broken below the 4,620 USD level and is extending its move towards 4,580. In the near term, a rebound towards 4,690 USD remains possible as a retest from below, followed by a potential pullback to 4,625 USD. After that, a further move higher towards 4,741 USD may develop. The Stochastic oscillator supports this scenario, with the signal line remaining below 50 and pointing lower towards 20, signalling short-term downside pressure.
Conclusion
Gold remains caught between cautious optimism over diplomacy and persistent inflation risks driven by the Middle East conflict. While short-term price action remains fragile, continued central bank demand and geopolitical uncertainty are likely to provide underlying support for gold in the medium to longer term.
Disclaimer
Any forecasts contained herein are based on the author’s particular opinion. This analysis may not be treated as trading advice. RoboForex bears no responsibility for trading results based on trading recommendations and reviews contained herein.

- The US introduces new import tariffs for 60 countries. Brent crude surpasses $100 per barrel Jul 24, 2026
- USD/JPY Breaks Records: Nothing Slows the Yen’s Decline Jul 24, 2026
- Oil prices reached a 6‑week high. The AUD strengthened on the back of a strong labor‑market report Jul 23, 2026
- EUR/USD Recovers as Dollar Weakens Jul 23, 2026
- Bitcoin rose to $66,000. The New Zealand dollar continues to strengthen Jul 22, 2026
- Inflationary pressure is easing in Canada. In New Zealand, on the contrary, inflation is rising Jul 21, 2026
- GBP/USD Falls After Cabinet Changes Jul 21, 2026
- Geopolitical and macroeconomic conditions continue to pressure market sentiment Jul 20, 2026
- USD/JPY Poised to Continue Gains as Expensive Oil and Lack of Support Weigh on Yen Jul 20, 2026
- COT Metals Charts: Weekly Speculator Bets led by Copper & Steel Jul 18, 2026
