
By InvestMacro
Here are the latest charts and statistics for the Commitment of Traders (COT) data published by the Commodities Futures Trading Commission (CFTC).
The latest COT data is updated through Tuesday May 19th and shows a quick view of how large traders (for-profit speculators and commercial entities) were positioned in the futures markets.
Weekly Metals Speculator Bets lower across the board
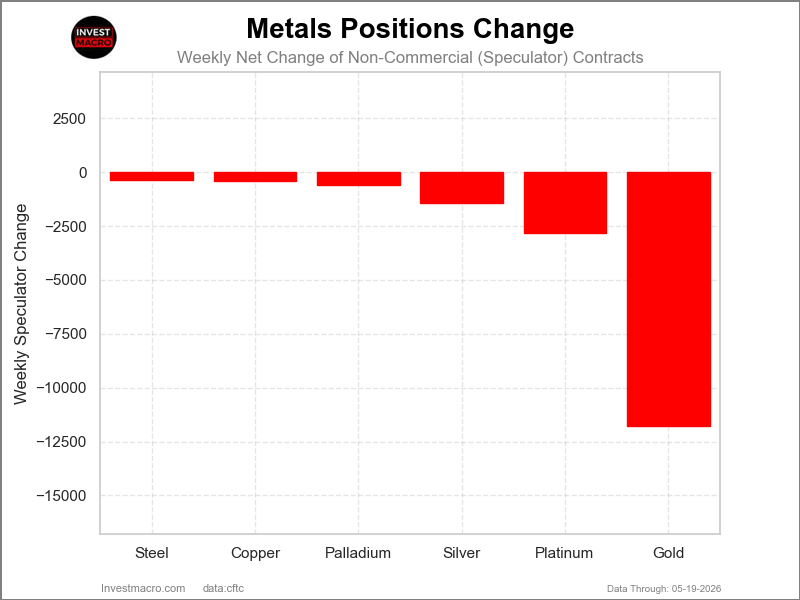
The COT metals markets speculator bets were overall lower this week as all of the six metals markets we cover had lower positioning.
Leading the declines in speculator bets for the week was Gold (-11,789 contracts) with Platinum (-2,804 contracts) and Silver (-1,440 contracts), Palladium (-582 contracts), Copper (-423 contracts) and Steel (-350 contracts) also having lower bets on the week.
The metals markets speculator positions continue to cool off after a roaring start to the year that had seen record high price levels almost across the board for the metals. Copper and Steel continue to have strong speculative positions as well as strong price trends. These two markets remain in extreme bullish strength levels (above 80%) currently (which shows their current levels across a range of the past three years) while the other precious metals (gold, silver, platinum, palladium) have seen their speculator bets come down as well as their price levels have come back down to earth in the second quarter.
Free Reports:
 Sign Up for Our Stock Market Newsletter – Get updated on News, Charts & Rankings of Public Companies when you join our Stocks Newsletter
 Get our Weekly Commitment of Traders Reports - See where the biggest traders (Hedge Funds and Commercial Hedgers) are positioned in the futures markets on a weekly basis.
Copper leads the Metals Market price performance.
Copper was the leading gainer for the Precious Metals price performance this week with a 2.38% gain. Steel came in next with a 0.65% uptick while Silver rounded out the gainers with a 0.62% rise.
On the downside, Gold was lower by less than a percent with a -0.80% decrease and was followed by Platinum which fell by -1.88%. Palladium was the biggest decliner over the past five days with a -3.34% drop.
Metals Data:
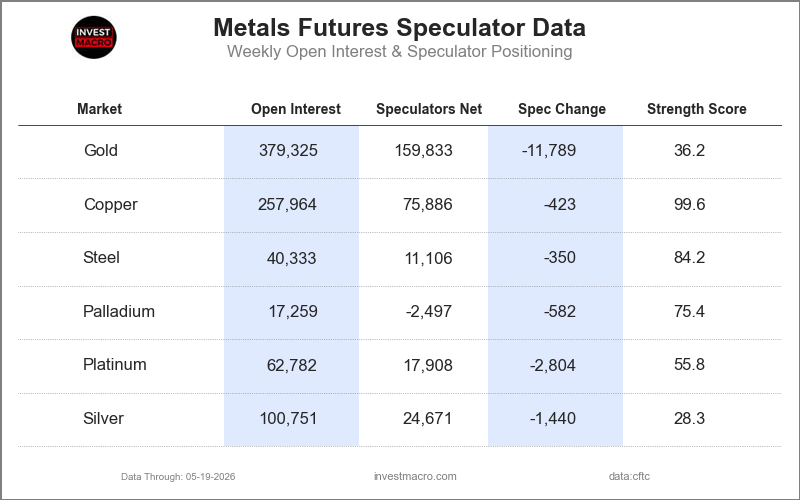
Legend: Weekly Speculators Change | Speculators Current Net Position | Speculators Strength Score compared to last 3-Years (0-100 range)
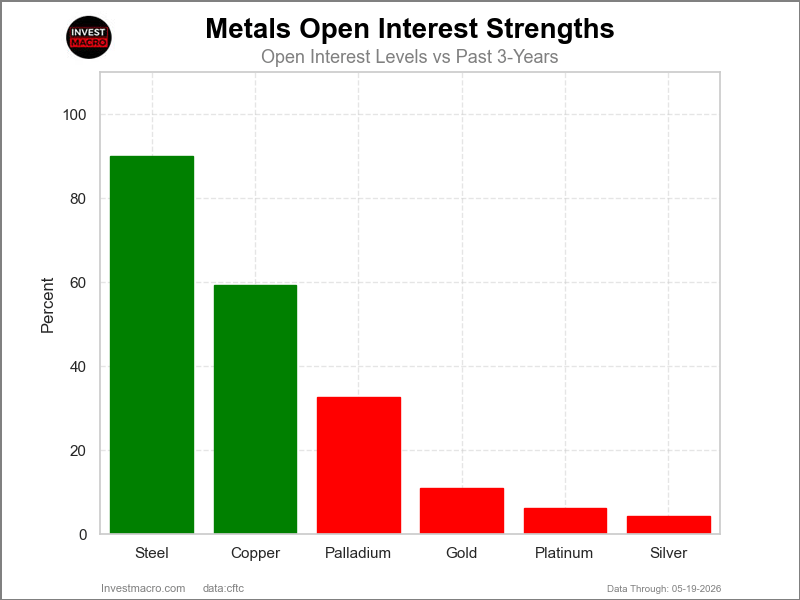
Strength Scores led by Copper & Steel
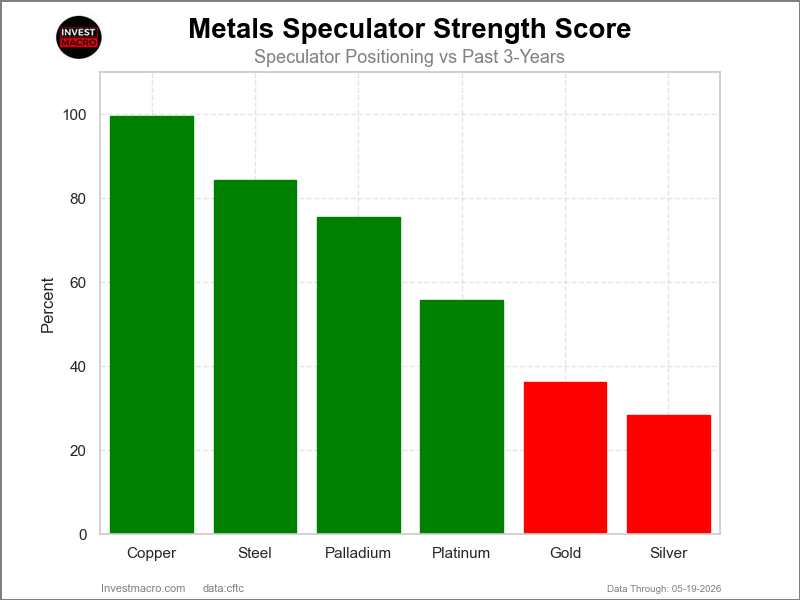
COT Strength Scores (a normalized measure of Speculator positions over a 3-Year range, from 0 to 100 where above 80 is Extreme-Bullish and below 20 is Extreme-Bearish) showed that Copper (100 percent) and Steel (84 percent) lead the metals markets this week.
On the downside, Silver (28 percent) and Gold (36 percent) come in at the lowest strength level currently.
Strength Statistics:
Gold (36.2 percent) vs Gold previous week (41.1 percent)
Silver (28.3 percent) vs Silver previous week (30.8 percent)
Copper (99.6 percent) vs Copper previous week (100.0 percent)
Platinum (55.8 percent) vs Platinum previous week (62.8 percent)
Palladium (75.4 percent) vs Palladium previous week (79.3 percent)
Steel (84.2 percent) vs Steel previous week (85.9 percent)
Copper & Silver top the 6-Week Strength Trends
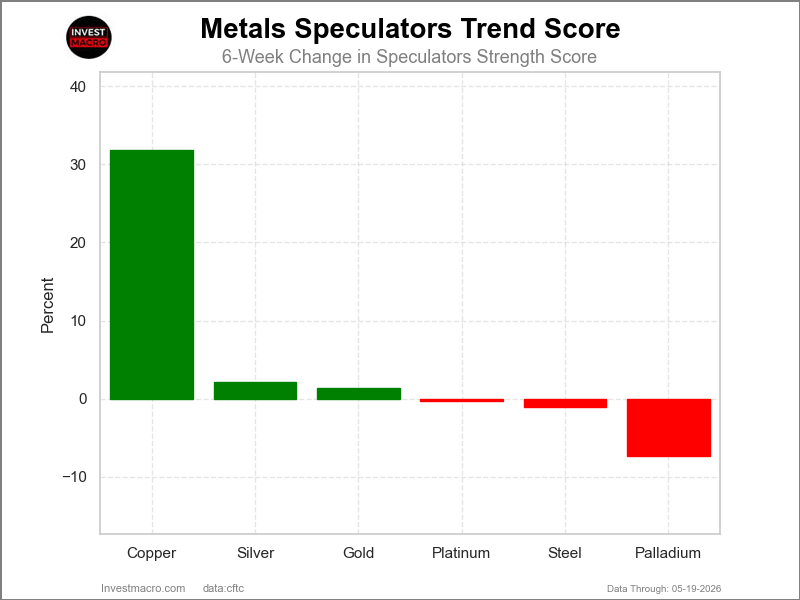
COT Strength Score Trends (or move index, calculates the 6-week changes in strength scores) showed that Copper (32 percent) and Silver (2 percent) lead the past six weeks trends for metals. Gold (1.4 percent) is the next highest positive mover in the latest trends data.
Palladium (-7 percent) leads the downside trend scores currently with Steel (-1 percent) as the next market with lower trend scores.
Move Statistics:
Gold (1.4 percent) vs Gold previous week (3.5 percent)
Silver (2.1 percent) vs Silver previous week (3.7 percent)
Copper (31.8 percent) vs Copper previous week (32.3 percent)
Platinum (-0.3 percent) vs Platinum previous week (11.0 percent)
Palladium (-7.3 percent) vs Palladium previous week (-5.7 percent)
Steel (-1.1 percent) vs Steel previous week (2.5 percent)
Individual Markets:
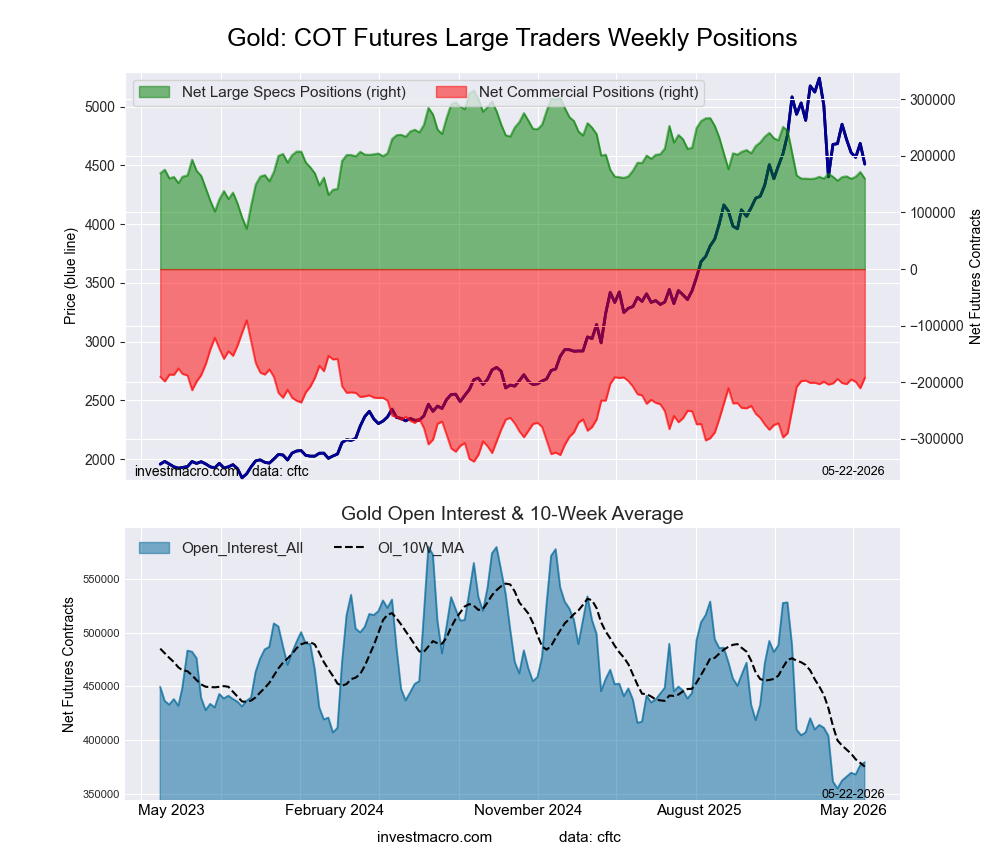
Gold Comex Futures Futures:
 Positioning Notes:
- Gold Comex Futures large speculator standing this week resulted in a net position of 159,833 contracts in the data reported through Tuesday.
- Weekly Speculator position fall of -11,789 contracts from the previous week which had a total of 171,622 net contracts.
- This week’s current strength score (range over the past 3 years, measured from 0 to 100) shows the speculators are currently Bearish with a score of 36.2 percent.
- The Commercials are Bullish with a score of 59.4 percent.
- The Small Traders (not shown in chart) are Bullish with a score of 58.9 percent.
Price Trend-Following Model: Downtrend
Our weekly trend-following model classifies the current market price position as: Downtrend.
| Gold Futures Statistics | SPECULATORS | COMMERCIALS | SMALL TRADERS |
| – Percent of Open Interest Longs: | 55.6 | 18.3 | 12.4 |
| – Percent of Open Interest Shorts: | 13.5 | 68.8 | 4.0 |
| – Net Position: | 159,833 | -191,629 | 31,796 |
| – Gross Longs: | 211,018 | 69,520 | 47,082 |
| – Gross Shorts: | 51,185 | 261,149 | 15,286 |
| – Long to Short Ratio: | 4.1 to 1 | 0.3 to 1 | 3.1 to 1 |
| NET POSITION TREND: | |||
| – Strength Index Score (3 Year Range Pct): | 36.2 | 59.4 | 58.9 |
| – Strength Index Reading (3 Year Range): | Bearish | Bullish | Bullish |
| NET POSITION MOVEMENT INDEX: | |||
| – 6-Week Change in Strength Index: | 1.4 | 0.9 | -16.5 |
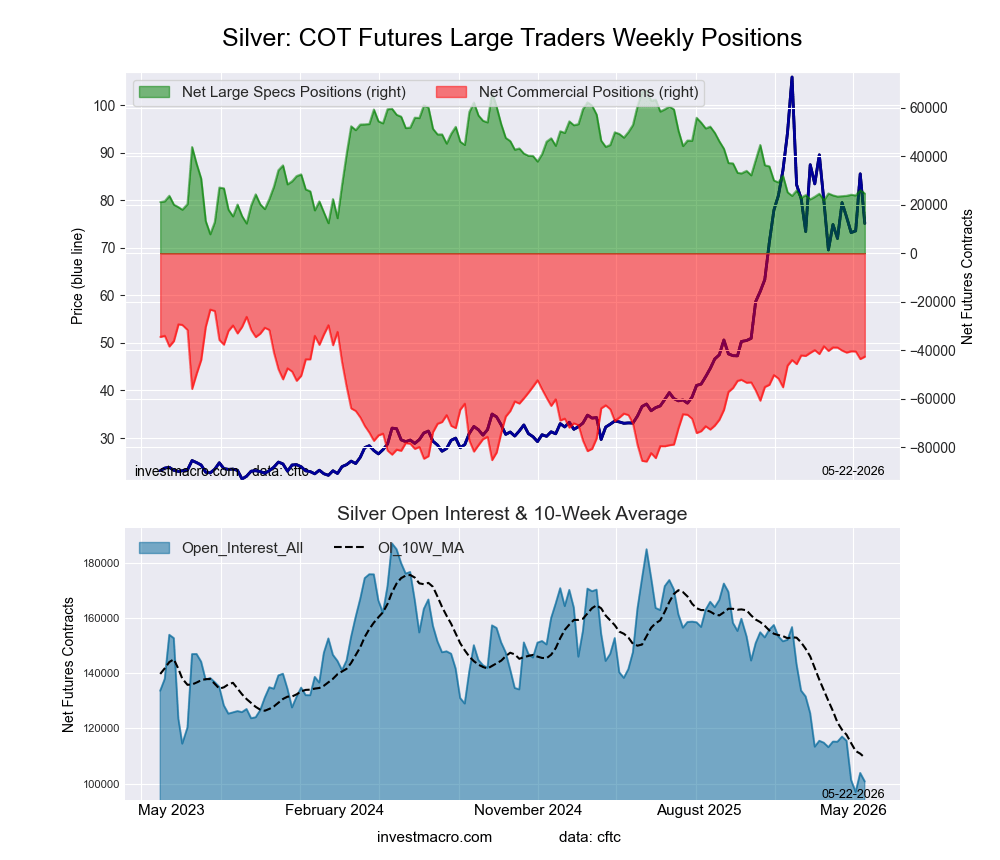
Silver Comex Futures Futures:
 Positioning Notes:
- Silver Comex Futures large speculator standing this week resulted in a net position of 24,671 contracts in the data reported through Tuesday.
- Weekly Speculator position lowering of -1,440 contracts from the previous week which had a total of 26,111 net contracts.
- This week’s current strength score (range over the past 3 years, measured from 0 to 100) shows the speculators are currently Bearish with a score of 28.3 percent.
- The Commercials are Bullish with a score of 69.0 percent.
- The Small Traders (not shown in chart) are Bullish with a score of 51.8 percent.
Price Trend-Following Model: Downtrend
Our weekly trend-following model classifies the current market price position as: Downtrend.
| Silver Futures Statistics | SPECULATORS | COMMERCIALS | SMALL TRADERS |
| – Percent of Open Interest Longs: | 34.3 | 26.9 | 26.2 |
| – Percent of Open Interest Shorts: | 9.8 | 69.3 | 8.4 |
| – Net Position: | 24,671 | -42,668 | 17,997 |
| – Gross Longs: | 34,591 | 27,108 | 26,423 |
| – Gross Shorts: | 9,920 | 69,776 | 8,426 |
| – Long to Short Ratio: | 3.5 to 1 | 0.4 to 1 | 3.1 to 1 |
| NET POSITION TREND: | |||
| – Strength Index Score (3 Year Range Pct): | 28.3 | 69.0 | 51.8 |
| – Strength Index Reading (3 Year Range): | Bearish | Bullish | Bullish |
| NET POSITION MOVEMENT INDEX: | |||
| – 6-Week Change in Strength Index: | 2.1 | -6.0 | 13.8 |
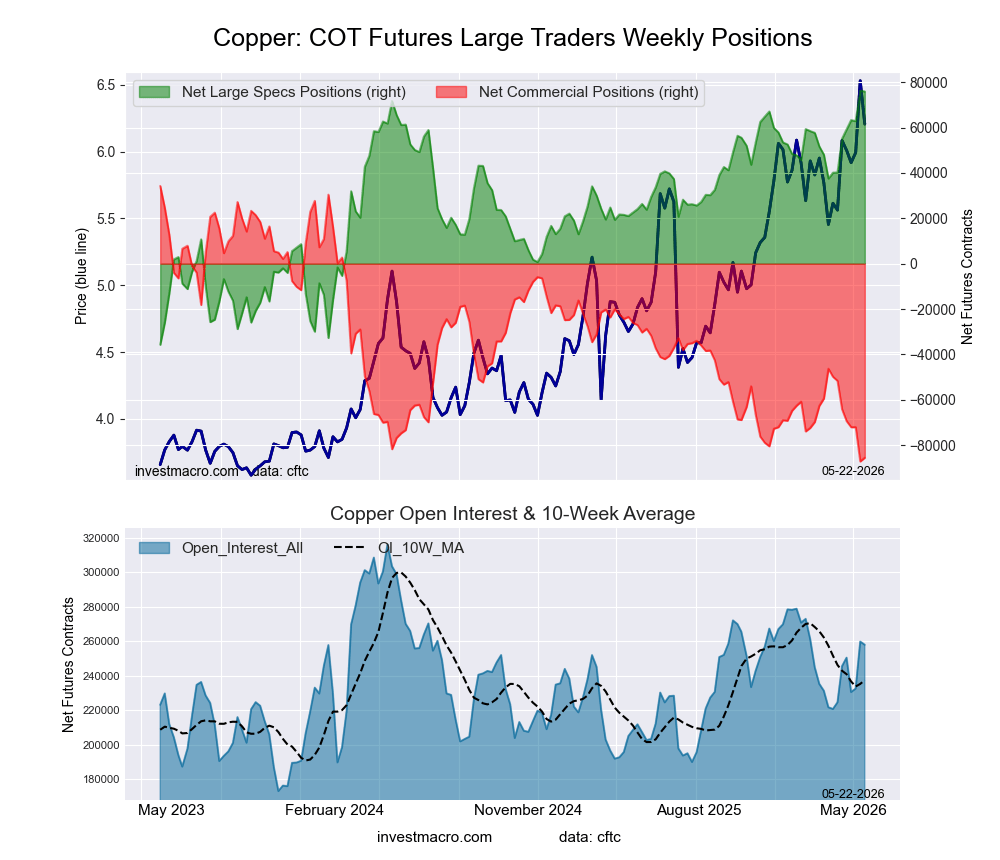
Copper Grade #1 Futures Futures:
 Positioning Notes:
- Copper Grade #1 Futures large speculator standing this week resulted in a net position of 75,886 contracts in the data reported through Tuesday.
- Weekly Speculator position fall of -423 contracts from the previous week which had a total of 76,309 net contracts.
- This week’s current strength score (range over the past 3 years, measured from 0 to 100) shows the speculators are currently Bullish-Extreme with a score of 99.6 percent.
- The Commercials are Bearish-Extreme with a score of 1.4 percent.
- The Small Traders (not shown in chart) are Bullish with a score of 64.0 percent.
Price Trend-Following Model: Strong Uptrend
Our weekly trend-following model classifies the current market price position as: Strong Uptrend.
| Copper Futures Statistics | SPECULATORS | COMMERCIALS | SMALL TRADERS |
| – Percent of Open Interest Longs: | 41.7 | 32.4 | 7.2 |
| – Percent of Open Interest Shorts: | 12.2 | 65.5 | 3.4 |
| – Net Position: | 75,886 | -85,499 | 9,613 |
| – Gross Longs: | 107,483 | 83,511 | 18,455 |
| – Gross Shorts: | 31,597 | 169,010 | 8,842 |
| – Long to Short Ratio: | 3.4 to 1 | 0.5 to 1 | 2.1 to 1 |
| NET POSITION TREND: | |||
| – Strength Index Score (3 Year Range Pct): | 99.6 | 1.4 | 64.0 |
| – Strength Index Reading (3 Year Range): | Bullish-Extreme | Bearish-Extreme | Bullish |
| NET POSITION MOVEMENT INDEX: | |||
| – 6-Week Change in Strength Index: | 31.8 | -27.9 | -9.1 |
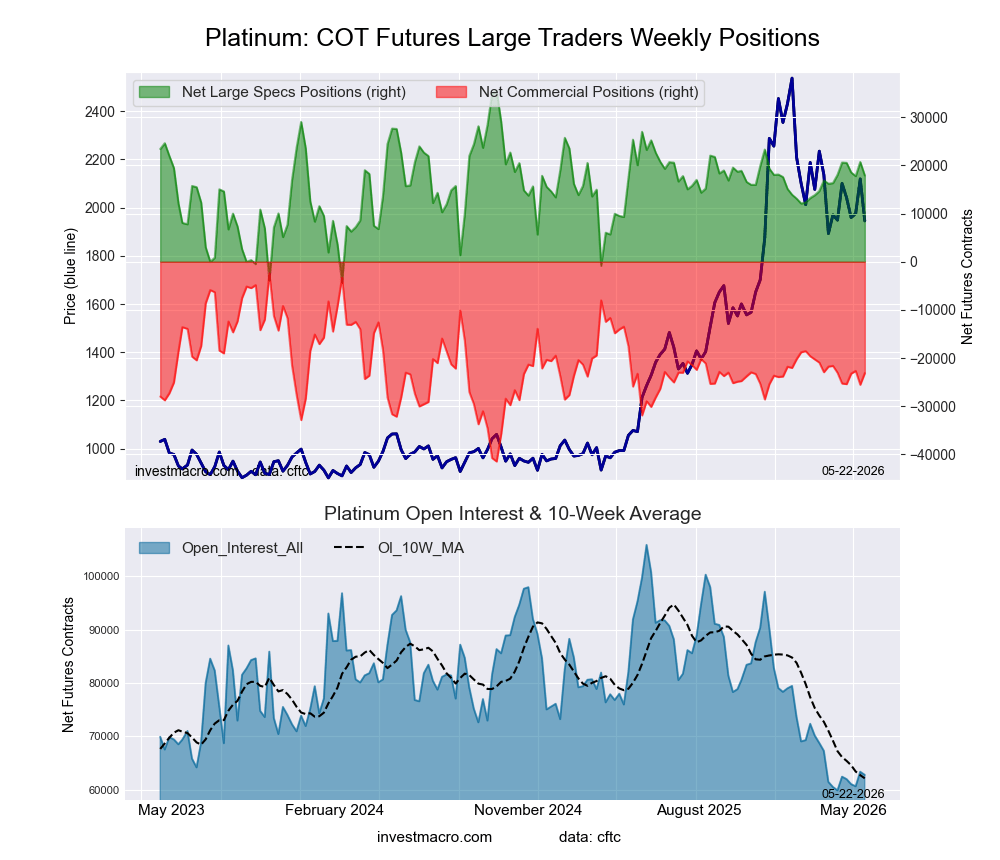
Platinum Futures Futures:
 Positioning Notes:
- Platinum Futures large speculator standing this week resulted in a net position of 17,908 contracts in the data reported through Tuesday.
- Weekly Speculator position decrease of -2,804 contracts from the previous week which had a total of 20,712 net contracts.
- This week’s current strength score (range over the past 3 years, measured from 0 to 100) shows the speculators are currently Bullish with a score of 55.8 percent.
- The Commercials are Bearish with a score of 46.9 percent.
- The Small Traders (not shown in chart) are Bullish with a score of 58.5 percent.
Price Trend-Following Model: Downtrend
Our weekly trend-following model classifies the current market price position as: Downtrend.
| Platinum Futures Statistics | SPECULATORS | COMMERCIALS | SMALL TRADERS |
| – Percent of Open Interest Longs: | 41.6 | 29.3 | 13.6 |
| – Percent of Open Interest Shorts: | 13.1 | 66.2 | 5.3 |
| – Net Position: | 17,908 | -23,112 | 5,204 |
| – Gross Longs: | 26,148 | 18,426 | 8,545 |
| – Gross Shorts: | 8,240 | 41,538 | 3,341 |
| – Long to Short Ratio: | 3.2 to 1 | 0.4 to 1 | 2.6 to 1 |
| NET POSITION TREND: | |||
| – Strength Index Score (3 Year Range Pct): | 55.8 | 46.9 | 58.5 |
| – Strength Index Reading (3 Year Range): | Bullish | Bearish | Bullish |
| NET POSITION MOVEMENT INDEX: | |||
| – 6-Week Change in Strength Index: | -0.3 | -0.2 | 2.4 |
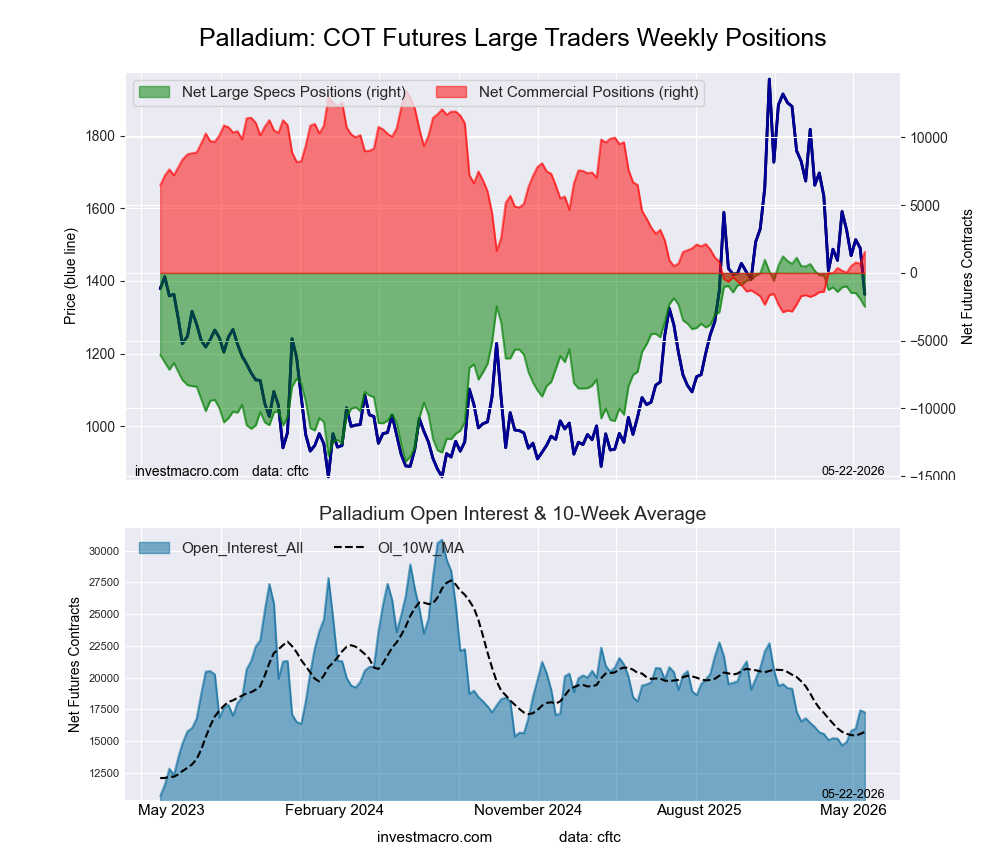
Palladium Futures Futures:
 Positioning Notes:
- Palladium Futures large speculator standing this week resulted in a net position of -2,497 contracts in the data reported through Tuesday.
- Weekly Speculator position decrease of -582 contracts from the previous week which had a total of -1,915 net contracts.
- This week’s current strength score (range over the past 3 years, measured from 0 to 100) shows the speculators are currently Bullish with a score of 75.4 percent.
- The Commercials are Bearish with a score of 27.2 percent.
- The Small Traders (not shown in chart) are Bullish with a score of 52.4 percent.
Price Trend-Following Model: Strong Downtrend
Our weekly trend-following model classifies the current market price position as: Strong Downtrend.
| Palladium Futures Statistics | SPECULATORS | COMMERCIALS | SMALL TRADERS |
| – Percent of Open Interest Longs: | 36.2 | 40.6 | 14.9 |
| – Percent of Open Interest Shorts: | 50.7 | 31.5 | 9.5 |
| – Net Position: | -2,497 | 1,563 | 934 |
| – Gross Longs: | 6,252 | 7,007 | 2,578 |
| – Gross Shorts: | 8,749 | 5,444 | 1,644 |
| – Long to Short Ratio: | 0.7 to 1 | 1.3 to 1 | 1.6 to 1 |
| NET POSITION TREND: | |||
| – Strength Index Score (3 Year Range Pct): | 75.4 | 27.2 | 52.4 |
| – Strength Index Reading (3 Year Range): | Bullish | Bearish | Bullish |
| NET POSITION MOVEMENT INDEX: | |||
| – 6-Week Change in Strength Index: | -7.3 | 7.3 | -2.9 |
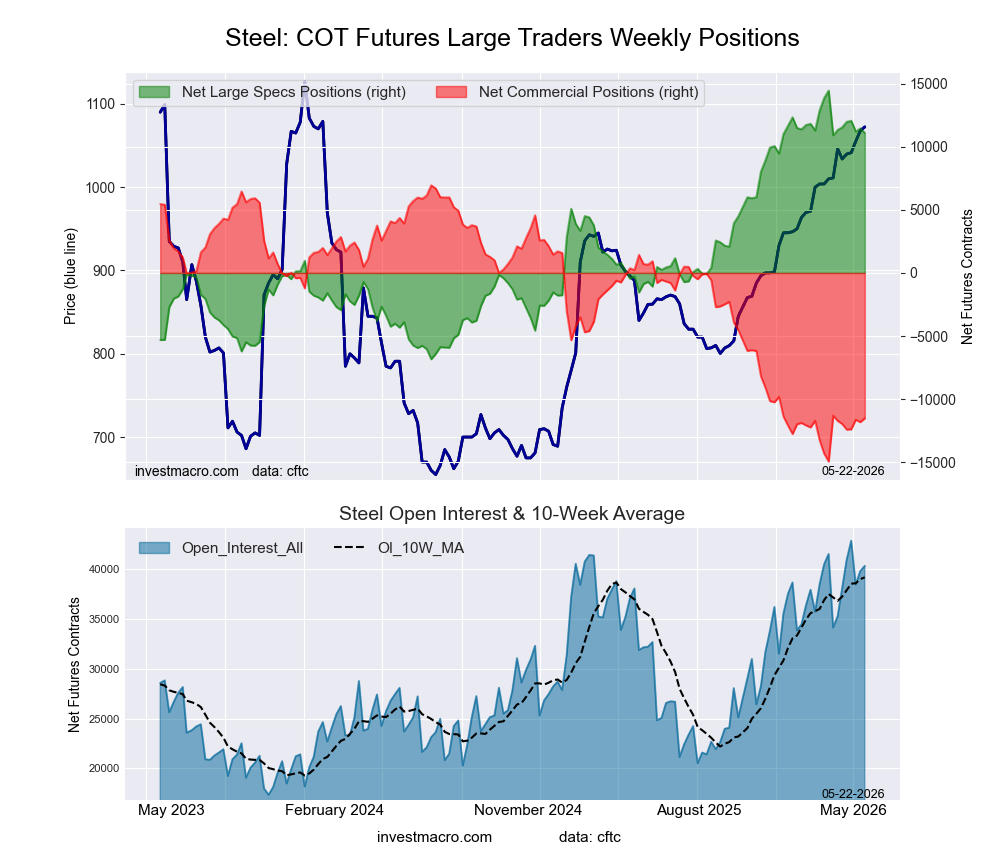
Steel Futures Futures:
 Positioning Notes:
- Steel Futures large speculator standing this week resulted in a net position of 11,106 contracts in the data reported through Tuesday.
- Weekly Speculator position lowering of -350 contracts from the previous week which had a total of 11,456 net contracts.
- This week’s current strength score (range over the past 3 years, measured from 0 to 100) shows the speculators are currently Bullish-Extreme with a score of 84.2 percent.
- The Commercials are Bearish-Extreme with a score of 15.6 percent.
- The Small Traders (not shown in chart) are Bullish-Extreme with a score of 90.0 percent.
Price Trend-Following Model: Uptrend
Our weekly trend-following model classifies the current market price position as: Uptrend.
| Steel Futures Statistics | SPECULATORS | COMMERCIALS | SMALL TRADERS |
| – Percent of Open Interest Longs: | 31.6 | 64.6 | 1.2 |
| – Percent of Open Interest Shorts: | 4.1 | 93.2 | 0.2 |
| – Net Position: | 11,106 | -11,521 | 415 |
| – Gross Longs: | 12,746 | 26,059 | 498 |
| – Gross Shorts: | 1,640 | 37,580 | 83 |
| – Long to Short Ratio: | 7.8 to 1 | 0.7 to 1 | 6.0 to 1 |
| NET POSITION TREND: | |||
| – Strength Index Score (3 Year Range Pct): | 84.2 | 15.6 | 90.0 |
| – Strength Index Reading (3 Year Range): | Bullish-Extreme | Bearish-Extreme | Bullish-Extreme |
| NET POSITION MOVEMENT INDEX: | |||
| – 6-Week Change in Strength Index: | -1.1 | 0.9 | 3.3 |
Article By InvestMacro – Receive our weekly COT Reports by Email
*COT Report: The COT data, released weekly to the public each Friday, is updated through the most recent Tuesday (data is 3 days old) and shows a quick view of how large speculators or non-commercials (for-profit traders) were positioned in the futures markets.
The CFTC categorizes trader positions according to commercial hedgers (traders who use futures contracts for hedging as part of the business), non-commercials (large traders who speculate to realize trading profits) and nonreportable traders (usually small traders/speculators) as well as their open interest (contracts open in the market at time of reporting).See CFTC criteria here.
All information and opinions on this website and contained in this article are for general informational purposes only and do not constitute investment advice.

- The US introduces new import tariffs for 60 countries. Brent crude surpasses $100 per barrel Jul 24, 2026
- USD/JPY Breaks Records: Nothing Slows the Yen’s Decline Jul 24, 2026
- Oil prices reached a 6‑week high. The AUD strengthened on the back of a strong labor‑market report Jul 23, 2026
- EUR/USD Recovers as Dollar Weakens Jul 23, 2026
- Bitcoin rose to $66,000. The New Zealand dollar continues to strengthen Jul 22, 2026
- Inflationary pressure is easing in Canada. In New Zealand, on the contrary, inflation is rising Jul 21, 2026
- GBP/USD Falls After Cabinet Changes Jul 21, 2026
- Geopolitical and macroeconomic conditions continue to pressure market sentiment Jul 20, 2026
- USD/JPY Poised to Continue Gains as Expensive Oil and Lack of Support Weigh on Yen Jul 20, 2026
- COT Metals Charts: Weekly Speculator Bets led by Copper & Steel Jul 18, 2026