
By Analytical Department RoboForex
Gold fell to 4,387 USD per troy ounce on Thursday, marking its third consecutive session of losses. The market remains cautious amid persistent uncertainty surrounding negotiations between the US and Iran, which continue to fuel concerns over inflation and the prospect of prolonged high interest rates.
Key disagreements between the two sides remain unresolved. Tehran continues to insist on maintaining control over the Strait of Hormuz and preserving its nuclear program.
US President Donald Trump previously stated that Washington would not accept a “bad deal” and was unwilling to ease sanctions on Iran, despite Tehran’s demands for financial concessions and an end to attacks.
Even if progress towards an agreement is achieved, markets still expect elevated energy prices to persist. This is likely to maintain inflationary pressure and force major central banks to keep monetary policy restrictive for longer, rather than moving towards rate cuts.
Since the beginning of the conflict, gold has already lost more than 15% of its value amid a stronger US dollar, rising bond yields, and expectations of higher interest rates across the global economy.
Free Reports:
 Sign Up for Our Stock Market Newsletter – Get updated on News, Charts & Rankings of Public Companies when you join our Stocks Newsletter
 Get our Weekly Commitment of Traders Reports - See where the biggest traders (Hedge Funds and Commercial Hedgers) are positioned in the futures markets on a weekly basis.
Technical Analysis
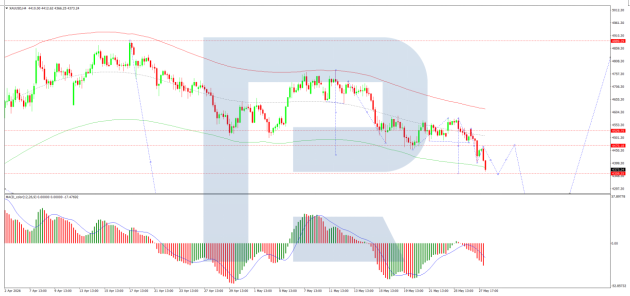
On the H4 XAU/USD chart, the market is trading within a consolidation range around 4,470 USD. A move lower towards 4,359 USD is likely. A corrective rebound to 4,470 USD (a retest from below) may follow, before a further decline towards 4,238 USD, with scope for an extension to 4,170 USD. The MACD indicator confirms the current bearish momentum, with the signal line below the centre line and pointing firmly downwards.
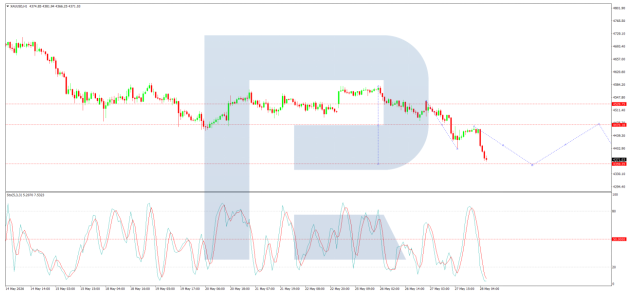
On the H1 chart, the market has broken below the 4,470 USD level and continues to move lower towards 4,390 USD. A corrective rebound to retest 4,470 USD from below remains possible, followed by another decline towards 4,250 USD. A subsequent rebound towards 4,390 USD may follow. The Stochastic oscillator supports this scenario, with the signal line below 20 and pointing firmly downwards.
Conclusion
Gold remains under significant pressure amid geopolitical uncertainty, elevated inflation expectations, and restrictive monetary policy. Technical indicators suggest bearish momentum remains dominant, although short-term corrective rebounds are possible.
Disclaimer
Any forecasts contained herein are based on the author’s particular opinion. This analysis may not be treated as trading advice. RoboForex bears no responsibility for trading results based on trading recommendations and reviews contained herein.

- The Tech‑heavy NASDAQ Index jumped by more than 3.3%. The offshore yuan is trading at its highest level since 2023 Jul 31, 2026
- USD/JPY After Volatility: Multiple Events in One Day Jul 31, 2026
- The US indices sell off amid renewed US-Iran clashes. Oil jumps by 7% Jul 30, 2026
- USD/JPY Temporary in Equilibrium: Multiple Factors in Focus Jul 30, 2026
- GBP/USD at Month’s Lows: The Outlook Remains Weak Jul 29, 2026
- Crude oil falls below $80 per barrel. Australia sees inflation slowdown Jul 29, 2026
- The US Tech sector hit by sell‑off. Oil prices decline on renewed negotiations Jul 28, 2026
- Gold Declines, Focus on Fed and Falling Oil Prices Jul 28, 2026
- This week will be one of the most crowded for central‑bank meetings Jul 27, 2026
- EUR/USD Ahead of a Key Week: Holding Near Lows Jul 27, 2026
