By InvestMacro
Here are the latest charts and statistics for the Commitment of Traders (COT) data published by the Commodities Futures Trading Commission (CFTC).
The latest COT data is updated through Tuesday January 27th and shows a quick view of how large traders (for-profit speculators and commercial entities) were positioned in the futures markets.
Weekly Speculator Changes led lower by Gold & Copper
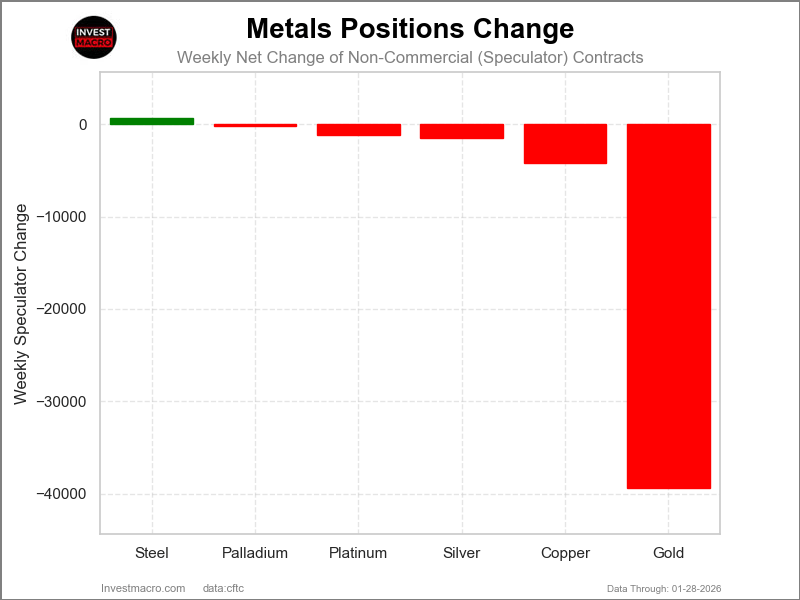
The COT metals markets speculator bets were overall lower this week as just one out of the six metals markets we cover had higher positioning while the other five markets had lower speculator contracts.
Leading the gains for the metals was Steel with a rise by 669 contracts on the week.
The markets with declines in speculator bets for the week were Gold (-39,374 contracts), Copper (-4,185 contracts), Silver (-1,511 contracts), Platinum (-1,202 contracts) and with Palladium (-204 contracts) also registering lower bets on the week.
Steel is only price gainer for Metals Markets that saw a sell-off this week
The metals markets were overall lower on the week as the metals saw a steep and sharp selloff to close out the week. Steel was the only market that saw a weekly gain as Steel rose by over 5.50% and is now up by 9.30% in the past 30 days, and higher by approximately 40% in the past 90 days.
Copper was lower by -0.25% on the past five days, followed by Gold which saw a shortfall by -2.85%. Palladium dropped by -16.5% and Silver saw a strong decline lower by -18.86% on the week. Platinum was the biggest loser on the week with a sharp -22.45% decline.
Over the past 30 days, the metals markets have all been higher, led by Silver which has been up by 30.59%, while in the past 90 days all of these markets have been at least 27% higher, with Silver up by 88.29%, Platinum up by 45.87%, Palladium higher by 40.39%, and Steel, which has risen by 40.22%. Gold has seen a 28.95% gain in the past 90 days while Copper has risen by 27.29% in that timeframe.
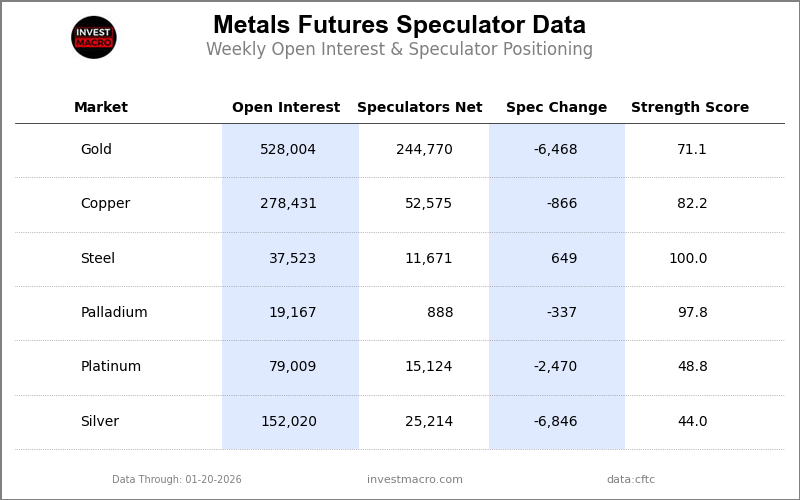
Metals Data:
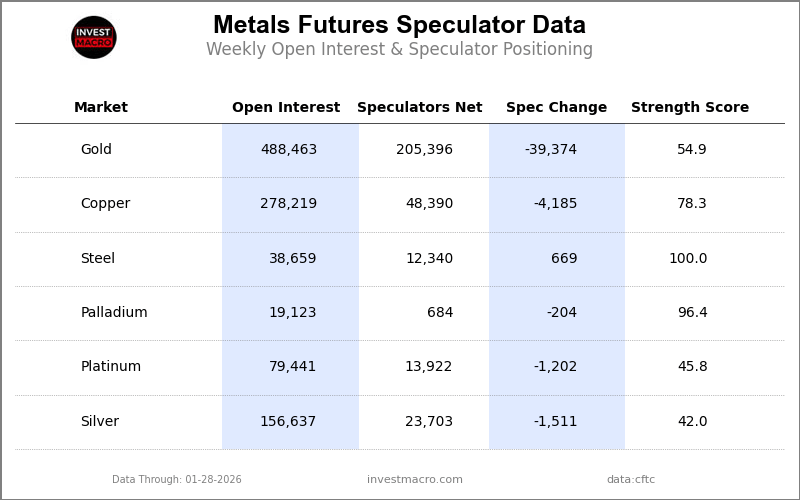
Legend: Weekly Speculators Change | Speculators Current Net Position | Speculators Strength Score compared to last 3-Years (0-100 range)
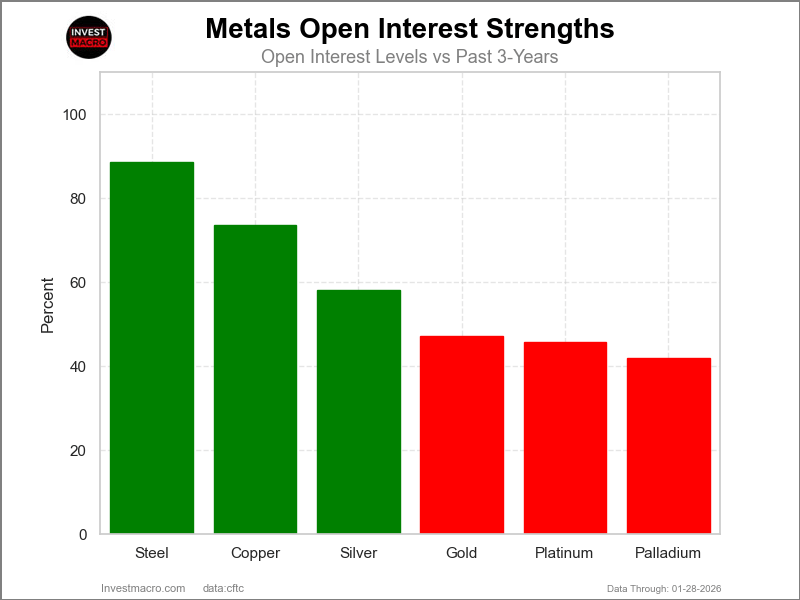
Strength Scores led by Steel & Palladium
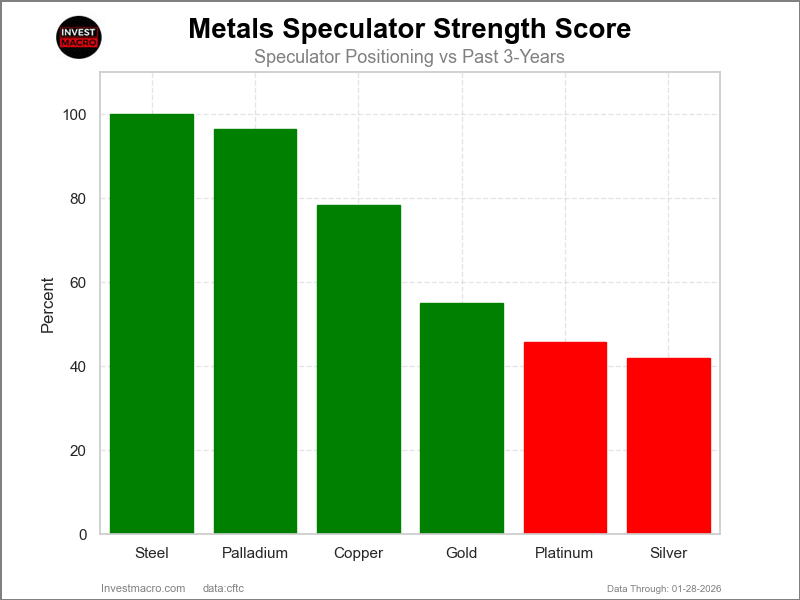
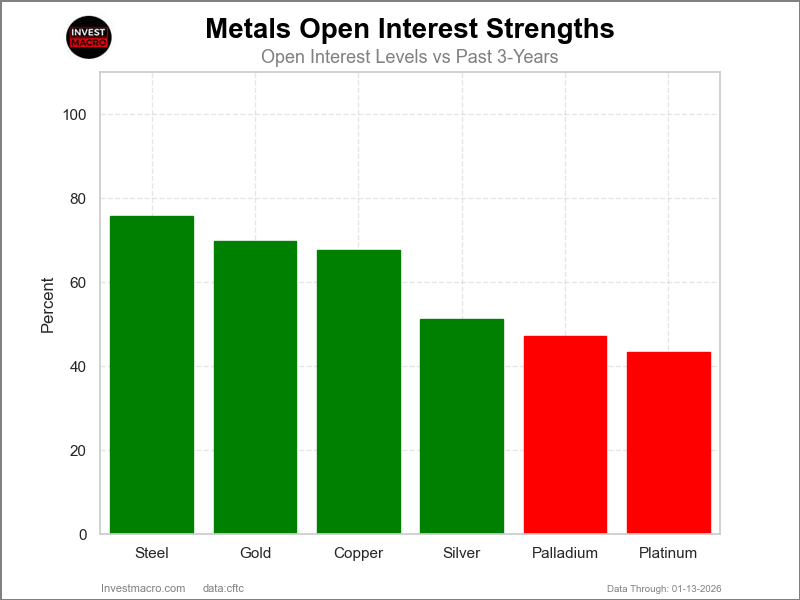
COT Strength Scores (a normalized measure of Speculator positions over a 3-Year range, from 0 to 100 where above 80 is Extreme-Bullish and below 20 is Extreme-Bearish) showed that Steel (100 percent) and Palladium (96 percent) lead the metals markets this week. Copper (78 percent) comes in as the next highest in the weekly strength scores.
On the downside, Silver (42 percent) and Platinum (46 percent) come in at the lowest strength level currently.
Strength Statistics:
Gold (54.9 percent) vs Gold previous week (71.1 percent)
Silver (42.0 percent) vs Silver previous week (44.0 percent)
Copper (78.3 percent) vs Copper previous week (82.2 percent)
Platinum (45.8 percent) vs Platinum previous week (48.8 percent)
Palladium (96.4 percent) vs Palladium previous week (97.8 percent)
Steel (100.0 percent) vs Steel previous week (96.5 percent)
Steel top the 6-Week Strength Trends
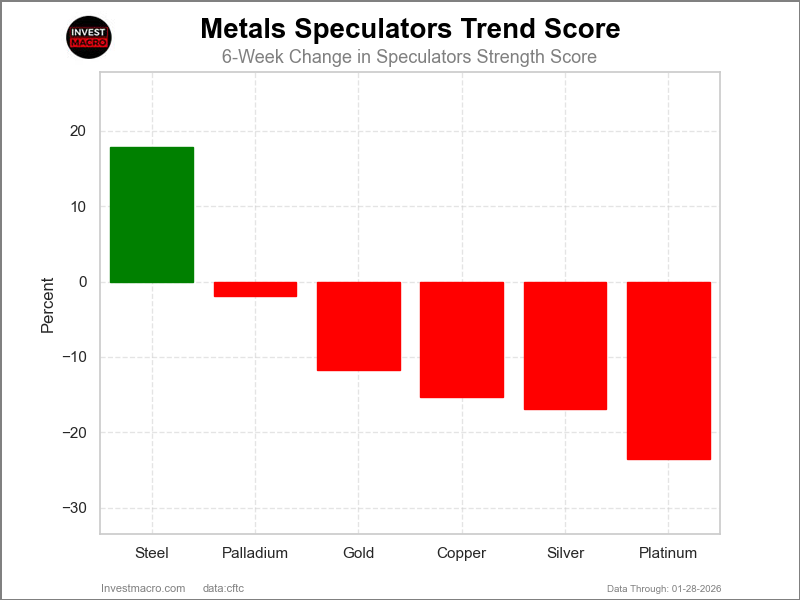
COT Strength Score Trends (or move index, calculates the 6-week changes in strength scores) showed that Steel (18 percent) leads the past six weeks trends for metals.
Platinum (-23 percent), Silver (-17 percent) and Copper (-15 percent) lead the downside trend scores currently.
Move Statistics:
Gold (-11.7 percent) vs Gold previous week (8.6 percent)
Silver (-16.9 percent) vs Silver previous week (-26.0 percent)
Copper (-15.3 percent) vs Copper previous week (-9.2 percent)
Platinum (-23.5 percent) vs Platinum previous week (-11.9 percent)
Palladium (-1.9 percent) vs Palladium previous week (6.0 percent)
Steel (17.8 percent) vs Steel previous week (19.0 percent)
Individual Markets: (Weekly Tuesday Closes)
Gold Comex Futures:
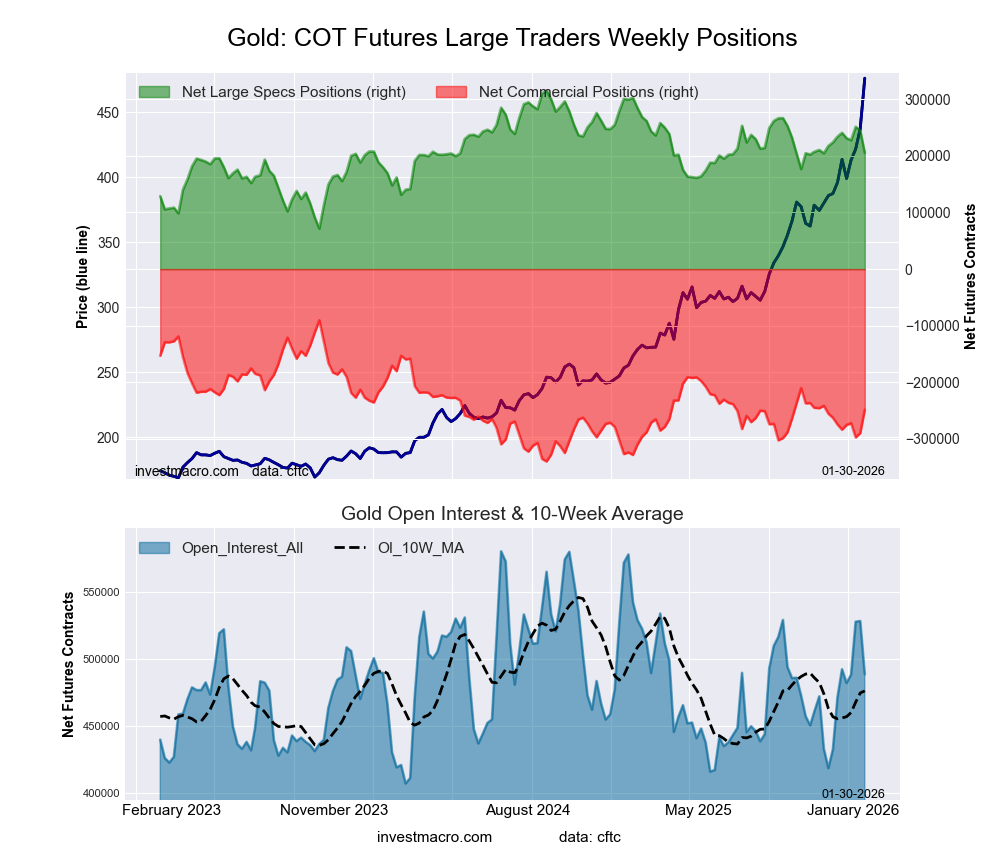 The Gold Comex Futures large speculator standing this week resulted in a net position of 205,396 contracts in the data reported through Tuesday. This was a weekly reduction of -39,374 contracts from the previous week which had a total of 244,770 net contracts.
This week’s current strength score (the trader positioning range over the past three years, measured from 0 to 100) shows the speculators are currently Bullish with a score of 54.9 percent. The commercials are Bearish with a score of 36.7 percent and the small traders (not shown in chart) are Bullish-Extreme with a score of 91.3 percent.
Price Trend-Following Model: Strong Uptrend
Our weekly trend-following model classifies the current market price position as: Strong Uptrend.
| Gold Futures Statistics | SPECULATORS | COMMERCIALS | SMALL TRADERS |
| – Percent of Open Interest Longs: | 51.6 | 19.7 | 12.8 |
| – Percent of Open Interest Shorts: | 9.6 | 70.5 | 4.1 |
| – Net Position: | 205,396 | -248,285 | 42,889 |
| – Gross Longs: | 252,100 | 96,200 | 62,677 |
| – Gross Shorts: | 46,704 | 344,485 | 19,788 |
| – Long to Short Ratio: | 5.4 to 1 | 0.3 to 1 | 3.2 to 1 |
| NET POSITION TREND: | |||
| – Strength Index Score (3 Year Range Pct): | 54.9 | 36.7 | 91.3 |
| – Strength Index Reading (3 Year Range): | Bullish | Bearish | Bullish-Extreme |
| NET POSITION MOVEMENT INDEX: | |||
| – 6-Week Change in Strength Index: | -11.7 | 10.5 | 7.3 |
Silver Comex Futures:
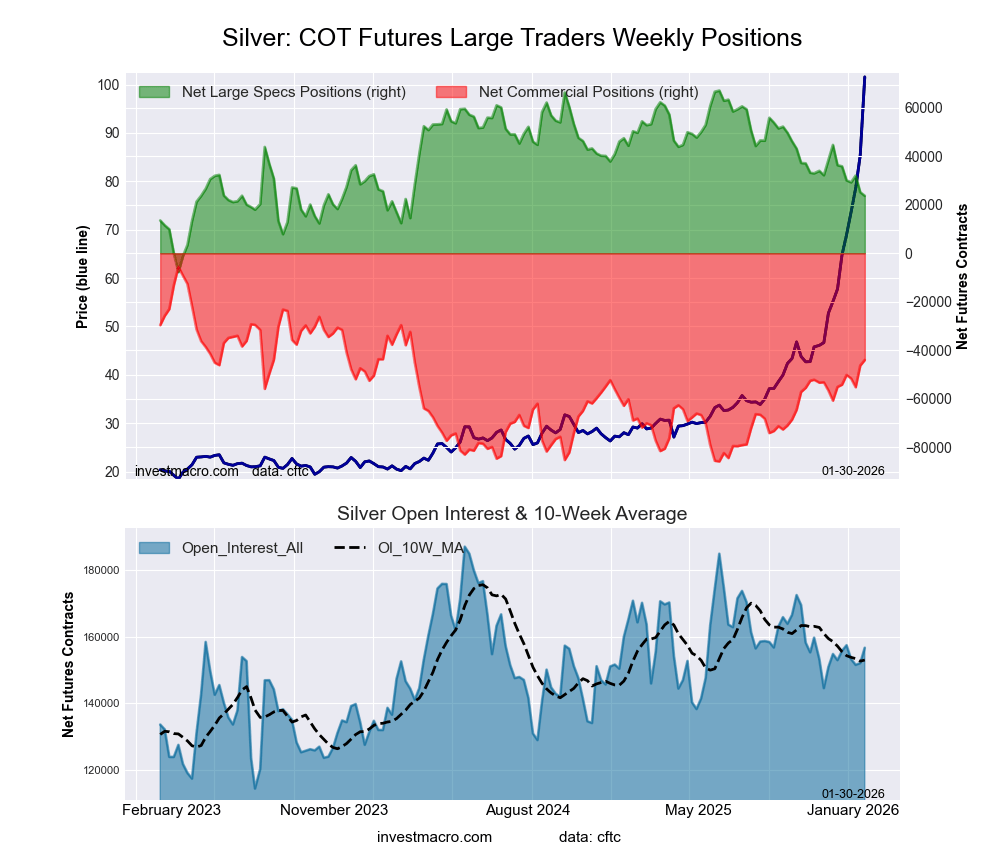 The Silver Comex Futures large speculator standing this week resulted in a net position of 23,703 contracts in the data reported through Tuesday. This was a weekly lowering of -1,511 contracts from the previous week which had a total of 25,214 net contracts.
This week’s current strength score (the trader positioning range over the past three years, measured from 0 to 100) shows the speculators are currently Bearish with a score of 42.0 percent. The commercials are Bullish with a score of 52.1 percent and the small traders (not shown in chart) are Bullish with a score of 65.1 percent.
Price Trend-Following Model: Uptrend
Our weekly trend-following model classifies the current market price position as: Uptrend.
| Silver Futures Statistics | SPECULATORS | COMMERCIALS | SMALL TRADERS |
| – Percent of Open Interest Longs: | 27.8 | 28.6 | 22.0 |
| – Percent of Open Interest Shorts: | 12.6 | 56.7 | 9.0 |
| – Net Position: | 23,703 | -44,056 | 20,353 |
| – Gross Longs: | 43,475 | 44,788 | 34,444 |
| – Gross Shorts: | 19,772 | 88,844 | 14,091 |
| – Long to Short Ratio: | 2.2 to 1 | 0.5 to 1 | 2.4 to 1 |
| NET POSITION TREND: | |||
| – Strength Index Score (3 Year Range Pct): | 42.0 | 52.1 | 65.1 |
| – Strength Index Reading (3 Year Range): | Bearish | Bullish | Bullish |
| NET POSITION MOVEMENT INDEX: | |||
| – 6-Week Change in Strength Index: | -16.9 | 13.9 | 8.3 |
Copper Grade #1 Futures:
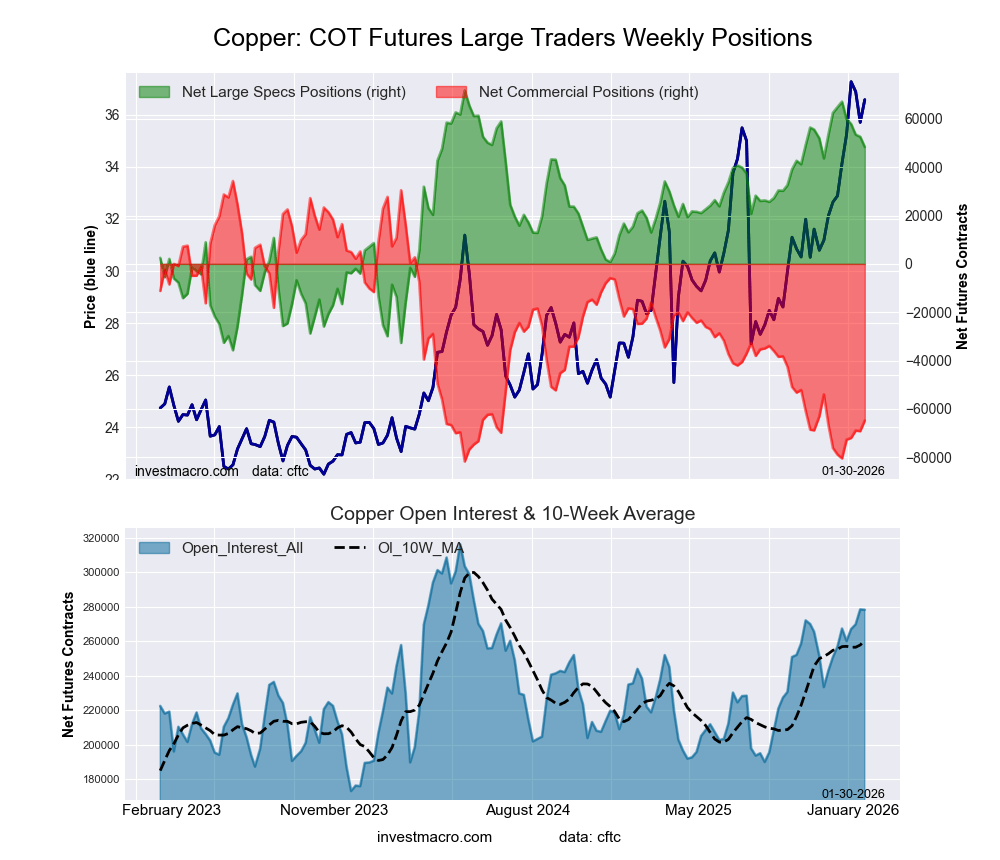 The Copper Grade #1 Futures large speculator standing this week resulted in a net position of 48,390 contracts in the data reported through Tuesday. This was a weekly lowering of -4,185 contracts from the previous week which had a total of 52,575 net contracts.
This week’s current strength score (the trader positioning range over the past three years, measured from 0 to 100) shows the speculators are currently Bullish with a score of 78.3 percent. The commercials are Bearish-Extreme with a score of 14.6 percent and the small traders (not shown in chart) are Bullish-Extreme with a score of 99.0 percent.
Price Trend-Following Model: Uptrend
Our weekly trend-following model classifies the current market price position as: Uptrend.
| Copper Futures Statistics | SPECULATORS | COMMERCIALS | SMALL TRADERS |
| – Percent of Open Interest Longs: | 36.4 | 31.6 | 9.2 |
| – Percent of Open Interest Shorts: | 19.1 | 54.9 | 3.3 |
| – Net Position: | 48,390 | -64,812 | 16,422 |
| – Gross Longs: | 101,400 | 87,989 | 25,663 |
| – Gross Shorts: | 53,010 | 152,801 | 9,241 |
| – Long to Short Ratio: | 1.9 to 1 | 0.6 to 1 | 2.8 to 1 |
| NET POSITION TREND: | |||
| – Strength Index Score (3 Year Range Pct): | 78.3 | 14.6 | 99.0 |
| – Strength Index Reading (3 Year Range): | Bullish | Bearish-Extreme | Bullish-Extreme |
| NET POSITION MOVEMENT INDEX: | |||
| – 6-Week Change in Strength Index: | -15.3 | 12.1 | 12.2 |
Platinum Futures:
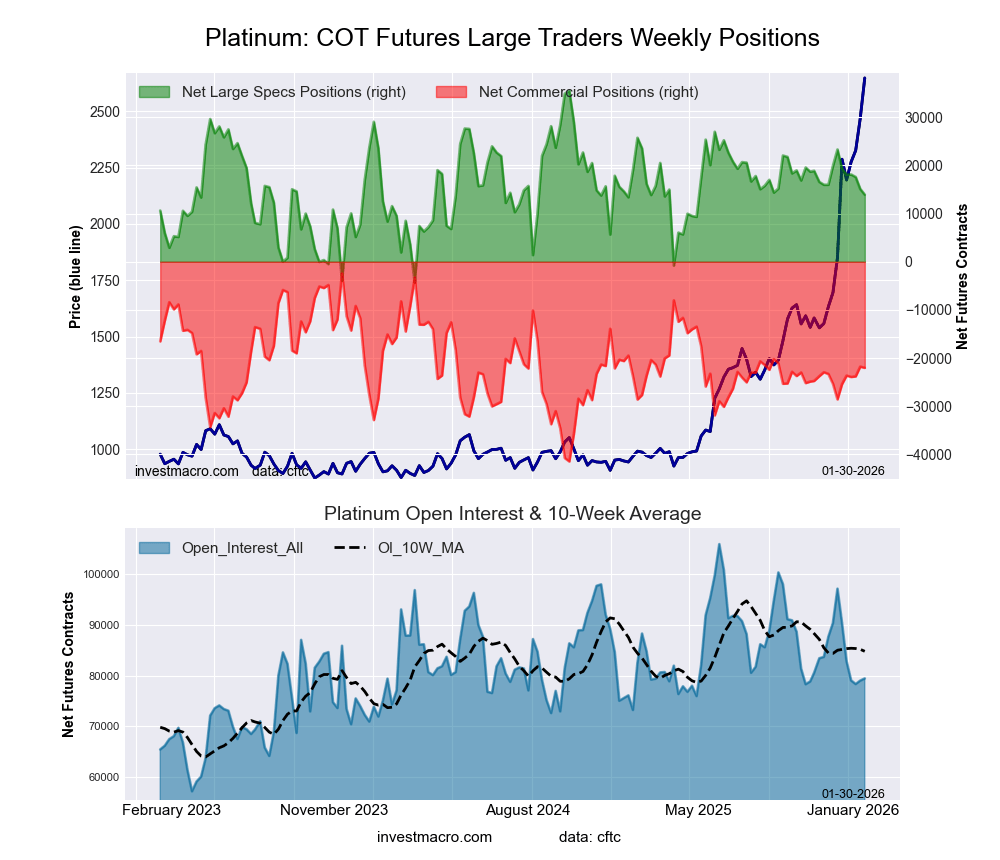 The Platinum Futures large speculator standing this week resulted in a net position of 13,922 contracts in the data reported through Tuesday. This was a weekly decline of -1,202 contracts from the previous week which had a total of 15,124 net contracts.
This week’s current strength score (the trader positioning range over the past three years, measured from 0 to 100) shows the speculators are currently Bearish with a score of 45.8 percent. The commercials are Bearish with a score of 49.7 percent and the small traders (not shown in chart) are Bullish-Extreme with a score of 91.9 percent.
Price Trend-Following Model: Uptrend
Our weekly trend-following model classifies the current market price position as: Uptrend.
| Platinum Futures Statistics | SPECULATORS | COMMERCIALS | SMALL TRADERS |
| – Percent of Open Interest Longs: | 45.8 | 26.0 | 14.1 |
| – Percent of Open Interest Shorts: | 28.3 | 53.7 | 3.9 |
| – Net Position: | 13,922 | -22,026 | 8,104 |
| – Gross Longs: | 36,419 | 20,654 | 11,173 |
| – Gross Shorts: | 22,497 | 42,680 | 3,069 |
| – Long to Short Ratio: | 1.6 to 1 | 0.5 to 1 | 3.6 to 1 |
| NET POSITION TREND: | |||
| – Strength Index Score (3 Year Range Pct): | 45.8 | 49.7 | 91.9 |
| – Strength Index Reading (3 Year Range): | Bearish | Bearish | Bullish-Extreme |
| NET POSITION MOVEMENT INDEX: | |||
| – 6-Week Change in Strength Index: | -23.5 | 16.7 | 32.6 |
Palladium Futures:
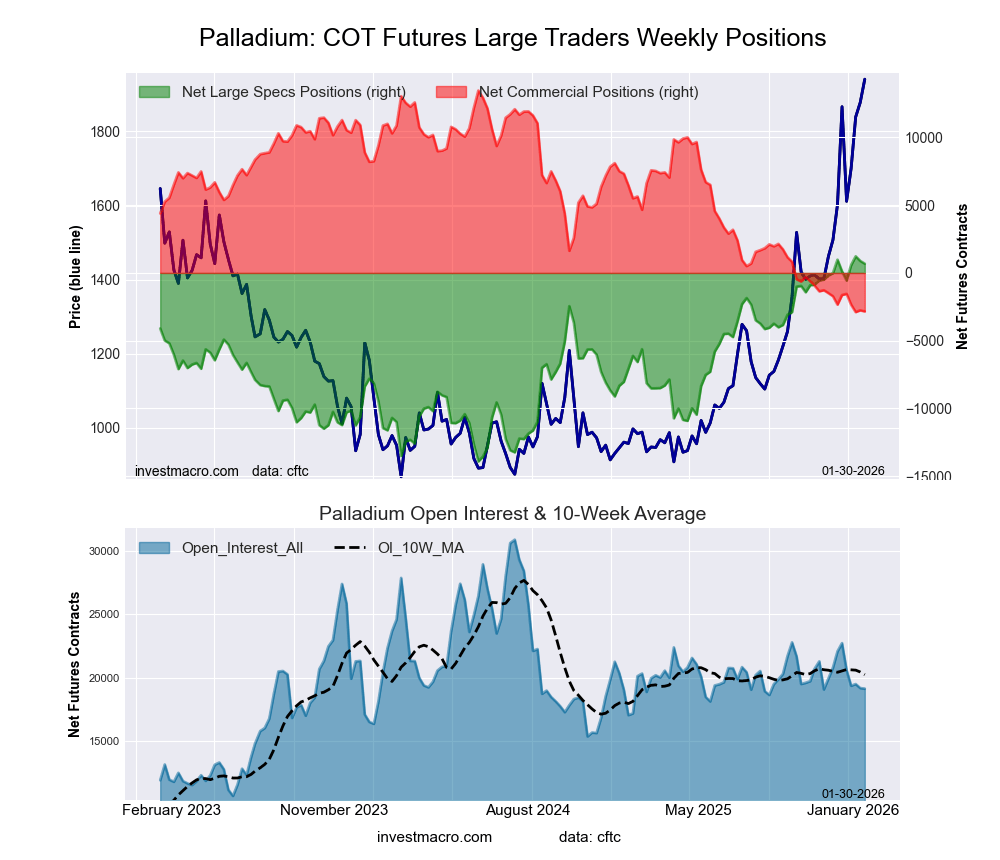 The Palladium Futures large speculator standing this week resulted in a net position of 684 contracts in the data reported through Tuesday. This was a weekly fall of -204 contracts from the previous week which had a total of 888 net contracts.
This week’s current strength score (the trader positioning range over the past three years, measured from 0 to 100) shows the speculators are currently Bullish-Extreme with a score of 96.4 percent. The commercials are Bearish-Extreme with a score of 0.3 percent and the small traders (not shown in chart) are Bullish-Extreme with a score of 94.4 percent.
Price Trend-Following Model: Uptrend
Our weekly trend-following model classifies the current market price position as: Uptrend.
| Palladium Futures Statistics | SPECULATORS | COMMERCIALS | SMALL TRADERS |
| – Percent of Open Interest Longs: | 49.3 | 28.7 | 17.8 |
| – Percent of Open Interest Shorts: | 45.8 | 43.5 | 6.5 |
| – Net Position: | 684 | -2,840 | 2,156 |
| – Gross Longs: | 9,436 | 5,487 | 3,396 |
| – Gross Shorts: | 8,752 | 8,327 | 1,240 |
| – Long to Short Ratio: | 1.1 to 1 | 0.7 to 1 | 2.7 to 1 |
| NET POSITION TREND: | |||
| – Strength Index Score (3 Year Range Pct): | 96.4 | 0.3 | 94.4 |
| – Strength Index Reading (3 Year Range): | Bullish-Extreme | Bearish-Extreme | Bullish-Extreme |
| NET POSITION MOVEMENT INDEX: | |||
| – 6-Week Change in Strength Index: | -1.9 | -3.1 | 27.3 |
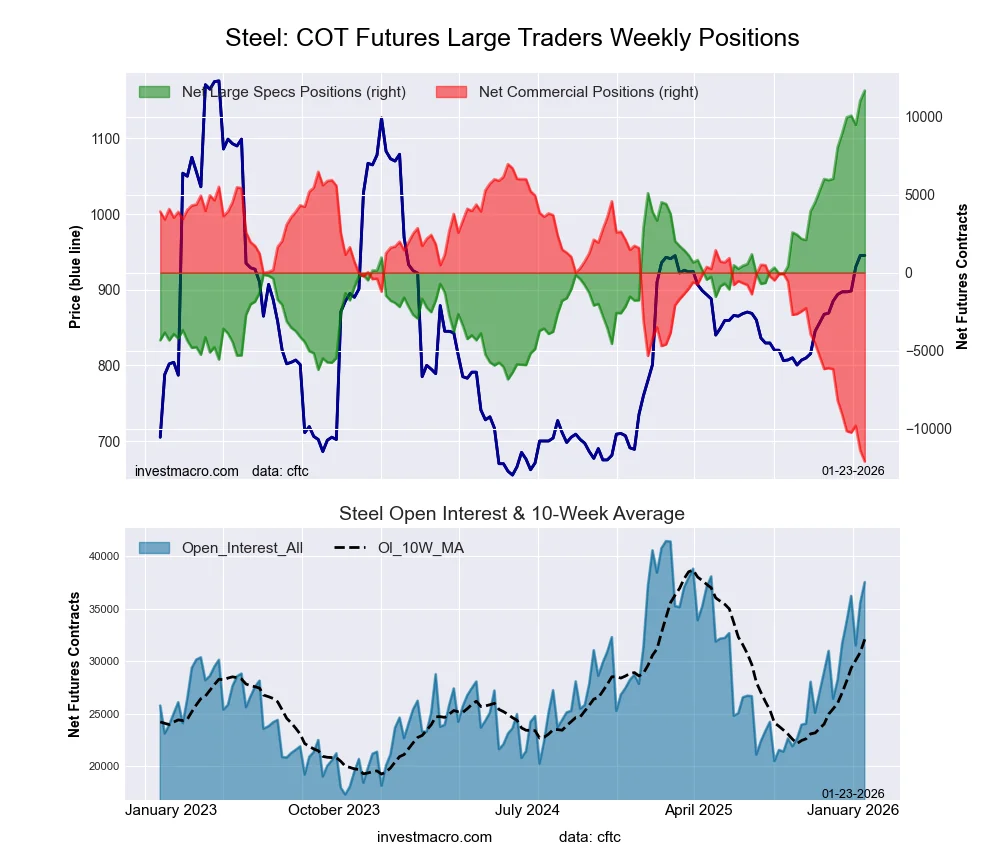
Steel Futures Futures:
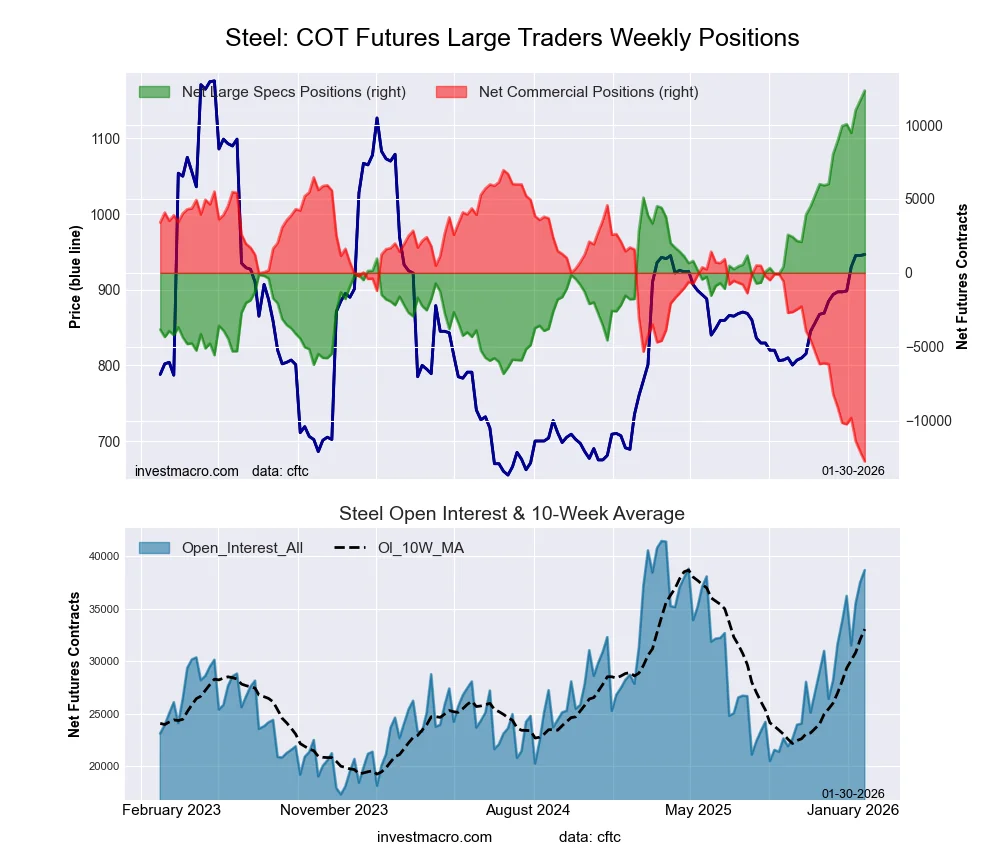 The Steel Futures large speculator standing this week resulted in a net position of 12,340 contracts in the data reported through Tuesday. This was a weekly rise of 669 contracts from the previous week which had a total of 11,671 net contracts.
This week’s current strength score (the trader positioning range over the past three years, measured from 0 to 100) shows the speculators are currently Bullish-Extreme with a score of 100.0 percent. The commercials are Bearish-Extreme with a score of 0.0 percent and the small traders (not shown in chart) are Bullish-Extreme with a score of 89.2 percent.
Price Trend-Following Model: Strong Uptrend
Our weekly trend-following model classifies the current market price position as: Strong Uptrend.
| Steel Futures Statistics | SPECULATORS | COMMERCIALS | SMALL TRADERS |
| – Percent of Open Interest Longs: | 38.4 | 57.6 | 1.6 |
| – Percent of Open Interest Shorts: | 6.5 | 90.7 | 0.5 |
| – Net Position: | 12,340 | -12,763 | 423 |
| – Gross Longs: | 14,856 | 22,286 | 635 |
| – Gross Shorts: | 2,516 | 35,049 | 212 |
| – Long to Short Ratio: | 5.9 to 1 | 0.6 to 1 | 3.0 to 1 |
| NET POSITION TREND: | |||
| – Strength Index Score (3 Year Range Pct): | 100.0 | 0.0 | 89.2 |
| – Strength Index Reading (3 Year Range): | Bullish-Extreme | Bearish-Extreme | Bullish-Extreme |
| NET POSITION MOVEMENT INDEX: | |||
| – 6-Week Change in Strength Index: | 17.8 | -18.6 | 32.5 |
Article By InvestMacro – Receive our weekly COT Newsletter
*COT Report: The COT data, released weekly to the public each Friday, is updated through the most recent Tuesday (data is 3 days old) and shows a quick view of how large speculators or non-commercials (for-profit traders) were positioned in the futures markets.
The CFTC categorizes trader positions according to commercial hedgers (traders who use futures contracts for hedging as part of the business), non-commercials (large traders who speculate to realize trading profits) and nonreportable traders (usually small traders/speculators) as well as their open interest (contracts open in the market at time of reporting). See CFTC criteria here.