As the Friday trading session came to a close this week, I had an epiphany of sorts in that instead of standing back and admiring the results while reaching around and patting myself several times on the back, I took the septuagenarian skin on the underside of my left bicep and gave it a rather robust pinch.
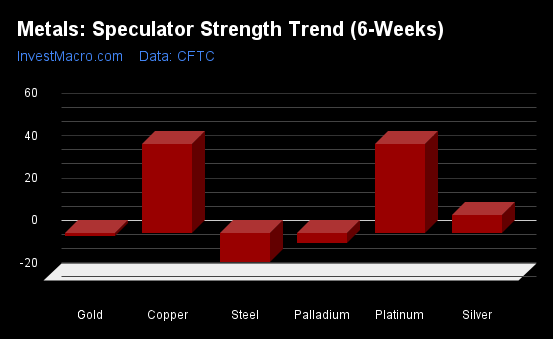
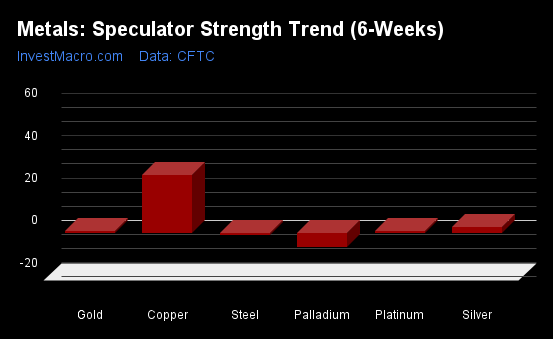
Rather than standing there reveling at copper and gold prices trading at or near multi-year highs, I instead decided to look “beneath the hood” at “conditions” that have quickly emerged as the standard bearer for the “Reflation Trade” that is quickly morphing into the new narrative for a large number of gargantuan traders.
Electrification
It was around the beginning of 2023, with the dominant narrative being that electrification metals like lithium and uranium are doing God’s work in alleviating the world’s sorry dependence on fossil fuels to provide heat and power to a growing global populace. Being a firm believer in the inevitability of electrification, I gravitated to the space not because I felt a moral or social obligation to avoid those necessary evils like oil and gas and coal. I did so because every time I looked into the mirror and saw a predominance of grey follicles in my beard, I came to the realization that my baby-booming generation of investors has little, if any, sway in influencing either market or social trends.
We are a dying breed of old, embittered gold bugs in constant search of that adrenalin rush that sent Foofoo Mines Ltd. in 1985 from $.10 to $2.00 on the release of drill core assays “too good to be true.” The reality in most cases was that a cabal of well-heeled traders with cavernous pockets full of excess margin could create junior market mania with three or four well-placed “Buy” orders designed to rip all resistance from any chart brave enough to be shown. As the volume alerts and price screeners kicked into gear, novice investors would clamor to buy any and all offerings that showed up while spreading the newly-found gospel called “King Foofoo” to any and all that might listen.
However, I digress.
The point I make is that the “old ways” of doing business in the junior resource sector have been replaced with the “new ways” by a socially responsible group of faux-liberal (with a small “L”) capitalists that will fight the carbon footprint as long as they have a $100,000 Tesla, a new model iPhone, and a pair of stovepipe dress pants too tight and too short for anyone other than a starving Biafran to wear.
The popularity of electrification in the investment narrative brought in huge moves in lithium, nickel, and uranium and I played all of those metals that seemed to explode right after the global central planners decided in March 2020 to shut down world trade and shutter its citizens in a desperate attempt to maintain the status quo of ever-rising equity markets and buoyant real estate. However, because young people these days have been fed a never-ending supply of behavior modification “medicines” (like Ritalin) to keep them “on task,” it appeared as though the vast majority of Millennial and Gen-X traders left their meds at home since 2020 lacking both the focus and resolve to stay invested much longer than the time it took for the ink to dry on their month-end statements.
On the topic of Attention Deficit Hyperactivity Disorder or “ADHD” as it has become known, when I was a young lad, as my mother recalled, I was known as an “active child.” Teachers referred to me as “fidgety” and “prone to distraction,” but it never affected either my behavior or my grades because of the use of a non-pharmaceutical method of attention control.
It was called a “yardstick,” and every teacher patrolled the classroom armed with this incredibly high-tech instrument. Just the sight of it protruding from the folded arms of a 110-lb., five-foot-tall, middle-aged lady teaching us geography would immediately imbed the entire list of world capitals into one’s memory banks, never, ever to be forgotten lest the wrath of “Old Yardie” come crashing down.
Yardsticks notwithstanding, I made a choice in early 2023 to refrain from falling in love (or lust) with any narrative deemed topical by the new generation of traders that run these markets.
Uranium
I turned to uranium and added Cameco Corp. (CCO:TSX; CCJ:NYSE) to my other holding, Western Uranium & Vanadium Corp. (WUC:CSE; WSTRF:OTCQX) in Q3 2023 and road it from $38 to $52 before exiting the uranium trade when it became apparent that the entire Twitterverse was long uranium juniors in every nook, cranny, and crevice of their investing superstructure.
Since my exit, the two “electrification darlings” of 2020-2023 have lagged badly. However, I remain a uranium “bull” and am seeking a re-entry level, hopefully soon.
Copper
While I was dabbling in the Li and U3O8 trades, I was quietly but steadily accumulating a basket of juniors that were not considered to be seen as “trades” but rather long-term positions with either excellent projects or discoveries and all of them are now fully funded and awaiting the commencement of drill programs in the hunt for or development of the one metal that is used universally the world over — copper.
I told subscribers in late 2022 that the two metals for the decade were copper and gold, with copper being the comprehensive answer to the electrification movement as whatever else happens with the establishment of new energy sources (like nuclear’s revival), the current global transmission grid would need to be expanded to accommodate all this new electricity being pumped out of all these new modular nuclear reactors.
Then, along comes another Millennial narrative called “artificial intelligence,” and as the mania of the decade fixes its grip on the investment world, they suddenly realize that all of this new computing power brought about by “AI” will require a boatload of additional electricity to power all of those new computers that will allow kindergarten kiddies to compose operatic symphonies with their iPhones driven by the magic of “AI”!
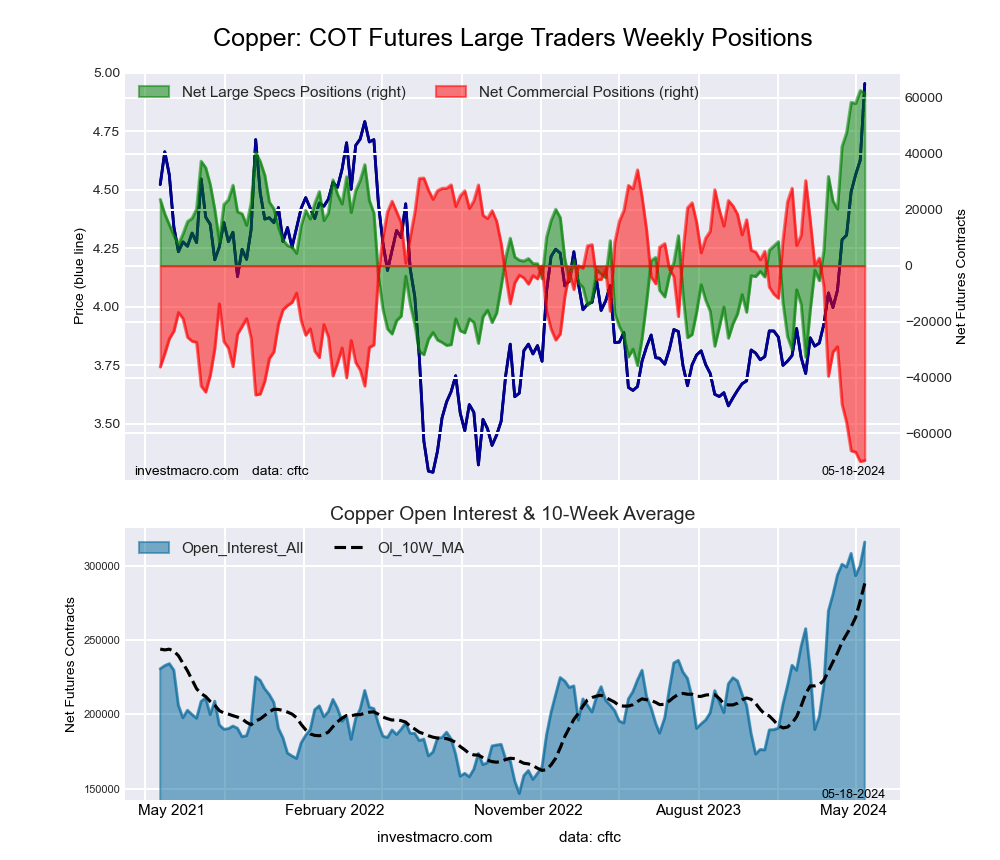
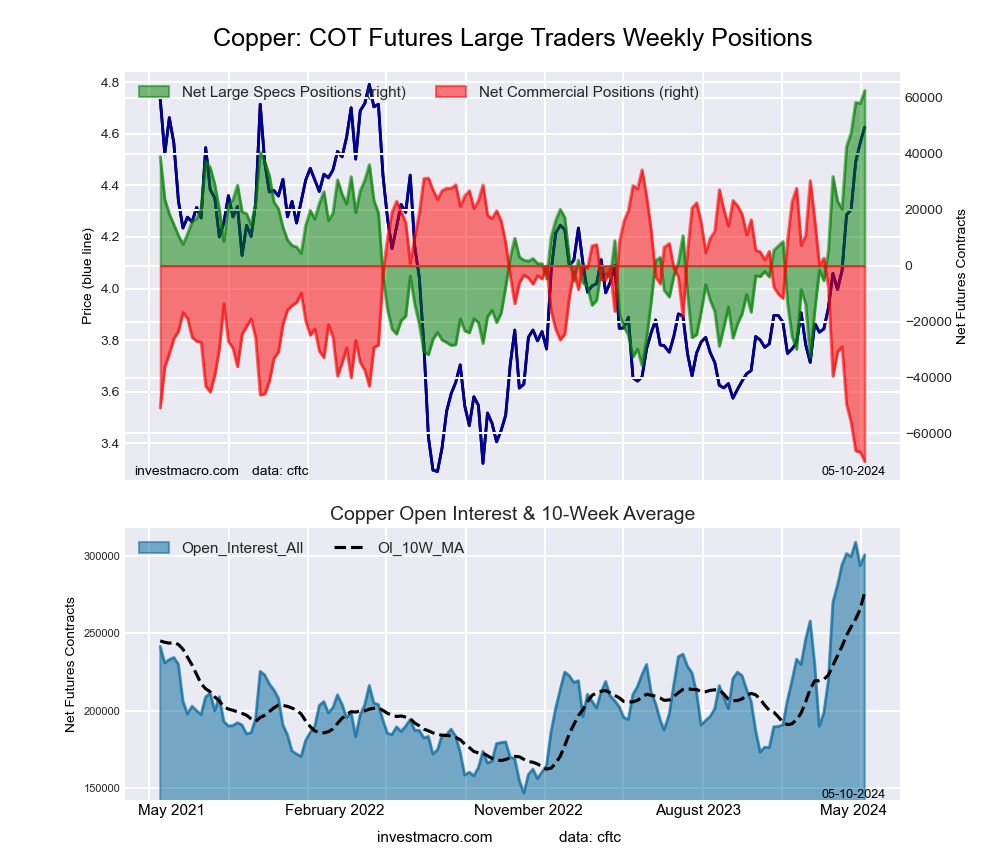
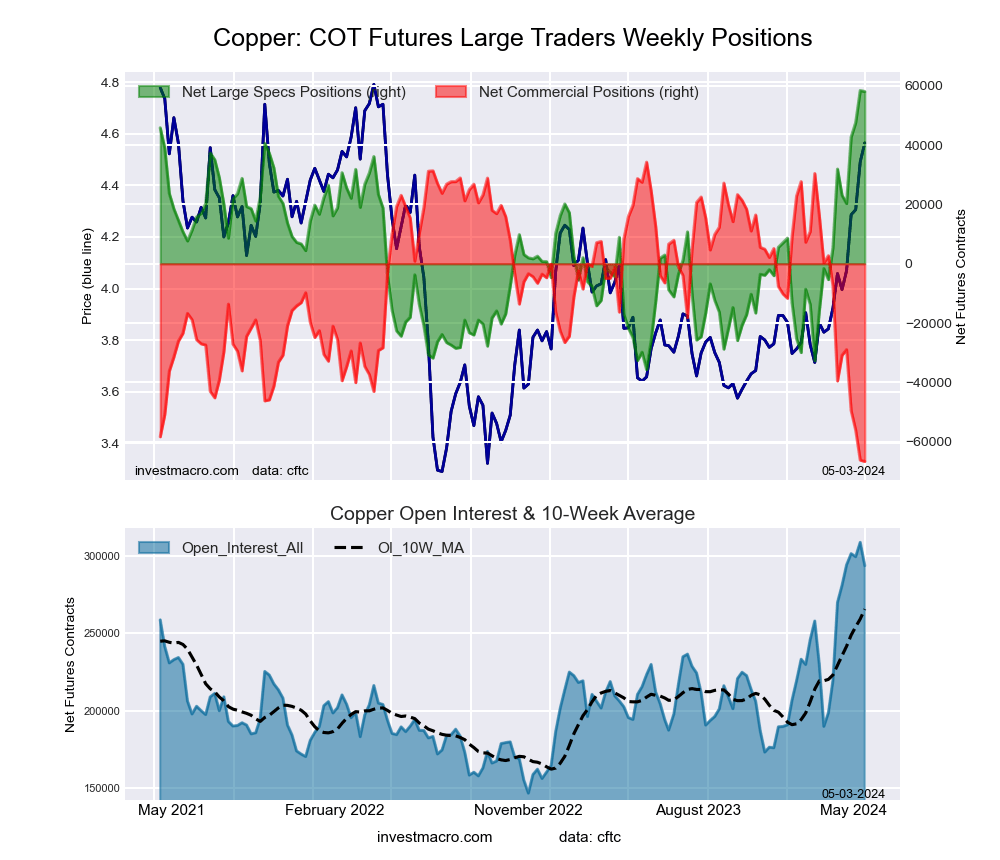
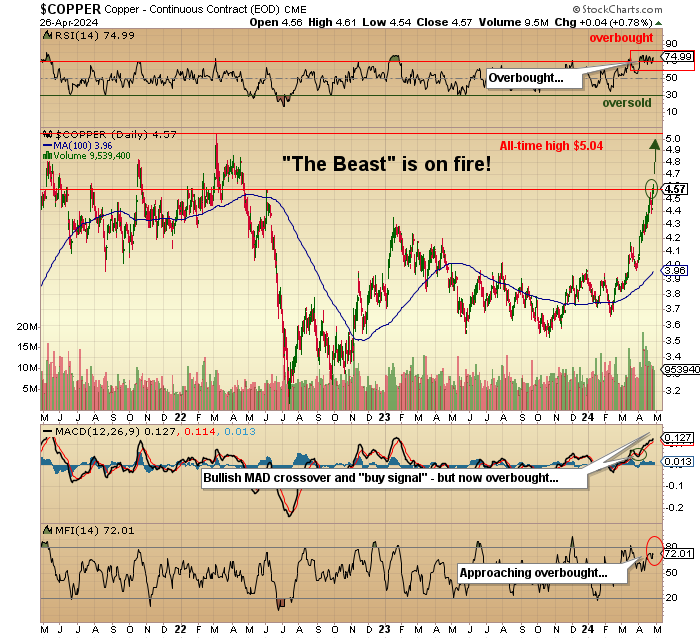
At this point in the weekly missive, I draw your attention to the earlier part where I spoke of an “epiphany of sorts” and that I was forced to “pinch myself” rather than revel in the glory of the 2024 performances of my two favorite metals. I would draw your attention firstly to copper, which just took out the June 2022 high at $4.57 while sporting a near-vertical ascent during the past month. It is now sporting an RSI at around 75, and while there is still a MACD “buy signal” in place, a couple of corrective days could trigger a reversal.
Up until mid-February, the ascent in copper had been gradual, but since then, the rise has moved to vertical. As I have written countless times, “any market whose trend moves from gradual to vertical is approaching a reversal of the prior trend”. So, copper is now overbought and in full vertical regalia, which means it may be like a bug in search of a windshield strictly from a technical perspective.
Now, when I make remarks such as these on a metal that is surely going to enter into a “structural deficit” within the next several quarters, the market appears to be discounting any likelihood of a global slowdown. I will exercise caution in chasing the big copper names. I have owned Freeport-McMoRan Inc. (FCX:NYSE) since $38 and will continue to hold it (at $50.50).
Despite the possibility of a correction, I see $75-100 by the end of 2025. A copper-gold leviathan, it is a core holding in any growth portfolio looking for the leadership of the cyclical names to replace technology as the next mania.
As for the juniors, I hold Fitzroy Minerals Inc. (FTZ:TSX.V; FTZFF:OTCQB) on the strength and promise of good things happening in their Chilean copper and Argentinian gold endeavors. I hear that field results are yielding some very interesting new revelations, and while they will be constrained by the South American winter, aggressive marketing of the new drill targets should set up an interesting drill program in the fall.
I also own American Eagle Gold Corp. (AE:TSXV), a very interesting little junior with a new copper-gold porphyry discovery in B.C. and an eager partner in Teck Resources Ltd. (TECK:TSX; TECK:NYSE) who at last glance own 19.9% of the company.
Their NAK discovery reported last January took the stock from under a dime to a high of CA$0.74 and is a solid “Buy” at around CA$0.60. I also added a brand new junior — Vortex Metals Inc. (VMSSF:OTCMKTS;VMS:TSX;DM8:FSE) by way of the recently announced (and upsized) placement at CA$0.09 (last at CA$0.13).
They are about to receive regulatory approval on a project located near the town of Illapel in north-central Chile, where a very interesting copper prospect exists. I listened to VMS director and ex-BHP country manager John Larson describe in minute detail the prospective nature of the multiple targets that exist. Also of extreme interest to me are the two Oaxaca (Mexico) prospects believed to be volcanogenic massive sulfide targets that were actually described to me by the late, great mine finder David Jones the year before he passed away.
A world-renowned expert in the exploration and exploitation of collapsed calderas (volcanos), he discovered Fortuna’s San Jose Gold Mine using techniques similar to what attracted him to the two Vortex targets. Chairman Michael Williams has brought investors a great deal of success with Underworld Resources (sold for $139 million to Kinross in 2009) and, more recently, Aftermath Silver, which subscribers know all too well from 2020. I am told that with the good graces of regulators and drill availability, Larson could be drilling Illapel by the end of next month.
With AE and VMS about to drill in May and with FTZ busy preparing for a fall start-up, 2024 is proving to be an interesting year with lots of irons in the fire hunting for the hottest metal on the planet.
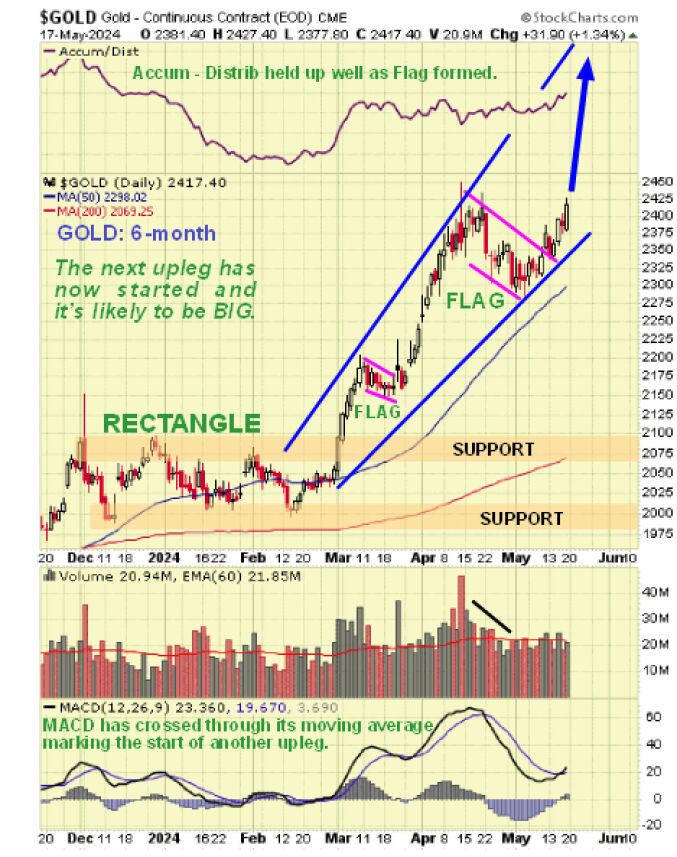
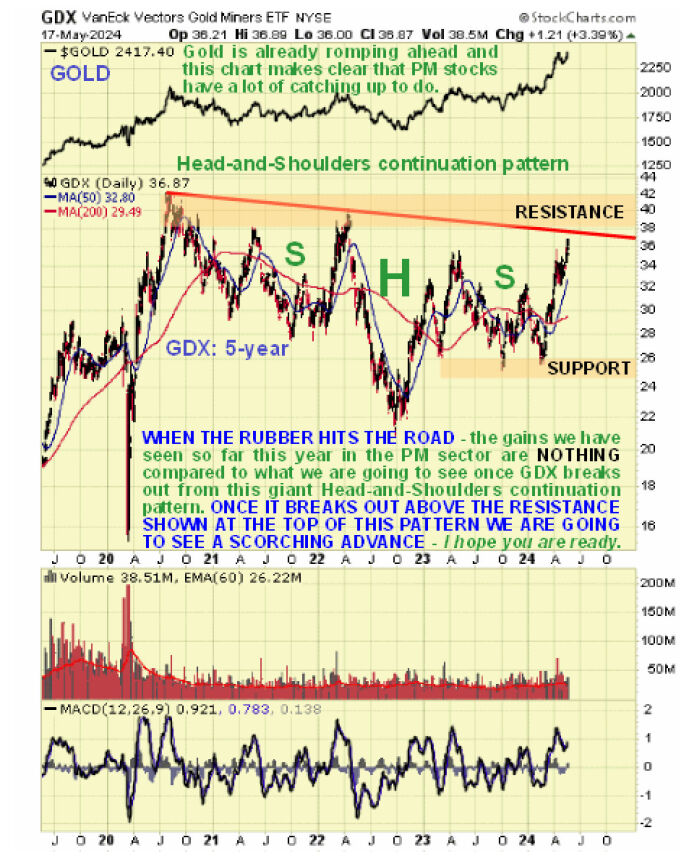
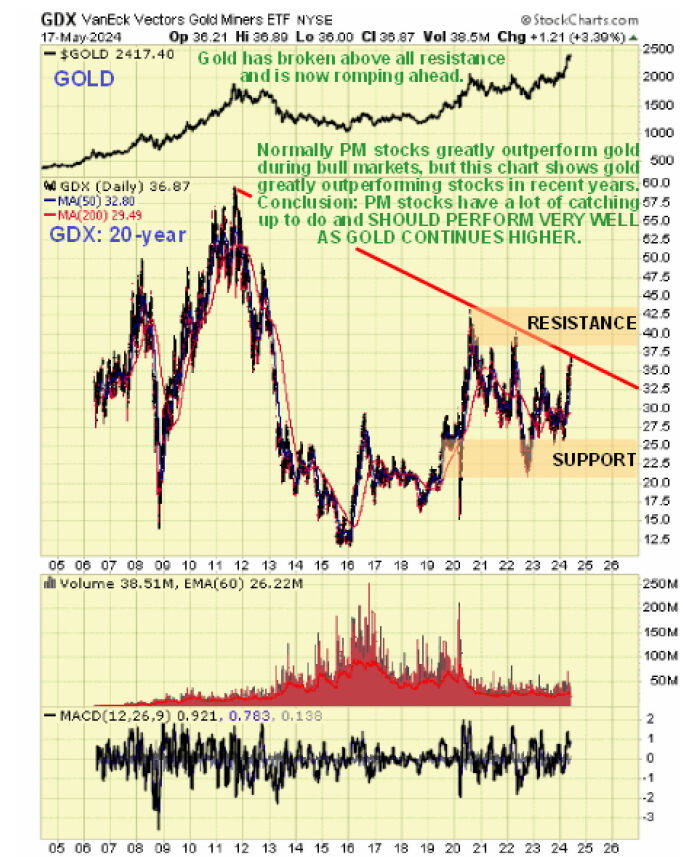
Gold
The second component of the metals story for 2024 (and beyond) is none other than my sentimental favorite since 1976 — gold. Let it be known that while I was a card-carrying gold bug for nigh on thirty-five years, the events since the 2008 Great Financial Bailout Crisis forced me to turn in my card. I spent years collecting gold and silver coins for their numismatic value while keeping a horde of non-perishable foodstuffs in basement compartments along with fresh
water and medical supplies. I even kept large vessels of iodine rumored to be a repellent for radioactive poisoning. Then, in and around April of 2013, I watched the global trading community, under express orders from the Wall Street and Washington elites, absolutely crush any and all bullish sentiment for gold and silver in the wee hours of the western trading morning with the infamous “Sunday Night Massacre” that vaulted the precious metals into a four-year bear market whose debilitating effects are still being felt in the junior gold mining world a full eleven years later.
At that moment, I went from being a gold “advocate” to a gold “cynic,” and in order to maintain both sanity and net worth, I had to diversify away from a “gold only” allocation mixture to one that included gold but along with other metals as well. As abhorrent to me as it was, the decision to revert control of my investment decisions to the objectivity of reason was the best thing I have ever done, lest I wind up on the scrap heap of failed promises and broken dreams.
To a very large degree, I still bear the scars of a criminal assault by those wielding both power and influence over the masses by way of ruthless control of the legislative and judicial branches of government. Alas, my only defense has been to simplify things to where gold is simply a beachball, being temporarily held beneath the surface by an overzealous and underpowered toddler.
Simple, no?
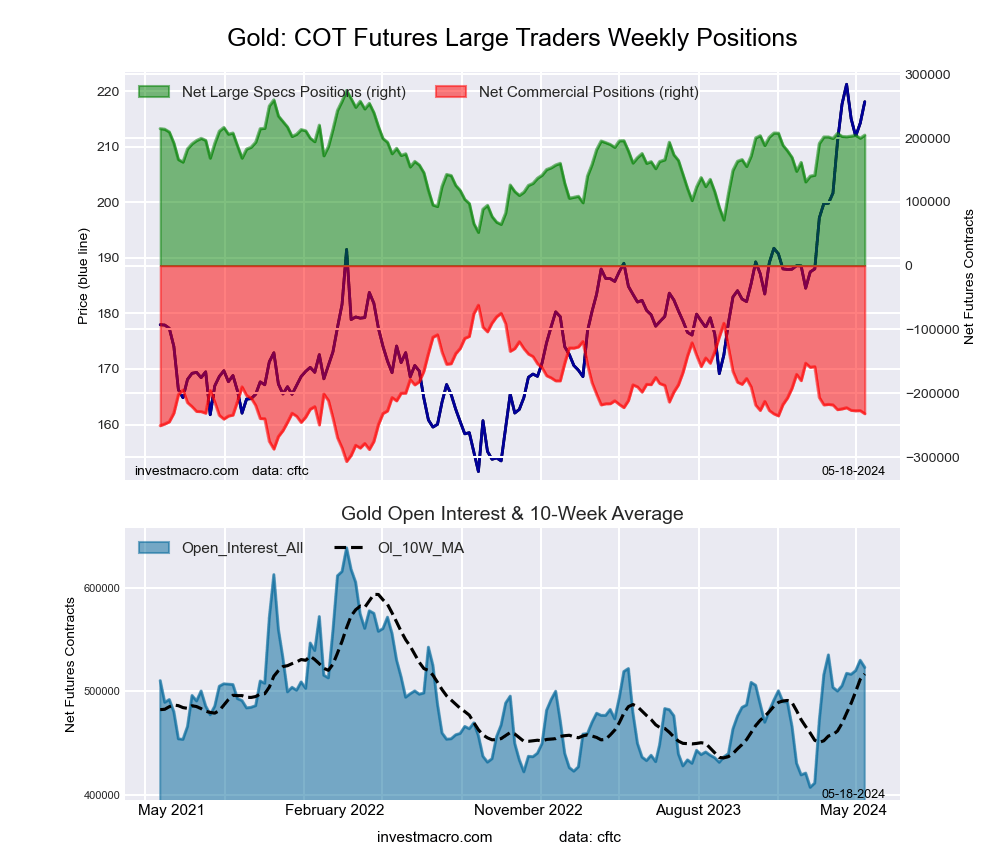
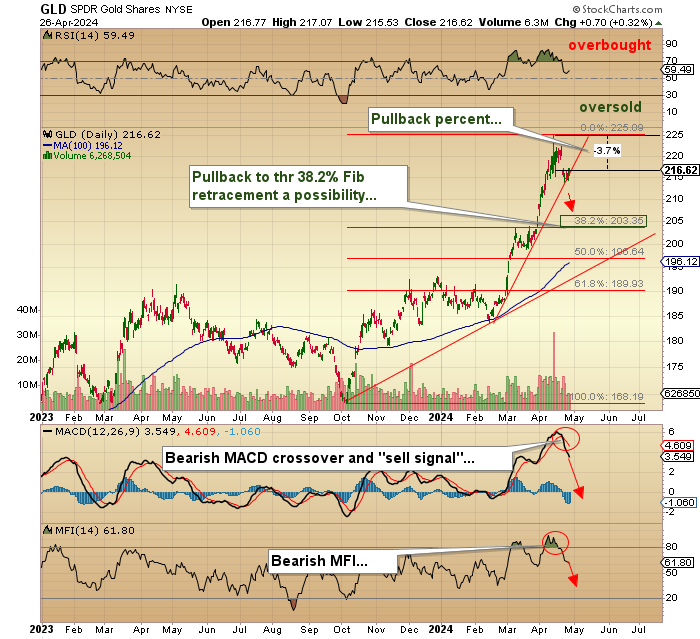
As measured by the SPDR Gold Shares ETF (GLD:NYSE) the giant ETF whose contained ounces have actually dropped on a year-to-date basis despite recent improvements, the gold market is currently in pullback mode, down approximately 3.72% from the recent top at $225.09. As astonishing as the constant drain of ounces from the GLD inventory, the very fact that it is occurring confirms a highly bullish fact: nobody believes the move. If we had GLD inventory rising sharply, we would know that the western retail public has finally and at long last “bought-in” to the notion that gold actually belongs in a portfolio, right up there beside APPL MSFT and Pets.com.
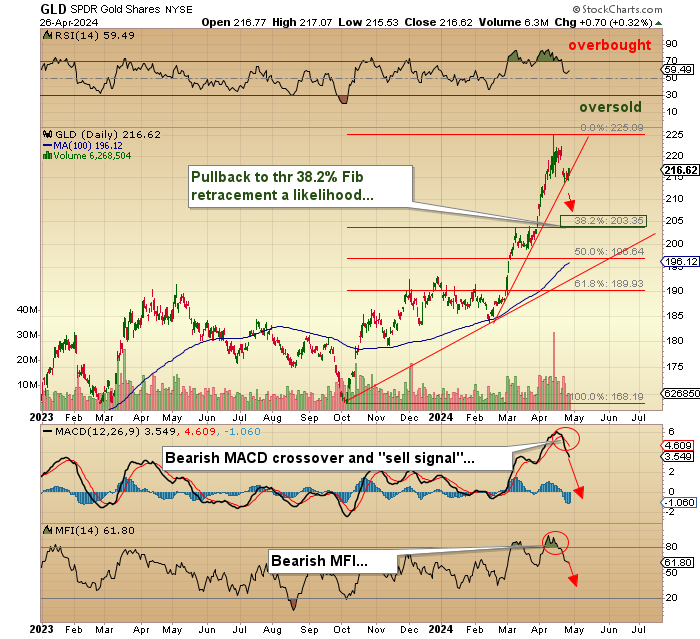
Technically, however, the pullback that began on April 12 is now in its third full week with both MACD and MFI on “sell signals” but with the RSI now down into the 57 area after spending the better part of six weeks in overbought status with a peak in the mid-80s. That is the bad news.
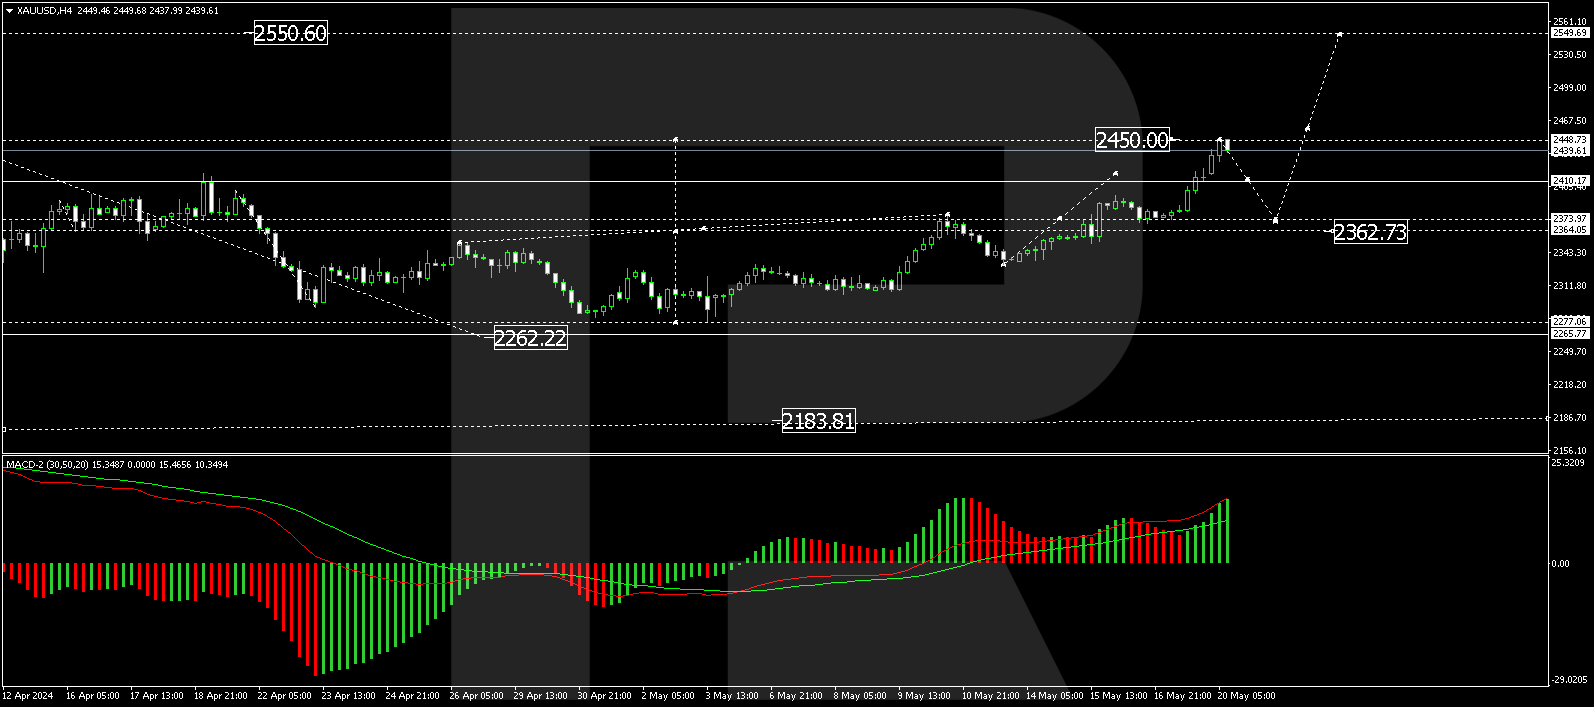
The good news is that GLD is nudging up against an uptrend line that dates back to the February lows around $184. If GLD can trade sideways for another few days allowing the RSI to retrace into the 40’s, it may stand a chance that we get a run to the highs first before anything more serious occurs. Failing that, the 38.2% Fibonacci retracement level is at $203.35, which for June Gold futures is around $2,220, and that level, while painful, would still leave the GLD market in great technical shape for a move to new highs by year-end. I remain a bull on gold and see GLD moving to around $246 on the next advance, which would be about $2,650 for June gold.
As for the junior gold explorers or developers, I continue to hold Getchell Gold Corp. (GTCH:CSE; GGLDF:OTCQB) as my premier selection. With 2,059,900 ounces of gold in the indicated and inferred category, the company now has a new Chairman, Robert Bass. He and his son Chris were added to the Board of Directors in January, which means that the insider group owns and/or controls over 20% of the issued capital.
Prior to those appointments, the number was closer to 1%. The company is busy completing metallurgical studies on the Fondaway Canyon ore in advance of a PEA expected by June. With the deposit wide open in all directions as to strike and to depth, there is considerable upside to resource and the share price. While the old timers tell me that gold ounces in Nevada should trade at $100/ounce, I have not seen anywhere near that number since 2011, and in fact, desperation deals in the past year were being done at $5-10 an ounce as funding completely disappeared and liquidity evaporated.
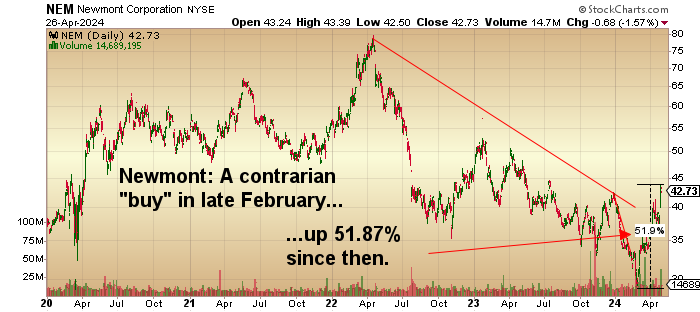
The good news for companies like GTCH came in the form of the Newmont Corp. (NEM:NYSE) earnings, which absolutely knocked the cover off the ball. Back in February, when the world of armchair gold analysts (wearing stupid oversized cowboy hats) were calling Newmont a “POS company” and bragging to the world that they were selling their stock, I tweeted out to my followers that it was the best “contrarian buy” of the year. I said then that Newmont was spending month after month acquiring companies with big gold assets and, in some cases, paying up (as in “too much”) as in their bid last year for Australian-based Newbridge Gold.
Well, how do those acquisitions look now? Their earnings soared, as did gold production, while AISC dropped sharply in direct contrast to the share price, up over 40% since they got thrown under the proverbial bus back in February. (I must confess that I did not include in my note to subscribers because I was more than adequately represented in senior gold allocation by way of Freeport, which still stands as Freeport has been a beast.) Then, late last week, Agnico Eagle reported their earnings, and they, too, blew the doors off and went out for the week at multi-year highs, but with record earnings and free cash flow, the stock is still 18.6% from its all-time high last seen in September 2020.
I believe that in the old horse chestnut that “there ain’t no fever like GOLD fever,” and if last week was just a fractional tidbit of a rotation by the monster generalist funds into the gold space, then I shudder to think what a move to a 5% allocation will look like as we had in the late 1970’s given that gold miner allocations are estimated to be in the fractions of a percent range today.
As these leviathan funds suddenly discover that they simply cannot own enough of the Newmonts and Barricks and Agnicos of the world, they will migrate down the ladder of quality and size, finally adding ounces of any size and shape and regardless of location, style, or depth. It is at this point in the equation that ounces in Nevada will indeed be priced not at USD $100 per ounce but at $300-500 per ounce.
Getchell Gold is valued at $13.36 per ounce of gold and is located in the heart of the best mining jurisdiction in the world — Nevada — and which is wide open to depth and long strike with what could easily evolve into a Tier One asset (5mm ounces or more) with further drilling and if course the blessing of the two goddesses of the junior mining world — Mother Nature and Lady Luck.
While it has been an excruciatingly long wait, I see a huge upside in the entire group of junior gold developers, but what attracts me to GTCH is that they are both developing an existing and growing resource while exploring for much, much more.
Important Disclosures:
- As of the date of this article, officers and/or employees of Streetwise Reports LLC (including members of their household) own securities of Cameco Corp., Western Uranium & Vanadium Corp., American Eagel Gold Corp., Vortex Metals Inc. and Getchell Gold Corp.
- Michael Ballanger: I, or members of my immediate household or family, own securities of: All. My company has a financial relationship with Fotzroy Minerals. I determined which companies would be included in this article based on my research and understanding of the sector.
- Statements and opinions expressed are the opinions of the author and not of Streetwise Reports, Street Smart, or their officers. The author is wholly responsible for the accuracy of the statements. Streetwise Reports was not paid by the author to publish or syndicate this article. Streetwise Reports requires contributing authors to disclose any shareholdings in, or economic relationships with, companies that they write about. Any disclosures from the author can be found below. Streetwise Reports relies upon the authors to accurately provide this information and Streetwise Reports has no means of verifying its accuracy.
- This article does not constitute investment advice and is not a solicitation for any investment. Streetwise Reports does not render general or specific investment advice and the information on Streetwise Reports should not be considered a recommendation to buy or sell any security. Each reader is encouraged to consult with his or her personal financial adviser and perform their own comprehensive investment research. By opening this page, each reader accepts and agrees to Streetwise Reports’ terms of use and full legal disclaimer. Streetwise Reports does not endorse or recommend the business, products, services or securities of any company.
For additional disclosures, please click here.
Michael Ballanger Disclosures
This letter makes no guarantee or warranty on the accuracy or completeness of the data provided. Nothing contained herein is intended or shall be deemed to be investment advice, implied or otherwise. This letter represents my views and replicates trades that I am making but nothing more than that. Always consult your registered advisor to assist you with your investments. I accept no liability for any loss arising from the use of the data contained on this letter. Options and junior mining stocks contain a high level of risk that may result in the loss of part or all invested capital and therefore are suitable for experienced and professional investors and traders only. One should be familiar with the risks involved in junior mining and options trading and we recommend consulting a financial adviser if you feel you do not understand the risks involved.