Archive for Metals

Geopolitical Distraction

Opinion — Source: Michael Ballanger (3/2/26) 

Michael Ballanger of GGM Advisory Inc. shares his view of current moves in geopolitics and the stock market. He also looks at one copper stock on his list and discusses PDAC.

As we head into the month of March, the headline that dominated the last weekend of February was the U.S.-Israeli attacks on key Iranian targets, which included the killing of Iranian Supreme Leader Ayatollah Ali Khamenei and (allegedly) several of his top military and political staff. Described as a “massive intelligence failure” by the Iranian leadership, the stage has been set for regime change in a country that has been threatening “Death to America” since the overthrow of the Shah of Iran in February of 1979.

CNN, Fox, the BBC, and Bloomberg have been flashing headlines for the past 48 hours that have viewers morbidly riveted to the television screens grasping for any and all confirmation that the theocracy has been eliminated. Unfortunately, despite there being a democratically-elected president in Iran, the only real power lies with the Islamic clerics whose foreign policy strategy has supported (and funded) many terrorist organizations over the past three decades.

  • Hezbollah (Lebanon): Iran’s most powerful and capable proxy, receiving an estimated $700 million annually. Iran provided the foundation for the group in the 1980s and continues to supply sophisticated missiles and air-defence systems.
  • Hamas (Palestinian Territories): A Sunni militant group that has received up to $350 million per year as of 2023 for its operations against Israel. Support includes rocket technology and military training.
  • Palestinian Islamic Jihad (PIJ): Heavily dependent on Iran for its budget, training, and weaponry. It is often described as Tehran’s most loyal Palestinian proxy.
  • The Houthis (Yemen): Formally known as Ansar Allah, they receive advanced UAVs (drones), ballistic missiles, and maritime attack capabilities from Iran, which they have used to target international shipping in the Red Sea.

As a result, years of waffling by Western nations, including the U.S., have allowed the Iranians to construct an informal yet effective counter presence to the domination of the Israeli military in the Middle East region. As always, heavy lobbying by the Israeli supporters in Washington has turned the tide, and now the world faces a direct declaration of war against Iran led by Israel and backstopped by the massive American strike force now positioned in the Gulf, armed and ready to unleash shock-and-awe power on the Iranians. I suspect that surveillance over the Straits of Hormuz will be intense, as over 20 million barrels of oil pass through the waterway each day, representing over 20% of global oil production. As the passage is only 21 miles across at its narrowest point, any steps to block tankers from navigating the Straits would be catastrophic to the world economy.

However, as is the case with all geopolitical events, their impact on markets is usually short, sharp, and swift and rarely cause protracted declines in stocks or rises in gold but ancillary effects of the conflict such as the closing of the Straits of Hormuz would send oil prices into a vertical trajectory that has some pundits calling for $100/bbl. as a result. The inflationary impact of such a price spike would be immediate, so the beneficiaries would be gold and silver, but not the mining stocks, because the greater portion of input costs for those miners is energy, with a specific focus on diesel, which powers trucks, and front-end loaders and drill rigs.

I expect oil to gap up into the $70 range overnight unless the evidence shows that the oil-producing facilities are untouched or that hostilities have abated.

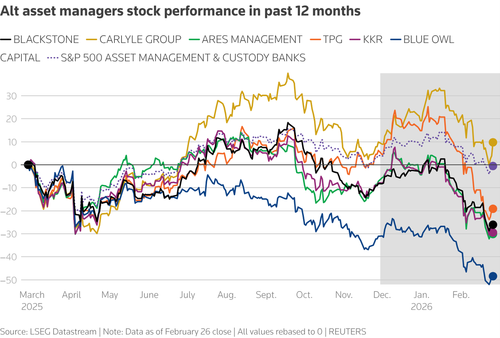
As much as I have narrowed this discussion to the weekend attacks on Iran and the death of Khamenei, it has camouflaged what I believe was an even bigger story for the global capital markets last week and that was the sudden failure of Market Financial Solutions (MFS) which specialized in housing bridging loans and, as was well-stated by Zerohedge on Sunday, “is a mutant melange of all the worst traits of both Tricolor and First Brands — last year’s Private Credit implosion superstars — which collapsed virtually overnight having previously attracted backing from firms such financial giants as Barclays, Apollo’s Atlas SP Partners unit, Jefferies (which is now two for two after its participation in the First Brands bankruptcy) and TPG.

The practice that sank this outfit was the “rehypothecation” of underlying collateral with multiple lenders many times over, such that an asset worth £230 million has over £1.2 billion in debt pledged against it. While these practices are essentially fraud, they never get revealed until there is concern over the underlying asset, and once any one lender demands the collateral, the Ponzi scheme collapses, taking everyone with it.

The MFS story surfaced on Thursday night, but the initial hiccup on Wall Street with the DJIA off over 700 points in the first hour was met with aggressive dip-buying all session, with the bulk of the sell-off not in the software stocks but in the financials, where the selling was broadly-based and across-the-board.

Global skirmishes rarely cause prolonged market declines, but credit events do, as we saw in 2008 with the initial collapse of the two Bear Stearns hedge funds tied to subprime loans. Wall Street shrugged off those two failures, citing “containment” to only one firm. As we all found out later, it was not “contained” and was in fact “systemic,” eventually taking the entire global financial system to the point of full-on collapse.

I would point to the failures of Tricolor and First Brands last October, followed by last week’s blow-up by MFS, as evidence of more cockroaches appearing in the kitchen of private credit, and just like Wall Street’s full denial back in 2007 of any possible contagion, these were the headlines in October worth noting:

  • Wall Street lenders see limited fallout from bankruptcies
  • JPMorgan CEO warns of potential credit market excess
  • BlackRock CFO sees strong credit quality despite bankruptcies

To see the name “Blackrock” up there referring to “strong credit quality” is far more impactful than the events in Iran, which are now looking like a purposeful distraction, deflecting all eyes away from the escalating rot that is again starting to envelop the financial sector just as it did eighteen years ago.

So, when I see the gold and silver miners in retreat next week despite rising gold and silver prices, I will look to rising oil and collapsing credit as the culprits.

Fitzroy

I had the pleasure of sitting down to a luncheon with Fitzroy Minerals Inc. (FTZ:TSX.V; FTZFF:OTCQB) Chairman Campbell Smyth as well as CEO Merlin Marr-Johnson along with two current investors on Saturday and watched and listened as they mapped out the game plan for Fitzroy for 2026 and the rationale for raising over CA$20 million (announced last week) while sitting with nearly CA$12 million in the bank. A large number of investors have asked me why they elected to dilute current shareholders now instead of more drilling at both Buen Retiro and Caballos before financing. With 330 million shares issued, the new financing for “up to CA$26 million” by way of LIFE and concurrent private placement offerings could add up to 78 million additional shares, which would capitalize the deal at CA$204 million (assuming full dilution).

A few subscribers came back with the “CA$204m for an exploration company not yet in production? Isn’t that rich?” so when I threw that out in front of Smyth and Marr-Johnson, their explanation was at once both revealing and exciting.

The key to the transaction lies in the agreement signed on July 3, 2023, when pre-Fitzroy company Ptolemy Inc. entered into the earn-in with Pucobre SA, which at the time was a US$800m Chilean copper miner specializing in small-scale oxide deposits. The terms included:

  • Work Commitment: Ptolemy must carry out a US$7,000,000 work program over four years.
    • Year 1: US$2,000,000.
    • Years 2–4: US$5,000,000 (minimum US$1,000,000 in any consecutive 12-month period).
  • Option Exercise: In Year 5, Ptolemy can exercise the option to acquire 100% ownership with a US$4,000,000 payment.
  • Royalties: Vendors retain a 2% Net Smelter Royalty (NSR), with a 1% buyback provision for US$5,000,000 prior to production.

Pucobre’s 30% Clawback Right 

  • Clawback Right: After Ptolemy completes the acquisition, Pucobre has the right to purchase back up to 30% of the local subsidiary holding the asset.
  • Purchase Price: The price is calculated as three times 30% of the sum of:
    1. A fixed US$300,000 amount.
    2. All investment made by Ptolemy related to the Buen Retiro Option.
  • Post-Clawback: If exercised, Pucobre will fund the project pro rata or face dilution.

Following these initial agreements, Fitzroy Minerals Inc. completed the acquisition of Ptolemy Mining Limited in March 2025, thereby assuming these option terms.

So now, Fitzroy Minerals has until July 3, 2028, to complete the remaining terms after which they will have earned a full 100% interest in the Buen Retiro project. Where this gets interesting lies in that “clawback provision” (“CP”). If Pucobre SA elects to exercise the CP, they are obligated to pay FTZ/FTZFF 90% of all expenditures retroactive to Day One. So, if the company were to spend the entire CA$26 million in expanding both the economically-viable oxides and the newly-discovered sulphide zone, they would be refunded CA$23.4 million and wind up with 70% interest in the project.

The initial expectation is an operation generating 20m lbs. of Cu with a margin of around US$4/lb. at US$6.00/lb. Cu. The CAPEX for this operation would be approximately US$50m of which Fitzroy’s portion would be 70% or US$35m. Commencing in 2028, the company could potentially receive US$56m/year of free cash flow with an expected mine life of eight years.

According to Marr-Johnson, that would justify a US$400m market cap or a little under US$1.00 per share for FTZ/FTZFF, and since the copper-bearing oxides at Buen Retiro have been thoroughly tested with over 40k metres of drilling, there is little risk (other than the copper price) to the achievement of that valuation.

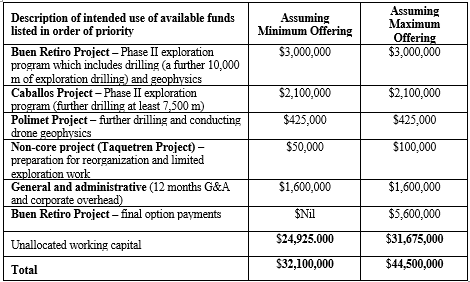
However, it will require money and lots of it in order to successfully execute the milestones set out in the earn-in agreement, so rather than gamble on the financing environment down the line, they elected to take the prudent course of action and access the larger institutional market now, and that, my friends, was simply a brilliant move. At the end of the day, they will have a CA$32m war chest with which to compete all terms of the earn-in and still have enough money for a 10,000m drill program at Buen Retiro and “at least” 7,500m of drilling at Caballos.

I have never encountered any exploration company in my five-decade career that can drill out a project knowing with confidence that 90% of whatever they spend will be returned by an eager and established partner. More importantly, since equity markets are valued at over two standard deviations above the norm, with technology stocks led by “AI” now rolling over, there is no need for concern about a funding shortfall at least until well into 2027. Hopefully, by then, the company has established economic viability of the deeper Cu-bearing sulphide zone(s) and the same for Caballos, two accomplishments that would move the implied market cap for FTZ/FTZFF to north of US$1 billion (or around US$2.50 on a fully-diluted basis).

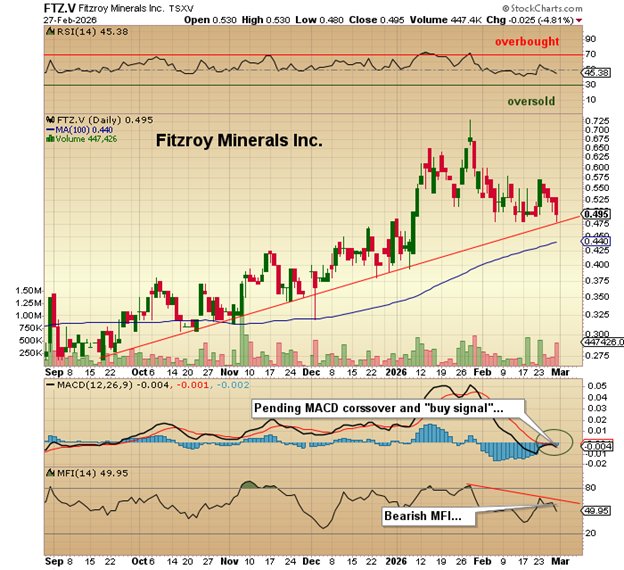
One final observation from the luncheon: This is a well-oiled and seasoned team of proven professionals running Fitzroy’s two flagship programs. With this financing, they have brought in large, deep-pocketed global investment firms from the U.K. and Australia as strategic investors. One of these investors that constituted the lead order in the raise gave instructions to Merlin Marr-Johnson which resonate strongly: “Go find us “BIG COPPER.” With that as a clarion call, I urge all subscribers to heed the words because with that, FTZ/FTZFF has finally entered the “big leagues” of junior exploration and development as there is less risk today at CA$0.50 than there was last June at CA$0.30.

PDAC

The largest collection of mining promoters on the planet can be found at noon on Sunday at the Toronto Metro Convention Centre where the Prospectors and Developers Association of Canada (“PDAC”) annual convention gets underway with what could be the largest attendance in the history of the show. Established in 1932, the association expanded their annual meeting to a full-day affair and then later in 1944 moved to the Royal York Hotel to accommodate the large increase in both members and attendees.

Since 1997, it has become the biggest gong-show in North America with hundreds of mining companies both junior and senior all vying for the attention of the retail and institutional investor complete with contests, featured speakers, investment workshops, and the usual parade of carnival barkers, confidence men, and charlatans all doing what they must to relieve us of our hard-earned savings all in the quest for untold wealth and instant enrichment by way of the drill bit.

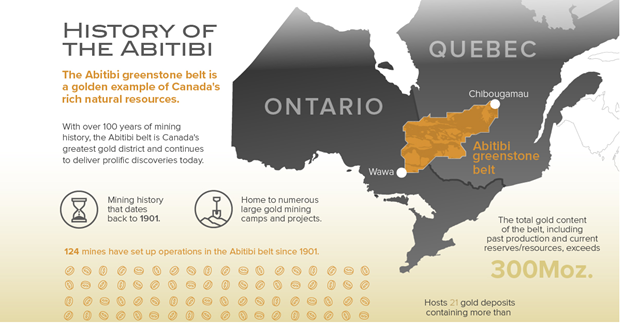
Mark Twain was once asked the definition of a gold mine, and he answered, “a hole in the ground with a liar at the top,” in what over the years has grown to be a somewhat accurate measure of the veracity of the claims made by those looking for investors to finance a project. In the old days of the early 1900’s it was farmers from southwest Ontario what had most of the disposable wealth in the country and it was their money that funded big discoveries in the north in small towns like Cobalt and Kirkland Lake that led to the discovery of the mighty Abitibi Greenstone Belt, a geological province stretching from northwestern Quebec to Wawa, Ontario that was the source of over 190–200 million ounces of gold, more than 35 billion pounds of zinc, 15 billion pounds of copper, and at least 400 million ounces of silver.

Many of these discoveries were aided and abetted by the PDAC convention, where it showcased actual samples of rock containing all of the metals mentioned above. When I first attended in 1981, the booths were filled with mining people with few “suits”, many “lumberjack jackets”, and rarely a female. That all changed in the 1980s during a particularly flat period for the metals. During the years after gold’s top in 1980 at $857 per ounce, PDAC conventions needed to re-invent themselves from standard industrial-style “workshops” that featured core shacks and claim maps to something more akin to the trade shows in Miami and Las Vegas, where the marketing wizards utilized new technologies to attract investors. By the mid-1980s, the booths were lit up with lights and music and free giveaways like key chains, calendars, and baseball caps, all designed to get bodies into the aisles where they could be corralled into booth after booth and in front of arguably the finest pitchmen on the planet.

My friend Robert Bishop and I were once having a conversation in the newsletter section where Bob was signing up the odd straggler to his advisory service “The Gold Mining Stock Report” which at the time was the singular best source of junior mining information and advice that money could buy. However, Bob was struggling to make a living while twenty feet away, another newsletter writer, James Dines, had engaged two gorgeous, tall platinum blondes to man the booth, complete with jaw-dropping cleavages bursting from low-cut evening gowns. Lined up to subscribe to the vastly inferior Dines Letter were perhaps fifty to one hundred goggle-eyed “investors”, all male and all clamouring for a chance to stand and fill out the forms handed to them by ladies as they bent over lasciviously to deliver the papers. Eventually, Bishop’s research and diligence moved him to the pinnacle of his industry and when he retired in 2007, he was the heavyweight champion of the junior mining newsletter world with no one within miles of his title. That day, however, he was an afterthought as Dines ruled the venue.

I also recall the period in the mid-1990’s after Bob had delivered Dia Met Minerals ($0.60 to $60), Arequipa ($0.25 to $34.75), and Diamondfields ($0.25 to $160) and had several thousand paid subscribers as I was walking with him down one of the aisles at the convention centre when I said “Hey Bob, look behind you.” at which point we both turned to see a line of perhaps fifty or sixty promoters, investor relations executives, and seniors carrying shopping bags full of baseball caps, calendars, and key chains all waiting for a chance to catch Bob’s attention. I turned to him and said, “Nice entourage you’ve developed!”

PDAC can be a great source of networking and idea-generation, but with the advent and rise of social media and the internet, the value of the conference these days is catching up with old colleagues who have enough scars on their backs and faces to have earned the right of PDAC passage. Those Johnny-come-Latelys attending for the first time after dumping all of their crypto or artificial intelligence stocks have zero scars and little right to assume the role of “PDAC Member” despite the fact that they paid the fee and now have a name tag. Attendance in 2020 was 23,000 people, and after being strictly “virtual” in 2021, it has since grown to 27,000+ in 2025. This year, the estimates are for a full 30,000 or more people to be in attendance.

It should be remembered that there is a seasonal hangover just after the convention that can last for up to four months. In fact, one of the older veterans I used to speak with used to sell all of his junior mining issues and not take any phone calls until August. He once emailed me the results, and while this was back in 2011, it showed an uncanny track record of avoiding the summer doldrums in most years when interest in exploration and development issues waned, and prices retrenched right up until mid-August. His spreadsheet confirmed that the performance of the TSX Venture Exchange was inferior in most years between March and August but vastly superior between August and March. From my own years of experience, June and July can be problematic, but I always tried to focus on companies that had active catalysts attracting investor attention during those months, and have been fortunate to have benefited, for the most part.

I think that the trend of metal prices will have copper at the forefront at PDAC 2026, whereas last year it was gold and silver. I also believe that the rise in valuation for many of the mid-tier metal producers are going to force investors to move down the risk-curve to begin to include non-producers and favour the developers. That should favour those companies fortunate enough to have established an economic resource. As valuations increase for the developers, it will ultimately force investors to populate the bottom rung of the junior mining food chain — the explorers — and that is where the fun should start, and also, regrettably, mark the end of the cycle. When the junior explorers start to rise on rank speculation, that is when we will be exiting the space and raising cash.

As for the PDAC “curse” that has the TSXV regressing into a three to four month corrective phase, I will need to watch metal prices and energy to see if they can countermand the seasonal softness that accompanies the post-PDAC period.

My guess is that the developers may dodge the bullet, but that the seniors and mid-tier names trade flat or lower. I shall remain focused on those companies with solid stories and active catalysts, most of which are contained in the GGMA 2026 Trading and Portfolio accounts.


Important Disclosures:

  1. As of the date of this article, officers, contractors, shareholders, and/or employees of Streetwise Reports LLC (including members of their household) own securities of Fitzroy Minerals.
  2. Michael Ballanger: I, or members of my immediate household or family, own securities of:  Fitzroy Minerals. My company has a financial relationship with: None. My company has purchased stocks mentioned in this article for my management clients: None. I determined which companies would be included in this article based on my research and understanding of the sector.
  3. Statements and opinions expressed are the opinions of the author and not of Streetwise Reports, Street Smart, or their officers. The author is wholly responsible for the accuracy of the statements. Streetwise Reports was not paid by the author to publish or syndicate this article. Streetwise Reports requires contributing authors to disclose any shareholdings in, or economic relationships with, companies that they write about. Any disclosures from the author can be found  below. Streetwise Reports relies upon the authors to accurately provide this information and Streetwise Reports has no means of verifying its accuracy.
  4. This article does not constitute investment advice and is not a solicitation for any investment. Streetwise Reports does not render general or specific investment advice and the information on Streetwise Reports should not be considered a recommendation to buy or sell any security. Each reader is encouraged to consult with his or her personal financial adviser and perform their own comprehensive investment research. By opening this page, each reader accepts and agrees to Streetwise Reports’ terms of use and full legal disclaimer. Streetwise Reports does not endorse or recommend the business, products, services or securities of any company.

For additional disclosures, please click here.

Michael Ballanger Disclosures

This letter makes no guarantee or warranty on the accuracy or completeness of the data provided. Nothing contained herein is intended or shall be deemed to be investment advice, implied or otherwise. This letter represents my views and replicates trades that I am making but nothing more than that. Always consult your registered advisor to assist you with your investments. I accept no liability for any loss arising from the use of the data contained on this letter. Options and junior mining stocks contain a high level of risk that may result in the loss of part or all invested capital and therefore are suitable for experienced and professional investors and traders only. One should be familiar with the risks involved in junior mining and options trading and we recommend consulting a financial adviser if you feel you do not understand the risks involved.

Gold Rallies for Fifth Day, With External Risks Mounting

By Analytical Department RoboForex

Gold rose to 5,350 USD per ounce on Tuesday, marking its fifth consecutive session of gains. Demand for safe-haven assets continues to grow amid the escalating conflict in the Middle East.

President Donald Trump stated that the United States will continue its strikes on Iran until the country loses its ability to pose a threat. According to him, the conflict could last a month or “much longer.” In response, Iran has announced the closure of the Strait of Hormuz and threatened attacks on ships passing through this strategically vital energy corridor.

The worsening conflict has triggered a sharp rise in oil prices and intensified fears of accelerating US inflation. This has led to selling in US government bonds and a reassessment of expectations for further Federal Reserve rate cuts.

The market is now shifting its forecast for the next Fed rate cut to September, later than previously anticipated.

Technical Analysis

On the H4 XAU/USD chart, the market is forming a consolidation range around the 5,353 USD level. A downside breakout would open the way for a continuation of the correction towards 5,130 USD. Conversely, an upside breakout would open up potential for a wave towards the 5,599 USD level. The MACD indicator confirms the current momentum, with its signal line at highs and pointing strictly upwards.

On the H1 chart, the market has broken below the 5,333 USD level, suggesting a continuation of the trend towards 5,166 USD, with the potential for the wave to extend further to 5,130 USD. The stochastic oscillator supports this scenario, with its signal line remaining above the 80 level and under pressure to turn lower towards the 20 level.

Conclusion

Gold’s rally to record highs reflects escalating demand for safe-haven assets amid intensifying geopolitical risks in the Middle East. The conflict has not only boosted bullion but also lifted oil prices and stoked concerns about inflation, prompting markets to push back expectations for Fed rate cuts. While the short-term technical outlook remains bullish, traders are watching for potential corrections following such a strong upward move.


Disclaimer

Any forecasts contained herein are based on the author’s particular opinion. This analysis may not be treated as trading advice. RoboForex bears no responsibility for trading results based on trading recommendations and reviews contained herein.

COT Metals Charts: Copper Speculator Bets rebound after 7 Down Weeks

By InvestMacro

Metals Open Interest COT Chart
Here are the latest charts and statistics for the Commitment of Traders (COT) data published by the Commodities Futures Trading Commission (CFTC).

The latest COT data is updated through Tuesday February 17th and shows a quick view of how large traders (for-profit speculators and commercial entities) were positioned in the futures markets.

Weekly Speculator Changes led by Copper

Metals Net Positions COT Chart
The COT metals markets speculator bets were overall higher this week as four out of the six metals markets we cover had higher positioning while the other two markets had lower speculator contracts.

Leading the gains for the metals was Copper (13,458 contracts) with Silver (1,048 contracts), Steel (344 contracts) and Platinum (263 contracts) also recording positive weeks.

The markets with declines in speculator bets for the week were Gold (-97 contracts) and with Palladium (-21 contracts) also seeing lower bets on the week.

Copper Bets rebound after 7 Down Weeks

Highlighting the speculator bets this week was copper, which rebounded with a weekly gain of +13,458 net contracts. Copper had seen lower speculator bets in the preceding seven consecutive weeks, which had dropped the Copper speculator position to the lowest level since October.

This week’s positive rebound shoots the overall net speculator position back up over +59,000 contracts, the most bullish level since December 30th. Overall, Copper speculator positions have been consistently in a bullish standing, dating back to March 5th of 2024, a span of 102 consecutive bullish weeks.

Silver leads Metals Markets Price Performance this week

Silver bounced back this week with a 5.62% gain over the past five days. This was followed by Platinum which rose by 4.94% over that same period.

Gold was higher by 3.82% while Palladium showed a rise of 3.67%, and rounding out the gainers was Copper with a 1.86% increase.

Steel was virtually unchanged on the week with a -0.03% dip.


Metals Data:

Metals Table COT Chart
Legend: Weekly Speculators Change | Speculators Current Net Position | Speculators Strength Score compared to last 3-Years (0-100 range)


Strength Scores led by Steel & Palladium

Metals Strength Scores COT Chart
COT Strength Scores (a normalized measure of Speculator positions over a 3-Year range, from 0 to 100 where above 80 is Extreme-Bullish and below 20 is Extreme-Bearish) showed that Steel (97 percent) and Palladium (95 percent) lead the metals markets this week.

On the downside, Gold (36 percent), Platinum (42 percent) and Silver (42 percent) come in at the lowest strength level currently.

Strength Statistics:
Gold (36.3 percent) vs Gold previous week (36.3 percent)
Silver (42.4 percent) vs Silver previous week (41.0 percent)
Copper (88.5 percent) vs Copper previous week (76.0 percent)
Platinum (41.9 percent) vs Platinum previous week (41.2 percent)
Palladium (95.2 percent) vs Palladium previous week (95.3 percent)
Steel (96.9 percent) vs Steel previous week (95.1 percent)


Steel & Copper top the 6-Week Strength Trends

Metals Trends COT Chart
COT Strength Score Trends (or move index, calculates the 6-week changes in strength scores) showed that Steel (12 percent) and Copper (1 percent) lead the past six weeks trends for metals.

Gold (-28 percent), Platinum (-14 percent) and Silver (-7 percent) are the leaders of the downside trend scores currently.

Move Statistics:
Gold (-27.8 percent) vs Gold previous week (-29.2 percent)
Silver (-7.0 percent) vs Silver previous week (-9.5 percent)
Copper (1.4 percent) vs Copper previous week (-13.0 percent)
Platinum (-14.4 percent) vs Platinum previous week (-14.9 percent)
Palladium (-0.6 percent) vs Palladium previous week (7.2 percent)
Steel (11.8 percent) vs Steel previous week (6.9 percent)


Individual Markets:

Gold Comex Futures:

Gold Futures COT ChartThe Gold Comex Futures large speculator standing this week totaled a net position of 159,915 contracts in the data reported through Tuesday. This was a weekly decline of -97 contracts from the previous week which had a total of 160,012 net contracts.

This week’s current strength score (the trader positioning range over the past three years, measured from 0 to 100) shows the speculators are currently Bearish with a score of 36.3 percent. The commercials are Bullish with a score of 57.3 percent and the small traders (not shown in chart) are Bullish with a score of 73.7 percent.

Price Trend-Following Model: Strong Uptrend

Our weekly trend-following model classifies the current market price position as: Strong Uptrend.

Gold Futures StatisticsSPECULATORSCOMMERCIALSSMALL TRADERS
– Percent of Open Interest Longs:52.421.712.7
– Percent of Open Interest Shorts:13.170.03.7
– Net Position:159,915-196,78236,867
– Gross Longs:213,43288,23751,821
– Gross Shorts:53,517285,01914,954
– Long to Short Ratio:4.0 to 10.3 to 13.5 to 1
NET POSITION TREND:
– Strength Index Score (3 Year Range Pct):36.357.373.7
– Strength Index Reading (3 Year Range):BearishBullishBullish
NET POSITION MOVEMENT INDEX:
– 6-Week Change in Strength Index:-27.830.2-22.0


Silver Comex Futures:

Silver Futures COT ChartThe Silver Comex Futures large speculator standing this week totaled a net position of 24,003 contracts in the data reported through Tuesday. This was a weekly boost of 1,048 contracts from the previous week which had a total of 22,955 net contracts.

This week’s current strength score (the trader positioning range over the past three years, measured from 0 to 100) shows the speculators are currently Bearish with a score of 42.4 percent. The commercials are Bullish with a score of 54.3 percent and the small traders (not shown in chart) are Bullish with a score of 54.0 percent.

Price Trend-Following Model: Uptrend

Our weekly trend-following model classifies the current market price position as: Uptrend.

Silver Futures StatisticsSPECULATORSCOMMERCIALSSMALL TRADERS
– Percent of Open Interest Longs:27.927.921.7
– Percent of Open Interest Shorts:9.660.17.7
– Net Position:24,003-42,34718,344
– Gross Longs:36,62636,72928,514
– Gross Shorts:12,62379,07610,170
– Long to Short Ratio:2.9 to 10.5 to 12.8 to 1
NET POSITION TREND:
– Strength Index Score (3 Year Range Pct):42.454.354.0
– Strength Index Reading (3 Year Range):BearishBullishBullish
NET POSITION MOVEMENT INDEX:
– 6-Week Change in Strength Index:-7.011.6-22.4


Copper Grade #1 Futures:

Copper Futures COT ChartThe Copper Grade #1 Futures large speculator standing this week totaled a net position of 59,331 contracts in the data reported through Tuesday. This was a weekly gain of 13,458 contracts from the previous week which had a total of 45,873 net contracts.

This week’s current strength score (the trader positioning range over the past three years, measured from 0 to 100) shows the speculators are currently Bullish-Extreme with a score of 88.5 percent. The commercials are Bearish-Extreme with a score of 6.8 percent and the small traders (not shown in chart) are Bullish-Extreme with a score of 89.4 percent.

Price Trend-Following Model: Uptrend

Our weekly trend-following model classifies the current market price position as: Uptrend.

Copper Futures StatisticsSPECULATORSCOMMERCIALSSMALL TRADERS
– Percent of Open Interest Longs:32.933.58.9
– Percent of Open Interest Shorts:11.160.63.6
– Net Position:59,331-73,88614,555
– Gross Longs:89,69991,57324,327
– Gross Shorts:30,368165,4599,772
– Long to Short Ratio:3.0 to 10.6 to 12.5 to 1
NET POSITION TREND:
– Strength Index Score (3 Year Range Pct):88.56.889.4
– Strength Index Reading (3 Year Range):Bullish-ExtremeBearish-ExtremeBullish-Extreme
NET POSITION MOVEMENT INDEX:
– 6-Week Change in Strength Index:1.4-1.62.1


Platinum Futures:

Platinum Futures COT ChartThe Platinum Futures large speculator standing this week totaled a net position of 12,347 contracts in the data reported through Tuesday. This was a weekly rise of 263 contracts from the previous week which had a total of 12,084 net contracts.

This week’s current strength score (the trader positioning range over the past three years, measured from 0 to 100) shows the speculators are currently Bearish with a score of 41.9 percent. The commercials are Bullish with a score of 58.6 percent and the small traders (not shown in chart) are Bullish with a score of 69.9 percent.

Price Trend-Following Model: Uptrend

Our weekly trend-following model classifies the current market price position as: Uptrend.

Platinum Futures StatisticsSPECULATORSCOMMERCIALSSMALL TRADERS
– Percent of Open Interest Longs:41.628.713.2
– Percent of Open Interest Shorts:23.855.54.3
– Net Position:12,347-18,5366,189
– Gross Longs:28,82619,9139,175
– Gross Shorts:16,47938,4492,986
– Long to Short Ratio:1.7 to 10.5 to 13.1 to 1
NET POSITION TREND:
– Strength Index Score (3 Year Range Pct):41.958.669.9
– Strength Index Reading (3 Year Range):BearishBullishBullish
NET POSITION MOVEMENT INDEX:
– 6-Week Change in Strength Index:-14.413.84.4


Palladium Futures:

Palladium Futures COT ChartThe Palladium Futures large speculator standing this week totaled a net position of 492 contracts in the data reported through Tuesday. This was a weekly reduction of -21 contracts from the previous week which had a total of 513 net contracts.

This week’s current strength score (the trader positioning range over the past three years, measured from 0 to 100) shows the speculators are currently Bullish-Extreme with a score of 95.2 percent. The commercials are Bearish-Extreme with a score of 7.7 percent and the small traders (not shown in chart) are Bullish with a score of 59.6 percent.

Price Trend-Following Model: Uptrend

Our weekly trend-following model classifies the current market price position as: Uptrend.

Palladium Futures StatisticsSPECULATORSCOMMERCIALSSMALL TRADERS
– Percent of Open Interest Longs:45.136.114.6
– Percent of Open Interest Shorts:42.245.97.8
– Net Position:492-1,6341,142
– Gross Longs:7,5776,0662,447
– Gross Shorts:7,0857,7001,305
– Long to Short Ratio:1.1 to 10.8 to 11.9 to 1
NET POSITION TREND:
– Strength Index Score (3 Year Range Pct):95.27.759.6
– Strength Index Reading (3 Year Range):Bullish-ExtremeBearish-ExtremeBullish
NET POSITION MOVEMENT INDEX:
– 6-Week Change in Strength Index:-0.64.3-21.3


Steel Futures Futures:

Steel Futures COT ChartThe Steel Futures large speculator standing this week totaled a net position of 11,736 contracts in the data reported through Tuesday. This was a weekly boost of 344 contracts from the previous week which had a total of 11,392 net contracts.

This week’s current strength score (the trader positioning range over the past three years, measured from 0 to 100) shows the speculators are currently Bullish-Extreme with a score of 96.9 percent. The commercials are Bearish-Extreme with a score of 3.4 percent and the small traders (not shown in chart) are Bullish-Extreme with a score of 80.0 percent.

Price Trend-Following Model: Uptrend

Our weekly trend-following model classifies the current market price position as: Uptrend.

Steel Futures StatisticsSPECULATORSCOMMERCIALSSMALL TRADERS
– Percent of Open Interest Longs:39.556.81.5
– Percent of Open Interest Shorts:7.290.00.5
– Net Position:11,736-12,085349
– Gross Longs:14,36220,654537
– Gross Shorts:2,62632,739188
– Long to Short Ratio:5.5 to 10.6 to 12.9 to 1
NET POSITION TREND:
– Strength Index Score (3 Year Range Pct):96.93.480.0
– Strength Index Reading (3 Year Range):Bullish-ExtremeBearish-ExtremeBullish-Extreme
NET POSITION MOVEMENT INDEX:
– 6-Week Change in Strength Index:11.8-11.51.4


Article By InvestMacroReceive our weekly COT Newsletter

*COT Report: The COT data, released weekly to the public each Friday, is updated through the most recent Tuesday (data is 3 days old) and shows a quick view of how large speculators or non-commercials (for-profit traders) were positioned in the futures markets.

The CFTC categorizes trader positions according to commercial hedgers (traders who use futures contracts for hedging as part of the business), non-commercials (large traders who speculate to realize trading profits) and nonreportable traders (usually small traders/speculators) as well as their open interest (contracts open in the market at time of reporting). See CFTC criteria here.

Gold and Silver Move in Different Directions

Source: Adrian Day (2/17/26)

Global Analyst Adrian Day looks at the action of gold and silver the week of February 7, 2026, and shares his view on how to invest. He also looks at developments from several companies on his list.

The action in gold and silver over the past week since the large drops is mixed. Since the Monday low for gold just above $4,000 (1:38 a.m. Eastern), the action has been encouraging, with gold gaining over $900, if not steadily. Silver, however, fell further.

It staged an impressive rally at the beginning of the week moving over $90, before dropping again, hitting its low of just over $64 an ounce on Friday morning in Asia, before recovering to close a tad below $78. That is 36% down from the high a week-ago Thursday, while gold is down just 11% from its peak.

We expect these trends to continue, with gold moving two steps forward, one back for the next few weeks before hitting new highs within a couple of months. I expect we have see the lows. Silver, however, I expect to be more volatile, and may retest its lows, but I expect it to be longer before we see new highs.

Should You Invest Now in the Precious Metals Equities?

We are buying the gold stocks, perhaps with a narrower focus, and opportunistically. Given the volatility, we are looking to buy the bests companies on the down days. Thursday was a good day to buy, but we were scarcely buying anything Friday. As for silver, the declines in the equities have been fairly muted given the large decline in the metal.

In fairness, though, many of the silver names had not moved higher in line with the silver price in December and January. However, a longer recovery with perhaps new lows for silver might see the stocks decline further. Thus, we have few “top buys” among the gold stocks below, but if you are an active trader, you should be alert to any pullbacks during the week.

Barrick Plans Reorganization With New CEO

Barrick Mining Corp. (ABX:TSX; B:NYSE) released year-end results and forward guidance, overshadowed by a flood of important announcements on the company’s strategy and future. Disturbingly, many details were omitted, even when questioned by analysts.

  • The company plans to proceed with an IPO of its North American assets, including the Nevada Gold Mines (NGM), saying it intended to IPO a minority of around 10-15% of its interest with a target completion in the fourth quarter of this year. However, details were light, and during its analyst call, it would not respond to several questions on the specifics.
  • It completed an operational review, with safety top priority. Business units have been restructured, with Pueblo Viejo going into the North American region, now overseen by Tim Crib, moved from Reko Diq; he is the group COO. The review appears to have been focused on Nevada which had had some operational issues in recent years, and difficulty attracting and retaining people. A Chief Technical Officer has been named at the group level.
  • Barrick said its board is concerned about security in Balochistan, the province hosting the Reko Diq copper project. A review of the project is underway, though the company says “all options are being considered.”
  • It named Mark Hill as permanent CEO after “an extensive search”. He stepped in as interim CEO when Mark Bristow abruptly left the company in September. Hill joined Barrick in 2019 after the merge with Randgold and was not seen as a Bristow loyalist.
  • Barrick also introduced a new dividend policy, increasing its base dividend, and changing its bonus dividend program to a target of 50% of free cash flow. This equates to an estimated yield of 3.7%, one of the largest in the industry. This replaces the policy based on free cash on the balance sheet that had been in place only a couple of years, and adds more discretion to the dividend.
  • The new dividend policy will replace buybacks going forward; the share buyback authorization has not been renewed for 2026. Last year, Barrick repurchased $1.5 billion of shares, representing about 3% of the shares outstanding. It was only a few years ago that Barrick started a buyback program, after stubbornly rejecting it for years under Bristow.

Pakistan Project’s Future Appears Uncertain

Barrick seems to be moving towards a smaller North American-focused company, with growing indications it will (or at least wants to) scale back its investments in Pakistan. One sign was its statement that it had paused proceeding with a loan for the project until its review had been concluded.

“It is too early to say” if a divestiture is on the table. As discussed before, the Saudi Arabian sovereign wealth fund wants into the project and was earlier rebuffed by Barrick who told the Saudis they should buy some of the Pakistan government’s stake. So there might be a ready buyer for part of Barrick’s interest.

North American IPO Only a Minority Interest, With Details Unclear

The North American assets proposed for the new company IPO represent just under 60% of Barrick’s NAV. The small spin off ensues that Barrick retains a controlling interest in NGMs and the other joint-venture mines. Separating the higher-quality North American assets will help to release some value but, if it spins off less than 15% of its interest–so less than 10% of the total mines–I question whether the new company would trade at the premium multiple the company is expecting. Conglomerate discounts are common, due to the complexity of organizations, and a partial spin off of assets partially owned, add to complexity.

Several question remain hanging over the transaction, most notably the ROFR held by Newmont Corp. (NEM:NYSE; NGT:TSX; NEM:ASX). Barrick, in answers to questions, said “we are well aware of our legal contracts,” which does not really answer the question. The last thing the company needs is a legal dispute with Newmont over rights.

Given that Newmont apparently has a ROFR on NGM, is a partner in the Pueblo Viejo mine, and has rights to invest in Fourmile, Newmont must be looking seriously at whether to make a bid for these assets. On the analyst call, Barrick would not say whether it had held talks with Newmont over its rights. In addition, Barrick has yet to address the use of proceeds; and the domicile of the new company, important for index inclusion.

A Large Dividend Boost, Despite Capital Needs

The new dividend policy represents an annual distribution of $2.8 billion or more. Given the company’s large capital requirements, one might question the wisdom of such a large dividend.

This might also be another signal on intentions regarding Reko Dik. Although one metric may be better than another, the large gold companies (Barrick and Newmont) have a history of introducing dividend policies only to abandon or change them, which defeats the point of having a policy in the first place. Barrick’s previous policy had only been in place a couple of years.

Results Were Strong, Though Guidance Soft

The announcements on the IPO, Pakistan, the new CEO, and the dividend, overshadowed the fourth-quarter results which were in line with expectations, though guidance was distinctly weak. The fourth-quarter saw strong financial results, with the highest production of the year (as indicated by Bristow last January that it would), and unsurprisingly, given the gold and copper prices, record cash flow and adjusted earnings per share.

Gold production was up 5% over the third-quarter, driven by large increases at the Nevada mines, while copper output was 13% higher than Q3, primarily driven by Lumwana in Zambia. However, costs in the fourth quarter were higher than anticipated. Annual shareholder returns in 2025, from share buybacks and the dividend, were the highest ever.

On specific mines, Barrick said it had restarted all three underground mines at Loulo-Gounkoto in Mali and said the relationship with the government is being reset. It paid the government over quarter-of-a-billion dollars to settle the dispute as well as committing to pay the government all retained earnings. In addition, it appears to have conceded the government’s demand to increase its ownership to 20%. Barrick said the mine complex was expected to produce this year only half its 2024 output as it ramps back up.

It also said that recoveries at the Pueblo Viejo mine in Dominican Republic remain a challenge, and it set a new lower target recovery rate. Currently recoveries are around 75% and the new target is 84%. Hill said that, despite lower recovery rates, the mine life would be extended to 2048 maintaining the same total output produced.

Guidance Calls for Lower Production and Higher Costs

Guidance for 2026 was soft, with no guidance beyond. The company said it expected the seventh consecutive year of lower gold production, 10% higher costs (14% above consensus estimates), and significantly higher capex than expected (again, questioning the dividend increase). The production drop comes despite the restart of Loulo-Gounkoto. Once again, the second-half is expected to be stronger with about 55% of the annual production. It would appear, however, that the company has deliberately set cautious guidance, which it aims to achieve, rather than the admittedly optimistic guidance provided by Bristow, which often seemed more like goals.

Longer term, the company indicated that the cost outlook beyond 2026 should remain flat, rather than the cost reductions earlier indicated. This was in response to a question. Interesting, and rather disturbingly, many of the more significant details (long-term cost outlook, size of NGM IPO and more) were only revealed in answers to questions rather than stated upfront by the company.

Barrick’s proven and probable reserves totaled 85 million ounces at year-end, calculated at $1,500, with 150 million ounces of measured and indicated resources, calculated at $2,000. These numbers are lower than 2024 due to the sale of two mines. Copper resources, calculated at $3.25/lb, remained stabled at 18 million ounces. For reference, spot prices at $4,964 and $5.88, so the assumed prices seem very low.

We are holding, awaiting progress on the North American IPO.

Transition at Wheaton as CEO Moves Up

Wheaton Precious Metals Corp. (WPM:TSX; WPM:NYSE) said founder and CEO Randy Smallwood would step down and become non-executive Chairman of the Board, to be replaced at CEO by current President, Haytham Hodaly. Helping to found the company in 2004, Smallwood has led the company for 15 years.

A mining engineer by training and former analyst at RBC, Hodaly joined Wheaton in 2012 and has recently been in charge of executing streaming transactions.

Hold.

Tether Strengthens Its Grip on Metalla

Metalla Royalty & Streaming Ltd. (MTA:TSX.V; MTA:NYSE American) saw Tether report additional share purchases, taking its stake to 8.9%. It last reported a month ago, with 7.8%. It appears to be buying in the market, consistently, rather than actively taking advantage of price dips. It is now the second largest holder, behind Beedie Investments (10.3%) which had provided debt facilities to the company before converting entirely to equity, and ahead of Euro Pacific at 6.2%.

(Disclosure: I manage Euro Pacific gold fund and gold accounts.)

Metalla is a buy independent of Tether’s growing interest.

Ares Maintains Dividend and Credit Standing

Ares Capital Corp. (ARCC:NASDAQ) reports a solid quarter, with 50 cents per share of core earnings, once again in excess of the dividend, which remains stable at 48 cents per quarter. Credit, both non-accruals and the investment grade, remained stable, while the Net Asset Value increased slightly over the year-ago quarter (though modestly down quarter-on-quarter). It is the highest rated BDC by all three ratings agencies.

New activity remains strong, with the majority for loans during the year to existing portfolio companies, for growth, while the second half saw a pick up of new borrowers, adding over 100 new companies. Exits averaged an IRR of 25%. The company remains in a great position to invest in undervalued areas with high cash balance and low leverage.

In keeping the dividend flat, the company said it was in a good position to maintain the dividend, despite lower rates in the economy. It has low leverage (1.08x), its portfolio companies have strong debt coverage, while its carry forward income equivalent to $1.38 per share, represents nearly three quarters of dividends, providing a cushion for any temporary income shortfalls. It estimates that the decline in rates, and therefore a decline in earnings, will represent about 1 cent per share in the current quarter.

How Exposed to Software Weakness in Ares?

On the analyst call, there was much discussion on the risks posed by the software industry. It was positive to see the company tackle the subject head on, and not wait for questions to respond. CEO Kort Schnabel said the company recognized the risks of new technology and obsolescence. But he added that Ares’s portfolio will remain “highly resistant”, since it invests in foundational technology, as well as software for regulated industries, which are much slower to change software.

Trading just below NAV with a yield of 9.95%, Ares is a buy for long-term income investors. Disruption in the sector, however, including possible dividend cuts or credit troubles, even at other companies, will raise concerns about even the strongest companies in the sector, so we may see increased volatility going forward.

Hutchison’s Revenue and Profits Increase as It Struggles With Global Trade

Hutchison Port Holdings Trust (HPHT:Singapore)  reported revenue up 2.6% for the year, with profit up over 15%. Despite this, the final distribution was cut again, to 6½ cents (HKD) down from 8 cents two years ago, representing a forward dividend of 6.7%. Revenue rose thanks to higher throughput at the Yantian terminals in Shenzhen. The company noted that though exports from Yantian remained strong, more ships were returning empty. Throughput at the Hong Kong terminals, which were the historic base of the company, fell again, by over 6%. The high profits increase was largely due to the revaluation of the company’s yuan-denominated financial assets, offset partly by higher capex.

The company said the outlook was uncertain, facing “a complex landscape marred by the constant shifting in trade and tariff policies.” The new “China plus one” strategy of diversifying dependence on China for materials, is unlikely to change back to sole reliance on China, even if the trade dispute smooths over, in my view. So this is a fundamental shift for Hutchison. At the same time, growth across Europe is expected to be subdued amid geopolitical tensions.

Hold, particularly as part of a diversified income portfolio.

TOP BUYS this week, in addition to above, include Kingsmen Creatives Ltd. (KMEN:SI), Lara Exploration Ltd. (LRA:TSX.V), and Orogen Royalties Inc. (OGN:TSXV; OGNNF:OTC).


Important Disclosures:

  1. As of the date of this article, officers and/or employees of Streetwise Reports LLC (including members of their household) own securities of Barrick Mining Corp., Wheaton Precious Metals Corp., Metalla Royalty & Streaming Ltd., Lara Exploration Ltd., and Orogen Royalties Inc.
  2. Adrian Day: I, or members of my immediate household or family, own securities of: All. My company has a financial relationship with: None. My company has purchased stocks mentioned in this article for my management clients: All. I determined which companies would be included in this article based on my research and understanding of the sector.
  3. Statements and opinions expressed are the opinions of the author and not of Streetwise Reports, Street Smart, or their officers. The author is wholly responsible for the accuracy of the statements. Streetwise Reports was not paid by the author to publish or syndicate this article. Streetwise Reports requires contributing authors to disclose any shareholdings in, or economic relationships with, companies that they write about. Any disclosures from the author can be found  below. Streetwise Reports relies upon the authors to accurately provide this information and Streetwise Reports has no means of verifying its accuracy.
  4.  This article does not constitute investment advice and is not a solicitation for any investment. Streetwise Reports does not render general or specific investment advice and the information on Streetwise Reports should not be considered a recommendation to buy or sell any security. Each reader is encouraged to consult with his or her personal financial adviser and perform their own comprehensive investment research. By opening this page, each reader accepts and agrees to Streetwise Reports’ terms of use and full legal disclaimer. Streetwise Reports does not endorse or recommend the business, products, services or securities of any company.

For additional disclosures, please click here.

Adrian Day Disclosures

Adrian Day’s Global Analyst is distributed for $990 per year by Investment Consultants International, Ltd., P.O. Box 6644, Annapolis, MD 21401. (410) 224-8885. www.AdrianDayGlobalAnalyst.com. Publisher: Adrian Day. Owner: Investment Consultants International, Ltd. Staff may have positions in securities discussed herein. Adrian Day is also President of Global Strategic Management (GSM), a registered investment advisor, and a separate company from this service. In his capacity as GSM president, Adrian Day may be buying or selling for clients securities recommended herein concurrently, before or after recommendations herein, and may be acting for clients in a manner contrary to recommendations herein. This is not a solicitation for GSM. Views herein are the editor’s opinion and not fact. All information is believed to be correct, but its accuracy cannot be guaranteed. The owner and editor are not responsible for errors and omissions. © 2023. Adrian Day’s Global Analyst. Information and advice herein are intended purely for the subscriber’s own account. Under no circumstances may any part of a Global Analyst e-mail be copied or distributed without prior written permission of the editor. Given the nature of this service, we will pursue any violations aggressively.

Gold Climbs to a Two-Week High: Markets Await a Softer Fed Policy

By RoboForex Analytical Department

Gold on Wednesday held above 5045 USD per ounce and traded near a two-week high. The quotes are supported by expectations of a softer Fed policy.

Growth intensified after weak US economic data. Retail sales came in below forecasts in December, pointing to a slowdown in consumer activity and fuelling fears of a cooling economy.

The market is now pricing in a higher probability of three Fed rate cuts this year than two weeks ago.

Investors are now awaiting the publication of US data on employment and inflation, which may provide additional signals about the state of the economy and the regulator’s next steps.

Demand from central banks remains robust. The People’s Bank of China increased gold reserves in January

Technical Analysis

The H4 XAU/USD chart shows that after a sharp collapse in early February from the 5550–5600 area to lows around 4400, gold has entered a recovery phase. The price has stabilised around 5000–5050 and is trading near the middle line of the Bollinger Bands. The bands are gradually narrowing, indicating declining volatility and the formation of consolidation following strong price swings.

On the H1 chart, the structure is more neutral. Quotes are moving within a narrow 5000–5080 range. The upper boundary acts as local resistance, while the lower acts as support. The market looks balanced, with attempts at a steady advance, but no pronounced momentum.

Conclusion

In summary, gold’s rally to a two-week high primarily reflects shifting market expectations towards a more dovish Fed, amplified by recent soft US retail data. While technical indicators show stabilisation and consolidation within a recovery phase, price action remains range-bound and lacks decisive momentum. The near-term trajectory will be critically dependent on incoming US inflation and employment data, which will either validate the current dovish repricing or challenge it. Sustained central bank buying and unresolved geopolitical tensions provide a structural floor, but for a breakout above the current consolidation, gold requires a clear catalyst from upcoming macroeconomic releases.


Disclaimer

Any forecasts contained herein are based on the author’s particular opinion. This analysis may not be treated as trading advice. RoboForex bears no responsibility for trading results based on trading recommendations and reviews contained herein.

Why Trump’s new pick for Fed chair hit gold and silver markets – for good reasons

By Henry Maher, University of Sydney 

After months of speculation, US President Donald Trump confirmed he will be nominating Kevin Warsh as the next chair of the US Federal Reserve. The appointment has been closely watched in the context of Trump’s ongoing conflict with the Fed and its current chairman Jerome Powell.

The immediate reaction to the announcement was a significant crash in gold and silver markets. After months of record highs and stretched valuations, spot prices for gold and silver dropped 9% and 28% respectively after the announcement. The US stock market also fell, with major indexes all reporting modest losses.

However, in the context of concerns over Trump’s interference with the Fed, the market crash can ironically be understood as an early vote of confidence in Warsh’s independence and suitability for the role.

Understanding why requires the context of Trump’s ongoing conflict with the Federal Reserve, and the importance of central bank independence to our current global financial system.

Trump’s war with the Fed

The last year has seen Trump in an unprecedented conflict with the Federal Reserve.

Trump appointed current Chairman Jerome Powell back in 2017. However, the relationship quickly soured when Powell did not cut interest rates as quickly as Trump wanted. In characteristically colourful language, Trump has since called Powell a “clown” with “some real mental problems”, adding “I’d love to fire his ass”.

The war of words descended into legal threats. Trump’s Justice Department announced an investigation into Federal Reserve Governor Lisa Cook over alleged fraud in historical mortgage documents. Then last month, in a shocking escalation the Justice Department opened a criminal investigation into Powell relating to overspending in renovations of the Federal Reserve offices.

Both sets of allegations are widely viewed as baseless. However, Trump has tried to use the investigation as grounds to fire Cook. The case is currently before the Supreme Court.

Powell has hit back strongly at Trump, saying the legal threats were

a consequence of the Federal Reserve setting interest rates based on our best assessment of what will serve the public, rather than following the preferences of the President.

Powell received support from 14 international central bank chiefs, who noted “the independence of central banks is a cornerstone of price, financial and economic stability”.

Historically, presidential interference with the Fed was a major cause of the stagflation crisis in the 1970s. More recently, both Argentina and Turkey have experienced significant financial crises caused by interference with central bank independence.

Who is Kevin Warsh?

Kevin Warsh is a former banker and Federal Reserve governor, who previously served as economic advisor to both President George W Bush and President Trump.

Originally Trump seemed likely to favour the current director of Trump’s National Economic Council, Kevin Hassett, for the job. However, Hassett was widely viewed as being too influenced by Trump, intensifying fears about Fed independence.

Warsh appears more independent and brings a reputation as an inflation “hawk”.

What is an inflation hawk?

The Federal Reserve is responsible for setting US interest rates. Put simply, lower interest rates can increase economic growth and employment, but risk creating inflation. Higher interest rates can control inflation, but at the cost of higher unemployment and lower growth.

Getting the balance right is the central role of the Federal Reserve. Central bank independence is essential to ensure this delicate task is guided by the best evidence and long-term needs of the economy, rather than the short-term political goals.

An inflation “hawk” refers to a central banker who prioritises fighting inflation, compared to a “dove” who prioritises growth and jobs.

From Warsh’s previous time at the Federal Reserve, he established a strong reputation as an inflation hawk. Even in the aftermath of the global financial crisis of 2008, Warsh was more worried about inflation than jobs.

Given Trump’s past conflict with Powell around cutting interest rates, Warsh might seem a curious choice of candidate.

More recently though, Warsh has moderated his views, echoing Trump’s criticism of the Fed and demands for lower interest rates. Whether this support will continue, or if his hawkish tendencies return leading to future conflict with Trump, remains to be seen.

The market reaction

The crash in gold and silver, and decline in stock markets, suggests investors view interest rate cuts as less likely under Warsh than alternative candidates.

Gold and silver prices typically rise in response to instability or fears of inflation.

The previous record highs were driven by many factors, including global instability, concerns over Fed independence, and a speculative bubble.

That Warsh’s appointment has triggered a market correction in precious metals means investors expect lower inflation, and greater financial stability. The US dollar trading higher also supports this view.

The credibility of the Fed is at stake

The past month has seen much discussion of the changing world order. Canadian Prime Minister Mark Carney recently decried the end of the international rules-based order and called for a break from “American hegemony”.

The global dominance of the US dollar is a crucial plank of US economic hegemony. Though Trump clearly remains sceptical of central bank independence, his appointment of Warsh suggests he recognises the importance of retaining the credibility of the US currency and Federal Reserve.

Whether that recognition can continue to temper Trump’s instinct to interfere with the setting of interest rates remains to be seen.The Conversation

About the Author:

Henry Maher, Lecturer in Politics, Department of Government and International Relations, University of Sydney

This article is republished from The Conversation under a Creative Commons license. Read the original article.


COT Metals Charts: Speculators drop Gold Bets for 5th time in 6 Weeks

By InvestMacro

Metals Open Interest COT Chart
Here are the latest charts and statistics for the Commitment of Traders (COT) data published by the Commodities Futures Trading Commission (CFTC).

The latest COT data is updated through Tuesday February 3rd and shows a quick view of how large traders (for-profit speculators and commercial entities) were positioned in the futures markets.

Weekly Speculator Changes led lower by Gold

Metals Net Positions COT Chart
The COT metals markets speculator bets were overall lower this week as two out of the six metals markets we cover had higher positioning while the other four markets had lower speculator contracts.

Leading the gains for the metals was Silver (2,174 contracts) with Palladium (449 contracts) also having a small positive week.

The markets with declines in speculator bets for the week were Gold (-39,792 contracts), Steel (-853 contracts), Platinum (-816 contracts) and with Copper (-576 contracts) also registering lower bets on the week.

Speculator drop Gold Bets for 5th time in 6 Weeks to 37-Week Low

Highlighting the metals data this week was sharp reduction in the Gold speculator positions. The large speculative traders sharply reduced their bullish bets again this week, which is a decline for the third consecutive week and for the fifth time out of the past six weeks. The reduction in the bullish position now totals -85,634 contracts over just the past three weeks brings the overall Gold speculator bullish position down to a total of 165,604 contracts. This marks the lowest level for the Gold position since last May, which is a span of 37 weeks.

The Gold futures price has settled in to end the week at approximately $4,980 and rebounded this week after a hugely volatile past couple weeks. The Gold price shot all the way to $5,625 on January 29th before turning around and then falling all the way back down to a low at approximately $4,430 before rebounding. Gold is still in a parabolic uptrend overall and from the beginning of 2024 to now, the price has jumped by over 144% and has continually hit new all-time highs.

Gold leads Metals Price Performance this week

Precious metals markets were mixed on the week in their price performance. Gold was the highest mover over the past five days with a 2.3% increase. Palladium was next this week with a 1.78% rise while Steel also advanced by 0.51%.

Copper dropped by -0.52% on the week while Palladium was lower by -2.99% and Silver came out the biggest loser on the week with a -6.9% loss.


Metals Data:

Metals Table COT Chart
Legend: Weekly Speculators Change | Speculators Current Net Position | Speculators Strength Score compared to last 3-Years (0-100 range)


Strength Scores led by Palladium & Steel

Metals Strength Scores COT Chart
COT Strength Scores (a normalized measure of Speculator positions over a 3-Year range, from 0 to 100 where above 80 is Extreme-Bullish and below 20 is Extreme-Bearish) showed that Palladium (99 percent) and Steel (96 percent) lead the metals markets this week. Copper (78 percent) comes in as the next highest in the weekly strength scores.

On the downside, Gold (39 percent), Platinum (44 percent) and Silver (45 percent) come in at the lowest strength level currently.

Strength Statistics:
Gold (38.6 percent) vs Gold previous week (54.9 percent)
Silver (44.9 percent) vs Silver previous week (42.0 percent)
Copper (77.8 percent) vs Copper previous week (78.3 percent)
Platinum (43.8 percent) vs Platinum previous week (45.8 percent)
Palladium (99.4 percent) vs Palladium previous week (96.4 percent)
Steel (95.6 percent) vs Steel previous week (100.0 percent)


Steel & Palladium top the 6-Week Strength Trends

Metals Trends COT Chart
COT Strength Score Trends (or move index, calculates the 6-week changes in strength scores) showed that Steel (8 percent) and Palladium (7 percent) lead the past six weeks trends for metals.

Gold (-31 percent) leads the downside trend scores currently with Copper (-18 percent) and Platinum (-16 percent) as the next market with lower trend scores.

Move Statistics:
Gold (-30.8 percent) vs Gold previous week (-11.7 percent)
Silver (-13.4 percent) vs Silver previous week (-16.9 percent)
Copper (-17.9 percent) vs Copper previous week (-15.3 percent)
Platinum (-15.6 percent) vs Platinum previous week (-23.5 percent)
Palladium (6.7 percent) vs Palladium previous week (-1.9 percent)
Steel (8.0 percent) vs Steel previous week (17.8 percent)


Individual Markets:

Gold Comex Futures:

Gold Futures COT ChartThe Gold Comex Futures large speculator standing this week resulted in a net position of 165,604 contracts in the data reported through Tuesday. This was a weekly decline of -39,792 contracts from the previous week which had a total of 205,396 net contracts.

This week’s current strength score (the trader positioning range over the past three years, measured from 0 to 100) shows the speculators are currently Bearish with a score of 38.6 percent. The commercials are Bullish with a score of 52.9 percent and the small traders (not shown in chart) are Bullish-Extreme with a score of 89.2 percent.

Price Trend-Following Model: Strong Uptrend

Our weekly trend-following model classifies the current market price position as: Strong Uptrend.

Gold Futures StatisticsSPECULATORSCOMMERCIALSSMALL TRADERS
– Percent of Open Interest Longs:52.421.513.8
– Percent of Open Interest Shorts:11.972.23.5
– Net Position:165,604-207,77842,174
– Gross Longs:214,50887,96456,610
– Gross Shorts:48,904295,74214,436
– Long to Short Ratio:4.4 to 10.3 to 13.9 to 1
NET POSITION TREND:
– Strength Index Score (3 Year Range Pct):38.652.989.2
– Strength Index Reading (3 Year Range):BearishBullishBullish-Extreme
NET POSITION MOVEMENT INDEX:
– 6-Week Change in Strength Index:-30.830.4-1.9


Silver Comex Futures:

Silver Futures COT ChartThe Silver Comex Futures large speculator standing this week resulted in a net position of 25,877 contracts in the data reported through Tuesday. This was a weekly boost of 2,174 contracts from the previous week which had a total of 23,703 net contracts.

This week’s current strength score (the trader positioning range over the past three years, measured from 0 to 100) shows the speculators are currently Bearish with a score of 44.9 percent. The commercials are Bullish with a score of 50.1 percent and the small traders (not shown in chart) are Bullish with a score of 62.3 percent.

Price Trend-Following Model: Uptrend

Our weekly trend-following model classifies the current market price position as: Uptrend.

Silver Futures StatisticsSPECULATORSCOMMERCIALSSMALL TRADERS
– Percent of Open Interest Longs:27.224.622.7
– Percent of Open Interest Shorts:9.156.68.8
– Net Position:25,877-45,72519,848
– Gross Longs:38,88335,24832,469
– Gross Shorts:13,00680,97312,621
– Long to Short Ratio:3.0 to 10.4 to 12.6 to 1
NET POSITION TREND:
– Strength Index Score (3 Year Range Pct):44.950.162.3
– Strength Index Reading (3 Year Range):BearishBullishBullish
NET POSITION MOVEMENT INDEX:
– 6-Week Change in Strength Index:-13.410.68.1


Copper Grade #1 Futures:

Copper Futures COT ChartThe Copper Grade #1 Futures large speculator standing this week resulted in a net position of 47,814 contracts in the data reported through Tuesday. This was a weekly reduction of -576 contracts from the previous week which had a total of 48,390 net contracts.

This week’s current strength score (the trader positioning range over the past three years, measured from 0 to 100) shows the speculators are currently Bullish with a score of 77.8 percent. The commercials are Bearish-Extreme with a score of 16.5 percent and the small traders (not shown in chart) are Bullish-Extreme with a score of 90.4 percent.

Price Trend-Following Model: Uptrend

Our weekly trend-following model classifies the current market price position as: Uptrend.

Copper Futures StatisticsSPECULATORSCOMMERCIALSSMALL TRADERS
– Percent of Open Interest Longs:34.931.38.4
– Percent of Open Interest Shorts:17.853.73.1
– Net Position:47,814-62,55114,737
– Gross Longs:97,40787,24023,314
– Gross Shorts:49,593149,7918,577
– Long to Short Ratio:2.0 to 10.6 to 12.7 to 1
NET POSITION TREND:
– Strength Index Score (3 Year Range Pct):77.816.590.4
– Strength Index Reading (3 Year Range):BullishBearish-ExtremeBullish-Extreme
NET POSITION MOVEMENT INDEX:
– 6-Week Change in Strength Index:-17.915.47.1


Platinum Futures:

Platinum Futures COT ChartThe Platinum Futures large speculator standing this week resulted in a net position of 13,106 contracts in the data reported through Tuesday. This was a weekly lowering of -816 contracts from the previous week which had a total of 13,922 net contracts.

This week’s current strength score (the trader positioning range over the past three years, measured from 0 to 100) shows the speculators are currently Bearish with a score of 43.8 percent. The commercials are Bullish with a score of 54.4 percent and the small traders (not shown in chart) are Bullish-Extreme with a score of 80.4 percent.

Price Trend-Following Model: Uptrend

Our weekly trend-following model classifies the current market price position as: Uptrend.

Platinum Futures StatisticsSPECULATORSCOMMERCIALSSMALL TRADERS
– Percent of Open Interest Longs:42.826.813.4
– Percent of Open Interest Shorts:25.054.33.7
– Net Position:13,106-20,2077,101
– Gross Longs:31,46819,7429,851
– Gross Shorts:18,36239,9492,750
– Long to Short Ratio:1.7 to 10.5 to 13.6 to 1
NET POSITION TREND:
– Strength Index Score (3 Year Range Pct):43.854.480.4
– Strength Index Reading (3 Year Range):BearishBullishBullish-Extreme
NET POSITION MOVEMENT INDEX:
– 6-Week Change in Strength Index:-15.613.312.0


Palladium Futures:

Palladium Futures COT ChartThe Palladium Futures large speculator standing this week resulted in a net position of 1,133 contracts in the data reported through Tuesday. This was a weekly advance of 449 contracts from the previous week which had a total of 684 net contracts.

This week’s current strength score (the trader positioning range over the past three years, measured from 0 to 100) shows the speculators are currently Bullish-Extreme with a score of 99.4 percent. The commercials are Bearish-Extreme with a score of 3.6 percent and the small traders (not shown in chart) are Bullish with a score of 60.7 percent.

Price Trend-Following Model: Uptrend

Our weekly trend-following model classifies the current market price position as: Uptrend.

Palladium Futures StatisticsSPECULATORSCOMMERCIALSSMALL TRADERS
– Percent of Open Interest Longs:49.231.514.8
– Percent of Open Interest Shorts:42.744.88.0
– Net Position:1,133-2,3071,174
– Gross Longs:8,5185,4532,557
– Gross Shorts:7,3857,7601,383
– Long to Short Ratio:1.2 to 10.7 to 11.8 to 1
NET POSITION TREND:
– Strength Index Score (3 Year Range Pct):99.43.660.7
– Strength Index Reading (3 Year Range):Bullish-ExtremeBearish-ExtremeBullish
NET POSITION MOVEMENT INDEX:
– 6-Week Change in Strength Index:6.7-4.1-11.5


Steel Futures Futures:

Steel Futures COT ChartThe Steel Futures large speculator standing this week resulted in a net position of 11,487 contracts in the data reported through Tuesday. This was a weekly decline of -853 contracts from the previous week which had a total of 12,340 net contracts.

This week’s current strength score (the trader positioning range over the past three years, measured from 0 to 100) shows the speculators are currently Bullish-Extreme with a score of 95.6 percent. The commercials are Bearish-Extreme with a score of 4.0 percent and the small traders (not shown in chart) are Bullish-Extreme with a score of 97.9 percent.

Price Trend-Following Model: Uptrend

Our weekly trend-following model classifies the current market price position as: Uptrend.

Steel Futures StatisticsSPECULATORSCOMMERCIALSSMALL TRADERS
– Percent of Open Interest Longs:40.954.92.0
– Percent of Open Interest Shorts:7.090.30.5
– Net Position:11,487-11,980493
– Gross Longs:13,84918,584679
– Gross Shorts:2,36230,564186
– Long to Short Ratio:5.9 to 10.6 to 13.7 to 1
NET POSITION TREND:
– Strength Index Score (3 Year Range Pct):95.64.097.9
– Strength Index Reading (3 Year Range):Bullish-ExtremeBearish-ExtremeBullish-Extreme
NET POSITION MOVEMENT INDEX:
– 6-Week Change in Strength Index:8.0-9.335.1


Article By InvestMacroReceive our weekly COT Newsletter

*COT Report: The COT data, released weekly to the public each Friday, is updated through the most recent Tuesday (data is 3 days old) and shows a quick view of how large speculators or non-commercials (for-profit traders) were positioned in the futures markets.

The CFTC categorizes trader positions according to commercial hedgers (traders who use futures contracts for hedging as part of the business), non-commercials (large traders who speculate to realize trading profits) and nonreportable traders (usually small traders/speculators) as well as their open interest (contracts open in the market at time of reporting). See CFTC criteria here.

Gold Closes with a Decline for the Second Week in a Row: Fewer Risks

By RoboForex Analytical Department

Gold on Friday was at 4800 USD per troy ounce. It remains in a vulnerable position after declining 3.8% the day before and is moving towards its second consecutive weekly drawdown. This comes amid high selling pressure.

The correction follows a series of updates to historic highs in January. The rise in prices was initially driven by heightened geopolitical risks, concerns about the Fed’s independence, and speculative demand from China. The tension has since decreased, while the protective attractiveness of gold has diminished. Representatives of Iran and the US confirmed that negotiations are taking place in Oman, and the market is closely following their progress.

An additional factor was weak data on the US labour market. In January, the number of layoffs rose to 108.4 thousand, the maximum for this month since 2009. Initial claims for unemployment benefits rose to 231 thousand, and the ADP report on private-sector employment was weaker than expected. A series of these data has increased expectations of a Fed rate cut later this year. At the same time, the market still considers June as a possible time for the first step.

Technical Analysis

The H4 chart shows completed pulse growth with a peak above 5500, followed by an aggressive correction. The decline went to the 4450–4500 zone. From there, the rebound began. The price moved up to the 5000–5050 area but remains below the key 5100–5150 resistance and the Bollinger median line. The structure indicates a phase of high volatility and redistribution after an overheated uptrend.

After a sharp collapse, gold on the H1 chart formed a local bottom in the 4650–4700 range and began to recover. The price is back within the Bollinger Bands and is consolidating near the median line at around 4820–4850. The movement looks corrective, volatility is declining, and the balance of power is still neutral.

Conclusion

In summary, gold’s decline reflects a market reassessment, where receding geopolitical fears and a shift towards anticipating Fed easing have removed key pillars of its recent speculative rally. Technically, the sell-off appears to be a volatile but natural correction following an overheated uptrend. While a short-term stabilisation is underway, the price remains vulnerable below critical higher-timeframe resistance. The near-term direction will likely depend on the tone of upcoming US economic data, which will either reinforce or undermine the market’s dovish Fed expectations, and further developments in Middle East diplomacy.


Disclaimer

Any forecasts contained herein are based on the author’s particular opinion. This analysis may not be treated as trading advice. RoboForex bears no responsibility for trading results based on trading recommendations and reviews contained herein.

Gold is Back in the Black: Geopolitics Dictates Conditions Again

By RoboForex Analytical Department

Gold, on Wednesday, returned above the key level of 5000 USD per ounce and has already approached 5067 USD. The precious metal continues to grow after jumping more than 6% in the previous session, marking the strongest daily increase since 2008. The quotes were supported by purchases following a decline after a sharp correction at the beginning of the week.

Geopolitical risks gave an additional impetus to the precious metal. After US forces shot down an Iranian drone near an aircraft carrier in the Arabian Sea, demand for defensive assets intensified. At the same time, President Donald Trump stated that diplomatic contacts continue, and the White House confirmed the US-Iran talks scheduled for Friday.

Expectations of rapid Fed rate cuts have eased somewhat since the nomination of Kevin Warsh to head the Fed. Nevertheless, the markets are still pricing in two rate cuts – probably in the middle of the year and later in 2026.

Separately, it is noted that the publication of key US labour market statistics, including JOLTS data and the monthly employment report, will be postponed due to the partial government shutdown. The House voted on Tuesday on the Senate-approved stopgap budget.

Technical Analysis

On the H4 chart for gold, after completing a powerful uptrend and reaching a peak around 5600, the market entered a sharp correction. The decline was impulsive, as evidenced by the expansion of Bollinger Bands – a sign of panic selling. The minimum was noted in the 4440–4450 zone, from where the technical rebound began. Current prices are recovering but remain below the Bollinger median line. The structure is still corrective, with increased volatility and a predominance of downside risks.

On the H1 chart, after a landslide downward movement, a base and a sequence of higher minima have formed – local stabilisation. The price is trading in a narrow upward channel and gradually moving towards the 5050-5100 resistance zone. However, the recovery looks technical. As long as the quotes are below key resistance and the median line of the higher timeframe, the rebound remains vulnerable to a resumption of selling.

Conclusion

In summary, gold’s sharp recovery is primarily a technical rebound from oversold conditions, supercharged by a sudden flare-up in geopolitical tensions. While the move is significant, the technical structure across timeframes suggests it remains a corrective bounce within a larger downtrend, not a confirmed reversal. The rally is vulnerable as long as prices trade below key higher-timeframe resistance. The fundamental landscape remains mixed, with delayed US data creating uncertainty and revised, but still present, Fed easing expectations providing a floor. Near-term direction will hinge on the evolution of Middle East diplomacy and gold’s ability to breach critical technical ceilings.


By RoboForex Analytical Department


Disclaimer

Any forecasts contained herein are based on the author’s particular opinion. This analysis may not be treated as trading advice. RoboForex bears no responsibility for trading results based on trading recommendations and reviews contained herein.

What goes up must come down…

By ForexTime 

  • $15 trillion erased from silver/gold prices on Friday
  • Central banks and geopolitics back in focus
  • Bitcoin falls below $75,000 for first time in 10 months
  • NFP report on Friday may rock global markets

More than $15 trillion was erased from the value of gold and silver last Friday.

This monstrous amount was equivalent to half the size of the entire US economy.

  • Silver nosedived almost 40%
  • Gold tumbled nearly 15%

Precious metals have kicked off the new week under renewed pressure already flashing red this morning:

  • XAUUSD: ↓ 5%
  • XAGUSD: ↓7%

The selloff was triggered by Donald Trump’s nomination of Kevin Warsh for Fed Chair.

Opinions remain divided over whether Warsh will align with Trump’s view on how the Fed should be run, given his past status as an “inflation hawk’.

Traders are still pricing a less than 40% chance that the Fed cuts rates by April.

WHAT COULD MOVE SILVER/GOLD THIS WEEK:

  • US Partial government shutdown

Over the weekend, the US government entered a partial shutdown adding another layer of uncertainty to current developments.

This negative development may toss the Fed back into the wilderness as the absence of clear data complicates monetary policy planning.

So, another round of extended delays may force the Fed to adopt a “wait-and-see” approach on rates as it “drives in the fog”.

  • Geopolitical flashpoints

Last week, Trump threatened to attack Iran while saying he would impose tariffs on countries that supply oil to Cuba. Should tensions escalate, this may offer much-needed support to precious metals facing a bout of profit-taking and dollar strength.

  • US January NFP report –

The incoming NFP report could shape the metals outlook for February as discussed in the week ahead report.

Bitcoin slips to fresh 10-month low

Bitcoin tumbled to a fresh 10-month low in Asia trading on Monday, dipping below $75,000.

The “OG” crypto shed fell 11% in January, marking its fourth straight monthly decline — the longest losing streak since 2018…

The overall unrest across global markets and the absence of buyers have contributed to the recent declines.

US-listed spot Bitcoin ETFs have recorded three consecutive months of outflows while technical indicators signal the rise of bearish pressures.


POTENTIAL SCENARIOS:

BULLISH: A move back above the 50-day SMA at $87,500 could signal an incline toward $90,000, $95,000 and $100,000.

BEARISH: Sustained weakness below $77,500 could send prices toward $70,000 and lower.


Forex-Time-LogoArticle by ForexTime


ForexTime Ltd (FXTM) is an award winning international online forex broker regulated by CySEC 185/12 www.forextime.com