
By RoboForex Analytical Department
On Friday, the price of Gold surged to 2,983 USD per troy ounce, marking a new record high. The precious metal closed the week with a gain of over 2%, driven by a decline in risk appetite and growing expectations of interest rate cuts by the Federal Reserve.
Key drivers behind Gold’s rally
The ongoing escalation of trade tensions has played a significant role in boosting Gold prices. US President Donald Trump recently threatened to impose a 200% tariff on European wines and other alcoholic beverages in retaliation for the EU’s 50% tax on US whiskey exports. This has further fuelled market uncertainty, driving investors toward safe-haven assets like Gold.
Additionally, recent US economic data, including the Producer Price Index (PPI) and Consumer Price Index (CPI), showed easing inflationary pressures in February. This has strengthened the case for potential rate cuts by the Federal Reserve, enhancing Gold’s appeal as a non-yielding asset.
Gold also benefits from robust demand for gold-backed exchange-traded funds (ETFs) and consistent purchases by global central banks. Notably, February’s data confirmed that China has increased its Gold reserves for the fourth consecutive month. These factors have overshadowed the influence of the US dollar on Gold prices, which currently plays a minimal role in the metal’s trajectory.
Free Reports:
 Get our Weekly Commitment of Traders Reports - See where the biggest traders (Hedge Funds and Commercial Hedgers) are positioned in the futures markets on a weekly basis.
 Download Our Metatrader 4 Indicators – Put Our Free MetaTrader 4 Custom Indicators on your charts when you join our Weekly Newsletter
Technical Analysis of XAU/USD
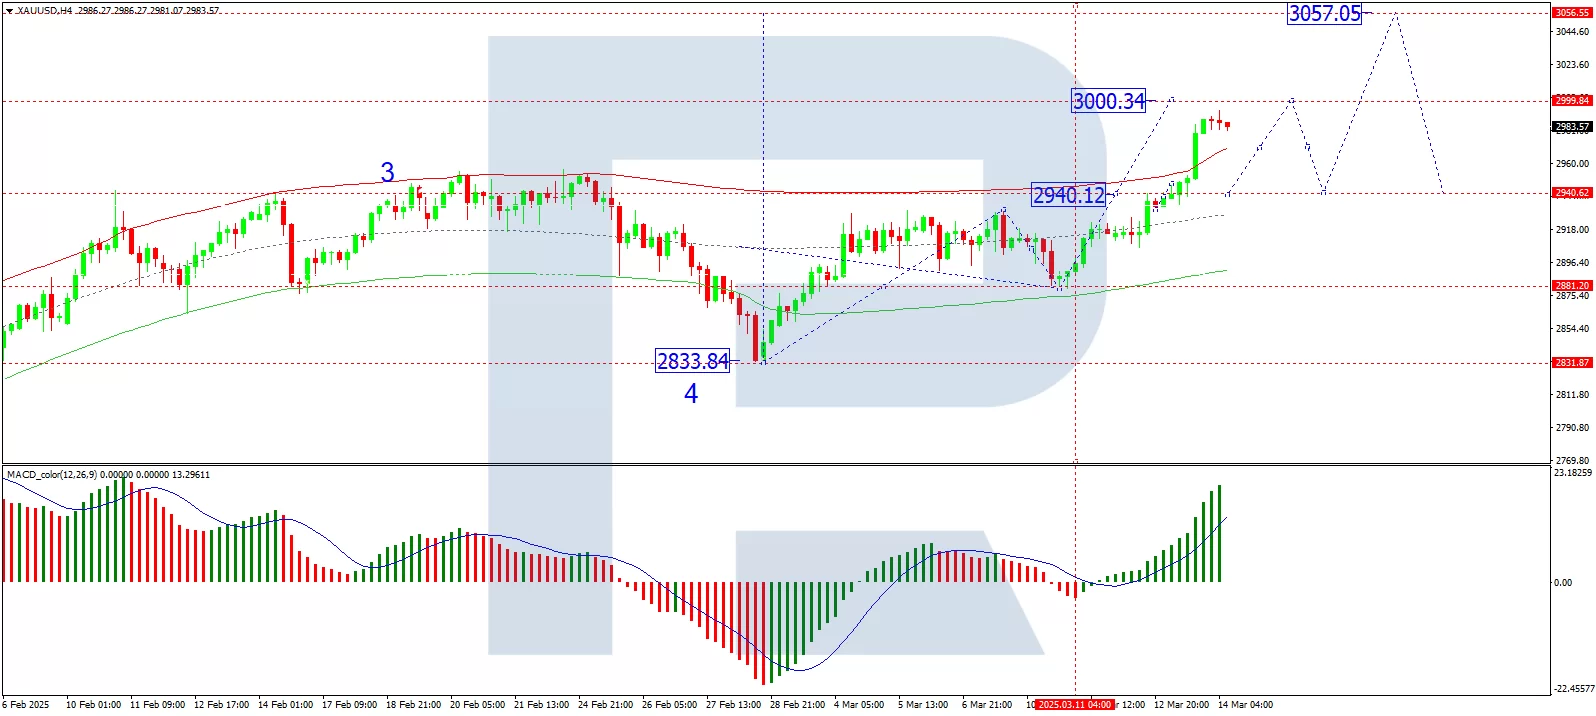
On the H4 chart of XAUUSD, the market has confidently breached the 2,940 USD level and continues its upward momentum towards 3,000 USD, which is the immediate target anticipated to be reached today. Following this, a corrective pullback to 2,940 USD (testing the level from above) is possible. Once this correction concludes, there is potential for a new growth wave targeting 3,057 USD. This scenario is technically supported by the MACD indicator, whose signal line remains above zero and is trending sharply upward.
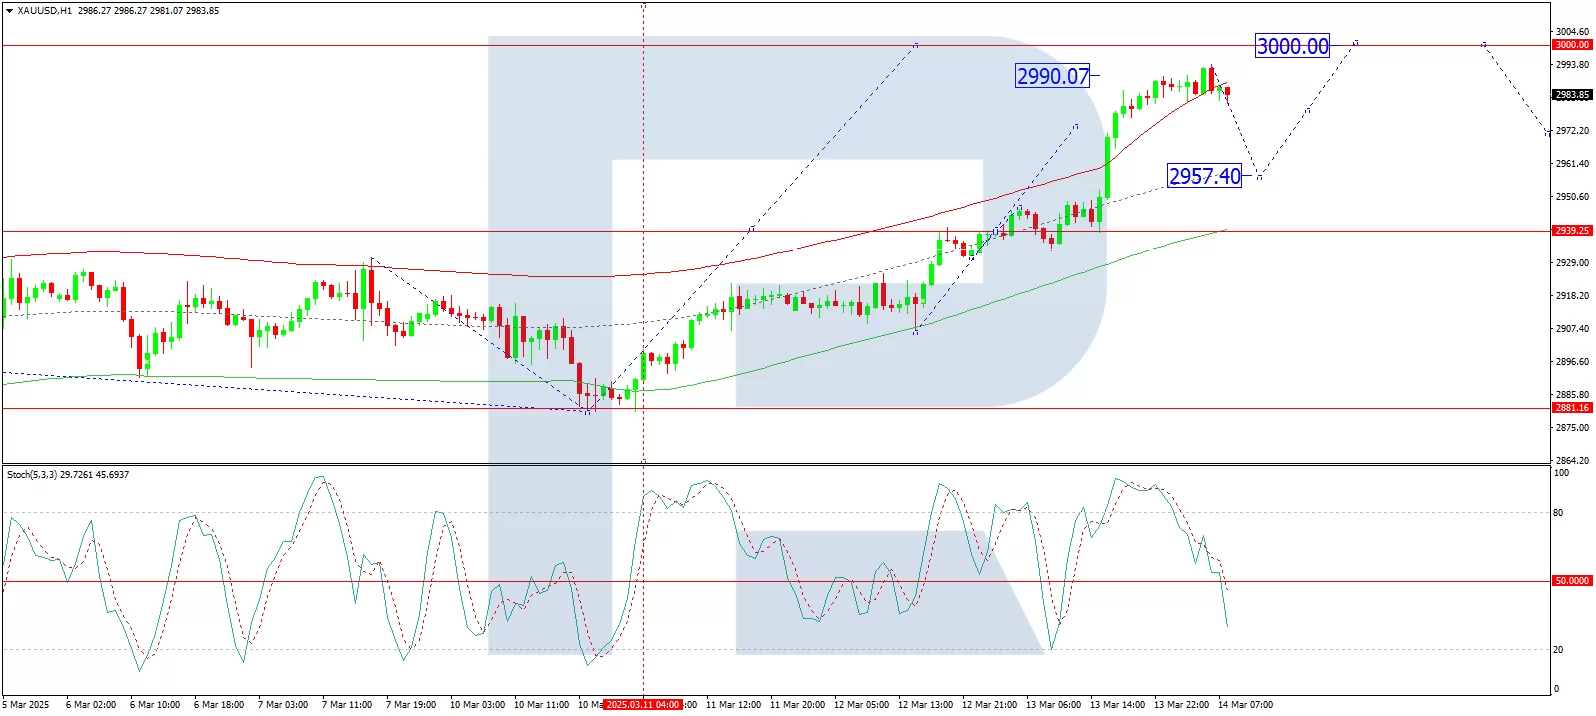
On the H1 chart, the market has completed the growth wave structure to the 2,940 USD level. A tight consolidation range has formed around this level, and the upward wave towards 3,000 is progressing with a strong breakout. Today, the local target of this wave at 2,990 USD is expected to be achieved, and a corrective move towards 2,957 USD is possible. Following this, further growth towards the 3,000 USD level is anticipated. Upon reaching this target, a corrective wave back to 2,940 is likely. This outlook is technically confirmed by the Stochastic oscillator, whose signal line is below the 50 level and is trending downward toward 20.
Conclusion
Gold’s rally is supported by a combination of macroeconomic factors, including trade tensions, easing inflation, and strong central bank demand. Technically, the metal is poised to test the 3,000 USD level, with potential corrections along the way. Investors should monitor key support and resistance levels and macroeconomic developments to gauge the next phase of Gold’s movement.
Disclaimer
Any forecasts contained herein are based on the author’s particular opinion. This analysis may not be treated as trading advice. RoboForex bears no responsibility for trading results based on trading recommendations and reviews contained herein.

- The US Tech sector hit by sell‑off. Oil prices decline on renewed negotiations Jul 28, 2026
- Gold Declines, Focus on Fed and Falling Oil Prices Jul 28, 2026
- This week will be one of the most crowded for central‑bank meetings Jul 27, 2026
- EUR/USD Ahead of a Key Week: Holding Near Lows Jul 27, 2026
- COT Metals Charts: Weekly Speculator Changes led by Copper Jul 26, 2026
- COT Bonds Charts: Speculator Bets led by SOFR 3-Months & 5-Year Bonds Jul 26, 2026
- COT Energy Charts: Weekly Speculator Bets led by WTI Crude & Natural Gas Jul 26, 2026
- COT Soft Commodities Charts: Weekly Speculator Bets led by Corn & Soybeans Jul 26, 2026
- The US introduces new import tariffs for 60 countries. Brent crude surpasses $100 per barrel Jul 24, 2026
- USD/JPY Breaks Records: Nothing Slows the Yen’s Decline Jul 24, 2026
