Archive for CountingPips Forex Blog – Page 31

Stock Market COT Charts: VIX, Nasdaq-Mini, Russell-2000, Emerging Markets & Dow-Mini

By CountingPips.com COT Home | Data Tables | Data Downloads | Newsletter

Here are the latest charts and statistics for the Commitment of Traders (COT) data published by the Commodities Futures Trading Commission (CFTC).

The latest COT data is updated through Tuesday August 03 2021 and shows a quick view of how large traders (for-profit speculators and commercial entities) were positioned in the futures markets.


VIX Volatility Futures:
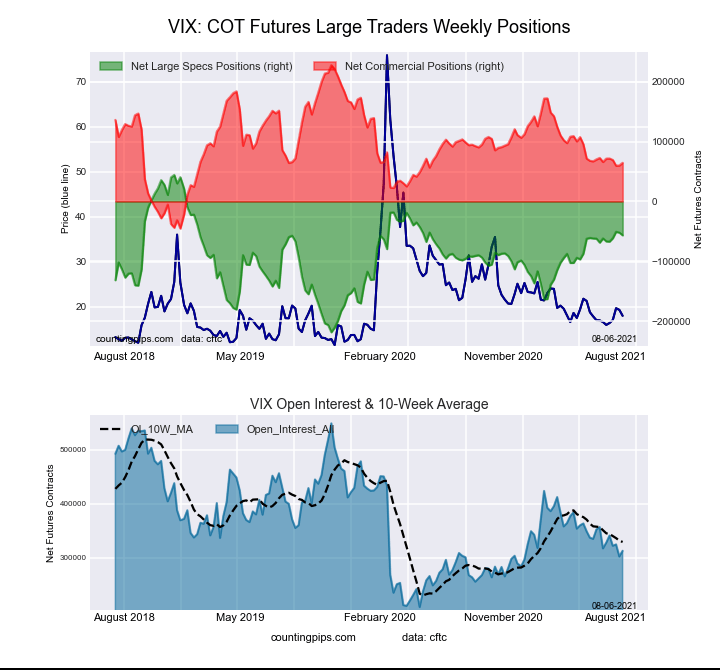
Federal Funds 30-Day Bonds Futures COT ChartThe VIX Volatility large speculator standing this week reached a net position of -56,567 contracts in the data reported through Tuesday. This was a weekly reduction of -4,512 contracts from the previous week which had a total of -52,055 net contracts.

This week’s current strength score (the trader positioning range over the past three years, measured from 0 to 100) shows the speculators are currently Bullish with a score of 61.6 percent. The commercials are Bearish with a score of 40.2 percent and the small traders (not shown in chart) are Bearish with a score of 26.4 percent.

VIX Volatility Futures StatisticsSPECULATORSCOMMERCIALSSMALL TRADERS
– Percent of Open Interest Longs:22.551.47.2
– Percent of Open Interest Shorts:40.630.89.7
– Net Position:-56,56764,483-7,916
– Gross Longs:70,377160,74522,439
– Gross Shorts:126,94496,26230,355
– Long to Short Ratio:0.6 to 11.7 to 10.7 to 1
NET POSITION TREND:
– COT Index Score (3 Year Range Pct):61.640.226.4
– COT Index Reading (3 Year Range):BullishBearishBearish
NET POSITION MOVEMENT INDEX:
– 6-Week Change in Strength Index:2.0-0.5-14.2


S&P500 Mini Futures:

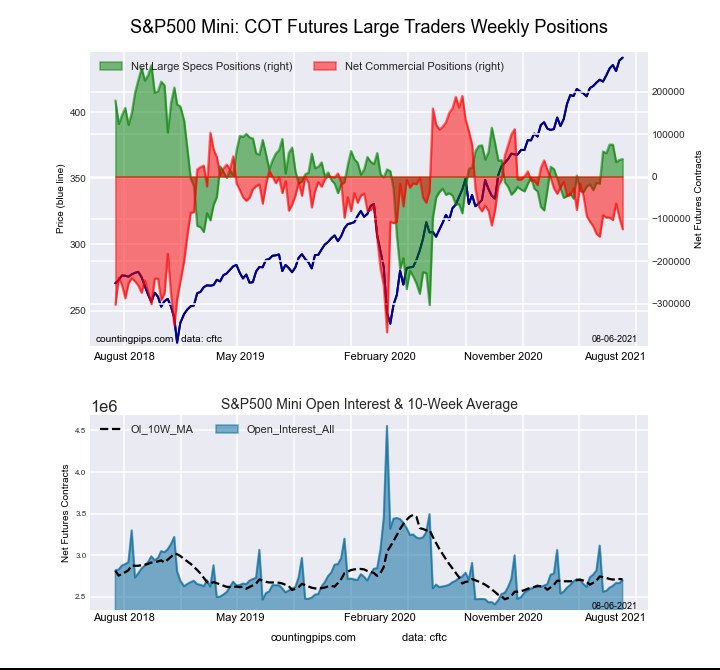
2-Year Treasury Bonds Futures COT ChartThe S&P500 Mini large speculator standing this week reached a net position of 41,266 contracts in the data reported through Tuesday. This was a weekly rise of 1,891 contracts from the previous week which had a total of 39,375 net contracts.

This week’s current strength score (the trader positioning range over the past three years, measured from 0 to 100) shows the speculators are currently Bullish with a score of 60.8 percent. The commercials are Bearish with a score of 43.6 percent and the small traders (not shown in chart) are Bearish with a score of 43.8 percent.

S&P500 Mini Futures StatisticsSPECULATORSCOMMERCIALSSMALL TRADERS
– Percent of Open Interest Longs:16.368.312.2
– Percent of Open Interest Shorts:14.872.99.1
– Net Position:41,266-124,50283,236
– Gross Longs:439,7111,840,963328,069
– Gross Shorts:398,4451,965,465244,833
– Long to Short Ratio:1.1 to 10.9 to 11.3 to 1
NET POSITION TREND:
– COT Index Score (3 Year Range Pct):60.843.643.8
– COT Index Reading (3 Year Range):BullishBearishBearish
NET POSITION MOVEMENT INDEX:
– 6-Week Change in Strength Index:-3.2-5.910.8


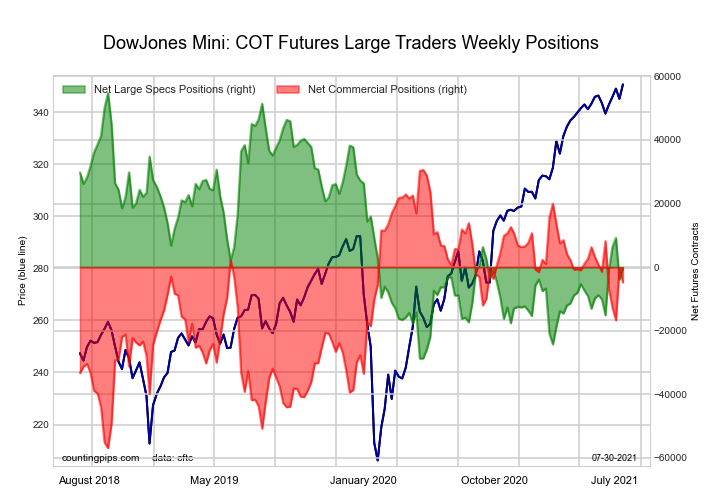
Dow Jones Mini Futures:

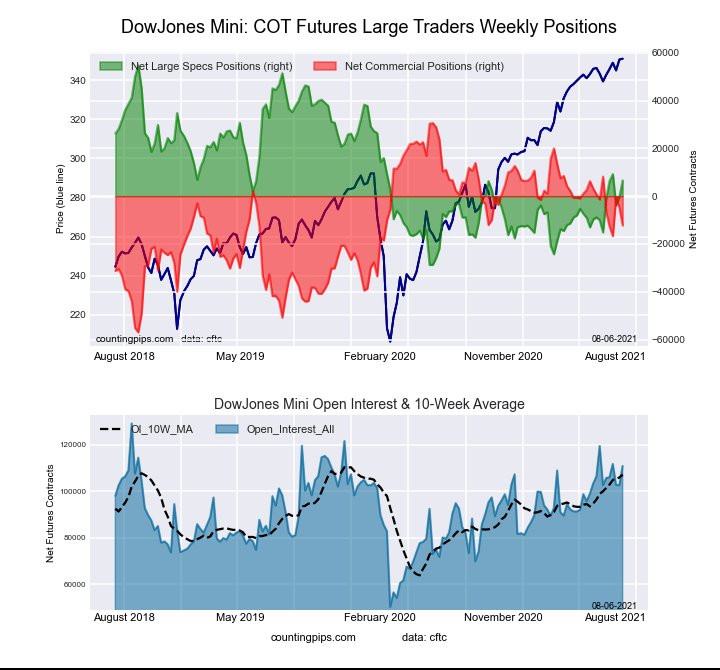
5-Year Treasury Bonds Futures COT ChartThe Dow Jones Mini large speculator standing this week reached a net position of 6,581 contracts in the data reported through Tuesday. This was a weekly lift of 6,954 contracts from the previous week which had a total of -373 net contracts.

This week’s current strength score (the trader positioning range over the past three years, measured from 0 to 100) shows the speculators are currently Bearish with a score of 42.3 percent. The commercials are Bullish with a score of 51.1 percent and the small traders (not shown in chart) are Bullish with a score of 68.8 percent.

Dow Jones Mini Futures StatisticsSPECULATORSCOMMERCIALSSMALL TRADERS
– Percent of Open Interest Longs:43.738.116.2
– Percent of Open Interest Shorts:37.749.211.1
– Net Position:6,581-12,2515,670
– Gross Longs:48,40742,25217,984
– Gross Shorts:41,82654,50312,314
– Long to Short Ratio:1.2 to 10.8 to 11.5 to 1
NET POSITION TREND:
– COT Index Score (3 Year Range Pct):42.351.168.8
– COT Index Reading (3 Year Range):BearishBullishBullish
NET POSITION MOVEMENT INDEX:
– 6-Week Change in Strength Index:26.0-23.4-6.8


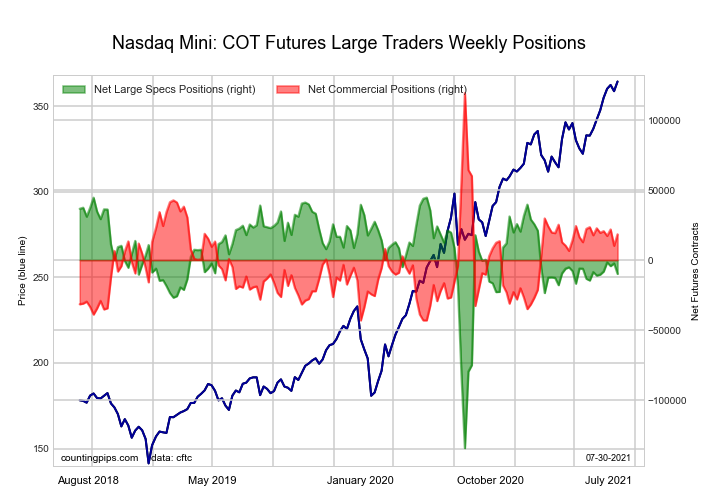
Nasdaq Mini Futures:

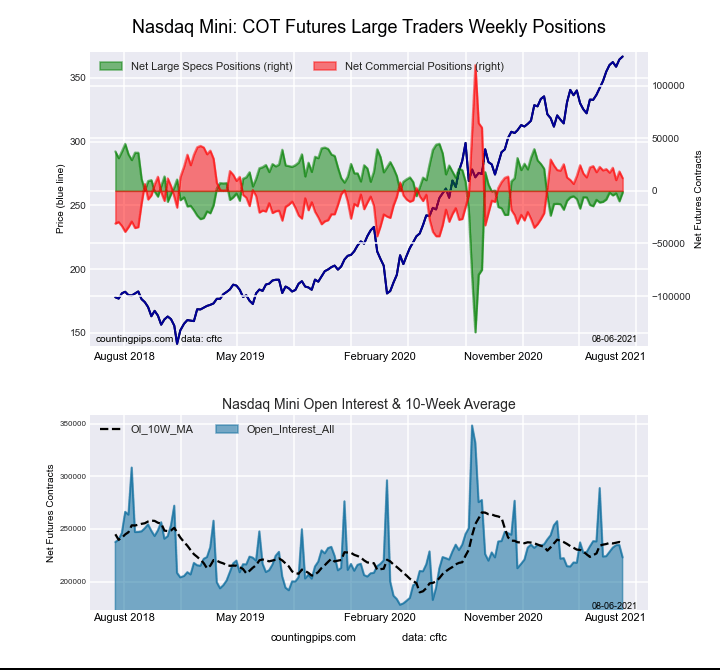
10-Year Treasury Notes Bonds Futures COT ChartThe Nasdaq Mini large speculator standing this week reached a net position of -1,466 contracts in the data reported through Tuesday. This was a weekly increase of 8,359 contracts from the previous week which had a total of -9,825 net contracts.

This week’s current strength score (the trader positioning range over the past three years, measured from 0 to 100) shows the speculators are currently Bullish with a score of 74.2 percent. The commercials are Bearish with a score of 34.0 percent and the small traders (not shown in chart) are Bearish with a score of 20.1 percent.

Nasdaq Mini Futures StatisticsSPECULATORSCOMMERCIALSSMALL TRADERS
– Percent of Open Interest Longs:29.153.714.9
– Percent of Open Interest Shorts:29.748.319.7
– Net Position:-1,46612,104-10,638
– Gross Longs:64,869119,73233,292
– Gross Shorts:66,335107,62843,930
– Long to Short Ratio:1.0 to 11.1 to 10.8 to 1
NET POSITION TREND:
– COT Index Score (3 Year Range Pct):74.234.020.1
– COT Index Reading (3 Year Range):BullishBearishBearish
NET POSITION MOVEMENT INDEX:
– 6-Week Change in Strength Index:5.0-4.5-3.4


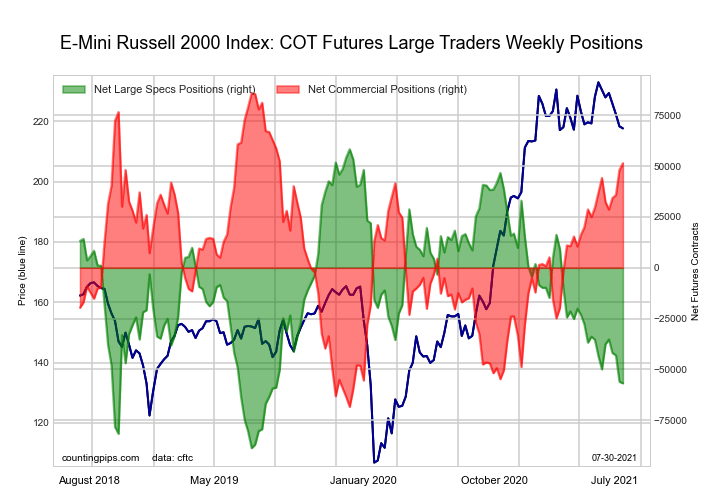
Russell 2000 Mini Futures:

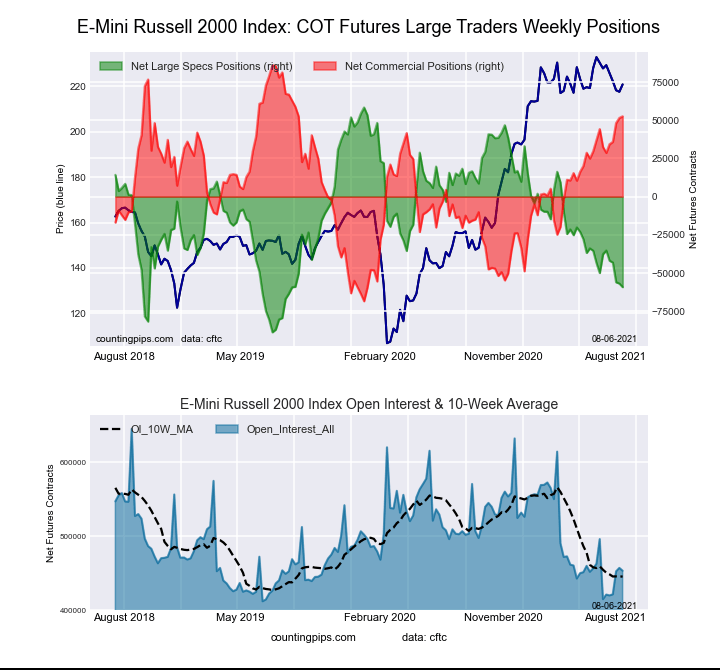
Ultra 10-Year Treasury Notes Bonds Futures COT ChartThe Russell 2000 Mini large speculator standing this week reached a net position of -59,211 contracts in the data reported through Tuesday. This was a weekly fall of -2,361 contracts from the previous week which had a total of -56,850 net contracts.

This week’s current strength score (the trader positioning range over the past three years, measured from 0 to 100) shows the speculators are currently Bearish with a score of 20.1 percent. The commercials are Bullish with a score of 78.4 percent and the small traders (not shown in chart) are Bullish with a score of 51.8 percent.

Russell 2000 Mini Futures StatisticsSPECULATORSCOMMERCIALSSMALL TRADERS
– Percent of Open Interest Longs:12.280.26.4
– Percent of Open Interest Shorts:25.368.54.9
– Net Position:-59,21152,5786,633
– Gross Longs:55,463363,26028,845
– Gross Shorts:114,674310,68222,212
– Long to Short Ratio:0.5 to 11.2 to 11.3 to 1
NET POSITION TREND:
– COT Index Score (3 Year Range Pct):20.178.451.8
– COT Index Reading (3 Year Range):BearishBullishBullish
NET POSITION MOVEMENT INDEX:
– 6-Week Change in Strength Index:-14.713.04.0


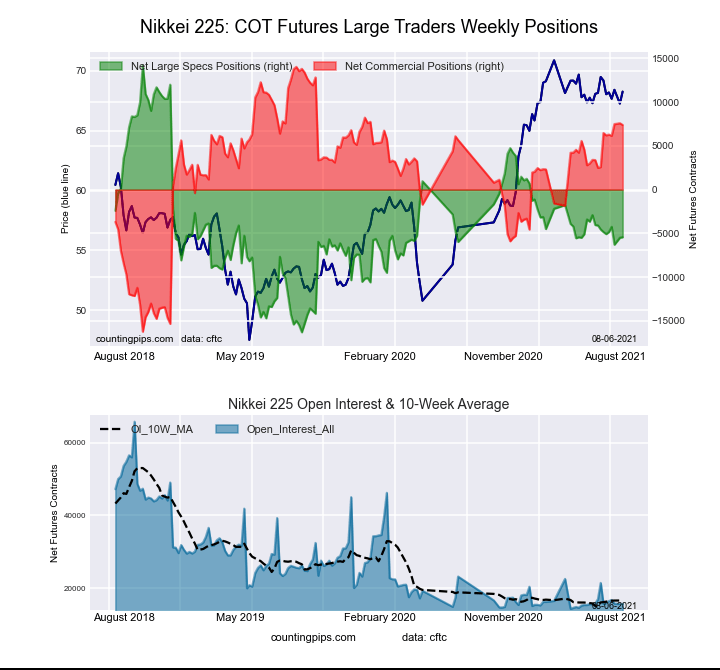
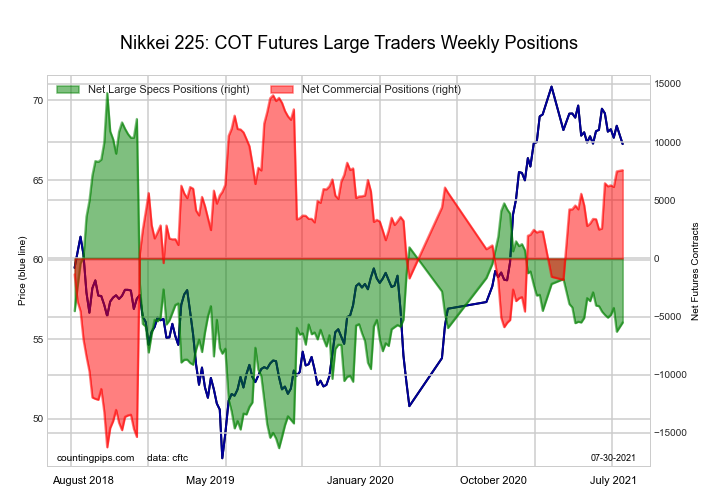
Nikkei Stock Average (USD) Futures:

US Year Treasury Notes Long Bonds Futures COT ChartThe Nikkei Stock Average (USD) large speculator standing this week reached a net position of -5,440 contracts in the data reported through Tuesday. This was a weekly lift of 59 contracts from the previous week which had a total of -5,499 net contracts.

This week’s current strength score (the trader positioning range over the past three years, measured from 0 to 100) shows the speculators are currently Bearish with a score of 35.6 percent. The commercials are Bullish with a score of 78.1 percent and the small traders (not shown in chart) are Bearish-Extreme with a score of 1.6 percent.

Nikkei Stock Average Futures StatisticsSPECULATORSCOMMERCIALSSMALL TRADERS
– Percent of Open Interest Longs:14.962.123.0
– Percent of Open Interest Shorts:49.515.135.4
– Net Position:-5,4407,387-1,947
– Gross Longs:2,3419,7543,613
– Gross Shorts:7,7812,3675,560
– Long to Short Ratio:0.3 to 14.1 to 10.6 to 1
NET POSITION TREND:
– COT Index Score (3 Year Range Pct):35.678.11.6
– COT Index Reading (3 Year Range):BearishBullishBearish-Extreme
NET POSITION MOVEMENT INDEX:
– 6-Week Change in Strength Index:-1.93.1-3.7


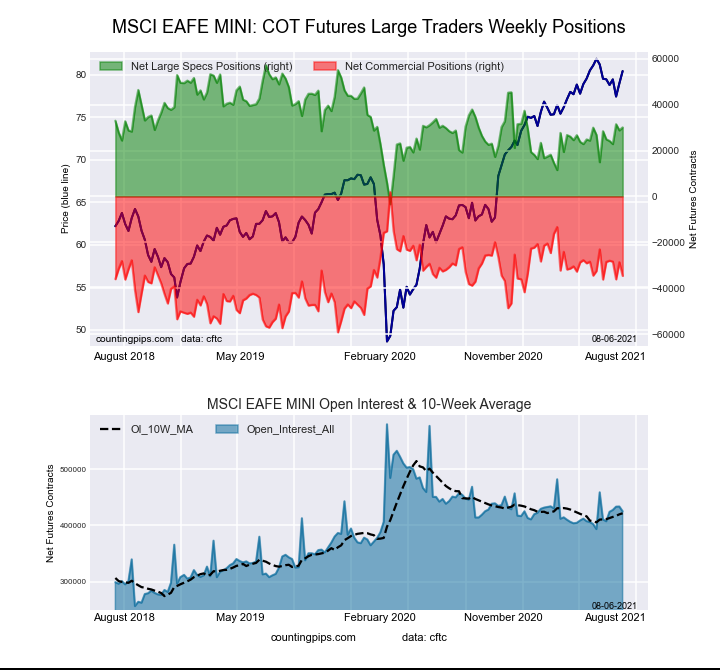
MSCI EAFE Mini Futures:

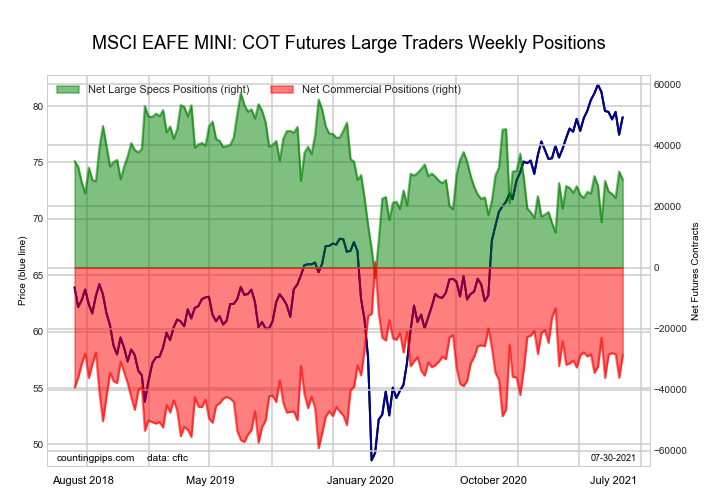
Ultra US Year Treasury Notes Long Bonds Futures COT ChartThe MSCI EAFE Mini large speculator standing this week reached a net position of 30,057 contracts in the data reported through Tuesday. This was a weekly increase of 1,272 contracts from the previous week which had a total of 28,785 net contracts.

This week’s current strength score (the trader positioning range over the past three years, measured from 0 to 100) shows the speculators are currently Bullish with a score of 55.2 percent. The commercials are Bearish with a score of 40.3 percent and the small traders (not shown in chart) are Bullish with a score of 57.1 percent.

MSCI EAFE Mini Futures StatisticsSPECULATORSCOMMERCIALSSMALL TRADERS
– Percent of Open Interest Longs:10.187.02.5
– Percent of Open Interest Shorts:3.095.11.5
– Net Position:30,057-34,6024,545
– Gross Longs:42,995369,92310,758
– Gross Shorts:12,938404,5256,213
– Long to Short Ratio:3.3 to 10.9 to 11.7 to 1
NET POSITION TREND:
– COT Index Score (3 Year Range Pct):55.240.357.1
– COT Index Reading (3 Year Range):BullishBearishBullish
NET POSITION MOVEMENT INDEX:
– 6-Week Change in Strength Index:2.72.6-29.3


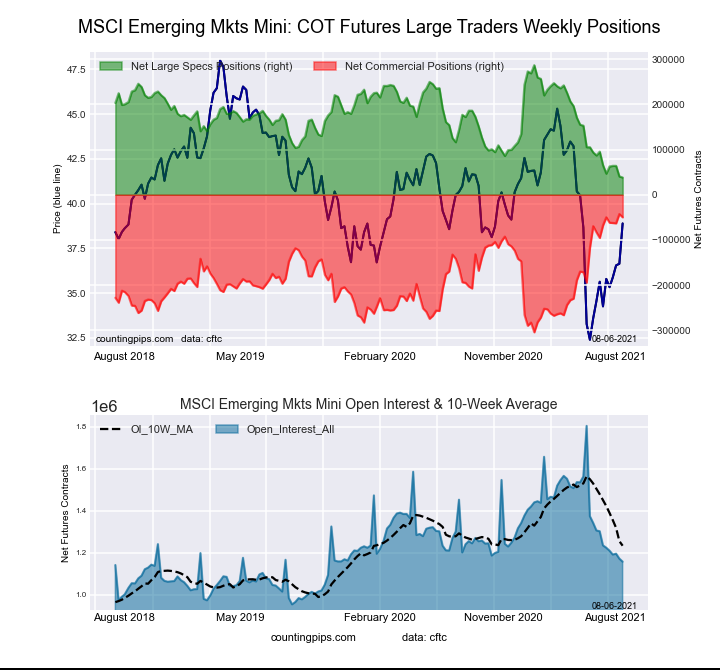
MSCI Emerging Mkts Mini Futures:

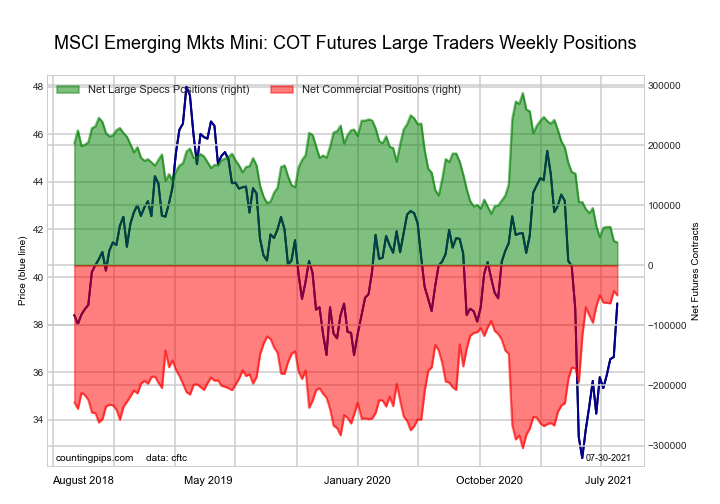
Eurodollar Bonds Futures COT ChartThe MSCI Emerging Mkts Mini large speculator standing this week reached a net position of 38,211 contracts in the data reported through Tuesday. This was a weekly decrease of -2,219 contracts from the previous week which had a total of 40,430 net contracts.

This week’s current strength score (the trader positioning range over the past three years, measured from 0 to 100) shows the speculators are currently Bearish-Extreme with a score of 0.0 percent. The commercials are Bullish-Extreme with a score of 97.2 percent and the small traders (not shown in chart) are Bearish with a score of 40.4 percent.

MSCI Emerging Mkts Mini Futures StatisticsSPECULATORSCOMMERCIALSSMALL TRADERS
– Percent of Open Interest Longs:14.382.22.4
– Percent of Open Interest Shorts:11.086.51.3
– Net Position:38,211-49,88611,675
– Gross Longs:165,150950,68527,250
– Gross Shorts:126,9391,000,57115,575
– Long to Short Ratio:1.3 to 11.0 to 11.7 to 1
NET POSITION TREND:
– COT Index Score (3 Year Range Pct):0.097.240.4
– COT Index Reading (3 Year Range):Bearish-ExtremeBullish-ExtremeBearish
NET POSITION MOVEMENT INDEX:
– 6-Week Change in Strength Index:-11.06.87.3


Article By CountingPips.comReceive our weekly COT Reports by Email

*COT Report: The COT data, released weekly to the public each Friday, is updated through the most recent Tuesday (data is 3 days old) and shows a quick view of how large speculators or non-commercials (for-profit traders) were positioned in the futures markets.

The CFTC categorizes trader positions according to commercial hedgers (traders who use futures contracts for hedging as part of the business), non-commercials (large traders who speculate to realize trading profits) and nonreportable traders (usually small traders/speculators).

Find CFTC criteria here: (http://www.cftc.gov/MarketReports/CommitmentsofTraders/ExplanatoryNotes/index.htm).

Energy Futures COT Charts: Brent Crude Oil, Natural Gas, Bloomberg Index, Heating Oil & WTI Crude

By CountingPips.com COT Home | Data Tables | Data Downloads | Newsletter

Here are the latest charts and statistics for the Commitment of Traders (COT) data published by the Commodities Futures Trading Commission (CFTC).

The latest COT data is updated through Tuesday August 03 2021 and shows a quick view of how large traders (for-profit speculators and commercial entities) were positioned in the futures markets.


WTI Crude Oil Futures :

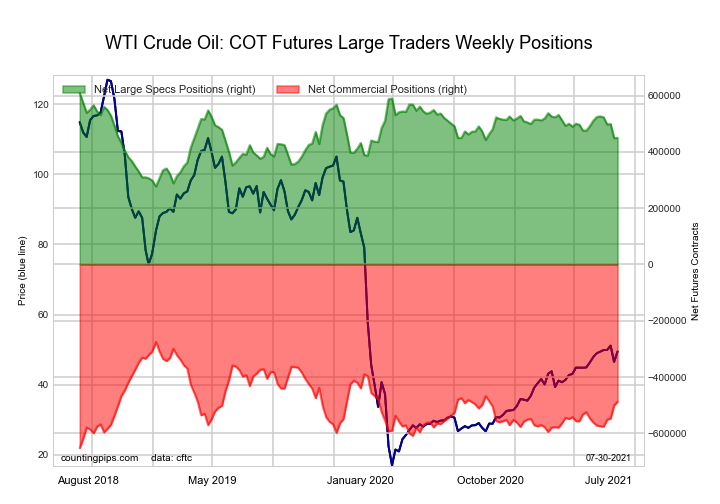
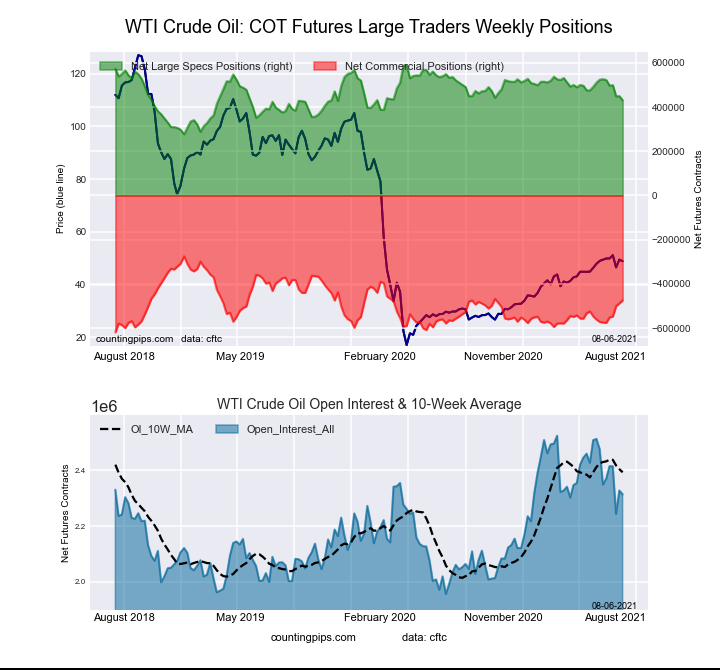
WTI Crude Oil Futures COT ChartThe WTI Crude Oil Futures large speculator standing this week resulted in a net position of 430,527 contracts in the data reported through Tuesday. This was a weekly reduction of -19,237 contracts from the previous week which had a total of 449,764 net contracts.

This week’s current strength score (the trader positioning range over the past three years, measured from 0 to 100) shows the speculators are currently Bearish with a score of 49.1 percent. The commercials are Bearish with a score of 42.0 percent and the small traders (not shown in chart) are Bullish with a score of 76.8 percent.

WTI Crude Oil Futures StatisticsSPECULATORSCOMMERCIALSSMALL TRADERS
– Percent of Open Interest Longs:25.235.44.1
– Percent of Open Interest Shorts:6.655.92.2
– Net Position:430,527-474,35843,831
– Gross Longs:583,470818,26494,256
– Gross Shorts:152,9431,292,62250,425
– Long to Short Ratio:3.8 to 10.6 to 11.9 to 1
NET POSITION TREND:
– COT Index Score (3 Year Range Pct):49.142.076.8
– COT Index Reading (3 Year Range):BearishBearishBullish
NET POSITION MOVEMENT INDEX:
– 6-Week Change in Strength Index:-30.629.1-6.3


Brent Crude Oil Futures :

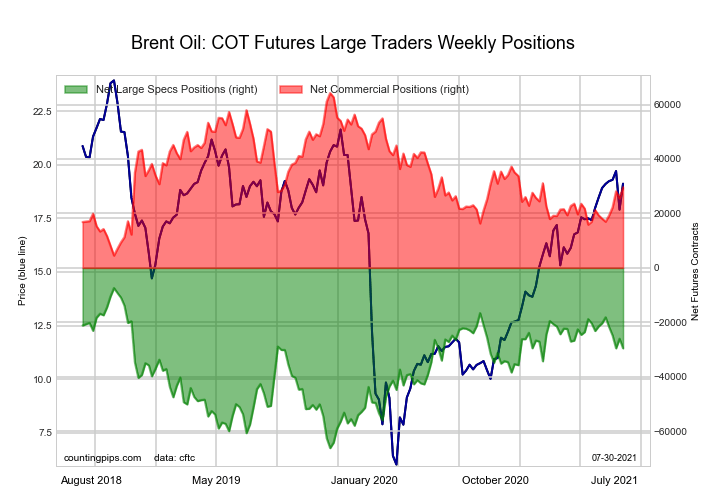
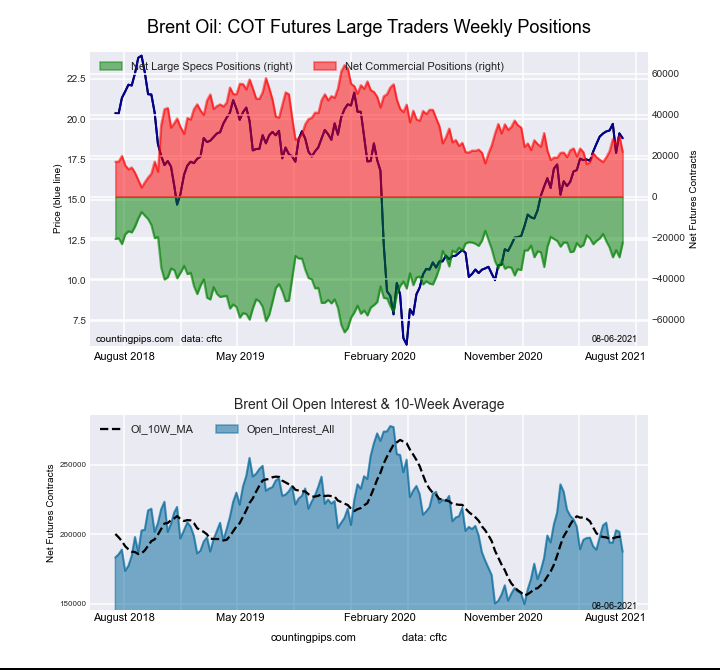
Brent Last Day Crude Oil Futures COT ChartThe Brent Crude Oil Futures large speculator standing this week resulted in a net position of -22,385 contracts in the data reported through Tuesday. This was a weekly increase of 7,162 contracts from the previous week which had a total of -29,547 net contracts.

This week’s current strength score (the trader positioning range over the past three years, measured from 0 to 100) shows the speculators are currently Bullish with a score of 74.5 percent. The commercials are Bearish with a score of 29.0 percent and the small traders (not shown in chart) are Bearish with a score of 40.1 percent.

Brent Crude Oil Futures StatisticsSPECULATORSCOMMERCIALSSMALL TRADERS
– Percent of Open Interest Longs:21.251.24.1
– Percent of Open Interest Shorts:33.139.63.8
– Net Position:-22,38521,849536
– Gross Longs:39,64895,9347,652
– Gross Shorts:62,03374,0857,116
– Long to Short Ratio:0.6 to 11.3 to 11.1 to 1
NET POSITION TREND:
– COT Index Score (3 Year Range Pct):74.529.040.1
– COT Index Reading (3 Year Range):BullishBearishBearish
NET POSITION MOVEMENT INDEX:
– 6-Week Change in Strength Index:-7.28.2-5.9


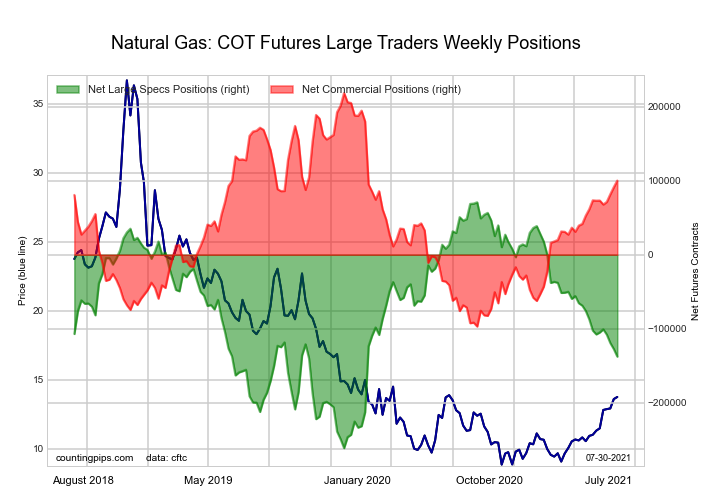
Natural Gas Futures :

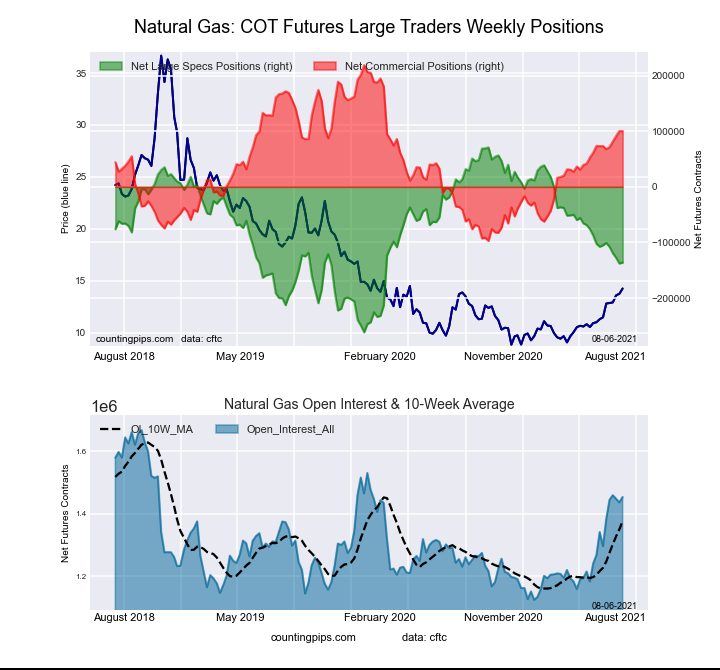
Natural Gas Futures COT ChartThe Natural Gas Futures large speculator standing this week resulted in a net position of -136,245 contracts in the data reported through Tuesday. This was a weekly gain of 1,513 contracts from the previous week which had a total of -137,758 net contracts.

This week’s current strength score (the trader positioning range over the past three years, measured from 0 to 100) shows the speculators are currently Bearish with a score of 37.7 percent. The commercials are Bullish with a score of 62.5 percent and the small traders (not shown in chart) are Bullish with a score of 61.9 percent.

Natural Gas Futures StatisticsSPECULATORSCOMMERCIALSSMALL TRADERS
– Percent of Open Interest Longs:23.841.24.3
– Percent of Open Interest Shorts:33.234.31.9
– Net Position:-136,245100,38635,859
– Gross Longs:346,382599,36962,934
– Gross Shorts:482,627498,98327,075
– Long to Short Ratio:0.7 to 11.2 to 12.3 to 1
NET POSITION TREND:
– COT Index Score (3 Year Range Pct):37.762.561.9
– COT Index Reading (3 Year Range):BearishBullishBullish
NET POSITION MOVEMENT INDEX:
– 6-Week Change in Strength Index:-9.48.613.1


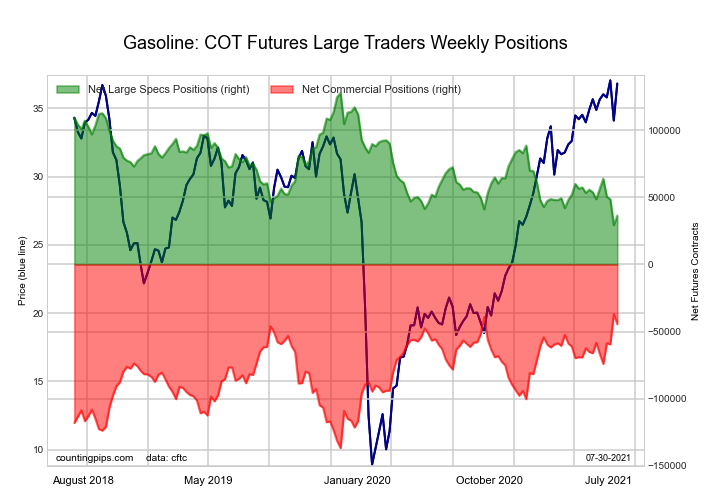
Gasoline Blendstock Futures :

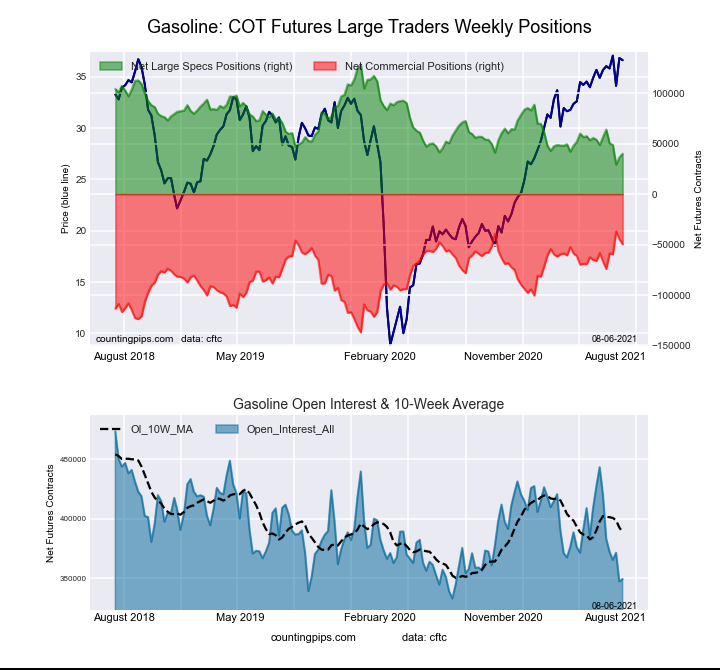
RBOB Gasoline Energy Futures COT ChartThe Gasoline Blendstock Futures large speculator standing this week resulted in a net position of 40,005 contracts in the data reported through Tuesday. This was a weekly boost of 3,654 contracts from the previous week which had a total of 36,351 net contracts.

This week’s current strength score (the trader positioning range over the past three years, measured from 0 to 100) shows the speculators are currently Bearish-Extreme with a score of 10.8 percent. The commercials are Bullish-Extreme with a score of 87.4 percent and the small traders (not shown in chart) are Bullish with a score of 69.3 percent.

Nasdaq Mini Futures StatisticsSPECULATORSCOMMERCIALSSMALL TRADERS
– Percent of Open Interest Longs:26.447.46.4
– Percent of Open Interest Shorts:14.961.63.6
– Net Position:40,005-49,6699,664
– Gross Longs:92,170165,54822,354
– Gross Shorts:52,165215,21712,690
– Long to Short Ratio:1.8 to 10.8 to 11.8 to 1
NET POSITION TREND:
– COT Index Score (3 Year Range Pct):10.887.469.3
– COT Index Reading (3 Year Range):Bearish-ExtremeBullish-ExtremeBullish
NET POSITION MOVEMENT INDEX:
– 6-Week Change in Strength Index:-16.817.2-3.6


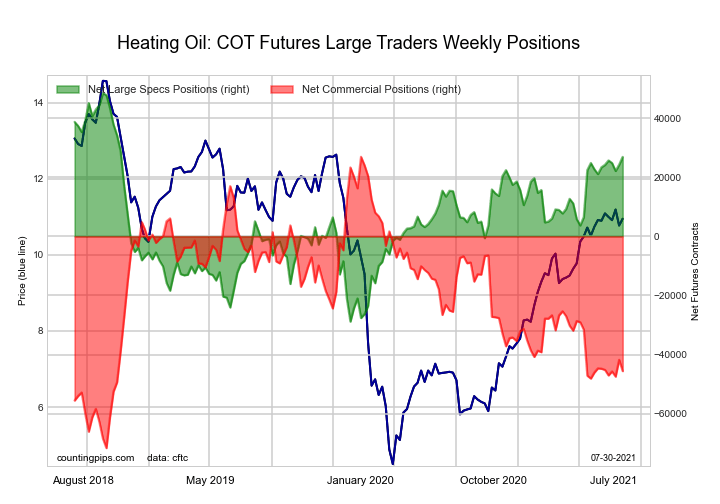
#2 Heating Oil NY-Harbor Futures :

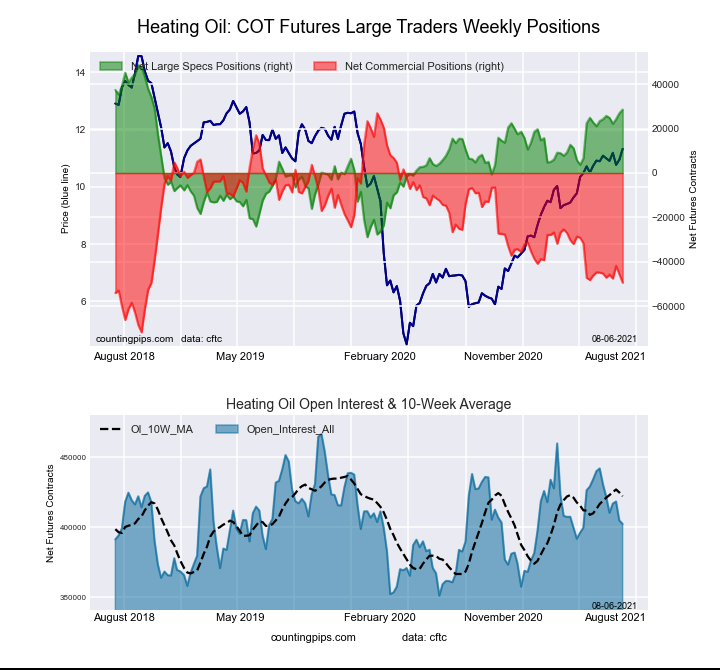
NY Harbor Heating Oil Energy Futures COT ChartThe #2 Heating Oil NY-Harbor Futures large speculator standing this week resulted in a net position of 28,540 contracts in the data reported through Tuesday. This was a weekly boost of 1,645 contracts from the previous week which had a total of 26,895 net contracts.

This week’s current strength score (the trader positioning range over the past three years, measured from 0 to 100) shows the speculators are currently Bullish with a score of 74.2 percent. The commercials are Bearish with a score of 22.6 percent and the small traders (not shown in chart) are Bullish-Extreme with a score of 81.7 percent.

Heating Oil Futures StatisticsSPECULATORSCOMMERCIALSSMALL TRADERS
– Percent of Open Interest Longs:17.350.110.6
– Percent of Open Interest Shorts:10.262.45.4
– Net Position:28,540-49,34320,803
– Gross Longs:69,669201,60142,467
– Gross Shorts:41,129250,94421,664
– Long to Short Ratio:1.7 to 10.8 to 12.0 to 1
NET POSITION TREND:
– COT Index Score (3 Year Range Pct):74.222.681.7
– COT Index Reading (3 Year Range):BullishBearishBullish-Extreme
NET POSITION MOVEMENT INDEX:
– 6-Week Change in Strength Index:5.6-4.2-0.7


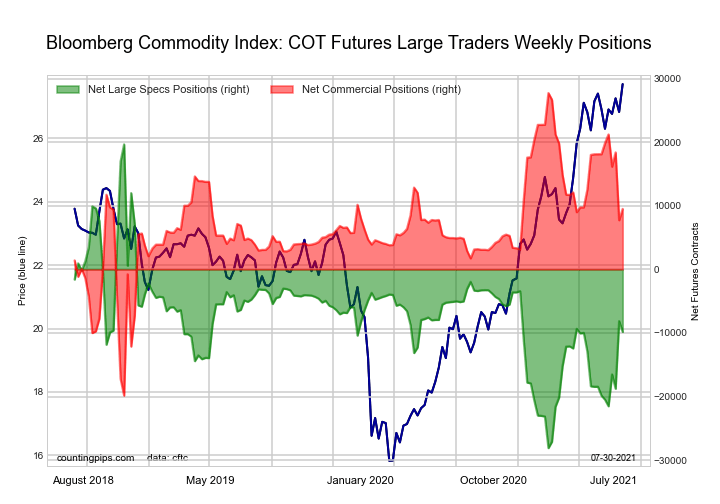
Bloomberg Commodity Index Futures :

Bloomberg Commodity Index Futures COT ChartThe Bloomberg Commodity Index Futures large speculator standing this week resulted in a net position of -11,576 contracts in the data reported through Tuesday. This was a weekly decline of -1,749 contracts from the previous week which had a total of -9,827 net contracts.

This week’s current strength score (the trader positioning range over the past three years, measured from 0 to 100) shows the speculators are currently Bearish with a score of 34.6 percent. The commercials are Bullish with a score of 65.3 percent and the small traders (not shown in chart) are Bearish with a score of 40.3 percent.

Bloomberg Index Futures StatisticsSPECULATORSCOMMERCIALSSMALL TRADERS
– Percent of Open Interest Longs:59.438.81.3
– Percent of Open Interest Shorts:90.19.00.3
– Net Position:-11,57611,211365
– Gross Longs:22,38314,611474
– Gross Shorts:33,9593,400109
– Long to Short Ratio:0.7 to 14.3 to 14.3 to 1
NET POSITION TREND:
– COT Index Score (3 Year Range Pct):34.665.340.3
– COT Index Reading (3 Year Range):BearishBullishBearish
NET POSITION MOVEMENT INDEX:
– 6-Week Change in Strength Index:18.6-18.2-11.5


Article By CountingPips.comReceive our weekly COT Reports by Email

*COT Report: The COT data, released weekly to the public each Friday, is updated through the most recent Tuesday (data is 3 days old) and shows a quick view of how large speculators or non-commercials (for-profit traders) were positioned in the futures markets.

The CFTC categorizes trader positions according to commercial hedgers (traders who use futures contracts for hedging as part of the business), non-commercials (large traders who speculate to realize trading profits) and nonreportable traders (usually small traders/speculators).

Find CFTC criteria here: (http://www.cftc.gov/MarketReports/CommitmentsofTraders/ExplanatoryNotes/index.htm).
Soft Commodities COT Charts: Corn, Soybean Oil, Cattle, Hogs, Sugar, Coffee, Cotton & Wheat

By CountingPips.com COT Home | Data Tables | Data Downloads | Newsletter

Here are the latest charts and statistics for the Commitment of Traders (COT) data published by the Commodities Futures Trading Commission (CFTC).

The latest COT data is updated through Tuesday August 03 2021 and shows a quick view of how large traders (for-profit speculators and commercial entities) were positioned in the futures markets.


CORN Futures:

Federal Funds 30-Day Bonds Futures COT ChartThe CORN large speculator standing this week resulted in a net position of 318,043 contracts in the data reported through Tuesday. This was a weekly advance of 11,366 contracts from the previous week which had a total of 306,677 net contracts.

This week’s current strength score (the trader positioning range over the past three years, measured from 0 to 100) shows the speculators are currently Bullish with a score of 70.7 percent. The commercials are Bearish with a score of 36.0 percent and the small traders (not shown in chart) are Bearish-Extreme with a score of 0.0 percent.

CORN Futures StatisticsSPECULATORSCOMMERCIALSSMALL TRADERS
– Percent of Open Interest Longs:27.547.78.4
– Percent of Open Interest Shorts:5.964.812.9
– Net Position:318,043-251,904-66,139
– Gross Longs:404,859701,272123,719
– Gross Shorts:86,816953,176189,858
– Long to Short Ratio:4.7 to 10.7 to 10.7 to 1
NET POSITION TREND:
– COT Index Score (3 Year Range Pct):70.736.00.0
– COT Index Reading (3 Year Range):BullishBearishBearish-Extreme
NET POSITION MOVEMENT INDEX:
– 6-Week Change in Strength Index:-9.011.0-4.0


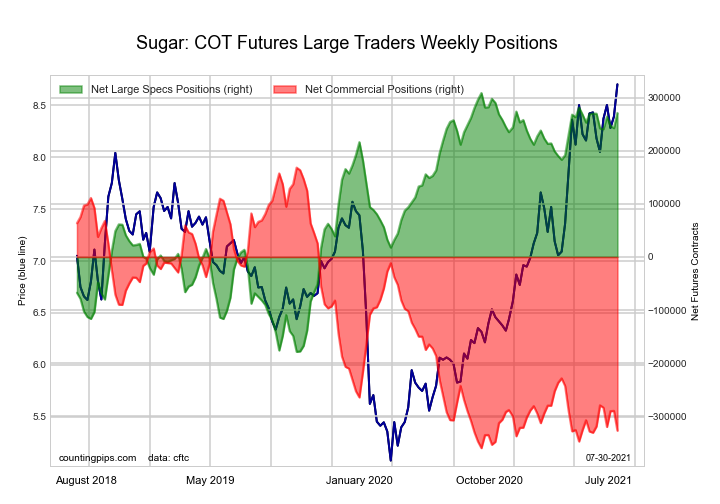
SUGAR Futures:

2-Year Treasury Bonds Futures COT ChartThe SUGAR large speculator standing this week resulted in a net position of 283,287 contracts in the data reported through Tuesday. This was a weekly increase of 12,300 contracts from the previous week which had a total of 270,987 net contracts.

This week’s current strength score (the trader positioning range over the past three years, measured from 0 to 100) shows the speculators are currently Bullish-Extreme with a score of 94.8 percent. The commercials are Bearish-Extreme with a score of 5.1 percent and the small traders (not shown in chart) are Bullish with a score of 68.8 percent.

SUGAR Futures StatisticsSPECULATORSCOMMERCIALSSMALL TRADERS
– Percent of Open Interest Longs:32.543.19.0
– Percent of Open Interest Shorts:3.876.84.0
– Net Position:283,287-332,60349,316
– Gross Longs:320,806425,15188,800
– Gross Shorts:37,519757,75439,484
– Long to Short Ratio:8.6 to 10.6 to 12.2 to 1
NET POSITION TREND:
– COT Index Score (3 Year Range Pct):94.85.168.8
– COT Index Reading (3 Year Range):Bullish-ExtremeBearish-ExtremeBullish
NET POSITION MOVEMENT INDEX:
– 6-Week Change in Strength Index:8.5-10.215.2


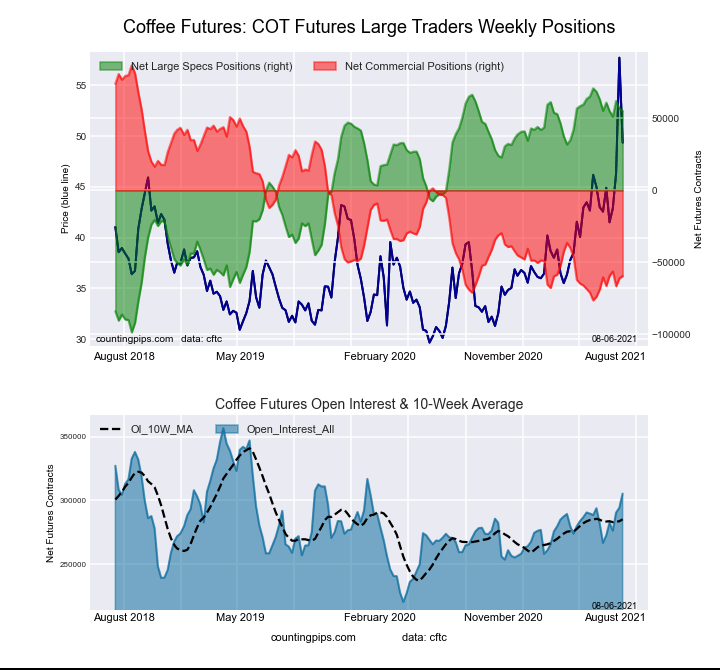
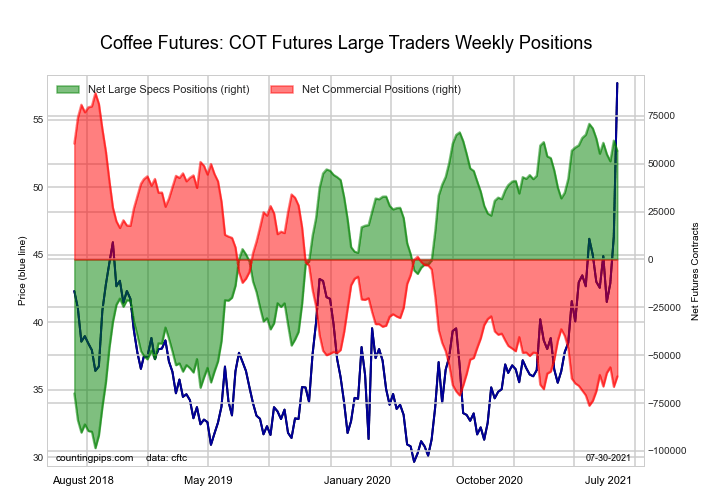
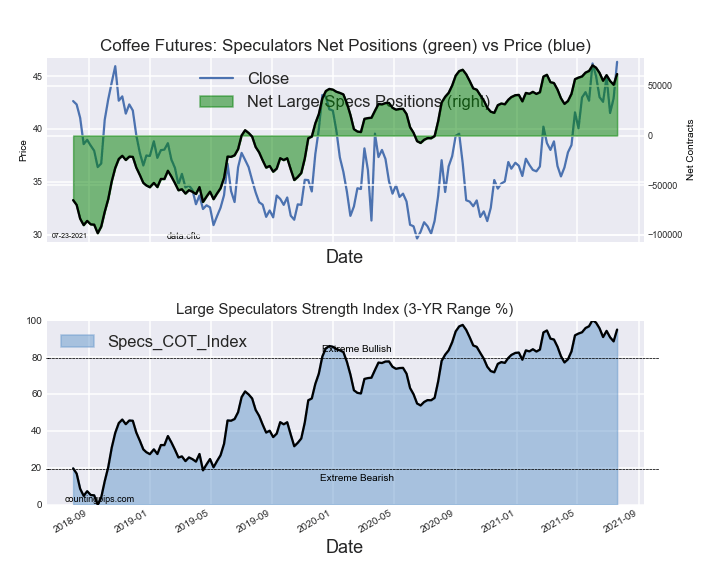
COFFEE Futures:

5-Year Treasury Bonds Futures COT ChartThe COFFEE large speculator standing this week resulted in a net position of 55,023 contracts in the data reported through Tuesday. This was a weekly reduction of -1,689 contracts from the previous week which had a total of 56,712 net contracts.

This week’s current strength score (the trader positioning range over the past three years, measured from 0 to 100) shows the speculators are currently Bullish-Extreme with a score of 90.7 percent. The commercials are Bearish-Extreme with a score of 10.3 percent and the small traders (not shown in chart) are Bearish-Extreme with a score of 19.2 percent.

COFFEE Futures StatisticsSPECULATORSCOMMERCIALSSMALL TRADERS
– Percent of Open Interest Longs:23.748.33.6
– Percent of Open Interest Shorts:5.667.82.1
– Net Position:55,023-59,4814,458
– Gross Longs:72,253147,56510,905
– Gross Shorts:17,230207,0466,447
– Long to Short Ratio:4.2 to 10.7 to 11.7 to 1
NET POSITION TREND:
– COT Index Score (3 Year Range Pct):90.710.319.2
– COT Index Reading (3 Year Range):Bullish-ExtremeBearish-ExtremeBearish-Extreme
NET POSITION MOVEMENT INDEX:
– 6-Week Change in Strength Index:-0.10.5-4.2


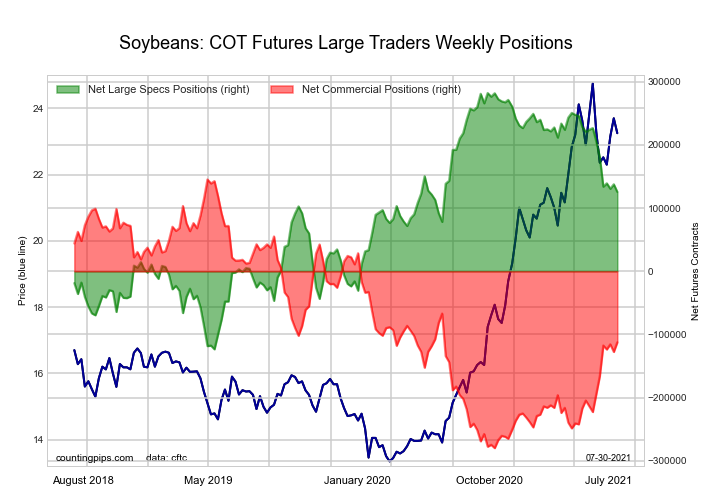
SOYBEANS Futures:

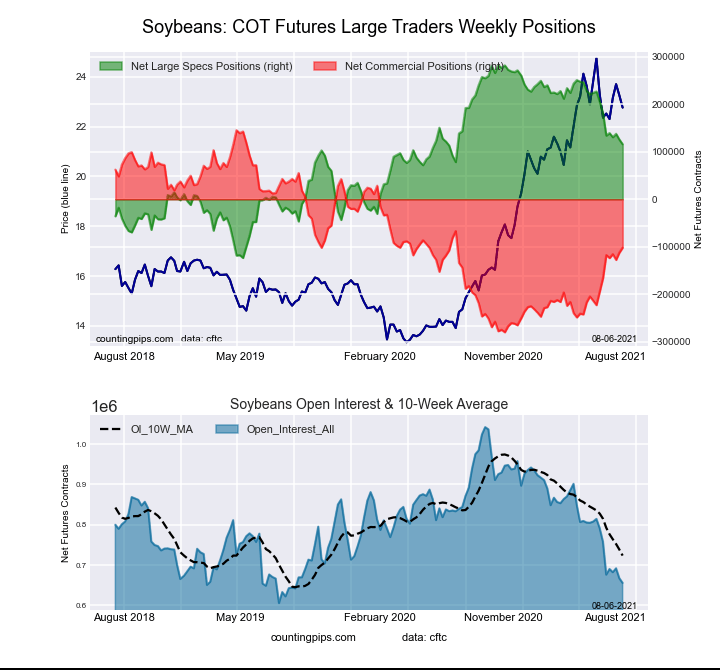
10-Year Treasury Notes Bonds Futures COT ChartThe SOYBEANS large speculator standing this week resulted in a net position of 115,803 contracts in the data reported through Tuesday. This was a weekly decline of -9,858 contracts from the previous week which had a total of 125,661 net contracts.

This week’s current strength score (the trader positioning range over the past three years, measured from 0 to 100) shows the speculators are currently Bullish with a score of 59.0 percent. The commercials are Bearish with a score of 41.9 percent and the small traders (not shown in chart) are Bearish with a score of 48.6 percent.

SOYBEANS Futures StatisticsSPECULATORSCOMMERCIALSSMALL TRADERS
– Percent of Open Interest Longs:27.849.67.2
– Percent of Open Interest Shorts:10.265.19.3
– Net Position:115,803-101,867-13,936
– Gross Longs:182,394325,05847,094
– Gross Shorts:66,591426,92561,030
– Long to Short Ratio:2.7 to 10.8 to 10.8 to 1
NET POSITION TREND:
– COT Index Score (3 Year Range Pct):59.041.948.6
– COT Index Reading (3 Year Range):BullishBearishBearish
NET POSITION MOVEMENT INDEX:
– 6-Week Change in Strength Index:-16.115.11.8


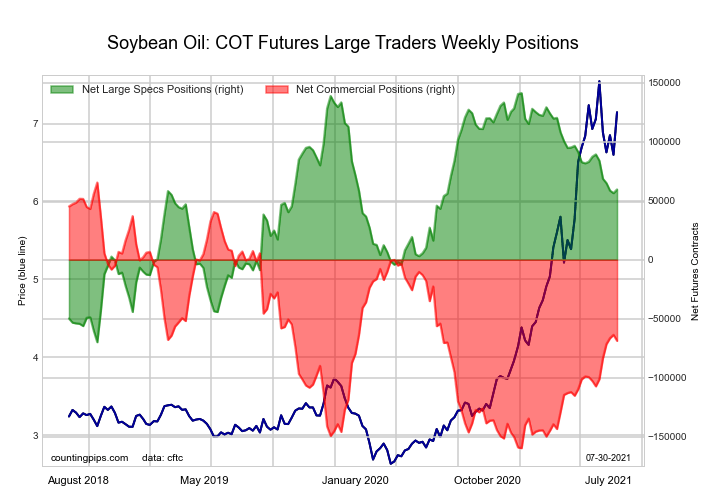
SOYBEAN OIL Futures:

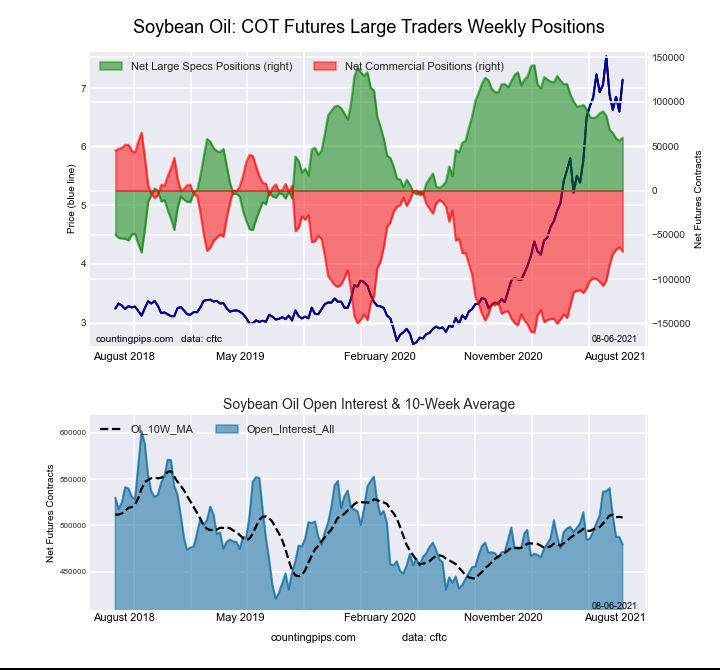
Ultra 10-Year Treasury Notes Bonds Futures COT ChartThe SOYBEAN OIL large speculator standing this week resulted in a net position of 59,517 contracts in the data reported through Tuesday. This was a weekly lift of 3,102 contracts from the previous week which had a total of 56,415 net contracts.

This week’s current strength score (the trader positioning range over the past three years, measured from 0 to 100) shows the speculators are currently Bullish with a score of 61.3 percent. The commercials are Bearish with a score of 40.4 percent and the small traders (not shown in chart) are Bearish with a score of 47.7 percent.

SOYBEAN OIL Futures StatisticsSPECULATORSCOMMERCIALSSMALL TRADERS
– Percent of Open Interest Longs:19.850.97.2
– Percent of Open Interest Shorts:7.465.25.3
– Net Position:59,517-68,6909,173
– Gross Longs:95,068243,98334,536
– Gross Shorts:35,551312,67325,363
– Long to Short Ratio:2.7 to 10.8 to 11.4 to 1
NET POSITION TREND:
– COT Index Score (3 Year Range Pct):61.340.447.7
– COT Index Reading (3 Year Range):BullishBearishBearish
NET POSITION MOVEMENT INDEX:
– 6-Week Change in Strength Index:-14.117.1-32.9


SOYBEAN MEAL Futures:

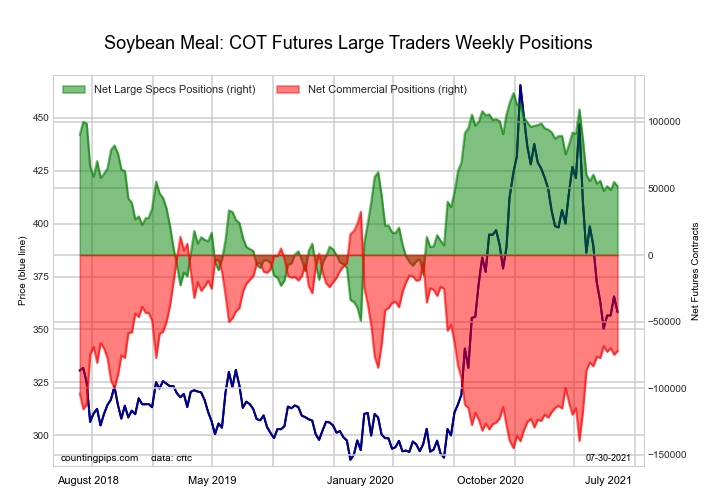
US Year Treasury Notes Long Bonds Futures COT ChartThe SOYBEAN MEAL large speculator standing this week resulted in a net position of 47,002 contracts in the data reported through Tuesday. This was a weekly lowering of -4,514 contracts from the previous week which had a total of 51,516 net contracts.

This week’s current strength score (the trader positioning range over the past three years, measured from 0 to 100) shows the speculators are currently Bullish with a score of 56.3 percent. The commercials are Bearish with a score of 44.8 percent and the small traders (not shown in chart) are Bearish with a score of 44.3 percent.

SOYBEAN MEAL Futures StatisticsSPECULATORSCOMMERCIALSSMALL TRADERS
– Percent of Open Interest Longs:23.453.112.0
– Percent of Open Interest Shorts:10.371.36.9
– Net Position:47,002-65,39318,391
– Gross Longs:84,111190,50043,132
– Gross Shorts:37,109255,89324,741
– Long to Short Ratio:2.3 to 10.7 to 11.7 to 1
NET POSITION TREND:
– COT Index Score (3 Year Range Pct):56.344.844.3
– COT Index Reading (3 Year Range):BullishBearishBearish
NET POSITION MOVEMENT INDEX:
– 6-Week Change in Strength Index:-5.16.7-12.1


LIVE CATTLE Futures:

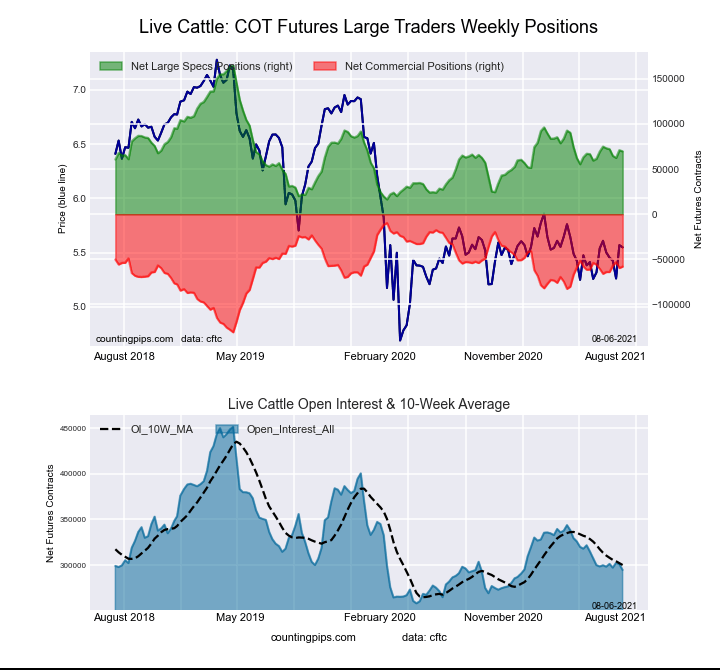
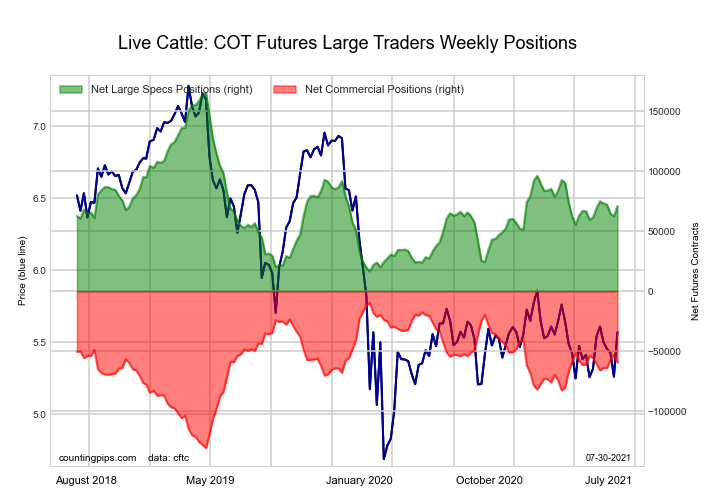
Ultra US Year Treasury Notes Long Bonds Futures COT ChartThe LIVE CATTLE large speculator standing this week resulted in a net position of 69,651 contracts in the data reported through Tuesday. This was a weekly decrease of -1,287 contracts from the previous week which had a total of 70,938 net contracts.

This week’s current strength score (the trader positioning range over the past three years, measured from 0 to 100) shows the speculators are currently Bearish with a score of 35.8 percent. The commercials are Bullish with a score of 60.1 percent and the small traders (not shown in chart) are Bullish with a score of 58.8 percent.

LIVE CATTLE Futures StatisticsSPECULATORSCOMMERCIALSSMALL TRADERS
– Percent of Open Interest Longs:37.340.39.5
– Percent of Open Interest Shorts:13.660.013.5
– Net Position:69,651-58,048-11,603
– Gross Longs:109,856118,70628,060
– Gross Shorts:40,205176,75439,663
– Long to Short Ratio:2.7 to 10.7 to 10.7 to 1
NET POSITION TREND:
– COT Index Score (3 Year Range Pct):35.860.158.8
– COT Index Reading (3 Year Range):BearishBullishBullish
NET POSITION MOVEMENT INDEX:
– 6-Week Change in Strength Index:-3.56.6-6.5


LEAN HOGS Futures:

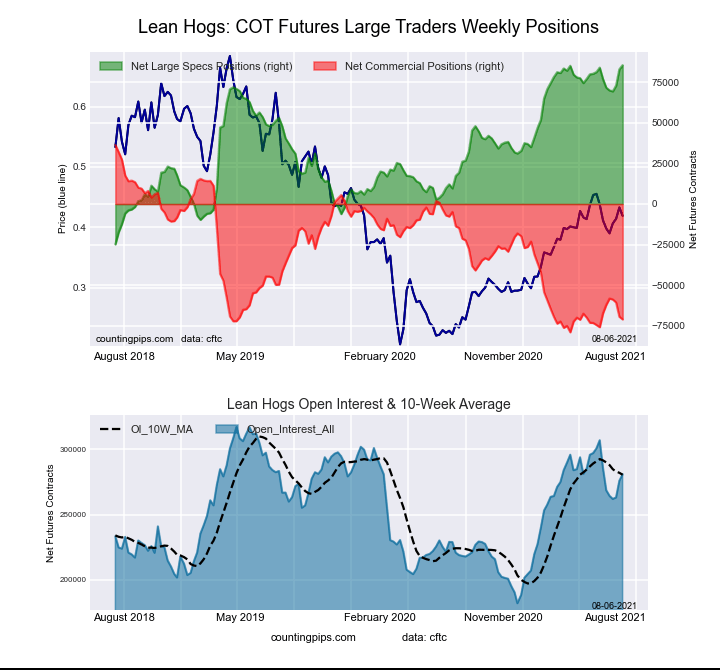
Eurodollar Bonds Futures COT ChartThe LEAN HOGS large speculator standing this week resulted in a net position of 85,592 contracts in the data reported through Tuesday. This was a weekly advance of 2,588 contracts from the previous week which had a total of 83,004 net contracts.

This week’s current strength score (the trader positioning range over the past three years, measured from 0 to 100) shows the speculators are currently Bullish-Extreme with a score of 100.0 percent. The commercials are Bearish-Extreme with a score of 6.9 percent and the small traders (not shown in chart) are Bearish-Extreme with a score of 9.3 percent.

LEAN HOGS Futures StatisticsSPECULATORSCOMMERCIALSSMALL TRADERS
– Percent of Open Interest Longs:45.229.17.6
– Percent of Open Interest Shorts:14.854.412.7
– Net Position:85,592-71,143-14,449
– Gross Longs:127,09381,83821,249
– Gross Shorts:41,501152,98135,698
– Long to Short Ratio:3.1 to 10.5 to 10.6 to 1
NET POSITION TREND:
– COT Index Score (3 Year Range Pct):100.06.99.3
– COT Index Reading (3 Year Range):Bullish-ExtremeBearish-ExtremeBearish-Extreme
NET POSITION MOVEMENT INDEX:
– 6-Week Change in Strength Index:7.8-3.3-22.9


COTTON Futures:

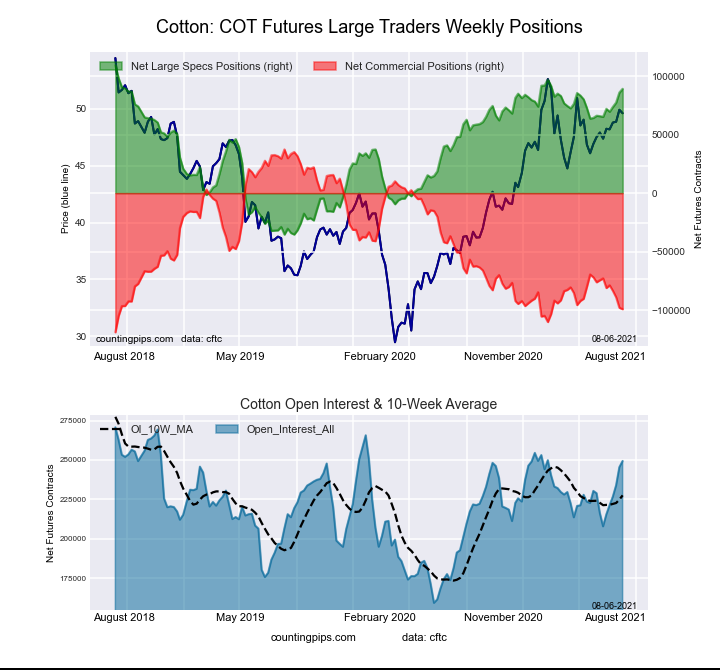
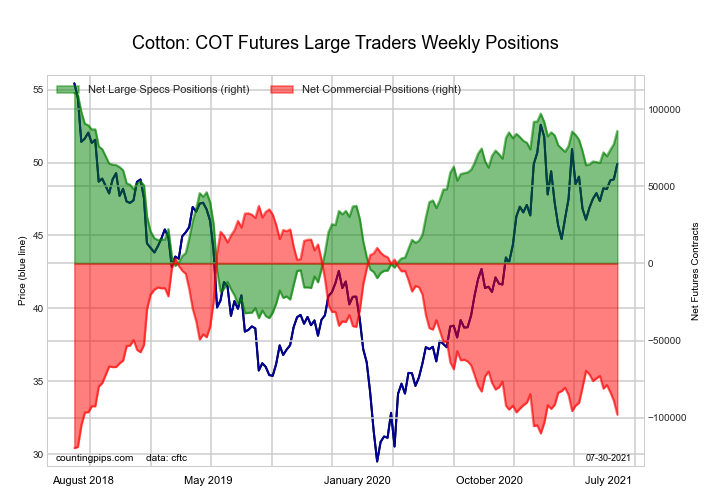
Ultra 10-Year Treasury Notes Bonds Futures COT ChartThe COTTON large speculator standing this week resulted in a net position of 89,043 contracts in the data reported through Tuesday. This was a weekly lift of 3,186 contracts from the previous week which had a total of 85,857 net contracts.

This week’s current strength score (the trader positioning range over the past three years, measured from 0 to 100) shows the speculators are currently Bullish-Extreme with a score of 93.3 percent. The commercials are Bearish-Extreme with a score of 7.4 percent and the small traders (not shown in chart) are Bullish with a score of 77.4 percent.

COTTON Futures StatisticsSPECULATORSCOMMERCIALSSMALL TRADERS
– Percent of Open Interest Longs:42.638.47.4
– Percent of Open Interest Shorts:6.978.23.3
– Net Position:89,043-99,09910,056
– Gross Longs:106,15095,74918,360
– Gross Shorts:17,107194,8488,304
– Long to Short Ratio:6.2 to 10.5 to 12.2 to 1
NET POSITION TREND:
– COT Index Score (3 Year Range Pct):93.37.477.4
– COT Index Reading (3 Year Range):Bullish-ExtremeBearish-ExtremeBullish
NET POSITION MOVEMENT INDEX:
– 6-Week Change in Strength Index:17.9-17.815.3


COCOA Futures:

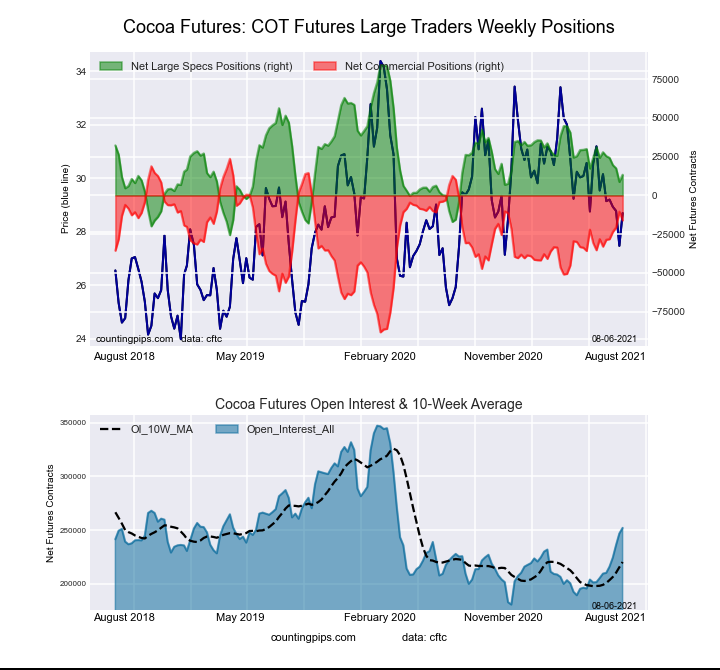
US Year Treasury Notes Long Bonds Futures COT ChartThe COCOA large speculator standing this week resulted in a net position of 13,326 contracts in the data reported through Tuesday. This was a weekly gain of 4,559 contracts from the previous week which had a total of 8,767 net contracts.

This week’s current strength score (the trader positioning range over the past three years, measured from 0 to 100) shows the speculators are currently Bearish with a score of 35.5 percent. The commercials are Bullish with a score of 64.5 percent and the small traders (not shown in chart) are Bearish with a score of 39.9 percent.

COCOA Futures StatisticsSPECULATORSCOMMERCIALSSMALL TRADERS
– Percent of Open Interest Longs:27.348.24.7
– Percent of Open Interest Shorts:22.054.63.6
– Net Position:13,326-16,0922,766
– Gross Longs:68,772121,39011,767
– Gross Shorts:55,446137,4829,001
– Long to Short Ratio:1.2 to 10.9 to 11.3 to 1
NET POSITION TREND:
– COT Index Score (3 Year Range Pct):35.564.539.9
– COT Index Reading (3 Year Range):BearishBullishBearish
NET POSITION MOVEMENT INDEX:
– 6-Week Change in Strength Index:-13.315.1-26.6


WHEAT Futures:

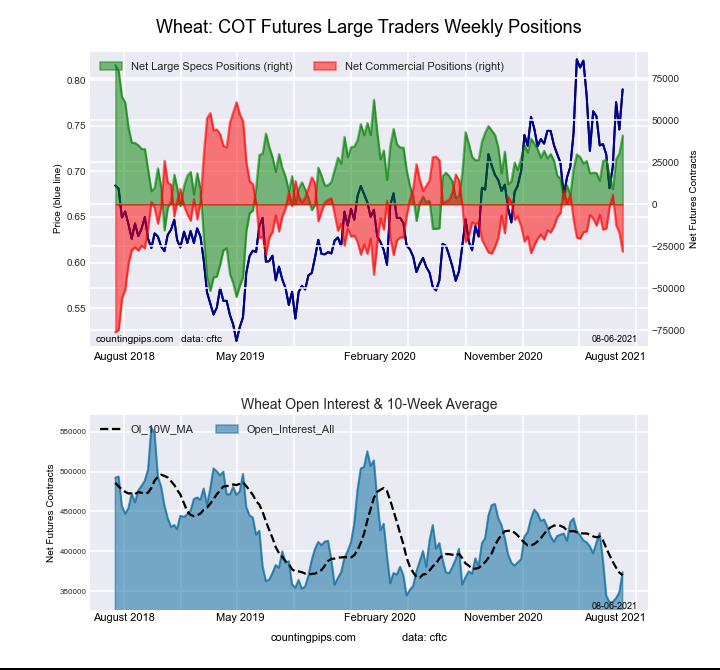
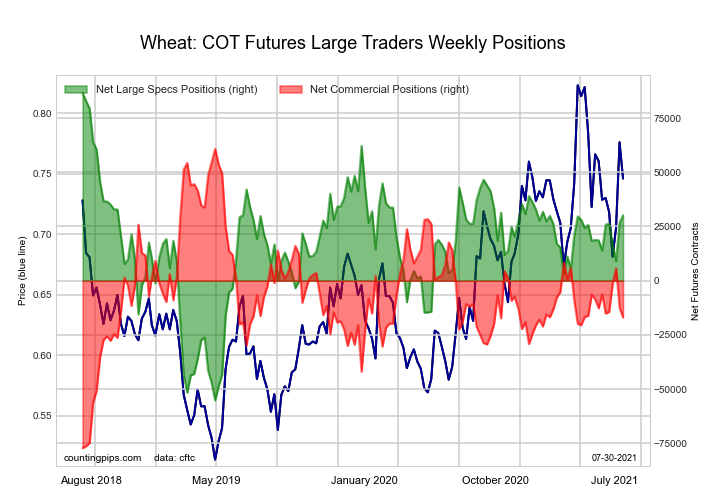
Ultra US Year Treasury Notes Long Bonds Futures COT ChartThe WHEAT large speculator standing this week resulted in a net position of 40,977 contracts in the data reported through Tuesday. This was a weekly advance of 10,789 contracts from the previous week which had a total of 30,188 net contracts.

This week’s current strength score (the trader positioning range over the past three years, measured from 0 to 100) shows the speculators are currently Bullish with a score of 69.7 percent. The commercials are Bearish with a score of 35.1 percent and the small traders (not shown in chart) are Bearish with a score of 40.6 percent.

WHEAT Futures StatisticsSPECULATORSCOMMERCIALSSMALL TRADERS
– Percent of Open Interest Longs:32.036.27.8
– Percent of Open Interest Shorts:21.043.711.2
– Net Position:40,977-28,203-12,774
– Gross Longs:119,516135,13929,028
– Gross Shorts:78,539163,34241,802
– Long to Short Ratio:1.5 to 10.8 to 10.7 to 1
NET POSITION TREND:
– COT Index Score (3 Year Range Pct):69.735.140.6
– COT Index Reading (3 Year Range):BullishBearishBearish
NET POSITION MOVEMENT INDEX:
– 6-Week Change in Strength Index:11.0-9.6-9.9


Article By CountingPips.comReceive our weekly COT Reports by Email

*COT Report: The COT data, released weekly to the public each Friday, is updated through the most recent Tuesday (data is 3 days old) and shows a quick view of how large speculators or non-commercials (for-profit traders) were positioned in the futures markets.

The CFTC categorizes trader positions according to commercial hedgers (traders who use futures contracts for hedging as part of the business), non-commercials (large traders who speculate to realize trading profits) and nonreportable traders (usually small traders/speculators).

Find CFTC criteria here: (http://www.cftc.gov/MarketReports/CommitmentsofTraders/ExplanatoryNotes/index.htm).
COT Currency Charts: US Dollar, Euro, Yen, Pound, Swiss Franc, Kiwi, Aussie & Bitcoin

By CountingPips.com COT Home | Data Tables | Data Downloads | Newsletter

Here are the latest charts and statistics for the Commitment of Traders (COT) data published by the Commodities Futures Trading Commission (CFTC).

The latest COT data is updated through Tuesday July 27 2021 and shows a quick view of how large traders (for-profit speculators and commercial entities) were positioned in the futures markets. All currency positions are in direct relation to the US dollar where, for example, a bet for the euro is a bet that the euro will rise versus the dollar while a bet against the euro will be a bet that the euro will decline versus the dollar.


US Dollar Index Futures:

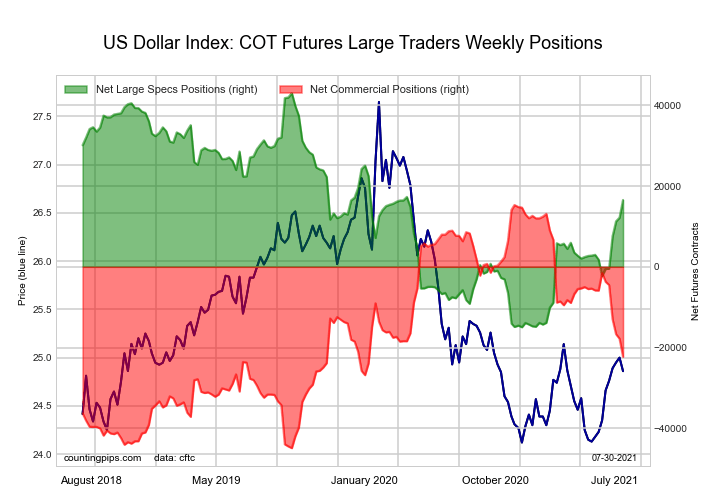
Federal Funds 30-Day Bonds Futures COT ChartThe US Dollar Index large speculator standing this week reached a net position of 16,541 contracts in the data reported through Tuesday. This was a weekly lift of 4,353 contracts from the previous week which had a total of 12,188 net contracts.

This week’s current strength score (the trader positioning range over the past three years, measured from 0 to 100) shows the speculators are currently Bullish with a score of 54.3 percent. The commercials are Bearish with a score of 37.6 percent and the small traders (not shown in chart) are Bullish-Extreme with a score of 94.1 percent.

US DOLLAR INDEX StatisticsSPECULATORSCOMMERCIALSSMALL TRADERS
– Percent of Open Interest Longs:73.83.118.2
– Percent of Open Interest Shorts:35.354.85.0
– Net Position:16,541-22,2545,713
– Gross Longs:31,7581,3377,857
– Gross Shorts:15,21723,5912,144
– Long to Short Ratio:2.1 to 10.1 to 13.7 to 1
NET POSITION TREND:
– COT Index Score (3 Year Range Pct):54.337.694.1
– COT Index Reading (3 Year Range):BullishBearishBullish-Extreme
NET POSITION MOVEMENT INDEX:
– 6-Week Change in Strength Index:32.5-34.524.9


Euro Currency Futures:

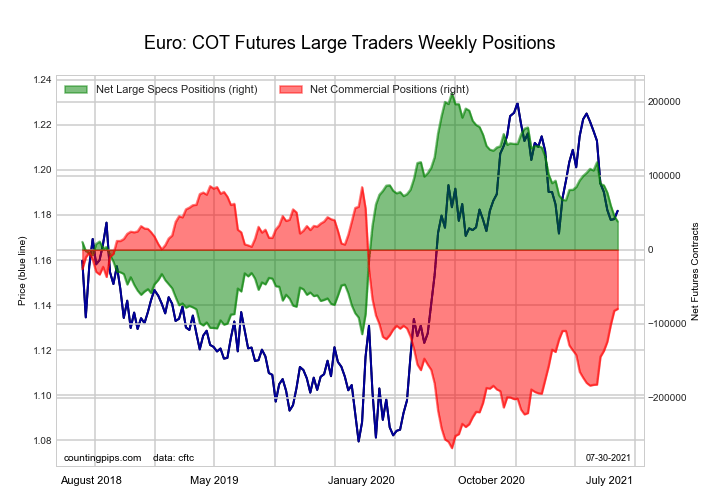
2-Year Treasury Bonds Futures COT ChartThe Euro Currency large speculator standing this week reached a net position of 38,126 contracts in the data reported through Tuesday. This was a weekly decline of -7,696 contracts from the previous week which had a total of 45,822 net contracts.

This week’s current strength score (the trader positioning range over the past three years, measured from 0 to 100) shows the speculators are currently Bearish with a score of 46.7 percent. The commercials are Bullish with a score of 53.2 percent and the small traders (not shown in chart) are Bearish with a score of 49.2 percent.

EURO Currency StatisticsSPECULATORSCOMMERCIALSSMALL TRADERS
– Percent of Open Interest Longs:29.855.213.6
– Percent of Open Interest Shorts:24.266.97.5
– Net Position:38,126-79,84941,723
– Gross Longs:202,245373,95392,486
– Gross Shorts:164,119453,80250,763
– Long to Short Ratio:1.2 to 10.8 to 11.8 to 1
NET POSITION TREND:
– COT Index Score (3 Year Range Pct):46.753.249.2
– COT Index Reading (3 Year Range):BearishBullishBearish
NET POSITION MOVEMENT INDEX:
– 6-Week Change in Strength Index:-24.628.9-33.0


British Pound Sterling Futures:

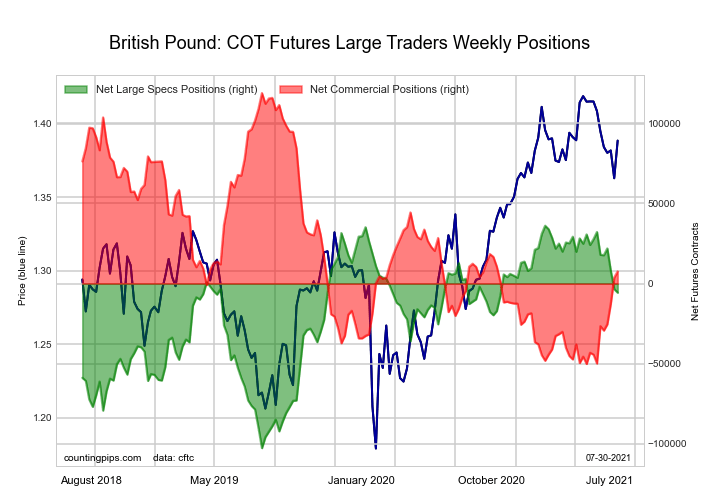
5-Year Treasury Bonds Futures COT ChartThe British Pound Sterling large speculator standing this week reached a net position of -5,684 contracts in the data reported through Tuesday. This was a weekly reduction of -2,187 contracts from the previous week which had a total of -3,497 net contracts.

This week’s current strength score (the trader positioning range over the past three years, measured from 0 to 100) shows the speculators are currently Bullish with a score of 69.9 percent. The commercials are Bearish with a score of 34.2 percent and the small traders (not shown in chart) are Bullish with a score of 51.6 percent.

BRITISH POUND StatisticsSPECULATORSCOMMERCIALSSMALL TRADERS
– Percent of Open Interest Longs:22.262.514.5
– Percent of Open Interest Shorts:25.358.415.6
– Net Position:-5,6847,628-1,944
– Gross Longs:41,194115,83126,962
– Gross Shorts:46,878108,20328,906
– Long to Short Ratio:0.9 to 11.1 to 10.9 to 1
NET POSITION TREND:
– COT Index Score (3 Year Range Pct):69.934.251.6
– COT Index Reading (3 Year Range):BullishBearishBullish
NET POSITION MOVEMENT INDEX:
– 6-Week Change in Strength Index:-27.334.0-40.7


Japanese Yen Futures:

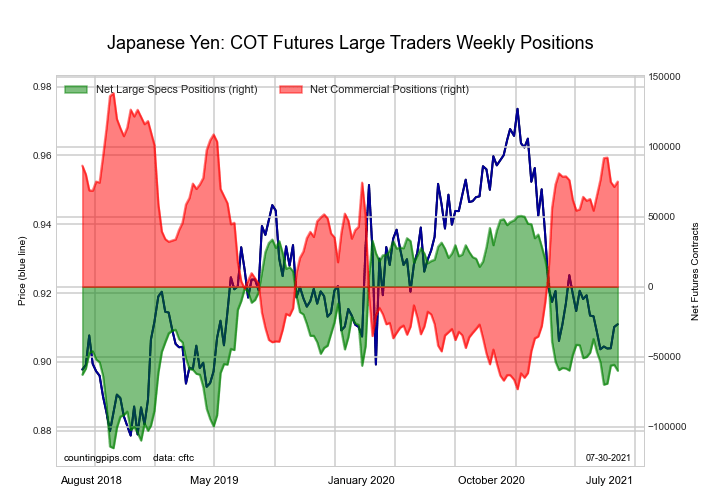
10-Year Treasury Notes Bonds Futures COT ChartThe Japanese Yen large speculator standing this week reached a net position of -59,934 contracts in the data reported through Tuesday. This was a weekly decline of -4,203 contracts from the previous week which had a total of -55,731 net contracts.

This week’s current strength score (the trader positioning range over the past three years, measured from 0 to 100) shows the speculators are currently Bearish with a score of 33.3 percent. The commercials are Bullish with a score of 70.1 percent and the small traders (not shown in chart) are Bearish with a score of 27.4 percent.

JAPANESE YEN StatisticsSPECULATORSCOMMERCIALSSMALL TRADERS
– Percent of Open Interest Longs:16.873.39.5
– Percent of Open Interest Shorts:47.435.117.2
– Net Position:-59,93475,014-15,080
– Gross Longs:32,975143,81918,589
– Gross Shorts:92,90968,80533,669
– Long to Short Ratio:0.4 to 12.1 to 10.6 to 1
NET POSITION TREND:
– COT Index Score (3 Year Range Pct):33.370.127.4
– COT Index Reading (3 Year Range):BearishBullishBearish
NET POSITION MOVEMENT INDEX:
– 6-Week Change in Strength Index:-7.94.66.5


Swiss Franc Futures:

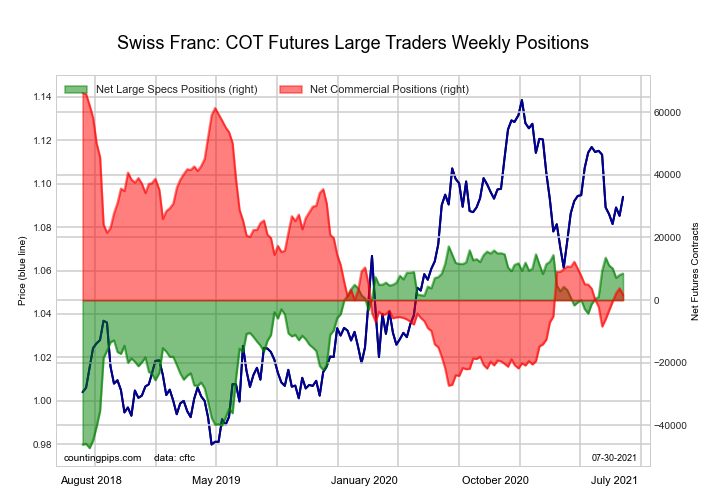
Ultra 10-Year Treasury Notes Bonds Futures COT ChartThe Swiss Franc large speculator standing this week reached a net position of 8,489 contracts in the data reported through Tuesday. This was a weekly advance of 447 contracts from the previous week which had a total of 8,042 net contracts.

This week’s current strength score (the trader positioning range over the past three years, measured from 0 to 100) shows the speculators are currently Bullish-Extreme with a score of 86.5 percent. The commercials are Bearish with a score of 31.0 percent and the small traders (not shown in chart) are Bearish with a score of 33.5 percent.

SWISS FRANC StatisticsSPECULATORSCOMMERCIALSSMALL TRADERS
– Percent of Open Interest Longs:40.839.319.7
– Percent of Open Interest Shorts:21.835.642.4
– Net Position:8,4891,657-10,146
– Gross Longs:18,26217,6028,827
– Gross Shorts:9,77315,94518,973
– Long to Short Ratio:1.9 to 11.1 to 10.5 to 1
NET POSITION TREND:
– COT Index Score (3 Year Range Pct):86.531.033.5
– COT Index Reading (3 Year Range):Bullish-ExtremeBearishBearish
NET POSITION MOVEMENT INDEX:
– 6-Week Change in Strength Index:-1.410.8-26.8


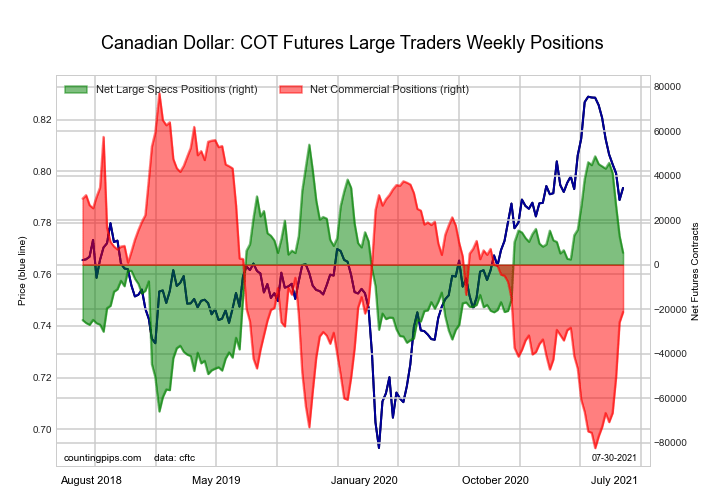
Canadian Dollar Futures:

US Year Treasury Notes Long Bonds Futures COT ChartThe Canadian Dollar large speculator standing this week reached a net position of 5,374 contracts in the data reported through Tuesday. This was a weekly decrease of -7,541 contracts from the previous week which had a total of 12,915 net contracts.

This week’s current strength score (the trader positioning range over the past three years, measured from 0 to 100) shows the speculators are currently Bullish with a score of 59.5 percent. The commercials are Bearish with a score of 38.3 percent and the small traders (not shown in chart) are Bullish with a score of 70.7 percent.

CANADIAN DOLLAR StatisticsSPECULATORSCOMMERCIALSSMALL TRADERS
– Percent of Open Interest Longs:26.950.821.2
– Percent of Open Interest Shorts:23.963.012.1
– Net Position:5,374-21,24215,868
– Gross Longs:47,04888,80836,955
– Gross Shorts:41,674110,05021,087
– Long to Short Ratio:1.1 to 10.8 to 11.8 to 1
NET POSITION TREND:
– COT Index Score (3 Year Range Pct):59.538.370.7
– COT Index Reading (3 Year Range):BullishBearishBullish
NET POSITION MOVEMENT INDEX:
– 6-Week Change in Strength Index:-32.432.4-19.3


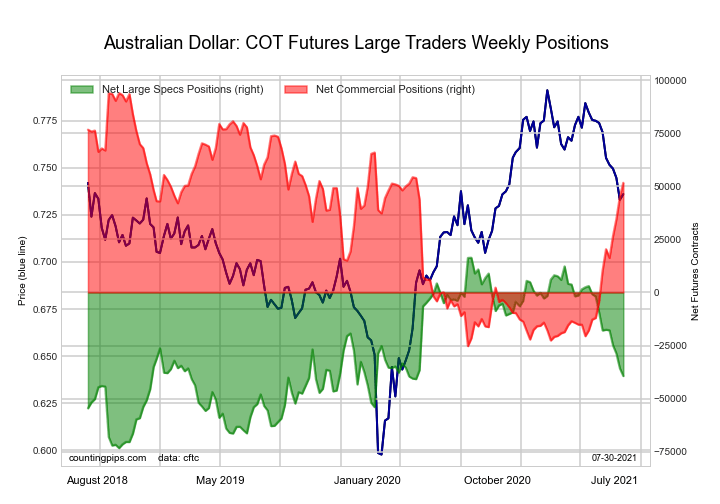
Australian Dollar Futures:

Ultra US Year Treasury Notes Long Bonds Futures COT ChartThe Australian Dollar large speculator standing this week reached a net position of -39,347 contracts in the data reported through Tuesday. This was a weekly decrease of -3,657 contracts from the previous week which had a total of -35,690 net contracts.

This week’s current strength score (the trader positioning range over the past three years, measured from 0 to 100) shows the speculators are currently Bearish with a score of 37.9 percent. The commercials are Bullish with a score of 64.5 percent and the small traders (not shown in chart) are Bearish with a score of 30.2 percent.

AUSTRALIAN DOLLAR StatisticsSPECULATORSCOMMERCIALSSMALL TRADERS
– Percent of Open Interest Longs:34.253.410.6
– Percent of Open Interest Shorts:57.722.717.9
– Net Position:-39,34751,603-12,256
– Gross Longs:57,41589,67517,836
– Gross Shorts:96,76238,07230,092
– Long to Short Ratio:0.6 to 12.4 to 10.6 to 1
NET POSITION TREND:
– COT Index Score (3 Year Range Pct):37.964.530.2
– COT Index Reading (3 Year Range):BearishBullishBearish
NET POSITION MOVEMENT INDEX:
– 6-Week Change in Strength Index:-24.034.6-43.5


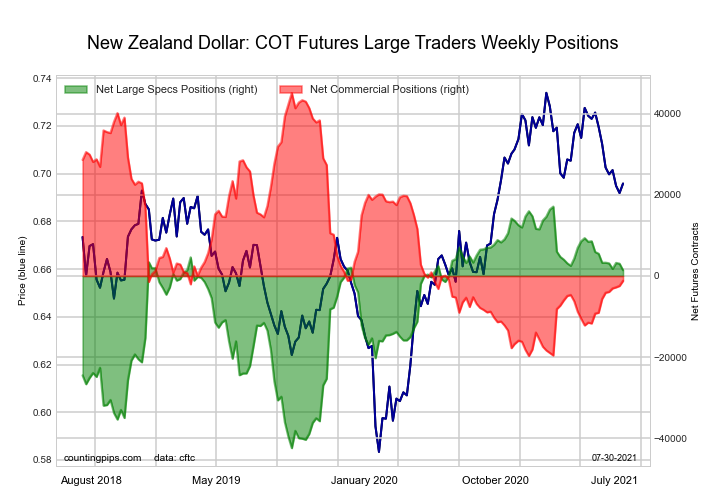
New Zealand Dollar Futures:

Eurodollar Bonds Futures COT ChartThe New Zealand Dollar large speculator standing this week reached a net position of 1,421 contracts in the data reported through Tuesday. This was a weekly decline of -1,625 contracts from the previous week which had a total of 3,046 net contracts.

This week’s current strength score (the trader positioning range over the past three years, measured from 0 to 100) shows the speculators are currently Bullish with a score of 73.6 percent. The commercials are Bearish with a score of 28.6 percent and the small traders (not shown in chart) are Bullish with a score of 50.9 percent.

NEW ZEALAND DOLLAR StatisticsSPECULATORSCOMMERCIALSSMALL TRADERS
– Percent of Open Interest Longs:44.445.99.0
– Percent of Open Interest Shorts:41.148.69.5
– Net Position:1,421-1,191-230
– Gross Longs:19,50520,1823,935
– Gross Shorts:18,08421,3734,165
– Long to Short Ratio:1.1 to 10.9 to 10.9 to 1
NET POSITION TREND:
– COT Index Score (3 Year Range Pct):73.628.650.9
– COT Index Reading (3 Year Range):BullishBearishBullish
NET POSITION MOVEMENT INDEX:
– 6-Week Change in Strength Index:-3.16.9-29.0


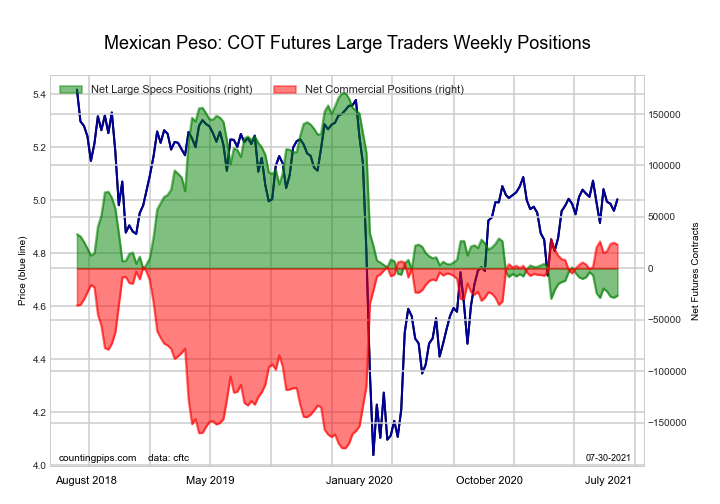
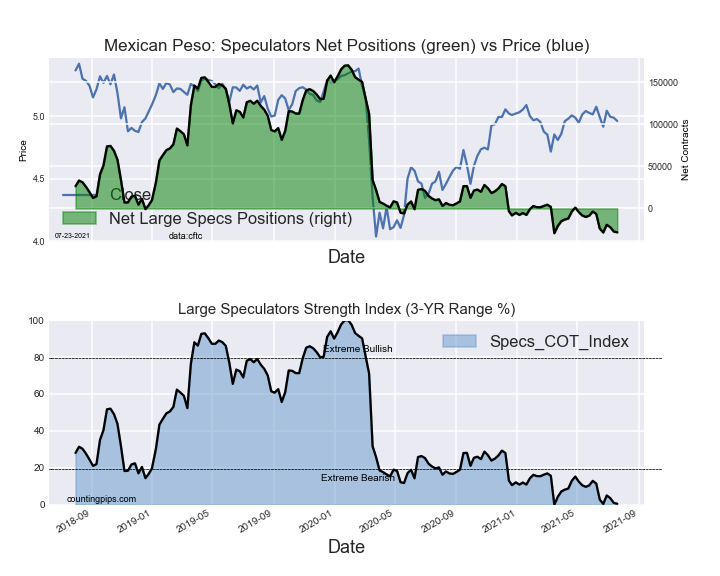
Mexican Peso Futures:

Ultra 10-Year Treasury Notes Bonds Futures COT ChartThe Mexican Peso large speculator standing this week reached a net position of -26,407 contracts in the data reported through Tuesday. This was a weekly rise of 2,014 contracts from the previous week which had a total of -28,421 net contracts.

This week’s current strength score (the trader positioning range over the past three years, measured from 0 to 100) shows the speculators are currently Bearish-Extreme with a score of 1.5 percent. The commercials are Bullish-Extreme with a score of 97.6 percent and the small traders (not shown in chart) are Bullish with a score of 57.0 percent.

MEXICAN PESO StatisticsSPECULATORSCOMMERCIALSSMALL TRADERS
– Percent of Open Interest Longs:43.550.34.4
– Percent of Open Interest Shorts:61.134.92.2
– Net Position:-26,40723,1193,288
– Gross Longs:65,40475,5886,559
– Gross Shorts:91,81152,4693,271
– Long to Short Ratio:0.7 to 11.4 to 12.0 to 1
NET POSITION TREND:
– COT Index Score (3 Year Range Pct):1.597.657.0
– COT Index Reading (3 Year Range):Bearish-ExtremeBullish-ExtremeBullish
NET POSITION MOVEMENT INDEX:
– 6-Week Change in Strength Index:-1.21.3-1.0


Brazilian Real Futures:

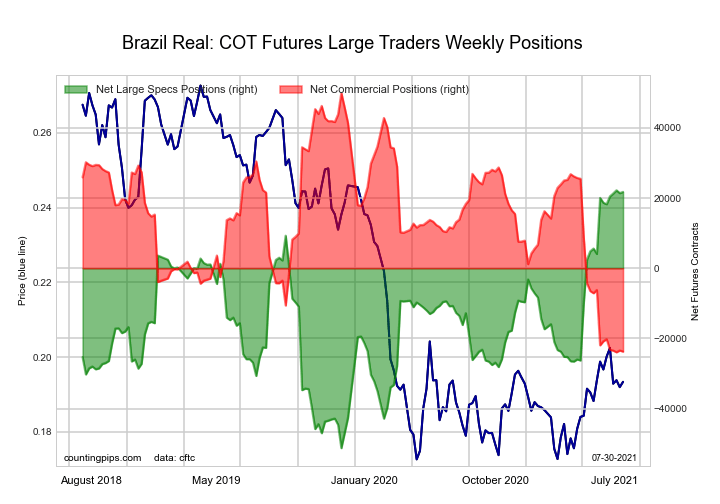
US Year Treasury Notes Long Bonds Futures COT ChartThe Brazilian Real large speculator standing this week reached a net position of 21,761 contracts in the data reported through Tuesday. This was a weekly boost of 348 contracts from the previous week which had a total of 21,413 net contracts.

This week’s current strength score (the trader positioning range over the past three years, measured from 0 to 100) shows the speculators are currently Bullish-Extreme with a score of 99.4 percent. The commercials are Bearish-Extreme with a score of 0.3 percent and the small traders (not shown in chart) are Bullish-Extreme with a score of 91.0 percent.

BRAZIL REAL StatisticsSPECULATORSCOMMERCIALSSMALL TRADERS
– Percent of Open Interest Longs:67.023.08.4
– Percent of Open Interest Shorts:17.077.73.8
– Net Position:21,761-23,7612,000
– Gross Longs:29,13210,0073,651
– Gross Shorts:7,37133,7681,651
– Long to Short Ratio:4.0 to 10.3 to 12.2 to 1
NET POSITION TREND:
– COT Index Score (3 Year Range Pct):99.40.391.0
– COT Index Reading (3 Year Range):Bullish-ExtremeBearish-ExtremeBullish-Extreme
NET POSITION MOVEMENT INDEX:
– 6-Week Change in Strength Index:4.2-4.0-1.8


Russian Ruble Futures:

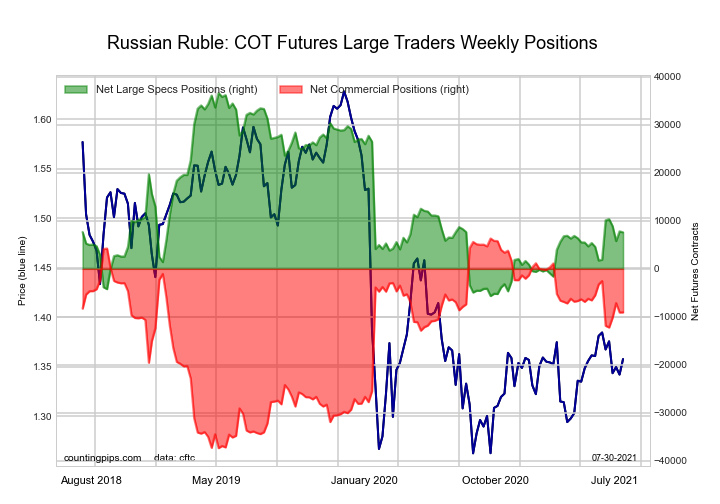
Ultra US Year Treasury Notes Long Bonds Futures COT ChartThe Russian Ruble large speculator standing this week reached a net position of 7,593 contracts in the data reported through Tuesday. This was a weekly lowering of -208 contracts from the previous week which had a total of 7,801 net contracts.

This week’s current strength score (the trader positioning range over the past three years, measured from 0 to 100) shows the speculators are currently Bearish with a score of 31.4 percent. The commercials are Bullish with a score of 64.8 percent and the small traders (not shown in chart) are Bullish-Extreme with a score of 87.2 percent.

RUSSIAN RUBLE StatisticsSPECULATORSCOMMERCIALSSMALL TRADERS
– Percent of Open Interest Longs:37.657.35.1
– Percent of Open Interest Shorts:22.974.82.3
– Net Position:7,593-9,0591,466
– Gross Longs:19,46229,6342,653
– Gross Shorts:11,86938,6931,187
– Long to Short Ratio:1.6 to 10.8 to 12.2 to 1
NET POSITION TREND:
– COT Index Score (3 Year Range Pct):31.464.887.2
– COT Index Reading (3 Year Range):BearishBullishBullish-Extreme
NET POSITION MOVEMENT INDEX:
– 6-Week Change in Strength Index:13.5-14.926.4


Bitcoin Futures:

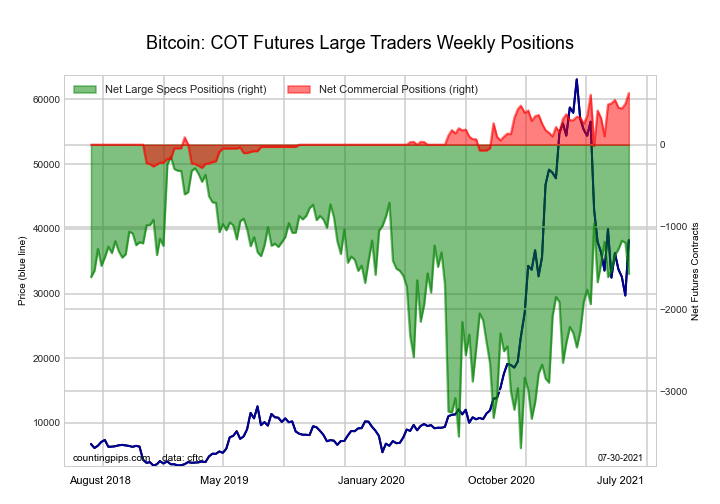
Eurodollar Bonds Futures COT ChartThe Bitcoin large speculator standing this week reached a net position of -1,572 contracts in the data reported through Tuesday. This was a weekly decline of -380 contracts from the previous week which had a total of -1,192 net contracts.

This week’s current strength score (the trader positioning range over the past three years, measured from 0 to 100) shows the speculators are currently Bullish with a score of 59.7 percent. The commercials are Bullish-Extreme with a score of 100.0 percent and the small traders (not shown in chart) are Bearish with a score of 20.7 percent.

BITCOIN StatisticsSPECULATORSCOMMERCIALSSMALL TRADERS
– Percent of Open Interest Longs:48.09.421.7
– Percent of Open Interest Shorts:68.11.39.6
– Net Position:-1,572628944
– Gross Longs:3,7437301,692
– Gross Shorts:5,315102748
– Long to Short Ratio:0.7 to 17.2 to 12.3 to 1
NET POSITION TREND:
– COT Index Score (3 Year Range Pct):59.7100.020.7
– COT Index Reading (3 Year Range):BullishBullish-ExtremeBearish
NET POSITION MOVEMENT INDEX:
– 6-Week Change in Strength Index:1.015.3-5.8


Article By CountingPips.comReceive our weekly COT Reports by Email

*COT Report: The COT data, released weekly to the public each Friday, is updated through the most recent Tuesday (data is 3 days old) and shows a quick view of how large speculators or non-commercials (for-profit traders) were positioned in the futures markets.

The CFTC categorizes trader positions according to commercial hedgers (traders who use futures contracts for hedging as part of the business), non-commercials (large traders who speculate to realize trading profits) and nonreportable traders (usually small traders/speculators).

Find CFTC criteria here: (http://www.cftc.gov/MarketReports/CommitmentsofTraders/ExplanatoryNotes/index.htm).
COT Bonds Charts: Fed Funds, 10-Year, 2-Year, 5-Year Treasuries & Eurodollars

By CountingPips.com COT Home | Data Tables | Data Downloads | Newsletter

Here are the latest charts and statistics for the Commitment of Traders (COT) data published by the Commodities Futures Trading Commission (CFTC).

The latest COT data is updated through Tuesday July 27 2021 and shows a quick view of how large traders (for-profit speculators and commercial entities) were positioned in the futures markets.


3-Month Eurodollars Futures:

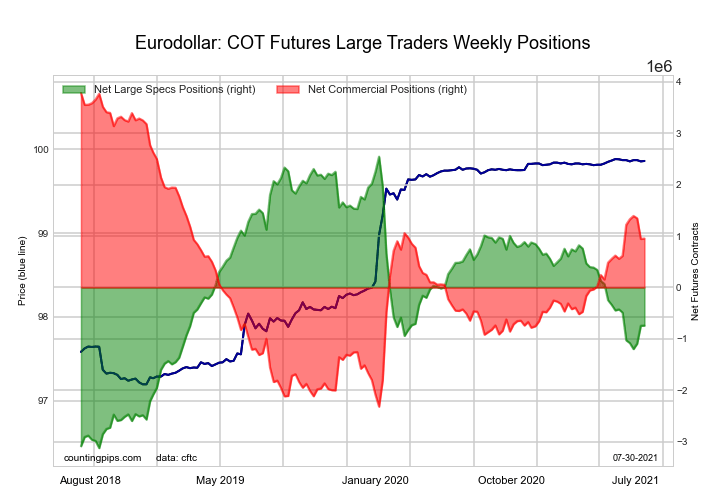
Eurodollar Bonds Futures COT ChartThe 3-Month Eurodollars large speculator standing this week was a net position of -740,875 contracts in the data reported through Tuesday. This was a weekly boost of 4,060 contracts from the previous week which had a total of -744,935 net contracts.

This week’s current strength score (the trader positioning range over the past three years, measured from 0 to 100) shows the speculators are currently Bearish with a score of 42.0 percent. The commercials are Bullish with a score of 53.6 percent and the small traders (not shown in chart) are Bullish with a score of 75.4 percent.

3-Month Eurodollars StatisticsSPECULATORSCOMMERCIALSSMALL TRADERS
– Percent of Open Interest Longs:15.559.15.0
– Percent of Open Interest Shorts:21.751.16.8
– Net Position:-740,875951,440-210,565
– Gross Longs:1,867,2317,095,708604,249
– Gross Shorts:2,608,1066,144,268814,814
– Long to Short Ratio:0.7 to 11.2 to 10.7 to 1
NET POSITION TREND:
– COT Index Score (3 Year Range Pct):42.053.675.4
– COT Index Reading (3 Year Range):BearishBullishBullish
NET POSITION MOVEMENT INDEX:
– 6-Week Change in Strength Index:-4.55.5-10.7


30-Day Federal Funds Futures:

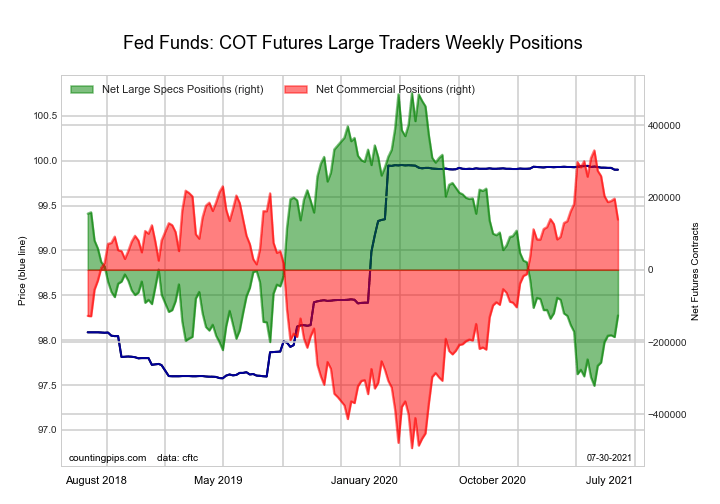
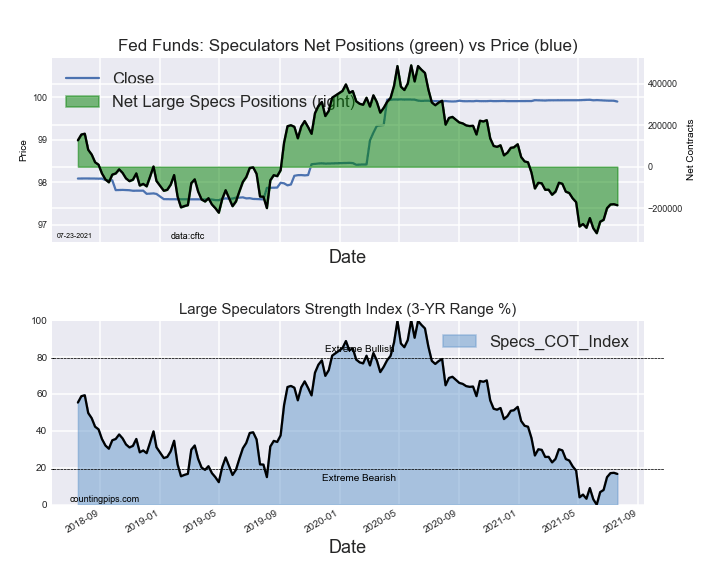
Federal Funds 30-Day Bonds Futures COT ChartThe 30-Day Federal Funds large speculator standing this week was a net position of -126,555 contracts in the data reported through Tuesday. This was a weekly increase of 59,379 contracts from the previous week which had a total of -185,934 net contracts.

This week’s current strength score (the trader positioning range over the past three years, measured from 0 to 100) shows the speculators are currently Bearish with a score of 24.0 percent. The commercials are Bullish with a score of 76.7 percent and the small traders (not shown in chart) are Bearish with a score of 48.8 percent.

30-Day Federal Funds StatisticsSPECULATORSCOMMERCIALSSMALL TRADERS
– Percent of Open Interest Longs:5.475.72.1
– Percent of Open Interest Shorts:17.162.93.2
– Net Position:-126,555138,816-12,261
– Gross Longs:58,687822,09122,595
– Gross Shorts:185,242683,27534,856
– Long to Short Ratio:0.3 to 11.2 to 10.6 to 1
NET POSITION TREND:
– COT Index Score (3 Year Range Pct):24.076.748.8
– COT Index Reading (3 Year Range):BearishBullishBearish
NET POSITION MOVEMENT INDEX:
– 6-Week Change in Strength Index:17.2-16.4-6.8


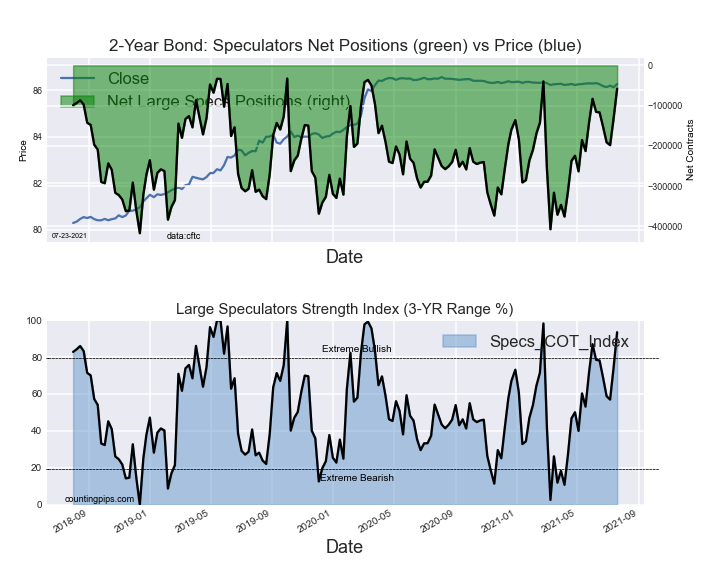
2-Year Treasury Note Futures:

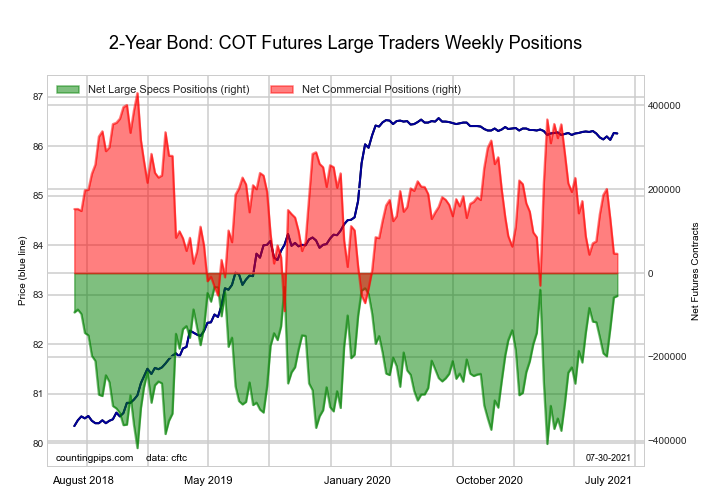
2-Year Treasury Bonds Futures COT ChartThe 2-Year Treasury Note large speculator standing this week was a net position of -54,331 contracts in the data reported through Tuesday. This was a weekly increase of 3,752 contracts from the previous week which had a total of -58,083 net contracts.

This week’s current strength score (the trader positioning range over the past three years, measured from 0 to 100) shows the speculators are currently Bullish-Extreme with a score of 94.4 percent. The commercials are Bearish with a score of 26.3 percent and the small traders (not shown in chart) are Bearish with a score of 39.2 percent.

2-Year Treasury Note StatisticsSPECULATORSCOMMERCIALSSMALL TRADERS
– Percent of Open Interest Longs:18.971.67.1
– Percent of Open Interest Shorts:21.769.36.7
– Net Position:-54,33146,0568,275
– Gross Longs:373,4711,414,480141,166
– Gross Shorts:427,8021,368,424132,891
– Long to Short Ratio:0.9 to 11.0 to 11.1 to 1
NET POSITION TREND:
– COT Index Score (3 Year Range Pct):94.426.339.2
– COT Index Reading (3 Year Range):Bullish-ExtremeBearishBearish
NET POSITION MOVEMENT INDEX:
– 6-Week Change in Strength Index:16.3-5.7-17.4


5-Year Treasury Note Futures:

5-Year Treasury Bonds Futures COT ChartThe 5-Year Treasury Note large speculator standing this week was a net position of -30,025 contracts in the data reported through Tuesday. This was a weekly gain of 39,009 contracts from the previous week which had a total of -69,034 net contracts.

This week’s current strength score (the trader positioning range over the past three years, measured from 0 to 100) shows the speculators are currently Bullish-Extreme with a score of 87.0 percent. The commercials are Bearish with a score of 24.7 percent and the small traders (not shown in chart) are Bearish-Extreme with a score of 12.7 percent.

5-Year Treasury Note StatisticsSPECULATORSCOMMERCIALSSMALL TRADERS
– Percent of Open Interest Longs:14.375.78.4
– Percent of Open Interest Shorts:15.170.812.4
– Net Position:-30,025168,613-138,588
– Gross Longs:496,0742,633,496293,649
– Gross Shorts:526,0992,464,883432,237
– Long to Short Ratio:0.9 to 11.1 to 10.7 to 1
NET POSITION TREND:
– COT Index Score (3 Year Range Pct):87.024.712.7
– COT Index Reading (3 Year Range):Bullish-ExtremeBearishBearish-Extreme
NET POSITION MOVEMENT INDEX:
– 6-Week Change in Strength Index:8.4-1.2-28.0


10-Year Treasury Note Futures:

10-Year Treasury Notes Bonds Futures COT ChartThe 10-Year Treasury Note large speculator standing this week was a net position of 164,491 contracts in the data reported through Tuesday. This was a weekly boost of 75,565 contracts from the previous week which had a total of 88,926 net contracts.

This week’s current strength score (the trader positioning range over the past three years, measured from 0 to 100) shows the speculators are currently Bullish-Extreme with a score of 99.0 percent. The commercials are Bearish with a score of 21.3 percent and the small traders (not shown in chart) are Bearish with a score of 21.0 percent.

10-Year Treasury Note StatisticsSPECULATORSCOMMERCIALSSMALL TRADERS
– Percent of Open Interest Longs:22.366.69.0
– Percent of Open Interest Shorts:18.265.714.0
– Net Position:164,49136,905-201,396
– Gross Longs:906,3682,710,030367,441
– Gross Shorts:741,8772,673,125568,837
– Long to Short Ratio:1.2 to 11.0 to 10.6 to 1
NET POSITION TREND:
– COT Index Score (3 Year Range Pct):99.021.321.0
– COT Index Reading (3 Year Range):Bullish-ExtremeBearishBearish
NET POSITION MOVEMENT INDEX:
– 6-Week Change in Strength Index:14.0-16.711.6


Ultra 10-Year Notes Futures:

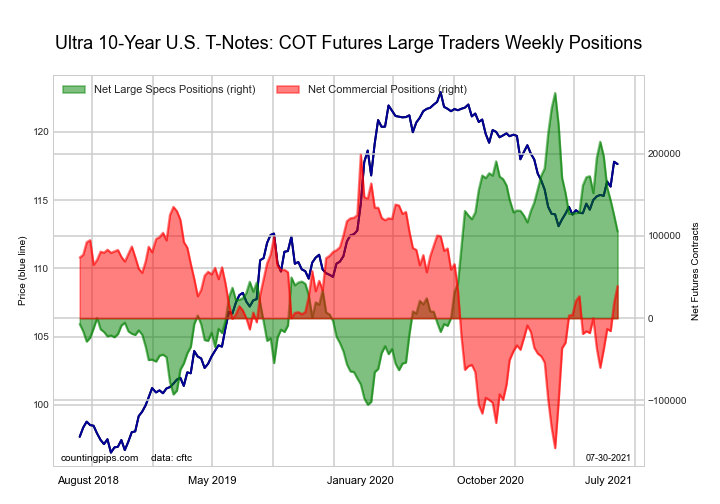
Ultra 10-Year Treasury Notes Bonds Futures COT ChartThe Ultra 10-Year Notes large speculator standing this week was a net position of 105,428 contracts in the data reported through Tuesday. This was a weekly decline of -19,386 contracts from the previous week which had a total of 124,814 net contracts.

This week’s current strength score (the trader positioning range over the past three years, measured from 0 to 100) shows the speculators are currently Bullish with a score of 55.6 percent. The commercials are Bullish with a score of 55.2 percent and the small traders (not shown in chart) are Bearish-Extreme with a score of 10.7 percent.

Ultra 10-Year Notes StatisticsSPECULATORSCOMMERCIALSSMALL TRADERS
– Percent of Open Interest Longs:14.876.38.5
– Percent of Open Interest Shorts:7.873.718.2
– Net Position:105,42839,203-144,631
– Gross Longs:220,9031,136,010126,680
– Gross Shorts:115,4751,096,807271,311
– Long to Short Ratio:1.9 to 11.0 to 10.5 to 1
NET POSITION TREND:
– COT Index Score (3 Year Range Pct):55.655.210.7
– COT Index Reading (3 Year Range):BullishBullishBearish-Extreme
NET POSITION MOVEMENT INDEX:
– 6-Week Change in Strength Index:-23.521.210.2


US Treasury Bonds Futures:

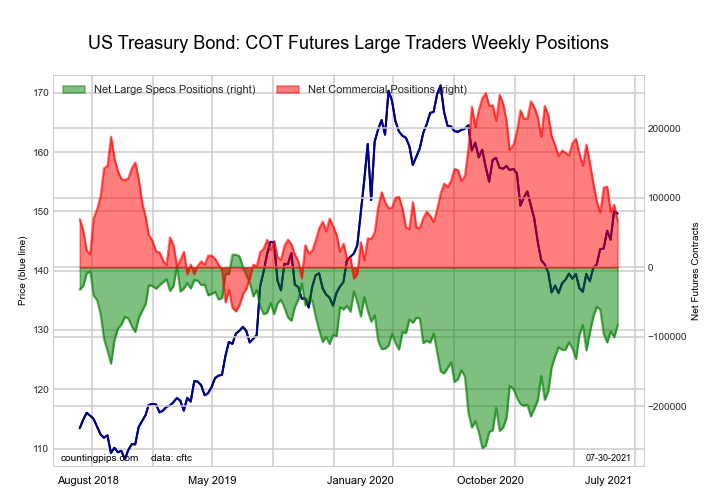
US Year Treasury Notes Long Bonds Futures COT ChartThe US Treasury Bonds large speculator standing this week was a net position of -82,915 contracts in the data reported through Tuesday. This was a weekly increase of 17,693 contracts from the previous week which had a total of -100,608 net contracts.

This week’s current strength score (the trader positioning range over the past three years, measured from 0 to 100) shows the speculators are currently Bullish with a score of 63.6 percent. The commercials are Bearish with a score of 41.4 percent and the small traders (not shown in chart) are Bullish with a score of 65.4 percent.

US Treasury Bonds StatisticsSPECULATORSCOMMERCIALSSMALL TRADERS
– Percent of Open Interest Longs:9.972.016.2
– Percent of Open Interest Shorts:16.966.414.9
– Net Position:-82,91566,82416,091
– Gross Longs:117,946853,940192,630
– Gross Shorts:200,861787,116176,539
– Long to Short Ratio:0.6 to 11.1 to 11.1 to 1
NET POSITION TREND:
– COT Index Score (3 Year Range Pct):63.641.465.4
– COT Index Reading (3 Year Range):BullishBearishBullish
NET POSITION MOVEMENT INDEX:
– 6-Week Change in Strength Index:-9.4-8.742.4


Ultra US Treasury Bonds Futures:

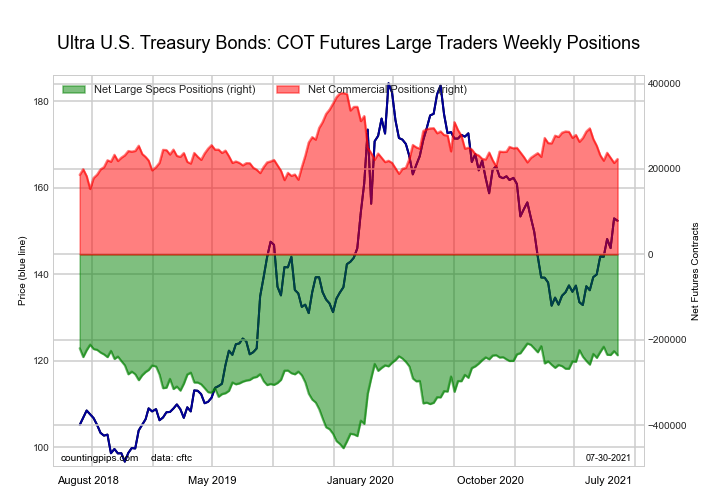
Ultra US Year Treasury Notes Long Bonds Futures COT ChartThe Ultra US Treasury Bonds large speculator standing this week was a net position of -236,239 contracts in the data reported through Tuesday. This was a weekly decrease of -9,602 contracts from the previous week which had a total of -226,637 net contracts.

This week’s current strength score (the trader positioning range over the past three years, measured from 0 to 100) shows the speculators are currently Bullish-Extreme with a score of 88.9 percent. The commercials are Bearish with a score of 31.2 percent and the small traders (not shown in chart) are Bearish with a score of 37.5 percent.

Ultra US Treasury Bonds StatisticsSPECULATORSCOMMERCIALSSMALL TRADERS
– Percent of Open Interest Longs:9.577.912.3
– Percent of Open Interest Shorts:28.759.811.3
– Net Position:-236,239223,41212,827
– Gross Longs:117,812962,619152,000
– Gross Shorts:354,051739,207139,173
– Long to Short Ratio:0.3 to 11.3 to 11.1 to 1
NET POSITION TREND:
– COT Index Score (3 Year Range Pct):88.931.237.5
– COT Index Reading (3 Year Range):Bullish-ExtremeBearishBearish
NET POSITION MOVEMENT INDEX:
– 6-Week Change in Strength Index:2.5-13.817.8


Article By CountingPips.comReceive our weekly COT Reports by Email

*COT Report: The COT data, released weekly to the public each Friday, is updated through the most recent Tuesday (data is 3 days old) and shows a quick view of how large speculators or non-commercials (for-profit traders) were positioned in the futures markets.

The CFTC categorizes trader positions according to commercial hedgers (traders who use futures contracts for hedging as part of the business), non-commercials (large traders who speculate to realize trading profits) and nonreportable traders (usually small traders/speculators).

Find CFTC criteria here: (http://www.cftc.gov/MarketReports/CommitmentsofTraders/ExplanatoryNotes/index.htm).
COT Futures Metals Charts: Gold, Silver, High Grade Copper, Platinum & Palladium

By CountingPips.com COT Home | Data Tables | Data Downloads | Newsletter

Here are the latest charts and statistics for the Commitment of Traders (COT) data published by the Commodities Futures Trading Commission (CFTC).

The latest COT data is updated through Tuesday July 27 2021 and shows a quick view of how large traders (for-profit speculators and commercial entities) were positioned in the futures markets.


Gold Comex Futures:

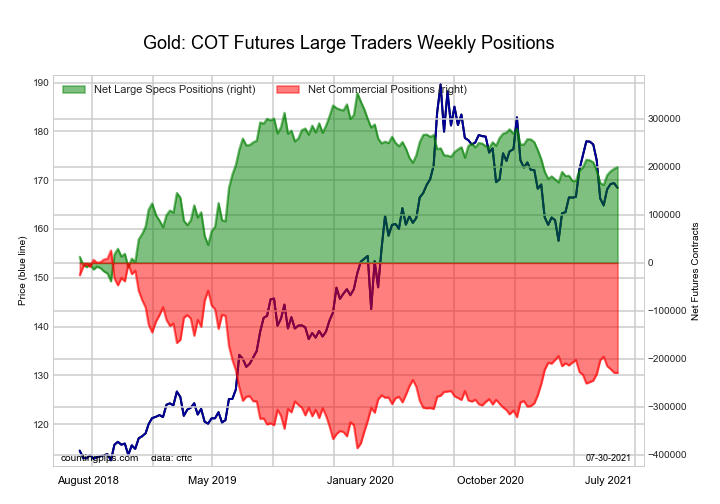
Federal Funds 30-Day Bonds Futures COT ChartThe Gold Comex Futures large speculator standing this week resulted in a net position of 199,388 contracts in the data reported through Tuesday. This was a weekly gain of 3,416 contracts from the previous week which had a total of 195,972 net contracts.

This week’s current strength score (the trader positioning range over the past three years, measured from 0 to 100) shows the speculators are currently Bullish with a score of 60.6 percent. The commercials are Bearish with a score of 38.1 percent and the small traders (not shown in chart) are Bullish with a score of 55.0 percent.

Gold Futures StatisticsSPECULATORSCOMMERCIALSSMALL TRADERS
– Percent of Open Interest Longs:54.723.39.6
– Percent of Open Interest Shorts:14.969.03.7
– Net Position:199,388-228,81429,426
– Gross Longs:273,688116,49848,080
– Gross Shorts:74,300345,31218,654
– Long to Short Ratio:3.7 to 10.3 to 12.6 to 1
NET POSITION TREND:
– COT Index Score (3 Year Range Pct):60.638.155.0
– COT Index Reading (3 Year Range):BullishBearishBullish
NET POSITION MOVEMENT INDEX:
– 6-Week Change in Strength Index:1.90.6-23.9


Silver Comex Futures:

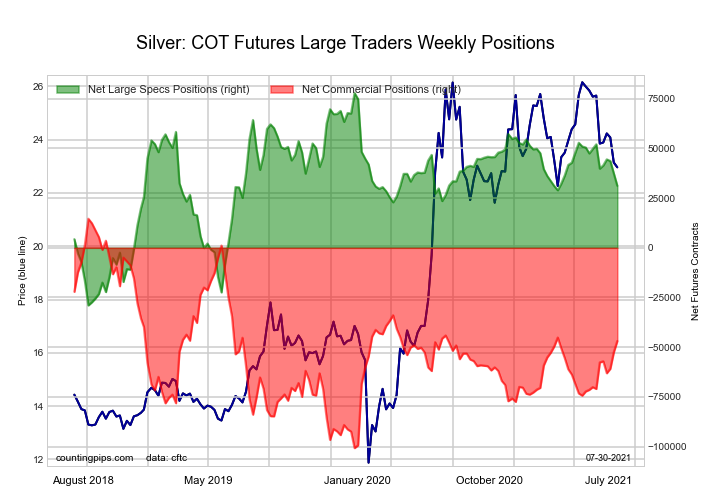
2-Year Treasury Bonds Futures COT ChartThe Silver Comex Futures large speculator standing this week resulted in a net position of 31,217 contracts in the data reported through Tuesday. This was a weekly reduction of -6,258 contracts from the previous week which had a total of 37,475 net contracts.

This week’s current strength score (the trader positioning range over the past three years, measured from 0 to 100) shows the speculators are currently Bullish with a score of 56.3 percent. The commercials are Bearish with a score of 46.7 percent and the small traders (not shown in chart) are Bearish with a score of 31.8 percent.

Silver Futures StatisticsSPECULATORSCOMMERCIALSSMALL TRADERS
– Percent of Open Interest Longs:44.230.418.1
– Percent of Open Interest Shorts:23.561.57.7
– Net Position:31,217-46,90915,692
– Gross Longs:66,73345,81627,330
– Gross Shorts:35,51692,72511,638
– Long to Short Ratio:1.9 to 10.5 to 12.3 to 1
NET POSITION TREND:
– COT Index Score (3 Year Range Pct):56.346.731.8
– COT Index Reading (3 Year Range):BullishBearishBearish
NET POSITION MOVEMENT INDEX:
– 6-Week Change in Strength Index:-19.520.9-19.6


Copper Grade #1 Futures:

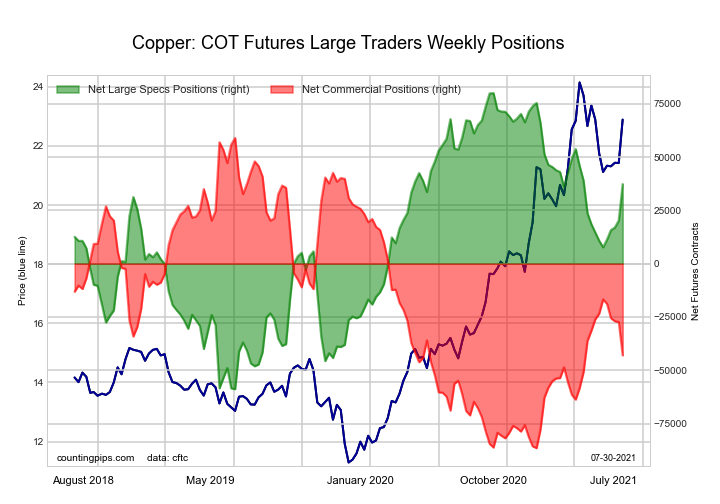
5-Year Treasury Bonds Futures COT ChartThe Copper Grade #1 Futures large speculator standing this week resulted in a net position of 37,351 contracts in the data reported through Tuesday. This was a weekly advance of 17,078 contracts from the previous week which had a total of 20,273 net contracts.

This week’s current strength score (the trader positioning range over the past three years, measured from 0 to 100) shows the speculators are currently Bullish with a score of 69.3 percent. The commercials are Bearish with a score of 29.9 percent and the small traders (not shown in chart) are Bullish with a score of 58.0 percent.

Copper Futures StatisticsSPECULATORSCOMMERCIALSSMALL TRADERS
– Percent of Open Interest Longs:44.336.79.4
– Percent of Open Interest Shorts:26.457.36.7
– Net Position:37,351-43,0075,656
– Gross Longs:92,48476,57019,717
– Gross Shorts:55,133119,57714,061
– Long to Short Ratio:1.7 to 10.6 to 11.4 to 1
NET POSITION TREND:
– COT Index Score (3 Year Range Pct):69.329.958.0
– COT Index Reading (3 Year Range):BullishBearishBullish
NET POSITION MOVEMENT INDEX:
– 6-Week Change in Strength Index:19.1-13.5-40.4


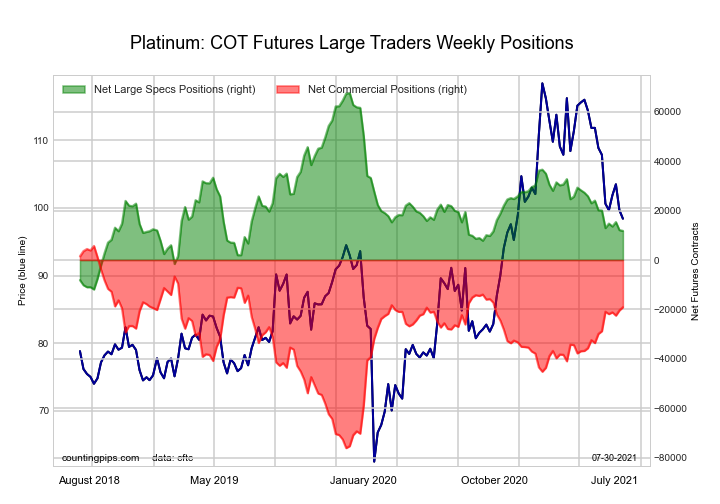
Platinum Futures:

10-Year Treasury Notes Bonds Futures COT ChartThe Platinum Futures large speculator standing this week resulted in a net position of 11,795 contracts in the data reported through Tuesday. This was a weekly decrease of -318 contracts from the previous week which had a total of 12,113 net contracts.

This week’s current strength score (the trader positioning range over the past three years, measured from 0 to 100) shows the speculators are currently Bearish with a score of 29.8 percent. The commercials are Bullish with a score of 69.7 percent and the small traders (not shown in chart) are Bullish with a score of 64.1 percent.

Platinum Futures StatisticsSPECULATORSCOMMERCIALSSMALL TRADERS
– Percent of Open Interest Longs:51.429.017.1
– Percent of Open Interest Shorts:31.561.14.8
– Net Position:11,795-19,1097,314
– Gross Longs:30,51917,19910,180
– Gross Shorts:18,72436,3082,866
– Long to Short Ratio:1.6 to 10.5 to 13.6 to 1
NET POSITION TREND:
– COT Index Score (3 Year Range Pct):29.869.764.1
– COT Index Reading (3 Year Range):BearishBullishBullish
NET POSITION MOVEMENT INDEX:
– 6-Week Change in Strength Index:-10.411.8-20.0


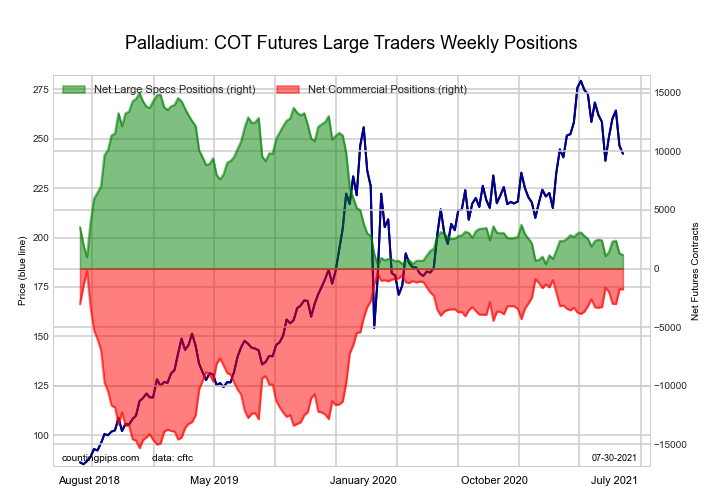
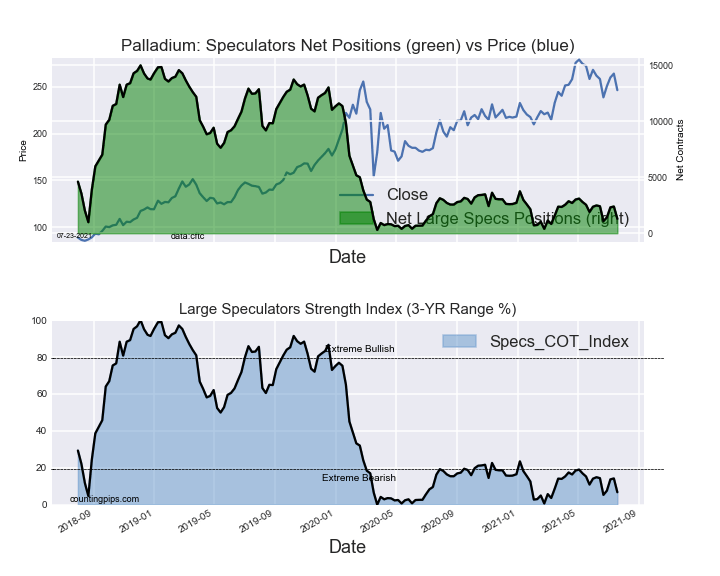
Palladium Futures:

Ultra 10-Year Treasury Notes Bonds Futures COT ChartThe Palladium Futures large speculator standing this week resulted in a net position of 1,175 contracts in the data reported through Tuesday. This was a weekly fall of -108 contracts from the previous week which had a total of 1,283 net contracts.

This week’s current strength score (the trader positioning range over the past three years, measured from 0 to 100) shows the speculators are currently Bearish-Extreme with a score of 6.0 percent. The commercials are Bullish-Extreme with a score of 89.7 percent and the small traders (not shown in chart) are Bullish with a score of 79.5 percent.

Palladium Futures StatisticsSPECULATORSCOMMERCIALSSMALL TRADERS
– Percent of Open Interest Longs:48.735.114.3
– Percent of Open Interest Shorts:37.152.68.5
– Net Position:1,175-1,764589
– Gross Longs:4,9193,5441,446
– Gross Shorts:3,7445,308857
– Long to Short Ratio:1.3 to 10.7 to 11.7 to 1
NET POSITION TREND:
– COT Index Score (3 Year Range Pct):6.089.779.5
– COT Index Reading (3 Year Range):Bearish-ExtremeBullish-ExtremeBullish
NET POSITION MOVEMENT INDEX:
– 6-Week Change in Strength Index:-8.410.0-16.6


Article By CountingPips.comReceive our weekly COT Reports by Email

*COT Report: The COT data, released weekly to the public each Friday, is updated through the most recent Tuesday (data is 3 days old) and shows a quick view of how large speculators or non-commercials (for-profit traders) were positioned in the futures markets.

The CFTC categorizes trader positions according to commercial hedgers (traders who use futures contracts for hedging as part of the business), non-commercials (large traders who speculate to realize trading profits) and nonreportable traders (usually small traders/speculators).

Find CFTC criteria here: (http://www.cftc.gov/MarketReports/CommitmentsofTraders/ExplanatoryNotes/index.htm).
COT Stock Market Charts: Emerging Markets, VIX, Dow-Mini, Nasdaq, SP500-Mini, Russell-2000,

By CountingPips.com COT Home | Data Tables | Data Downloads | Newsletter

Here are the latest charts and statistics for the Commitment of Traders (COT) data published by the Commodities Futures Trading Commission (CFTC).

The latest COT data is updated through Tuesday July 27 2021 and shows a quick view of how large traders (for-profit speculators and commercial entities) were positioned in the futures markets.


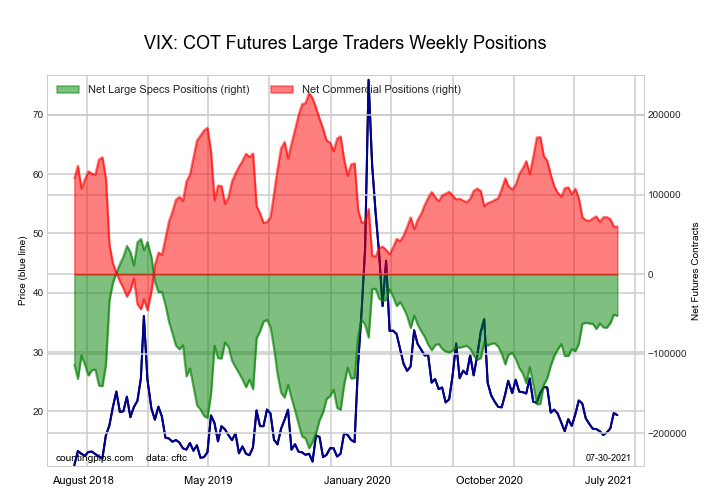
VIX Volatility Futures:

Federal Funds 30-Day Bonds Futures COT ChartThe VIX Volatility large speculator standing this week recorded a net position of -52,055 contracts in the data reported through Tuesday. This was a weekly decline of -1,317 contracts from the previous week which had a total of -50,738 net contracts.

This week’s current strength score (the trader positioning range over the past three years, measured from 0 to 100) shows the speculators are currently Bullish with a score of 63.3 percent. The commercials are Bearish with a score of 38.6 percent and the small traders (not shown in chart) are Bearish with a score of 26.1 percent.

VIX Volatility Futures StatisticsSPECULATORSCOMMERCIALSSMALL TRADERS
– Percent of Open Interest Longs:22.252.16.3
– Percent of Open Interest Shorts:39.432.38.9
– Net Position:-52,05560,030-7,975
– Gross Longs:67,107157,65919,052
– Gross Shorts:119,16297,62927,027
– Long to Short Ratio:0.6 to 11.6 to 10.7 to 1
NET POSITION TREND:
– COT Index Score (3 Year Range Pct):63.338.626.1
– COT Index Reading (3 Year Range):BullishBearishBearish
NET POSITION MOVEMENT INDEX:
– 6-Week Change in Strength Index:6.4-4.6-15.5


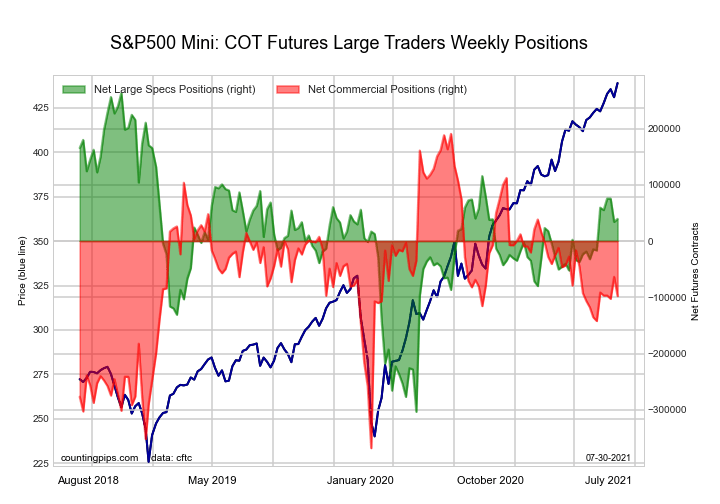
S&P500 Mini Futures:

2-Year Treasury Bonds Futures COT ChartThe S&P500 Mini large speculator standing this week recorded a net position of 39,375 contracts in the data reported through Tuesday. This was a weekly gain of 5,197 contracts from the previous week which had a total of 34,178 net contracts.

This week’s current strength score (the trader positioning range over the past three years, measured from 0 to 100) shows the speculators are currently Bullish with a score of 60.5 percent. The commercials are Bearish with a score of 48.4 percent and the small traders (not shown in chart) are Bearish with a score of 38.6 percent.

S&P500 Mini Futures StatisticsSPECULATORSCOMMERCIALSSMALL TRADERS
– Percent of Open Interest Longs:15.869.411.6
– Percent of Open Interest Shorts:14.373.19.4
– Net Position:39,375-97,68958,314
– Gross Longs:421,6121,851,215308,790
– Gross Shorts:382,2371,948,904250,476
– Long to Short Ratio:1.1 to 10.9 to 11.2 to 1
NET POSITION TREND:
– COT Index Score (3 Year Range Pct):60.548.438.6
– COT Index Reading (3 Year Range):BullishBearishBearish
NET POSITION MOVEMENT INDEX:
– 6-Week Change in Strength Index:9.97.9-21.0


Dow Jones Mini Futures:

5-Year Treasury Bonds Futures COT ChartThe Dow Jones Mini large speculator standing this week recorded a net position of -373 contracts in the data reported through Tuesday. This was a weekly gain of 3,547 contracts from the previous week which had a total of -3,920 net contracts.

This week’s current strength score (the trader positioning range over the past three years, measured from 0 to 100) shows the speculators are currently Bearish with a score of 34.0 percent. The commercials are Bullish with a score of 59.6 percent and the small traders (not shown in chart) are Bullish with a score of 66.2 percent.

Dow Jones Mini Futures StatisticsSPECULATORSCOMMERCIALSSMALL TRADERS
– Percent of Open Interest Longs:39.641.617.2
– Percent of Open Interest Shorts:39.946.312.2
– Net Position:-373-4,8165,189
– Gross Longs:40,56642,64017,665
– Gross Shorts:40,93947,45612,476
– Long to Short Ratio:1.0 to 10.9 to 11.4 to 1
NET POSITION TREND:
– COT Index Score (3 Year Range Pct):34.059.666.2
– COT Index Reading (3 Year Range):BearishBullishBullish
NET POSITION MOVEMENT INDEX:
– 6-Week Change in Strength Index:11.6-3.9-33.8


Nasdaq Mini Futures:

10-Year Treasury Notes Bonds Futures COT ChartThe Nasdaq Mini large speculator standing this week recorded a net position of -9,825 contracts in the data reported through Tuesday. This was a weekly decline of -7,543 contracts from the previous week which had a total of -2,282 net contracts.

This week’s current strength score (the trader positioning range over the past three years, measured from 0 to 100) shows the speculators are currently Bullish with a score of 69.5 percent. The commercials are Bearish with a score of 37.9 percent and the small traders (not shown in chart) are Bearish with a score of 24.6 percent.

Nasdaq Mini Futures StatisticsSPECULATORSCOMMERCIALSSMALL TRADERS
– Percent of Open Interest Longs:27.256.414.7
– Percent of Open Interest Shorts:31.448.518.4
– Net Position:-9,82518,467-8,642
– Gross Longs:63,838132,38434,607
– Gross Shorts:73,663113,91743,249
– Long to Short Ratio:0.9 to 11.2 to 10.8 to 1
NET POSITION TREND:
– COT Index Score (3 Year Range Pct):69.537.924.6
– COT Index Reading (3 Year Range):BullishBearishBearish
NET POSITION MOVEMENT INDEX:
– 6-Week Change in Strength Index:0.7-2.66.9


Russell 2000 Mini Futures:

Ultra 10-Year Treasury Notes Bonds Futures COT ChartThe Russell 2000 Mini large speculator standing this week recorded a net position of -56,850 contracts in the data reported through Tuesday. This was a weekly reduction of -822 contracts from the previous week which had a total of -56,028 net contracts.

This week’s current strength score (the trader positioning range over the past three years, measured from 0 to 100) shows the speculators are currently Bearish with a score of 21.7 percent. The commercials are Bullish with a score of 77.7 percent and the small traders (not shown in chart) are Bearish with a score of 48.2 percent.

Russell 2000 Mini Futures StatisticsSPECULATORSCOMMERCIALSSMALL TRADERS
– Percent of Open Interest Longs:12.779.86.4
– Percent of Open Interest Shorts:25.168.65.3
– Net Position:-56,85051,5015,349
– Gross Longs:57,951364,89329,369
– Gross Shorts:114,801313,39224,020
– Long to Short Ratio:0.5 to 11.2 to 11.2 to 1
NET POSITION TREND:
– COT Index Score (3 Year Range Pct):21.777.748.2
– COT Index Reading (3 Year Range):BearishBullishBearish
NET POSITION MOVEMENT INDEX:
– 6-Week Change in Strength Index:-4.74.7-1.2


Nikkei Stock Average (USD) Futures:

US Year Treasury Notes Long Bonds Futures COT ChartThe Nikkei Stock Average (USD) large speculator standing this week recorded a net position of -5,499 contracts in the data reported through Tuesday. This was a weekly boost of 792 contracts from the previous week which had a total of -6,291 net contracts.

This week’s current strength score (the trader positioning range over the past three years, measured from 0 to 100) shows the speculators are currently Bearish with a score of 35.4 percent. The commercials are Bullish with a score of 78.7 percent and the small traders (not shown in chart) are Bearish-Extreme with a score of 0.0 percent.

Nikkei Stock Average Futures StatisticsSPECULATORSCOMMERCIALSSMALL TRADERS
– Percent of Open Interest Longs:14.960.424.7
– Percent of Open Interest Shorts:49.912.138.0
– Net Position:-5,4997,587-2,088
– Gross Longs:2,3459,4853,880
– Gross Shorts:7,8441,8985,968
– Long to Short Ratio:0.3 to 15.0 to 10.7 to 1
NET POSITION TREND:
– COT Index Score (3 Year Range Pct):35.478.70.0
– COT Index Reading (3 Year Range):BearishBullishBearish-Extreme
NET POSITION MOVEMENT INDEX:
– 6-Week Change in Strength Index:-3.116.5-45.3


MSCI EAFE Mini Futures:

Ultra US Year Treasury Notes Long Bonds Futures COT ChartThe MSCI EAFE Mini large speculator standing this week recorded a net position of 28,785 contracts in the data reported through Tuesday. This was a weekly reduction of -2,667 contracts from the previous week which had a total of 31,452 net contracts.

This week’s current strength score (the trader positioning range over the past three years, measured from 0 to 100) shows the speculators are currently Bullish with a score of 53.1 percent. The commercials are Bearish with a score of 50.0 percent and the small traders (not shown in chart) are Bearish-Extreme with a score of 14.6 percent.

MSCI EAFE Mini Futures StatisticsSPECULATORSCOMMERCIALSSMALL TRADERS
– Percent of Open Interest Longs:9.587.92.4
– Percent of Open Interest Shorts:2.894.52.4
– Net Position:28,785-28,661-124
– Gross Longs:41,106381,33810,220
– Gross Shorts:12,321409,99910,344
– Long to Short Ratio:3.3 to 10.9 to 11.0 to 1
NET POSITION TREND:
– COT Index Score (3 Year Range Pct):53.150.014.6
– COT Index Reading (3 Year Range):BullishBearishBearish-Extreme
NET POSITION MOVEMENT INDEX:
– 6-Week Change in Strength Index:22.9-9.1-75.3


MSCI Emerging Mkts Mini Futures:

Eurodollar Bonds Futures COT ChartThe MSCI Emerging Mkts Mini large speculator standing this week recorded a net position of 38,211 contracts in the data reported through Tuesday. This was a weekly fall of -2,219 contracts from the previous week which had a total of 40,430 net contracts.

This week’s current strength score (the trader positioning range over the past three years, measured from 0 to 100) shows the speculators are currently Bearish-Extreme with a score of 0.0 percent. The commercials are Bullish-Extreme with a score of 97.2 percent and the small traders (not shown in chart) are Bearish with a score of 40.4 percent.

MSCI Emerging Mkts Mini Futures StatisticsSPECULATORSCOMMERCIALSSMALL TRADERS
– Percent of Open Interest Longs:14.382.22.4
– Percent of Open Interest Shorts:11.086.51.3
– Net Position:38,211-49,88611,675
– Gross Longs:165,150950,68527,250
– Gross Shorts:126,9391,000,57115,575
– Long to Short Ratio:1.3 to 11.0 to 11.7 to 1
NET POSITION TREND:
– COT Index Score (3 Year Range Pct):0.097.240.4
– COT Index Reading (3 Year Range):Bearish-ExtremeBullish-ExtremeBearish
NET POSITION MOVEMENT INDEX:
– 6-Week Change in Strength Index:-11.06.87.3


Article By CountingPips.comReceive our weekly COT Reports by Email

*COT Report: The COT data, released weekly to the public each Friday, is updated through the most recent Tuesday (data is 3 days old) and shows a quick view of how large speculators or non-commercials (for-profit traders) were positioned in the futures markets.

The CFTC categorizes trader positions according to commercial hedgers (traders who use futures contracts for hedging as part of the business), non-commercials (large traders who speculate to realize trading profits) and nonreportable traders (usually small traders/speculators).

Find CFTC criteria here: (http://www.cftc.gov/MarketReports/CommitmentsofTraders/ExplanatoryNotes/index.htm).
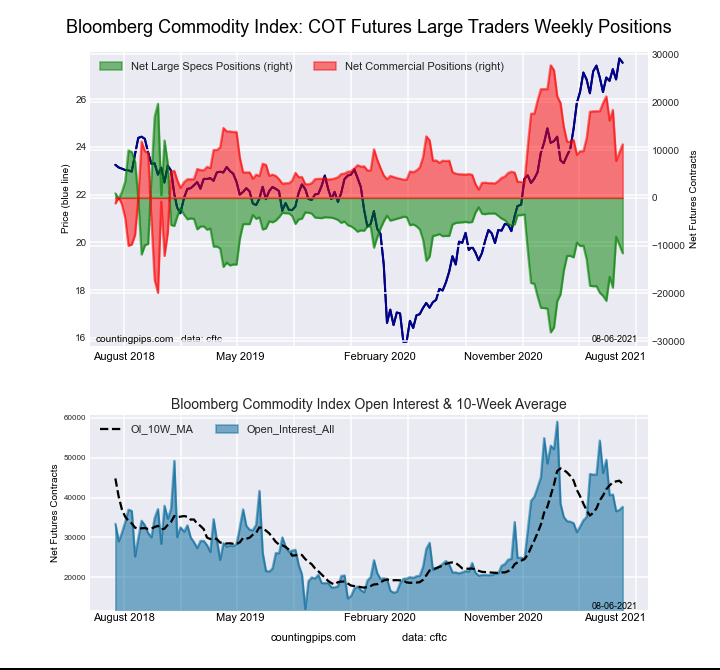
COT Energy Futures Charts: Brent Crude Oil, Natural Gas, Bloomberg Index, Heating Oil & WTI Oil

By CountingPips.com COT Home | Data Tables | Data Downloads | Newsletter

Here are the latest charts and statistics for the Commitment of Traders (COT) data published by the Commodities Futures Trading Commission (CFTC).

The latest COT data is updated through Tuesday July 27 2021 and shows a quick view of how large traders (for-profit speculators and commercial entities) were positioned in the futures markets.


WTI Crude Oil Futures :

WTI Crude Oil Futures COT ChartThe WTI Crude Oil Futures large speculator standing this week recorded a net position of 449,764 contracts in the data reported through Tuesday. This was a weekly gain of 1,024 contracts from the previous week which had a total of 448,740 net contracts.

This week’s current strength score (the trader positioning range over the past three years, measured from 0 to 100) shows the speculators are currently Bullish with a score of 52.0 percent. The commercials are Bearish with a score of 43.6 percent and the small traders (not shown in chart) are Bullish with a score of 68.7 percent.

WTI Crude Oil Futures StatisticsSPECULATORSCOMMERCIALSSMALL TRADERS
– Percent of Open Interest Longs:25.835.63.9
– Percent of Open Interest Shorts:6.556.52.3
– Net Position:449,764-487,88938,125
– Gross Longs:601,411827,51891,243
– Gross Shorts:151,6471,315,40753,118
– Long to Short Ratio:4.0 to 10.6 to 11.7 to 1
NET POSITION TREND:
– COT Index Score (3 Year Range Pct):52.043.668.7
– COT Index Reading (3 Year Range):BullishBearishBullish
NET POSITION MOVEMENT INDEX:
– 6-Week Change in Strength Index:-22.422.3-13.8


Brent Crude Oil Futures :

Brent Last Day Crude Oil Futures COT ChartThe Brent Crude Oil Futures large speculator standing this week recorded a net position of -29,547 contracts in the data reported through Tuesday. This was a weekly decline of -3,520 contracts from the previous week which had a total of -26,027 net contracts.

This week’s current strength score (the trader positioning range over the past three years, measured from 0 to 100) shows the speculators are currently Bullish with a score of 62.4 percent. The commercials are Bearish with a score of 42.0 percent and the small traders (not shown in chart) are Bearish with a score of 34.9 percent.

Brent Crude Oil Futures StatisticsSPECULATORSCOMMERCIALSSMALL TRADERS
– Percent of Open Interest Longs:16.853.73.1
– Percent of Open Interest Shorts:31.439.03.1
– Net Position:-29,54729,604-57
– Gross Longs:33,832108,2606,157
– Gross Shorts:63,37978,6566,214
– Long to Short Ratio:0.5 to 11.4 to 11.0 to 1
NET POSITION TREND:
– COT Index Score (3 Year Range Pct):62.442.034.9
– COT Index Reading (3 Year Range):BullishBearishBearish
NET POSITION MOVEMENT INDEX:
– 6-Week Change in Strength Index:-15.619.3-20.5


Natural Gas Futures :

Natural Gas Futures COT ChartThe Natural Gas Futures large speculator standing this week recorded a net position of -137,758 contracts in the data reported through Tuesday. This was a weekly decline of -10,216 contracts from the previous week which had a total of -127,542 net contracts.

This week’s current strength score (the trader positioning range over the past three years, measured from 0 to 100) shows the speculators are currently Bearish with a score of 37.2 percent. The commercials are Bullish with a score of 62.5 percent and the small traders (not shown in chart) are Bullish with a score of 67.0 percent.

Natural Gas Futures StatisticsSPECULATORSCOMMERCIALSSMALL TRADERS
– Percent of Open Interest Longs:24.241.14.3
– Percent of Open Interest Shorts:33.834.11.7
– Net Position:-137,758100,30337,455
– Gross Longs:347,610590,14662,370
– Gross Shorts:485,368489,84324,915
– Long to Short Ratio:0.7 to 11.2 to 12.5 to 1
NET POSITION TREND:
– COT Index Score (3 Year Range Pct):37.262.567.0
– COT Index Reading (3 Year Range):BearishBullishBullish
NET POSITION MOVEMENT INDEX:
– 6-Week Change in Strength Index:-9.08.69.3


Gasoline Blendstock Futures :

RBOB Gasoline Energy Futures COT ChartThe Gasoline Blendstock Futures large speculator standing this week recorded a net position of 36,351 contracts in the data reported through Tuesday. This was a weekly rise of 7,014 contracts from the previous week which had a total of 29,337 net contracts.

This week’s current strength score (the trader positioning range over the past three years, measured from 0 to 100) shows the speculators are currently Bearish-Extreme with a score of 7.1 percent. The commercials are Bullish-Extreme with a score of 92.5 percent and the small traders (not shown in chart) are Bullish with a score of 60.2 percent.

Nasdaq Mini Futures StatisticsSPECULATORSCOMMERCIALSSMALL TRADERS
– Percent of Open Interest Longs:25.148.76.4
– Percent of Open Interest Shorts:14.761.54.0
– Net Position:36,351-44,4968,145
– Gross Longs:87,397169,30722,193
– Gross Shorts:51,046213,80314,048
– Long to Short Ratio:1.7 to 10.8 to 11.6 to 1
NET POSITION TREND:
– COT Index Score (3 Year Range Pct):7.192.560.2
– COT Index Reading (3 Year Range):Bearish-ExtremeBullish-ExtremeBullish
NET POSITION MOVEMENT INDEX:
– 6-Week Change in Strength Index:-12.513.8-9.1


#2 Heating Oil NY-Harbor Futures :

NY Harbor Heating Oil Energy Futures COT ChartThe #2 Heating Oil NY-Harbor Futures large speculator standing this week recorded a net position of 26,895 contracts in the data reported through Tuesday. This was a weekly gain of 2,646 contracts from the previous week which had a total of 24,249 net contracts.

This week’s current strength score (the trader positioning range over the past three years, measured from 0 to 100) shows the speculators are currently Bullish with a score of 72.1 percent. The commercials are Bearish with a score of 26.4 percent and the small traders (not shown in chart) are Bullish with a score of 73.3 percent.

Heating Oil Futures StatisticsSPECULATORSCOMMERCIALSSMALL TRADERS
– Percent of Open Interest Longs:17.550.110.8
– Percent of Open Interest Shorts:10.861.46.1
– Net Position:26,895-45,60818,713
– Gross Longs:70,760202,89543,552
– Gross Shorts:43,865248,50324,839
– Long to Short Ratio:1.6 to 10.8 to 11.8 to 1
NET POSITION TREND:
– COT Index Score (3 Year Range Pct):72.126.473.3
– COT Index Reading (3 Year Range):BullishBearishBullish
NET POSITION MOVEMENT INDEX:
– 6-Week Change in Strength Index:4.5-0.8-10.8


Bloomberg Commodity Index Futures :

Bloomberg Commodity Index Futures COT ChartThe Bloomberg Commodity Index Futures large speculator standing this week recorded a net position of -9,827 contracts in the data reported through Tuesday. This was a weekly reduction of -1,697 contracts from the previous week which had a total of -8,130 net contracts.

This week’s current strength score (the trader positioning range over the past three years, measured from 0 to 100) shows the speculators are currently Bearish with a score of 38.3 percent. The commercials are Bullish with a score of 61.7 percent and the small traders (not shown in chart) are Bearish with a score of 37.9 percent.

Bloomberg Index Futures StatisticsSPECULATORSCOMMERCIALSSMALL TRADERS
– Percent of Open Interest Longs:63.435.01.1
– Percent of Open Interest Shorts:90.09.20.3
– Net Position:-9,8279,516311
– Gross Longs:23,39912,916418
– Gross Shorts:33,2263,400107
– Long to Short Ratio:0.7 to 13.8 to 13.9 to 1
NET POSITION TREND:
– COT Index Score (3 Year Range Pct):38.361.737.9
– COT Index Reading (3 Year Range):BearishBullishBearish
NET POSITION MOVEMENT INDEX:
– 6-Week Change in Strength Index:21.0-18.1-62.1


Article By CountingPips.comReceive our weekly COT Reports by Email

*COT Report: The COT data, released weekly to the public each Friday, is updated through the most recent Tuesday (data is 3 days old) and shows a quick view of how large speculators or non-commercials (for-profit traders) were positioned in the futures markets.

The CFTC categorizes trader positions according to commercial hedgers (traders who use futures contracts for hedging as part of the business), non-commercials (large traders who speculate to realize trading profits) and nonreportable traders (usually small traders/speculators).

Find CFTC criteria here: (http://www.cftc.gov/MarketReports/CommitmentsofTraders/ExplanatoryNotes/index.htm).

COT Soft Commodities Charts: Corn, Sugar, Live Cattle, Hogs, Sugar, Coffee, Cocoa

By CountingPips.com COT Home | Data Tables | Data Downloads | Newsletter

Here are the latest charts and statistics for the Commitment of Traders (COT) data published by the Commodities Futures Trading Commission (CFTC).

The latest COT data is updated through Tuesday July 27 2021 and shows a quick view of how large traders (for-profit speculators and commercial entities) were positioned in the futures markets.


CORN Futures:

Federal Funds 30-Day Bonds Futures COT ChartThe CORN large speculator standing this week resulted in a net position of 306,677 contracts in the data reported through Tuesday. This was a weekly decline of -4,852 contracts from the previous week which had a total of 311,529 net contracts.

This week’s current strength score (the trader positioning range over the past three years, measured from 0 to 100) shows the speculators are currently Bullish with a score of 69.2 percent. The commercials are Bearish with a score of 36.8 percent and the small traders (not shown in chart) are Bearish-Extreme with a score of 1.4 percent.

CORN Futures StatisticsSPECULATORSCOMMERCIALSSMALL TRADERS
– Percent of Open Interest Longs:26.848.88.5
– Percent of Open Interest Shorts:5.965.612.6
– Net Position:306,677-246,294-60,383
– Gross Longs:393,463716,395124,068
– Gross Shorts:86,786962,689184,451
– Long to Short Ratio:4.5 to 10.7 to 10.7 to 1
NET POSITION TREND:
– COT Index Score (3 Year Range Pct):69.236.81.4
– COT Index Reading (3 Year Range):BullishBearishBearish-Extreme
NET POSITION MOVEMENT INDEX:
– 6-Week Change in Strength Index:-12.114.6-4.9


SUGAR Futures:

2-Year Treasury Bonds Futures COT ChartThe SUGAR large speculator standing this week resulted in a net position of 270,987 contracts in the data reported through Tuesday. This was a weekly advance of 28,518 contracts from the previous week which had a total of 242,469 net contracts.

This week’s current strength score (the trader positioning range over the past three years, measured from 0 to 100) shows the speculators are currently Bullish-Extreme with a score of 92.3 percent. The commercials are Bearish-Extreme with a score of 6.2 percent and the small traders (not shown in chart) are Bullish with a score of 76.7 percent.

SUGAR Futures StatisticsSPECULATORSCOMMERCIALSSMALL TRADERS
– Percent of Open Interest Longs:32.342.710.2
– Percent of Open Interest Shorts:3.976.94.4
– Net Position:270,987-326,71755,730
– Gross Longs:307,945407,25597,297
– Gross Shorts:36,958733,97241,567
– Long to Short Ratio:8.3 to 10.6 to 12.3 to 1
NET POSITION TREND:
– COT Index Score (3 Year Range Pct):92.36.276.7
– COT Index Reading (3 Year Range):Bullish-ExtremeBearish-ExtremeBullish
NET POSITION MOVEMENT INDEX:
– 6-Week Change in Strength Index:0.3-1.58.2


COFFEE Futures:

5-Year Treasury Bonds Futures COT ChartThe COFFEE large speculator standing this week resulted in a net position of 56,712 contracts in the data reported through Tuesday. This was a weekly lowering of -5,324 contracts from the previous week which had a total of 62,036 net contracts.

This week’s current strength score (the trader positioning range over the past three years, measured from 0 to 100) shows the speculators are currently Bullish-Extreme with a score of 91.7 percent. The commercials are Bearish-Extreme with a score of 9.4 percent and the small traders (not shown in chart) are Bearish-Extreme with a score of 18.4 percent.

COFFEE Futures StatisticsSPECULATORSCOMMERCIALSSMALL TRADERS
– Percent of Open Interest Longs:25.248.33.5
– Percent of Open Interest Shorts:5.969.02.1
– Net Position:56,712-61,0604,348
– Gross Longs:74,172142,03110,427
– Gross Shorts:17,460203,0916,079
– Long to Short Ratio:4.2 to 10.7 to 11.7 to 1
NET POSITION TREND:
– COT Index Score (3 Year Range Pct):91.79.418.4
– COT Index Reading (3 Year Range):Bullish-ExtremeBearish-ExtremeBearish-Extreme
NET POSITION MOVEMENT INDEX:
– 6-Week Change in Strength Index:-3.84.7-9.0


SOYBEANS Futures:

10-Year Treasury Notes Bonds Futures COT ChartThe SOYBEANS large speculator standing this week resulted in a net position of 125,661 contracts in the data reported through Tuesday. This was a weekly decrease of -12,018 contracts from the previous week which had a total of 137,679 net contracts.

This week’s current strength score (the trader positioning range over the past three years, measured from 0 to 100) shows the speculators are currently Bullish with a score of 61.4 percent. The commercials are Bearish with a score of 39.4 percent and the small traders (not shown in chart) are Bearish with a score of 49.6 percent.

SOYBEANS Futures StatisticsSPECULATORSCOMMERCIALSSMALL TRADERS
– Percent of Open Interest Longs:28.249.27.3
– Percent of Open Interest Shorts:9.466.09.3
– Net Position:125,661-112,331-13,330
– Gross Longs:188,545328,23348,754
– Gross Shorts:62,884440,56462,084
– Long to Short Ratio:3.0 to 10.7 to 10.8 to 1
NET POSITION TREND:
– COT Index Score (3 Year Range Pct):61.439.449.6
– COT Index Reading (3 Year Range):BullishBearishBearish
NET POSITION MOVEMENT INDEX:
– 6-Week Change in Strength Index:-19.719.3-3.7


SOYBEAN OIL Futures:

Ultra 10-Year Treasury Notes Bonds Futures COT ChartThe SOYBEAN OIL large speculator standing this week resulted in a net position of 59,517 contracts in the data reported through Tuesday. This was a weekly boost of 3,102 contracts from the previous week which had a total of 56,415 net contracts.

This week’s current strength score (the trader positioning range over the past three years, measured from 0 to 100) shows the speculators are currently Bullish with a score of 61.3 percent. The commercials are Bearish with a score of 40.4 percent and the small traders (not shown in chart) are Bearish with a score of 47.7 percent.

SOYBEAN OIL Futures StatisticsSPECULATORSCOMMERCIALSSMALL TRADERS
– Percent of Open Interest Longs:19.850.97.2
– Percent of Open Interest Shorts:7.465.25.3
– Net Position:59,517-68,6909,173
– Gross Longs:95,068243,98334,536
– Gross Shorts:35,551312,67325,363
– Long to Short Ratio:2.7 to 10.8 to 11.4 to 1
NET POSITION TREND:
– COT Index Score (3 Year Range Pct):61.340.447.7
– COT Index Reading (3 Year Range):BullishBearishBearish
NET POSITION MOVEMENT INDEX:
– 6-Week Change in Strength Index:-14.117.1-32.9


SOYBEAN MEAL Futures:

US Year Treasury Notes Long Bonds Futures COT ChartThe SOYBEAN MEAL large speculator standing this week resulted in a net position of 51,516 contracts in the data reported through Tuesday. This was a weekly reduction of -3,349 contracts from the previous week which had a total of 54,865 net contracts.

This week’s current strength score (the trader positioning range over the past three years, measured from 0 to 100) shows the speculators are currently Bullish with a score of 59.0 percent. The commercials are Bearish with a score of 41.1 percent and the small traders (not shown in chart) are Bullish with a score of 52.7 percent.

SOYBEAN MEAL Futures StatisticsSPECULATORSCOMMERCIALSSMALL TRADERS
– Percent of Open Interest Longs:23.651.912.7
– Percent of Open Interest Shorts:9.371.97.0
– Net Position:51,516-71,99320,477
– Gross Longs:84,956186,41945,495
– Gross Shorts:33,440258,41225,018
– Long to Short Ratio:2.5 to 10.7 to 11.8 to 1
NET POSITION TREND:
– COT Index Score (3 Year Range Pct):59.041.152.7
– COT Index Reading (3 Year Range):BullishBearishBullish
NET POSITION MOVEMENT INDEX:
– 6-Week Change in Strength Index:-1.32.5-8.5


LIVE CATTLE Futures:

Ultra US Year Treasury Notes Long Bonds Futures COT ChartThe LIVE CATTLE large speculator standing this week resulted in a net position of 70,938 contracts in the data reported through Tuesday. This was a weekly gain of 8,552 contracts from the previous week which had a total of 62,386 net contracts.

This week’s current strength score (the trader positioning range over the past three years, measured from 0 to 100) shows the speculators are currently Bearish with a score of 36.6 percent. The commercials are Bullish with a score of 58.8 percent and the small traders (not shown in chart) are Bullish with a score of 59.5 percent.

LIVE CATTLE Futures StatisticsSPECULATORSCOMMERCIALSSMALL TRADERS
– Percent of Open Interest Longs:37.140.09.4
– Percent of Open Interest Shorts:13.559.813.1
– Net Position:70,938-59,612-11,326
– Gross Longs:111,594120,51528,182
– Gross Shorts:40,656180,12739,508
– Long to Short Ratio:2.7 to 10.7 to 10.7 to 1
NET POSITION TREND:
– COT Index Score (3 Year Range Pct):36.658.859.5
– COT Index Reading (3 Year Range):BearishBullishBullish
NET POSITION MOVEMENT INDEX:
– 6-Week Change in Strength Index:1.10.7-6.1


LEAN HOGS Futures:

Eurodollar Bonds Futures COT ChartThe LEAN HOGS large speculator standing this week resulted in a net position of 83,004 contracts in the data reported through Tuesday. This was a weekly advance of 9,985 contracts from the previous week which had a total of 73,019 net contracts.

This week’s current strength score (the trader positioning range over the past three years, measured from 0 to 100) shows the speculators are currently Bullish-Extreme with a score of 98.0 percent. The commercials are Bearish-Extreme with a score of 8.3 percent and the small traders (not shown in chart) are Bearish-Extreme with a score of 14.0 percent.

LEAN HOGS Futures StatisticsSPECULATORSCOMMERCIALSSMALL TRADERS
– Percent of Open Interest Longs:45.029.37.8
– Percent of Open Interest Shorts:14.954.512.7
– Net Position:83,004-69,548-13,456
– Gross Longs:124,16080,91921,580
– Gross Shorts:41,156150,46735,036
– Long to Short Ratio:3.0 to 10.5 to 10.6 to 1
NET POSITION TREND:
– COT Index Score (3 Year Range Pct):98.08.314.0
– COT Index Reading (3 Year Range):Bullish-ExtremeBearish-ExtremeBearish-Extreme
NET POSITION MOVEMENT INDEX:
– 6-Week Change in Strength Index:-0.95.5-25.4


COTTON Futures:

Ultra 10-Year Treasury Notes Bonds Futures COT ChartThe COTTON large speculator standing this week resulted in a net position of 85,857 contracts in the data reported through Tuesday. This was a weekly gain of 8,544 contracts from the previous week which had a total of 77,313 net contracts.

This week’s current strength score (the trader positioning range over the past three years, measured from 0 to 100) shows the speculators are currently Bullish-Extreme with a score of 83.8 percent. The commercials are Bearish-Extreme with a score of 13.4 percent and the small traders (not shown in chart) are Bullish-Extreme with a score of 90.0 percent.

COTTON Futures StatisticsSPECULATORSCOMMERCIALSSMALL TRADERS
– Percent of Open Interest Longs:42.039.38.1
– Percent of Open Interest Shorts:7.079.23.2
– Net Position:85,857-97,90612,049
– Gross Longs:102,97196,49919,839
– Gross Shorts:17,114194,4057,790
– Long to Short Ratio:6.0 to 10.5 to 12.5 to 1
NET POSITION TREND:
– COT Index Score (3 Year Range Pct):83.813.490.0
– COT Index Reading (3 Year Range):Bullish-ExtremeBearish-ExtremeBullish-Extreme
NET POSITION MOVEMENT INDEX:
– 6-Week Change in Strength Index:13.9-15.121.3


COCOA Futures:

US Year Treasury Notes Long Bonds Futures COT ChartThe COCOA large speculator standing this week resulted in a net position of 13,326 contracts in the data reported through Tuesday. This was a weekly advance of 4,559 contracts from the previous week which had a total of 8,767 net contracts.

This week’s current strength score (the trader positioning range over the past three years, measured from 0 to 100) shows the speculators are currently Bearish with a score of 35.5 percent. The commercials are Bullish with a score of 64.5 percent and the small traders (not shown in chart) are Bearish with a score of 39.9 percent.

COCOA Futures StatisticsSPECULATORSCOMMERCIALSSMALL TRADERS
– Percent of Open Interest Longs:27.348.24.7
– Percent of Open Interest Shorts:22.054.63.6
– Net Position:13,326-16,0922,766
– Gross Longs:68,772121,39011,767
– Gross Shorts:55,446137,4829,001
– Long to Short Ratio:1.2 to 10.9 to 11.3 to 1
NET POSITION TREND:
– COT Index Score (3 Year Range Pct):35.564.539.9
– COT Index Reading (3 Year Range):BearishBullishBearish
NET POSITION MOVEMENT INDEX:
– 6-Week Change in Strength Index:-13.315.1-26.6


WHEAT Futures:

Ultra US Year Treasury Notes Long Bonds Futures COT ChartThe WHEAT large speculator standing this week resulted in a net position of 30,188 contracts in the data reported through Tuesday. This was a weekly advance of 3,419 contracts from the previous week which had a total of 26,769 net contracts.

This week’s current strength score (the trader positioning range over the past three years, measured from 0 to 100) shows the speculators are currently Bullish with a score of 60.2 percent. The commercials are Bearish with a score of 43.7 percent and the small traders (not shown in chart) are Bearish with a score of 38.4 percent.

WHEAT Futures StatisticsSPECULATORSCOMMERCIALSSMALL TRADERS
– Percent of Open Interest Longs:30.637.87.7
– Percent of Open Interest Shorts:21.942.611.5
– Net Position:30,188-16,959-13,229
– Gross Longs:106,358131,44026,731
– Gross Shorts:76,170148,39939,960
– Long to Short Ratio:1.4 to 10.9 to 10.7 to 1
NET POSITION TREND:
– COT Index Score (3 Year Range Pct):60.243.738.4
– COT Index Reading (3 Year Range):BullishBearishBearish
NET POSITION MOVEMENT INDEX:
– 6-Week Change in Strength Index:11.5-7.8-26.4


Article By CountingPips.comReceive our weekly COT Reports by Email

*COT Report: The COT data, released weekly to the public each Friday, is updated through the most recent Tuesday (data is 3 days old) and shows a quick view of how large speculators or non-commercials (for-profit traders) were positioned in the futures markets.

The CFTC categorizes trader positions according to commercial hedgers (traders who use futures contracts for hedging as part of the business), non-commercials (large traders who speculate to realize trading profits) and nonreportable traders (usually small traders/speculators).

Find CFTC criteria here: (http://www.cftc.gov/MarketReports/CommitmentsofTraders/ExplanatoryNotes/index.htm).
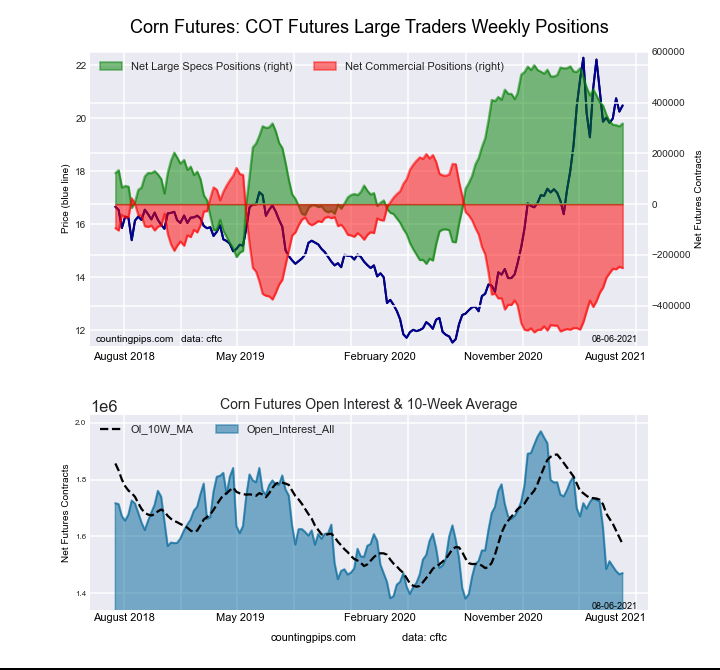
COT Speculator Extremes: Brazil Real leads weekly Bullish Standings, Mexican Peso is most Bearish

By CountingPips.com COT Home | Data Tables | Data Downloads | Newsletter 

The latest update for the weekly Commitment of Traders (COT) report was released by the Commodity Futures Trading Commission (CFTC) on Friday for data ending on Tuesday July 20 2021.

This weekly Extreme Positions report highlights the Most Bullish and the Most Bearish Positions for the speculator category. Extreme positioning in these markets can foreshadow strong moves in the underlying instrument.

To signify an extreme position, we use the Strength Index (also known as the COT Index) of each instrument, which has been a common method among many leading COT practitioners. The Strength Index is simply a comparison of current trader positions against the range of positions over the previous 3 years. We use over 80 percent as extremely bullish and under 20 percent as extremely bearish. (Compare Strength Index scores across all markets in the data tables)


Speculators or Non-Commercials Explained:

Speculators, classified as non-commercial traders by CFTC, are made up of large trading funds, hedge funds, commodity funds and other significant for-profit participants. The Specs are generally regarded as trend-followers in their behavior towards price action – net speculator bets and prices tend to go in the same directions. These traders often look to buy when prices are rising and sell when prices are falling. To illustrate this point, many times speculator contracts can be found at their most extremes (bullish or bearish) when prices are also close to their highest or lowest levels.

These extreme levels can potentially be a signal of overbought and oversold conditions and other times can signal a breakout and possibly a counter-trend move taking in the price trend. These processes can play out in weeks to over many months and even years.


Here Are This Week’s Most Bullish Speculator Positions:

Brazil Real

Brazil Real leads most extreme cot standings and currencies
The Brazil Real speculator trader’s futures position comes in as the most bullish extreme standing this week for a second straight week. The BRL speculator level is currently at a 99 percent score of its 3-year range just down from last week’s 100% strength score (meaning speculative sentiment is at the highest level over past three years).

The extreme positioning shows that speculators have been shedding their bearish sentiment in the real that had prevailed in the currency since the second half of 2019. The BRLUSD price has been on the back-foot against the dollar for some time now but perhaps the newfound positive sentiment among speculators portends a potential breakout higher in the future.


Coffee Futures

Coffee Futures Extreme Positions Bullish

Coffee positions are at the second highest extreme position with the Strength Index Level is now at a 95 percent score of its 3-year range. The Coffee net positions rose by 21.1 percent this week from last week. Sentiment among speculators has been bullish since late in 2019 but the Coffee prices have particularly shot up since the fourth quarter of 2020. Even earlier this week Coffee futures jumped as supply constraints continue to keep prices elevated. It would seem likely that Coffee speculator positioning may stay bullish for time to come.


2-Year Bond

2-Year Bond Speculators Bullish Extreme

The 2-Year Bond speculator trader’s futures position comes in third this week in the extreme standings. The 2-Year Strength Index Level resides at a 93 percent score of its 3-year range.

The 2-Year speculators heavily cut back on their bearish positions this week while their bullish positions rose – creating an extreme reading in positioning. This reflects a dent in the economic outlook earlier in the week (and a quick drop in longer term bond yields) perhaps due to the Delta variant. The big picture outlook in the 2-Year is not changed very much as the 2-Year price has not moved much and the 2-Year yield remains at a depressed rate of 0.20 percent.


This Week’s Most Bearish Speculator Positions:

Mexican Peso

Mexican Peso Bearish Extreme leads the Week

The Mexican Peso speculator trader’s futures position comes in as the most bearish extreme standing this week. The MXN Strength Index Level is at a 1 percent score of its 3-year range.

Peso positions are the most bearish extreme of the week for a second straight week. Peso speculators have had considerably lower sentiment for the Mexican currency since the all-time high positioning that prevailed in late 2019 and into early 2020. The MXNUSD currency pair has been trending higher since the COVID-induced crash in the currency in March 2020. However, with the current sentiment so low, a further push higher in price could prompt speculators to exit their bearish positions and help the case for peso bulls going forward.


Palladium

COT Extremes: Palladium Speculator Standings are bearish

The Palladium speculator trader’s futures position comes in next for the most bearish extreme standing on the week. The Palladium Strength Index Level is at a 7 percent score of its 3-year range.

Palladium positioning has remained very subdued since the onset of the COVID outbreak in early 2020. Speculative positioning went from very bullish (pre-COVID) to extremely bearish (post) in that time-frame. In fact, the open interest numbers show a very low participation rate in the trading with current open interest levels (contracts open in the market) about only a half to one-third the open interest levels before the outbreak. Despite this, the Palladium price has trended higher consistently and continues to be in a bull market.


Fed Funds

Rounding out the extreme bearish positions, the Fed Funds speculator’s futures position comes in as third most bearish extreme standing of the week. The FedFunds Strength Index Level resides at a 17 percent score of its 3-year range. The net speculator position was -185,934 net contracts this week saw movement by -4,942 contracts from last week. The speculator long position was a total of 49,351 contracts against the total spec short position of 235,285 contracts.


*COT Report: The weekly commitment of traders report summarizes the total trader positions for open contracts in the futures trading markets. The CFTC categorizes trader positions according to commercial hedgers (traders who use futures contracts for hedging as part of the business), non-commercials (speculators & large traders who speculate to realize trading profits) and nonreportable traders (usually small traders/speculators). Find CFTC criteria here: (https://www.cftc.gov/MarketReports/CommitmentsofTraders/ExplanatoryNotes/index.htm).
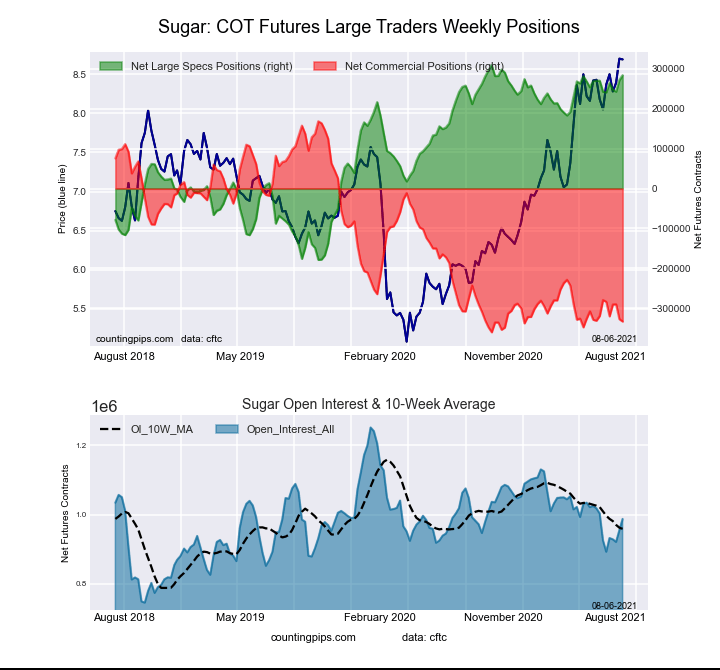
The Commitment of Traders report is published every Friday by the Commodity Futures Trading Commission (CFTC) and shows futures positions data that was reported as of the previous Tuesday (3 days behind).
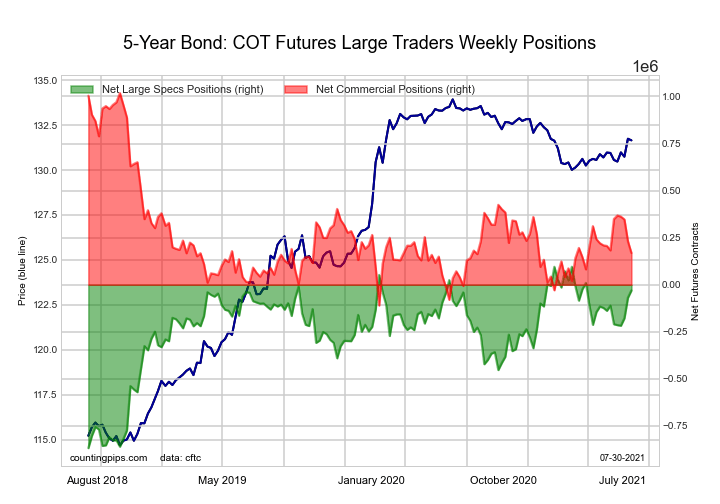
Article by CountingPips – Get Our Weekly Newsletter here