
By CountingPips.com COT Home | Data Tables | Data Downloads | Newsletter
Here are the latest charts and statistics for the Commitment of Traders (COT) data published by the Commodities Futures Trading Commission (CFTC).
The latest COT data is updated through Tuesday August 03 2021 and shows a quick view of how large traders (for-profit speculators and commercial entities) were positioned in the futures markets.
WTI Crude Oil Futures :
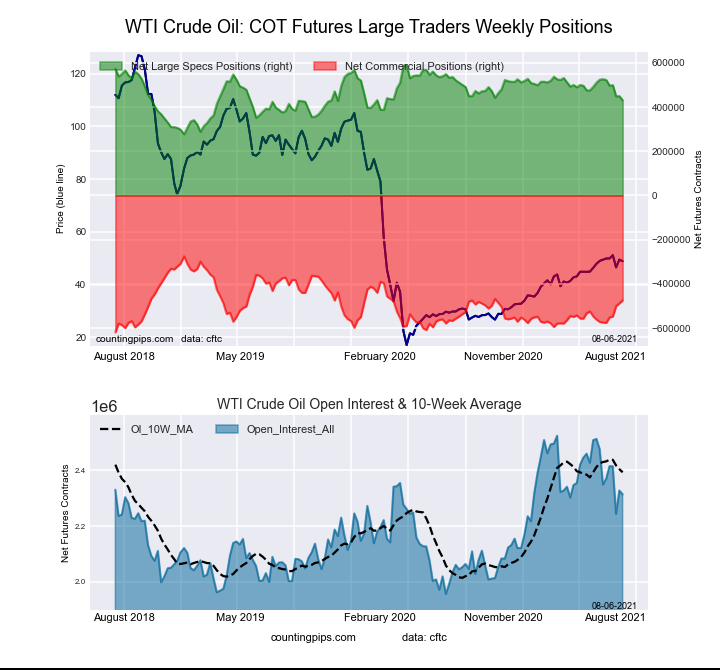 The WTI Crude Oil Futures large speculator standing this week resulted in a net position of 430,527 contracts in the data reported through Tuesday. This was a weekly reduction of -19,237 contracts from the previous week which had a total of 449,764 net contracts.
This week’s current strength score (the trader positioning range over the past three years, measured from 0 to 100) shows the speculators are currently Bearish with a score of 49.1 percent. The commercials are Bearish with a score of 42.0 percent and the small traders (not shown in chart) are Bullish with a score of 76.8 percent.
| WTI Crude Oil Futures Statistics | SPECULATORS | COMMERCIALS | SMALL TRADERS |
| – Percent of Open Interest Longs: | 25.2 | 35.4 | 4.1 |
| – Percent of Open Interest Shorts: | 6.6 | 55.9 | 2.2 |
| – Net Position: | 430,527 | -474,358 | 43,831 |
| – Gross Longs: | 583,470 | 818,264 | 94,256 |
| – Gross Shorts: | 152,943 | 1,292,622 | 50,425 |
| – Long to Short Ratio: | 3.8 to 1 | 0.6 to 1 | 1.9 to 1 |
| NET POSITION TREND: | |||
| – COT Index Score (3 Year Range Pct): | 49.1 | 42.0 | 76.8 |
| – COT Index Reading (3 Year Range): | Bearish | Bearish | Bullish |
| NET POSITION MOVEMENT INDEX: | |||
| – 6-Week Change in Strength Index: | -30.6 | 29.1 | -6.3 |
Free Reports:
 Download Our Metatrader 4 Indicators – Put Our Free MetaTrader 4 Custom Indicators on your charts when you join our Weekly Newsletter
 Get our Weekly Commitment of Traders Reports - See where the biggest traders (Hedge Funds and Commercial Hedgers) are positioned in the futures markets on a weekly basis.
Brent Crude Oil Futures :
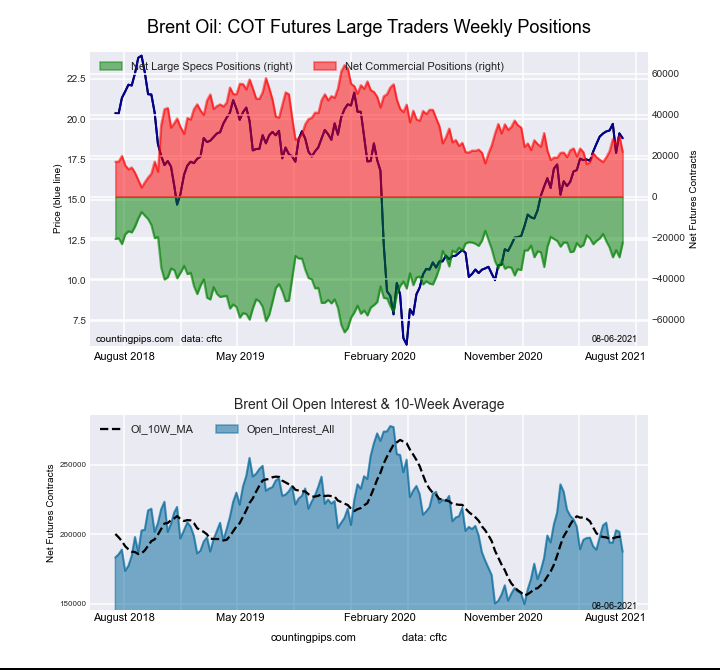 The Brent Crude Oil Futures large speculator standing this week resulted in a net position of -22,385 contracts in the data reported through Tuesday. This was a weekly increase of 7,162 contracts from the previous week which had a total of -29,547 net contracts.
This week’s current strength score (the trader positioning range over the past three years, measured from 0 to 100) shows the speculators are currently Bullish with a score of 74.5 percent. The commercials are Bearish with a score of 29.0 percent and the small traders (not shown in chart) are Bearish with a score of 40.1 percent.
| Brent Crude Oil Futures Statistics | SPECULATORS | COMMERCIALS | SMALL TRADERS |
| – Percent of Open Interest Longs: | 21.2 | 51.2 | 4.1 |
| – Percent of Open Interest Shorts: | 33.1 | 39.6 | 3.8 |
| – Net Position: | -22,385 | 21,849 | 536 |
| – Gross Longs: | 39,648 | 95,934 | 7,652 |
| – Gross Shorts: | 62,033 | 74,085 | 7,116 |
| – Long to Short Ratio: | 0.6 to 1 | 1.3 to 1 | 1.1 to 1 |
| NET POSITION TREND: | |||
| – COT Index Score (3 Year Range Pct): | 74.5 | 29.0 | 40.1 |
| – COT Index Reading (3 Year Range): | Bullish | Bearish | Bearish |
| NET POSITION MOVEMENT INDEX: | |||
| – 6-Week Change in Strength Index: | -7.2 | 8.2 | -5.9 |
Natural Gas Futures :
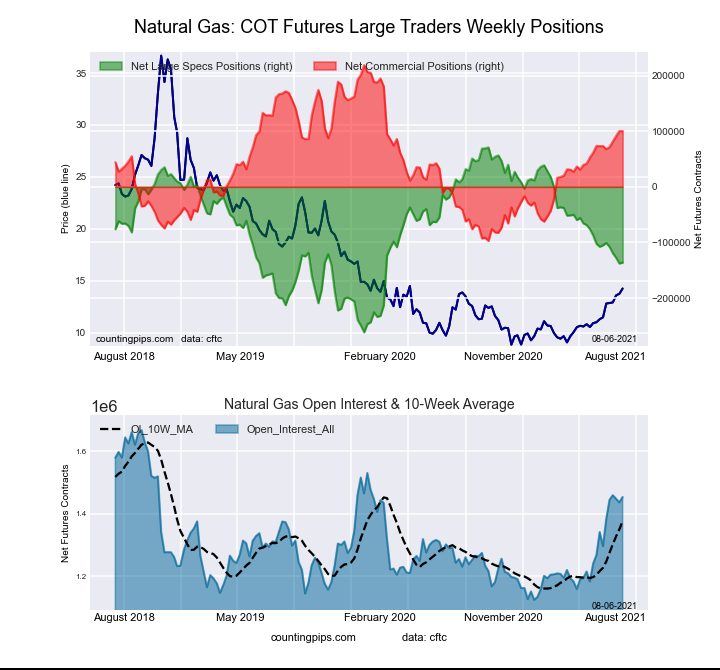 The Natural Gas Futures large speculator standing this week resulted in a net position of -136,245 contracts in the data reported through Tuesday. This was a weekly gain of 1,513 contracts from the previous week which had a total of -137,758 net contracts.
This week’s current strength score (the trader positioning range over the past three years, measured from 0 to 100) shows the speculators are currently Bearish with a score of 37.7 percent. The commercials are Bullish with a score of 62.5 percent and the small traders (not shown in chart) are Bullish with a score of 61.9 percent.
| Natural Gas Futures Statistics | SPECULATORS | COMMERCIALS | SMALL TRADERS |
| – Percent of Open Interest Longs: | 23.8 | 41.2 | 4.3 |
| – Percent of Open Interest Shorts: | 33.2 | 34.3 | 1.9 |
| – Net Position: | -136,245 | 100,386 | 35,859 |
| – Gross Longs: | 346,382 | 599,369 | 62,934 |
| – Gross Shorts: | 482,627 | 498,983 | 27,075 |
| – Long to Short Ratio: | 0.7 to 1 | 1.2 to 1 | 2.3 to 1 |
| NET POSITION TREND: | |||
| – COT Index Score (3 Year Range Pct): | 37.7 | 62.5 | 61.9 |
| – COT Index Reading (3 Year Range): | Bearish | Bullish | Bullish |
| NET POSITION MOVEMENT INDEX: | |||
| – 6-Week Change in Strength Index: | -9.4 | 8.6 | 13.1 |
Gasoline Blendstock Futures :
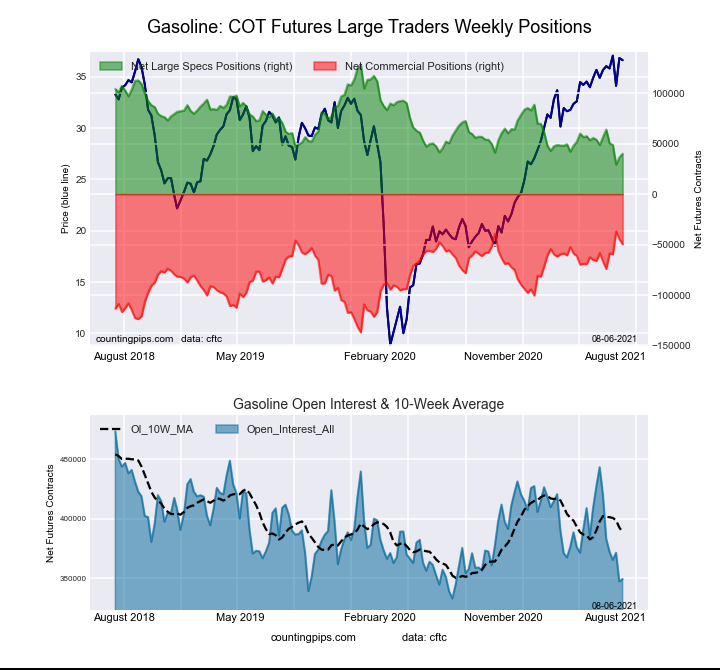 The Gasoline Blendstock Futures large speculator standing this week resulted in a net position of 40,005 contracts in the data reported through Tuesday. This was a weekly boost of 3,654 contracts from the previous week which had a total of 36,351 net contracts.
This week’s current strength score (the trader positioning range over the past three years, measured from 0 to 100) shows the speculators are currently Bearish-Extreme with a score of 10.8 percent. The commercials are Bullish-Extreme with a score of 87.4 percent and the small traders (not shown in chart) are Bullish with a score of 69.3 percent.
| Nasdaq Mini Futures Statistics | SPECULATORS | COMMERCIALS | SMALL TRADERS |
| – Percent of Open Interest Longs: | 26.4 | 47.4 | 6.4 |
| – Percent of Open Interest Shorts: | 14.9 | 61.6 | 3.6 |
| – Net Position: | 40,005 | -49,669 | 9,664 |
| – Gross Longs: | 92,170 | 165,548 | 22,354 |
| – Gross Shorts: | 52,165 | 215,217 | 12,690 |
| – Long to Short Ratio: | 1.8 to 1 | 0.8 to 1 | 1.8 to 1 |
| NET POSITION TREND: | |||
| – COT Index Score (3 Year Range Pct): | 10.8 | 87.4 | 69.3 |
| – COT Index Reading (3 Year Range): | Bearish-Extreme | Bullish-Extreme | Bullish |
| NET POSITION MOVEMENT INDEX: | |||
| – 6-Week Change in Strength Index: | -16.8 | 17.2 | -3.6 |
#2 Heating Oil NY-Harbor Futures :
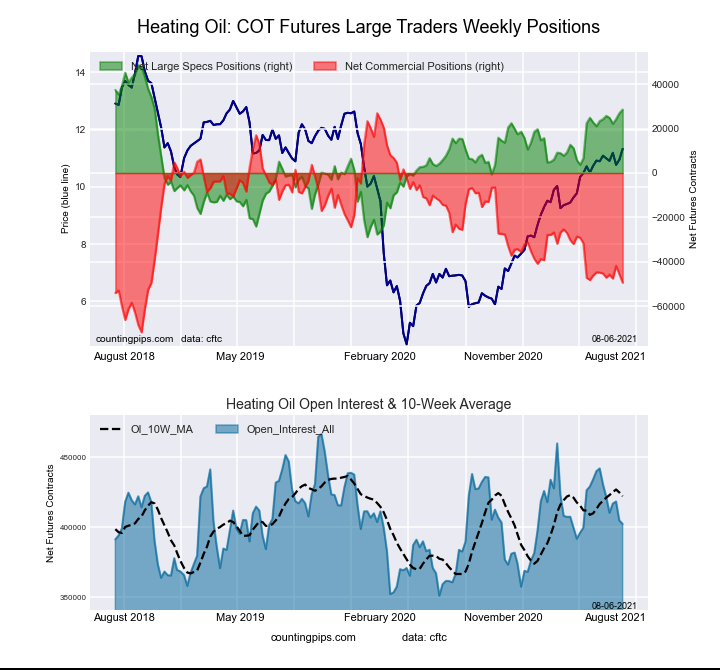 The #2 Heating Oil NY-Harbor Futures large speculator standing this week resulted in a net position of 28,540 contracts in the data reported through Tuesday. This was a weekly boost of 1,645 contracts from the previous week which had a total of 26,895 net contracts.
This week’s current strength score (the trader positioning range over the past three years, measured from 0 to 100) shows the speculators are currently Bullish with a score of 74.2 percent. The commercials are Bearish with a score of 22.6 percent and the small traders (not shown in chart) are Bullish-Extreme with a score of 81.7 percent.
| Heating Oil Futures Statistics | SPECULATORS | COMMERCIALS | SMALL TRADERS |
| – Percent of Open Interest Longs: | 17.3 | 50.1 | 10.6 |
| – Percent of Open Interest Shorts: | 10.2 | 62.4 | 5.4 |
| – Net Position: | 28,540 | -49,343 | 20,803 |
| – Gross Longs: | 69,669 | 201,601 | 42,467 |
| – Gross Shorts: | 41,129 | 250,944 | 21,664 |
| – Long to Short Ratio: | 1.7 to 1 | 0.8 to 1 | 2.0 to 1 |
| NET POSITION TREND: | |||
| – COT Index Score (3 Year Range Pct): | 74.2 | 22.6 | 81.7 |
| – COT Index Reading (3 Year Range): | Bullish | Bearish | Bullish-Extreme |
| NET POSITION MOVEMENT INDEX: | |||
| – 6-Week Change in Strength Index: | 5.6 | -4.2 | -0.7 |
Bloomberg Commodity Index Futures :
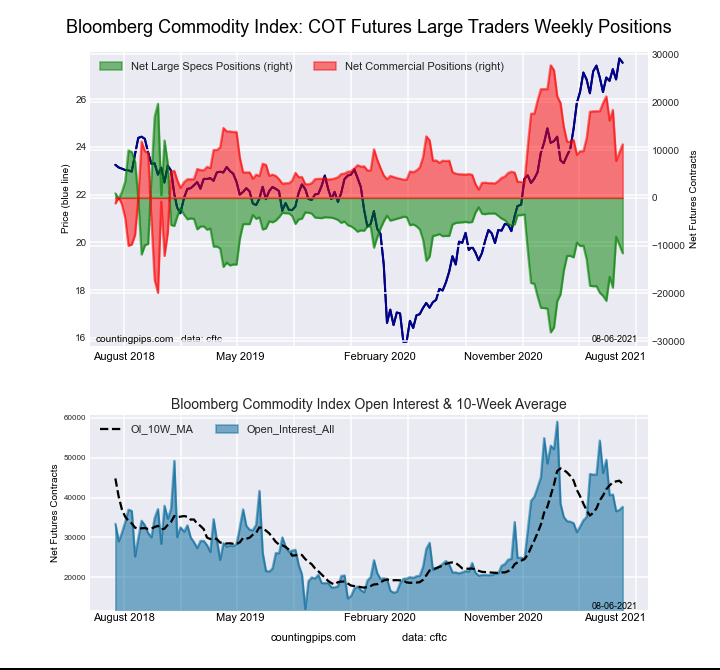 The Bloomberg Commodity Index Futures large speculator standing this week resulted in a net position of -11,576 contracts in the data reported through Tuesday. This was a weekly decline of -1,749 contracts from the previous week which had a total of -9,827 net contracts.
This week’s current strength score (the trader positioning range over the past three years, measured from 0 to 100) shows the speculators are currently Bearish with a score of 34.6 percent. The commercials are Bullish with a score of 65.3 percent and the small traders (not shown in chart) are Bearish with a score of 40.3 percent.
| Bloomberg Index Futures Statistics | SPECULATORS | COMMERCIALS | SMALL TRADERS |
| – Percent of Open Interest Longs: | 59.4 | 38.8 | 1.3 |
| – Percent of Open Interest Shorts: | 90.1 | 9.0 | 0.3 |
| – Net Position: | -11,576 | 11,211 | 365 |
| – Gross Longs: | 22,383 | 14,611 | 474 |
| – Gross Shorts: | 33,959 | 3,400 | 109 |
| – Long to Short Ratio: | 0.7 to 1 | 4.3 to 1 | 4.3 to 1 |
| NET POSITION TREND: | |||
| – COT Index Score (3 Year Range Pct): | 34.6 | 65.3 | 40.3 |
| – COT Index Reading (3 Year Range): | Bearish | Bullish | Bearish |
| NET POSITION MOVEMENT INDEX: | |||
| – 6-Week Change in Strength Index: | 18.6 | -18.2 | -11.5 |
Article By CountingPips.com – Receive our weekly COT Reports by Email
*COT Report: The COT data, released weekly to the public each Friday, is updated through the most recent Tuesday (data is 3 days old) and shows a quick view of how large speculators or non-commercials (for-profit traders) were positioned in the futures markets.
The CFTC categorizes trader positions according to commercial hedgers (traders who use futures contracts for hedging as part of the business), non-commercials (large traders who speculate to realize trading profits) and nonreportable traders (usually small traders/speculators).
Find CFTC criteria here: (http://www.cftc.gov/MarketReports/CommitmentsofTraders/ExplanatoryNotes/index.htm).

- The Tech‑heavy NASDAQ Index jumped by more than 3.3%. The offshore yuan is trading at its highest level since 2023 Jul 31, 2026
- USD/JPY After Volatility: Multiple Events in One Day Jul 31, 2026
- The US indices sell off amid renewed US-Iran clashes. Oil jumps by 7% Jul 30, 2026
- USD/JPY Temporary in Equilibrium: Multiple Factors in Focus Jul 30, 2026
- GBP/USD at Month’s Lows: The Outlook Remains Weak Jul 29, 2026
- Crude oil falls below $80 per barrel. Australia sees inflation slowdown Jul 29, 2026
- The US Tech sector hit by sell‑off. Oil prices decline on renewed negotiations Jul 28, 2026
- Gold Declines, Focus on Fed and Falling Oil Prices Jul 28, 2026
- This week will be one of the most crowded for central‑bank meetings Jul 27, 2026
- EUR/USD Ahead of a Key Week: Holding Near Lows Jul 27, 2026