
By CountingPips.com COT Home | Data Tables | Data Downloads | Newsletter
Here are the latest charts and statistics for the Commitment of Traders (COT) data published by the Commodities Futures Trading Commission (CFTC).
The latest COT data is updated through Tuesday July 27 2021 and shows a quick view of how large traders (for-profit speculators and commercial entities) were positioned in the futures markets.
VIX Volatility Futures:
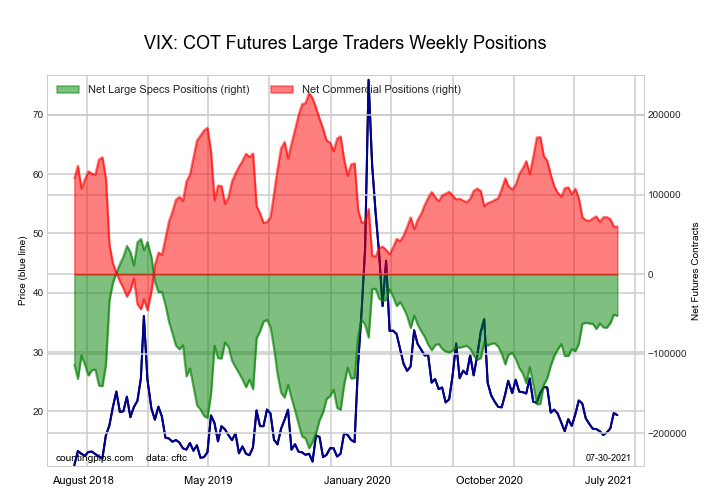 The VIX Volatility large speculator standing this week recorded a net position of -52,055 contracts in the data reported through Tuesday. This was a weekly decline of -1,317 contracts from the previous week which had a total of -50,738 net contracts.
This week’s current strength score (the trader positioning range over the past three years, measured from 0 to 100) shows the speculators are currently Bullish with a score of 63.3 percent. The commercials are Bearish with a score of 38.6 percent and the small traders (not shown in chart) are Bearish with a score of 26.1 percent.
| VIX Volatility Futures Statistics | SPECULATORS | COMMERCIALS | SMALL TRADERS |
| – Percent of Open Interest Longs: | 22.2 | 52.1 | 6.3 |
| – Percent of Open Interest Shorts: | 39.4 | 32.3 | 8.9 |
| – Net Position: | -52,055 | 60,030 | -7,975 |
| – Gross Longs: | 67,107 | 157,659 | 19,052 |
| – Gross Shorts: | 119,162 | 97,629 | 27,027 |
| – Long to Short Ratio: | 0.6 to 1 | 1.6 to 1 | 0.7 to 1 |
| NET POSITION TREND: | |||
| – COT Index Score (3 Year Range Pct): | 63.3 | 38.6 | 26.1 |
| – COT Index Reading (3 Year Range): | Bullish | Bearish | Bearish |
| NET POSITION MOVEMENT INDEX: | |||
| – 6-Week Change in Strength Index: | 6.4 | -4.6 | -15.5 |
Free Reports:
 Sign Up for Our Stock Market Newsletter – Get updated on News, Charts & Rankings of Public Companies when you join our Stocks Newsletter
 Get our Weekly Commitment of Traders Reports - See where the biggest traders (Hedge Funds and Commercial Hedgers) are positioned in the futures markets on a weekly basis.
S&P500 Mini Futures:
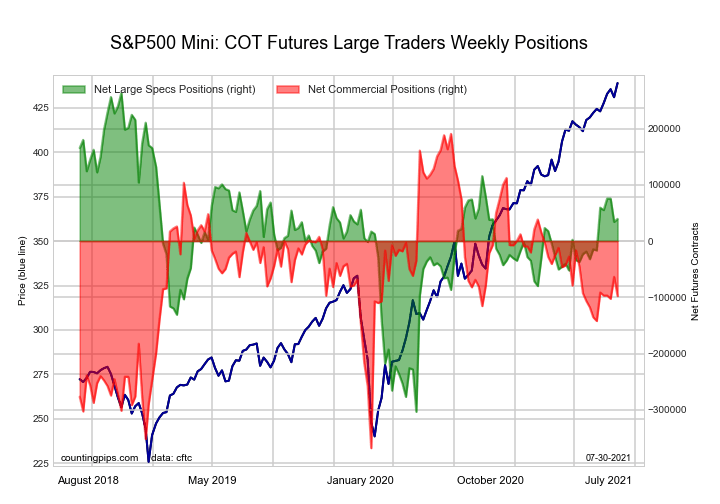 The S&P500 Mini large speculator standing this week recorded a net position of 39,375 contracts in the data reported through Tuesday. This was a weekly gain of 5,197 contracts from the previous week which had a total of 34,178 net contracts.
This week’s current strength score (the trader positioning range over the past three years, measured from 0 to 100) shows the speculators are currently Bullish with a score of 60.5 percent. The commercials are Bearish with a score of 48.4 percent and the small traders (not shown in chart) are Bearish with a score of 38.6 percent.
| S&P500 Mini Futures Statistics | SPECULATORS | COMMERCIALS | SMALL TRADERS |
| – Percent of Open Interest Longs: | 15.8 | 69.4 | 11.6 |
| – Percent of Open Interest Shorts: | 14.3 | 73.1 | 9.4 |
| – Net Position: | 39,375 | -97,689 | 58,314 |
| – Gross Longs: | 421,612 | 1,851,215 | 308,790 |
| – Gross Shorts: | 382,237 | 1,948,904 | 250,476 |
| – Long to Short Ratio: | 1.1 to 1 | 0.9 to 1 | 1.2 to 1 |
| NET POSITION TREND: | |||
| – COT Index Score (3 Year Range Pct): | 60.5 | 48.4 | 38.6 |
| – COT Index Reading (3 Year Range): | Bullish | Bearish | Bearish |
| NET POSITION MOVEMENT INDEX: | |||
| – 6-Week Change in Strength Index: | 9.9 | 7.9 | -21.0 |
Dow Jones Mini Futures:
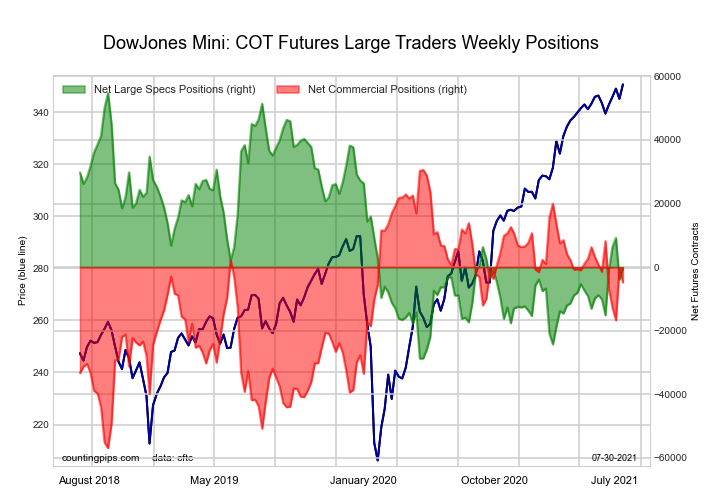 The Dow Jones Mini large speculator standing this week recorded a net position of -373 contracts in the data reported through Tuesday. This was a weekly gain of 3,547 contracts from the previous week which had a total of -3,920 net contracts.
This week’s current strength score (the trader positioning range over the past three years, measured from 0 to 100) shows the speculators are currently Bearish with a score of 34.0 percent. The commercials are Bullish with a score of 59.6 percent and the small traders (not shown in chart) are Bullish with a score of 66.2 percent.
| Dow Jones Mini Futures Statistics | SPECULATORS | COMMERCIALS | SMALL TRADERS |
| – Percent of Open Interest Longs: | 39.6 | 41.6 | 17.2 |
| – Percent of Open Interest Shorts: | 39.9 | 46.3 | 12.2 |
| – Net Position: | -373 | -4,816 | 5,189 |
| – Gross Longs: | 40,566 | 42,640 | 17,665 |
| – Gross Shorts: | 40,939 | 47,456 | 12,476 |
| – Long to Short Ratio: | 1.0 to 1 | 0.9 to 1 | 1.4 to 1 |
| NET POSITION TREND: | |||
| – COT Index Score (3 Year Range Pct): | 34.0 | 59.6 | 66.2 |
| – COT Index Reading (3 Year Range): | Bearish | Bullish | Bullish |
| NET POSITION MOVEMENT INDEX: | |||
| – 6-Week Change in Strength Index: | 11.6 | -3.9 | -33.8 |
Nasdaq Mini Futures:
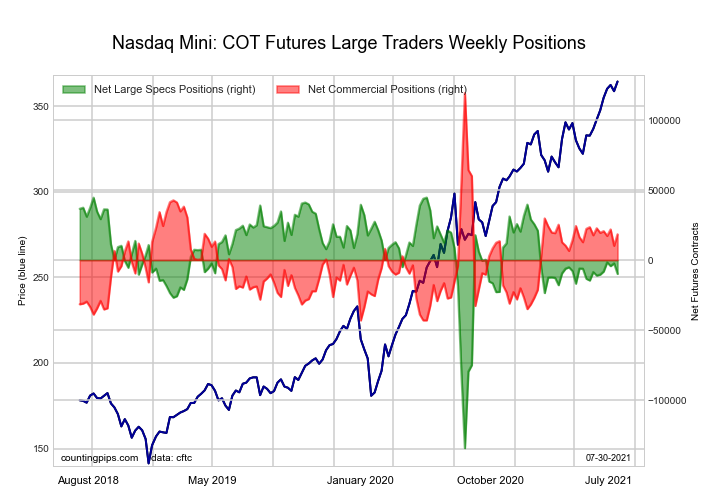 The Nasdaq Mini large speculator standing this week recorded a net position of -9,825 contracts in the data reported through Tuesday. This was a weekly decline of -7,543 contracts from the previous week which had a total of -2,282 net contracts.
This week’s current strength score (the trader positioning range over the past three years, measured from 0 to 100) shows the speculators are currently Bullish with a score of 69.5 percent. The commercials are Bearish with a score of 37.9 percent and the small traders (not shown in chart) are Bearish with a score of 24.6 percent.
| Nasdaq Mini Futures Statistics | SPECULATORS | COMMERCIALS | SMALL TRADERS |
| – Percent of Open Interest Longs: | 27.2 | 56.4 | 14.7 |
| – Percent of Open Interest Shorts: | 31.4 | 48.5 | 18.4 |
| – Net Position: | -9,825 | 18,467 | -8,642 |
| – Gross Longs: | 63,838 | 132,384 | 34,607 |
| – Gross Shorts: | 73,663 | 113,917 | 43,249 |
| – Long to Short Ratio: | 0.9 to 1 | 1.2 to 1 | 0.8 to 1 |
| NET POSITION TREND: | |||
| – COT Index Score (3 Year Range Pct): | 69.5 | 37.9 | 24.6 |
| – COT Index Reading (3 Year Range): | Bullish | Bearish | Bearish |
| NET POSITION MOVEMENT INDEX: | |||
| – 6-Week Change in Strength Index: | 0.7 | -2.6 | 6.9 |
Russell 2000 Mini Futures:
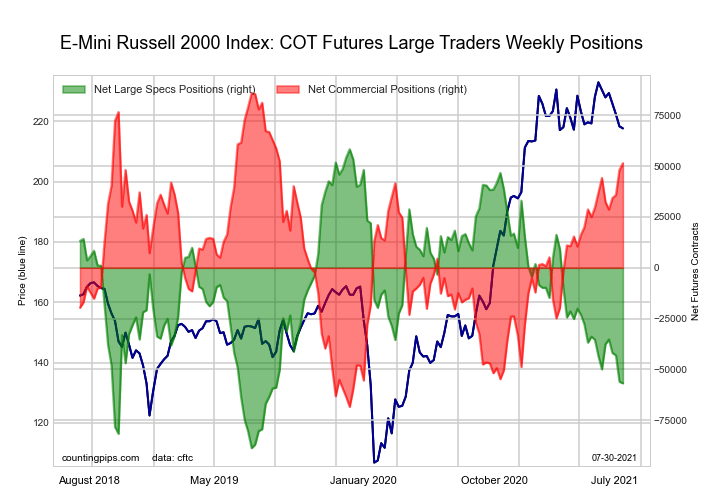 The Russell 2000 Mini large speculator standing this week recorded a net position of -56,850 contracts in the data reported through Tuesday. This was a weekly reduction of -822 contracts from the previous week which had a total of -56,028 net contracts.
This week’s current strength score (the trader positioning range over the past three years, measured from 0 to 100) shows the speculators are currently Bearish with a score of 21.7 percent. The commercials are Bullish with a score of 77.7 percent and the small traders (not shown in chart) are Bearish with a score of 48.2 percent.
| Russell 2000 Mini Futures Statistics | SPECULATORS | COMMERCIALS | SMALL TRADERS |
| – Percent of Open Interest Longs: | 12.7 | 79.8 | 6.4 |
| – Percent of Open Interest Shorts: | 25.1 | 68.6 | 5.3 |
| – Net Position: | -56,850 | 51,501 | 5,349 |
| – Gross Longs: | 57,951 | 364,893 | 29,369 |
| – Gross Shorts: | 114,801 | 313,392 | 24,020 |
| – Long to Short Ratio: | 0.5 to 1 | 1.2 to 1 | 1.2 to 1 |
| NET POSITION TREND: | |||
| – COT Index Score (3 Year Range Pct): | 21.7 | 77.7 | 48.2 |
| – COT Index Reading (3 Year Range): | Bearish | Bullish | Bearish |
| NET POSITION MOVEMENT INDEX: | |||
| – 6-Week Change in Strength Index: | -4.7 | 4.7 | -1.2 |
Nikkei Stock Average (USD) Futures:
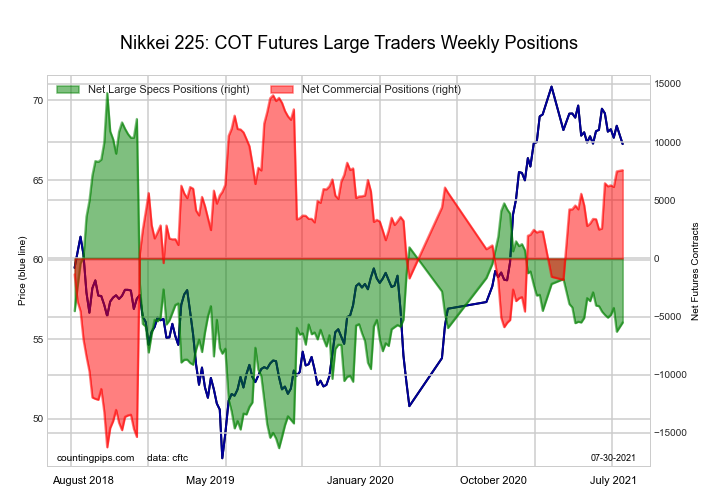 The Nikkei Stock Average (USD) large speculator standing this week recorded a net position of -5,499 contracts in the data reported through Tuesday. This was a weekly boost of 792 contracts from the previous week which had a total of -6,291 net contracts.
This week’s current strength score (the trader positioning range over the past three years, measured from 0 to 100) shows the speculators are currently Bearish with a score of 35.4 percent. The commercials are Bullish with a score of 78.7 percent and the small traders (not shown in chart) are Bearish-Extreme with a score of 0.0 percent.
| Nikkei Stock Average Futures Statistics | SPECULATORS | COMMERCIALS | SMALL TRADERS |
| – Percent of Open Interest Longs: | 14.9 | 60.4 | 24.7 |
| – Percent of Open Interest Shorts: | 49.9 | 12.1 | 38.0 |
| – Net Position: | -5,499 | 7,587 | -2,088 |
| – Gross Longs: | 2,345 | 9,485 | 3,880 |
| – Gross Shorts: | 7,844 | 1,898 | 5,968 |
| – Long to Short Ratio: | 0.3 to 1 | 5.0 to 1 | 0.7 to 1 |
| NET POSITION TREND: | |||
| – COT Index Score (3 Year Range Pct): | 35.4 | 78.7 | 0.0 |
| – COT Index Reading (3 Year Range): | Bearish | Bullish | Bearish-Extreme |
| NET POSITION MOVEMENT INDEX: | |||
| – 6-Week Change in Strength Index: | -3.1 | 16.5 | -45.3 |
MSCI EAFE Mini Futures:
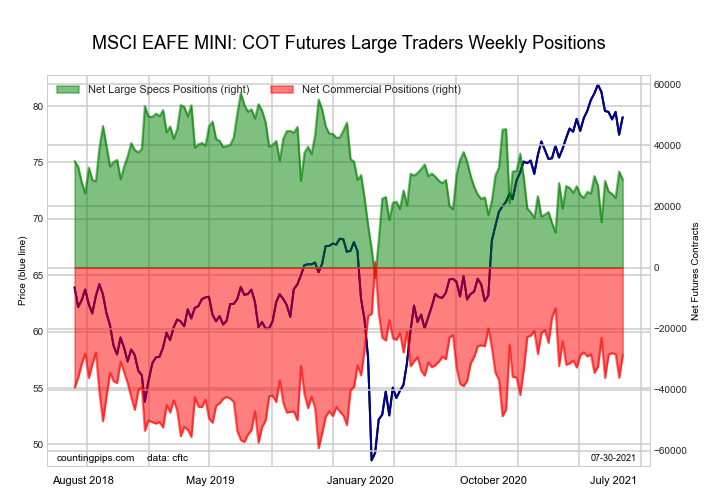 The MSCI EAFE Mini large speculator standing this week recorded a net position of 28,785 contracts in the data reported through Tuesday. This was a weekly reduction of -2,667 contracts from the previous week which had a total of 31,452 net contracts.
This week’s current strength score (the trader positioning range over the past three years, measured from 0 to 100) shows the speculators are currently Bullish with a score of 53.1 percent. The commercials are Bearish with a score of 50.0 percent and the small traders (not shown in chart) are Bearish-Extreme with a score of 14.6 percent.
| MSCI EAFE Mini Futures Statistics | SPECULATORS | COMMERCIALS | SMALL TRADERS |
| – Percent of Open Interest Longs: | 9.5 | 87.9 | 2.4 |
| – Percent of Open Interest Shorts: | 2.8 | 94.5 | 2.4 |
| – Net Position: | 28,785 | -28,661 | -124 |
| – Gross Longs: | 41,106 | 381,338 | 10,220 |
| – Gross Shorts: | 12,321 | 409,999 | 10,344 |
| – Long to Short Ratio: | 3.3 to 1 | 0.9 to 1 | 1.0 to 1 |
| NET POSITION TREND: | |||
| – COT Index Score (3 Year Range Pct): | 53.1 | 50.0 | 14.6 |
| – COT Index Reading (3 Year Range): | Bullish | Bearish | Bearish-Extreme |
| NET POSITION MOVEMENT INDEX: | |||
| – 6-Week Change in Strength Index: | 22.9 | -9.1 | -75.3 |
MSCI Emerging Mkts Mini Futures:
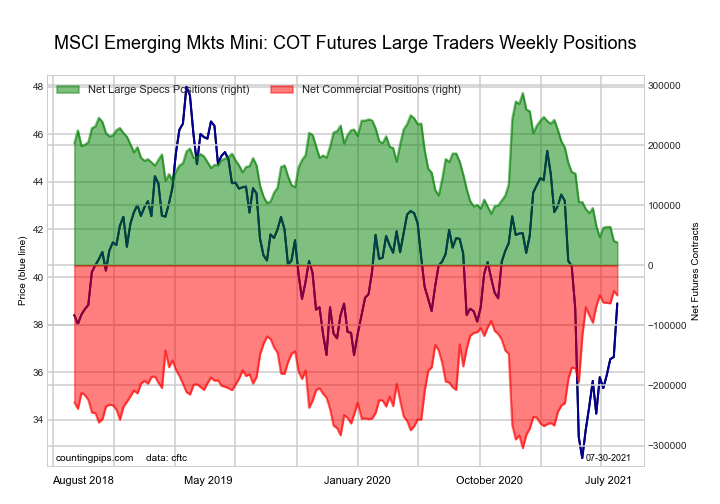 The MSCI Emerging Mkts Mini large speculator standing this week recorded a net position of 38,211 contracts in the data reported through Tuesday. This was a weekly fall of -2,219 contracts from the previous week which had a total of 40,430 net contracts.
This week’s current strength score (the trader positioning range over the past three years, measured from 0 to 100) shows the speculators are currently Bearish-Extreme with a score of 0.0 percent. The commercials are Bullish-Extreme with a score of 97.2 percent and the small traders (not shown in chart) are Bearish with a score of 40.4 percent.
| MSCI Emerging Mkts Mini Futures Statistics | SPECULATORS | COMMERCIALS | SMALL TRADERS |
| – Percent of Open Interest Longs: | 14.3 | 82.2 | 2.4 |
| – Percent of Open Interest Shorts: | 11.0 | 86.5 | 1.3 |
| – Net Position: | 38,211 | -49,886 | 11,675 |
| – Gross Longs: | 165,150 | 950,685 | 27,250 |
| – Gross Shorts: | 126,939 | 1,000,571 | 15,575 |
| – Long to Short Ratio: | 1.3 to 1 | 1.0 to 1 | 1.7 to 1 |
| NET POSITION TREND: | |||
| – COT Index Score (3 Year Range Pct): | 0.0 | 97.2 | 40.4 |
| – COT Index Reading (3 Year Range): | Bearish-Extreme | Bullish-Extreme | Bearish |
| NET POSITION MOVEMENT INDEX: | |||
| – 6-Week Change in Strength Index: | -11.0 | 6.8 | 7.3 |
Article By CountingPips.com – Receive our weekly COT Reports by Email
*COT Report: The COT data, released weekly to the public each Friday, is updated through the most recent Tuesday (data is 3 days old) and shows a quick view of how large speculators or non-commercials (for-profit traders) were positioned in the futures markets.
The CFTC categorizes trader positions according to commercial hedgers (traders who use futures contracts for hedging as part of the business), non-commercials (large traders who speculate to realize trading profits) and nonreportable traders (usually small traders/speculators).
Find CFTC criteria here: (http://www.cftc.gov/MarketReports/CommitmentsofTraders/ExplanatoryNotes/index.htm).

- The Tech‑heavy NASDAQ Index jumped by more than 3.3%. The offshore yuan is trading at its highest level since 2023 Jul 31, 2026
- USD/JPY After Volatility: Multiple Events in One Day Jul 31, 2026
- The US indices sell off amid renewed US-Iran clashes. Oil jumps by 7% Jul 30, 2026
- USD/JPY Temporary in Equilibrium: Multiple Factors in Focus Jul 30, 2026
- GBP/USD at Month’s Lows: The Outlook Remains Weak Jul 29, 2026
- Crude oil falls below $80 per barrel. Australia sees inflation slowdown Jul 29, 2026
- The US Tech sector hit by sell‑off. Oil prices decline on renewed negotiations Jul 28, 2026
- Gold Declines, Focus on Fed and Falling Oil Prices Jul 28, 2026
- This week will be one of the most crowded for central‑bank meetings Jul 27, 2026
- EUR/USD Ahead of a Key Week: Holding Near Lows Jul 27, 2026