
By CountingPips.com COT Home | Data Tables | Data Downloads | Newsletter
Here are the latest charts and statistics for the Commitment of Traders (COT) data published by the Commodities Futures Trading Commission (CFTC).
The latest COT data is updated through Tuesday July 27 2021 and shows a quick view of how large traders (for-profit speculators and commercial entities) were positioned in the futures markets.
3-Month Eurodollars Futures:
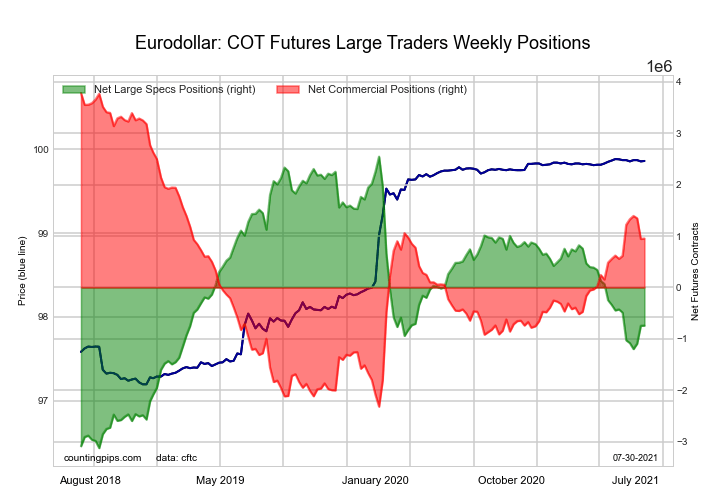 The 3-Month Eurodollars large speculator standing this week was a net position of -740,875 contracts in the data reported through Tuesday. This was a weekly boost of 4,060 contracts from the previous week which had a total of -744,935 net contracts.
This week’s current strength score (the trader positioning range over the past three years, measured from 0 to 100) shows the speculators are currently Bearish with a score of 42.0 percent. The commercials are Bullish with a score of 53.6 percent and the small traders (not shown in chart) are Bullish with a score of 75.4 percent.
| 3-Month Eurodollars Statistics | SPECULATORS | COMMERCIALS | SMALL TRADERS |
| – Percent of Open Interest Longs: | 15.5 | 59.1 | 5.0 |
| – Percent of Open Interest Shorts: | 21.7 | 51.1 | 6.8 |
| – Net Position: | -740,875 | 951,440 | -210,565 |
| – Gross Longs: | 1,867,231 | 7,095,708 | 604,249 |
| – Gross Shorts: | 2,608,106 | 6,144,268 | 814,814 |
| – Long to Short Ratio: | 0.7 to 1 | 1.2 to 1 | 0.7 to 1 |
| NET POSITION TREND: | |||
| – COT Index Score (3 Year Range Pct): | 42.0 | 53.6 | 75.4 |
| – COT Index Reading (3 Year Range): | Bearish | Bullish | Bullish |
| NET POSITION MOVEMENT INDEX: | |||
| – 6-Week Change in Strength Index: | -4.5 | 5.5 | -10.7 |
Free Reports:
 Download Our Metatrader 4 Indicators – Put Our Free MetaTrader 4 Custom Indicators on your charts when you join our Weekly Newsletter
 Get our Weekly Commitment of Traders Reports - See where the biggest traders (Hedge Funds and Commercial Hedgers) are positioned in the futures markets on a weekly basis.
30-Day Federal Funds Futures:
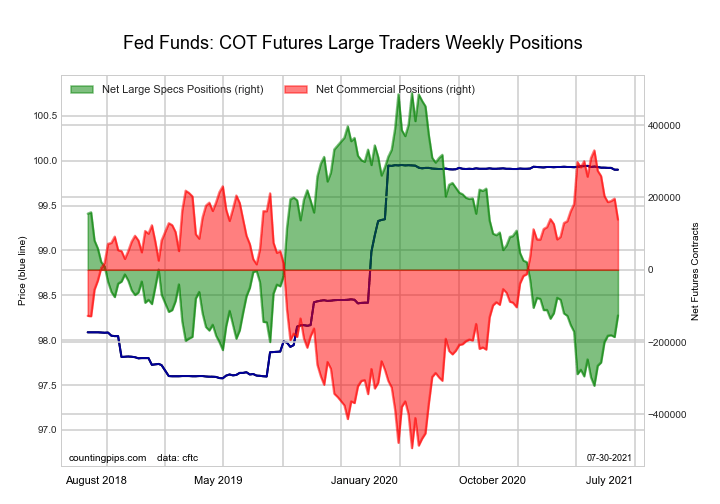 The 30-Day Federal Funds large speculator standing this week was a net position of -126,555 contracts in the data reported through Tuesday. This was a weekly increase of 59,379 contracts from the previous week which had a total of -185,934 net contracts.
This week’s current strength score (the trader positioning range over the past three years, measured from 0 to 100) shows the speculators are currently Bearish with a score of 24.0 percent. The commercials are Bullish with a score of 76.7 percent and the small traders (not shown in chart) are Bearish with a score of 48.8 percent.
| 30-Day Federal Funds Statistics | SPECULATORS | COMMERCIALS | SMALL TRADERS |
| – Percent of Open Interest Longs: | 5.4 | 75.7 | 2.1 |
| – Percent of Open Interest Shorts: | 17.1 | 62.9 | 3.2 |
| – Net Position: | -126,555 | 138,816 | -12,261 |
| – Gross Longs: | 58,687 | 822,091 | 22,595 |
| – Gross Shorts: | 185,242 | 683,275 | 34,856 |
| – Long to Short Ratio: | 0.3 to 1 | 1.2 to 1 | 0.6 to 1 |
| NET POSITION TREND: | |||
| – COT Index Score (3 Year Range Pct): | 24.0 | 76.7 | 48.8 |
| – COT Index Reading (3 Year Range): | Bearish | Bullish | Bearish |
| NET POSITION MOVEMENT INDEX: | |||
| – 6-Week Change in Strength Index: | 17.2 | -16.4 | -6.8 |
2-Year Treasury Note Futures:
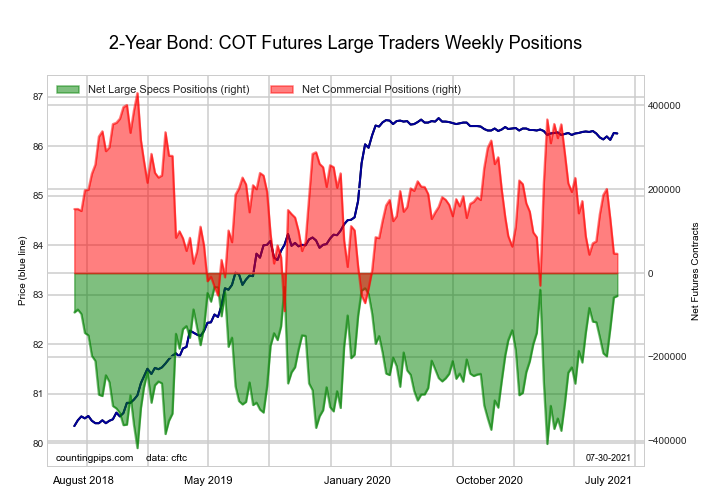 The 2-Year Treasury Note large speculator standing this week was a net position of -54,331 contracts in the data reported through Tuesday. This was a weekly increase of 3,752 contracts from the previous week which had a total of -58,083 net contracts.
This week’s current strength score (the trader positioning range over the past three years, measured from 0 to 100) shows the speculators are currently Bullish-Extreme with a score of 94.4 percent. The commercials are Bearish with a score of 26.3 percent and the small traders (not shown in chart) are Bearish with a score of 39.2 percent.
| 2-Year Treasury Note Statistics | SPECULATORS | COMMERCIALS | SMALL TRADERS |
| – Percent of Open Interest Longs: | 18.9 | 71.6 | 7.1 |
| – Percent of Open Interest Shorts: | 21.7 | 69.3 | 6.7 |
| – Net Position: | -54,331 | 46,056 | 8,275 |
| – Gross Longs: | 373,471 | 1,414,480 | 141,166 |
| – Gross Shorts: | 427,802 | 1,368,424 | 132,891 |
| – Long to Short Ratio: | 0.9 to 1 | 1.0 to 1 | 1.1 to 1 |
| NET POSITION TREND: | |||
| – COT Index Score (3 Year Range Pct): | 94.4 | 26.3 | 39.2 |
| – COT Index Reading (3 Year Range): | Bullish-Extreme | Bearish | Bearish |
| NET POSITION MOVEMENT INDEX: | |||
| – 6-Week Change in Strength Index: | 16.3 | -5.7 | -17.4 |
5-Year Treasury Note Futures:
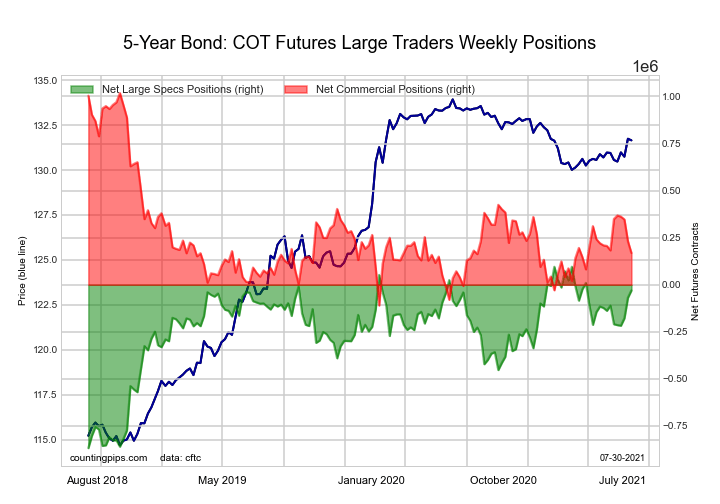 The 5-Year Treasury Note large speculator standing this week was a net position of -30,025 contracts in the data reported through Tuesday. This was a weekly gain of 39,009 contracts from the previous week which had a total of -69,034 net contracts.
This week’s current strength score (the trader positioning range over the past three years, measured from 0 to 100) shows the speculators are currently Bullish-Extreme with a score of 87.0 percent. The commercials are Bearish with a score of 24.7 percent and the small traders (not shown in chart) are Bearish-Extreme with a score of 12.7 percent.
| 5-Year Treasury Note Statistics | SPECULATORS | COMMERCIALS | SMALL TRADERS |
| – Percent of Open Interest Longs: | 14.3 | 75.7 | 8.4 |
| – Percent of Open Interest Shorts: | 15.1 | 70.8 | 12.4 |
| – Net Position: | -30,025 | 168,613 | -138,588 |
| – Gross Longs: | 496,074 | 2,633,496 | 293,649 |
| – Gross Shorts: | 526,099 | 2,464,883 | 432,237 |
| – Long to Short Ratio: | 0.9 to 1 | 1.1 to 1 | 0.7 to 1 |
| NET POSITION TREND: | |||
| – COT Index Score (3 Year Range Pct): | 87.0 | 24.7 | 12.7 |
| – COT Index Reading (3 Year Range): | Bullish-Extreme | Bearish | Bearish-Extreme |
| NET POSITION MOVEMENT INDEX: | |||
| – 6-Week Change in Strength Index: | 8.4 | -1.2 | -28.0 |
10-Year Treasury Note Futures:
 The 10-Year Treasury Note large speculator standing this week was a net position of 164,491 contracts in the data reported through Tuesday. This was a weekly boost of 75,565 contracts from the previous week which had a total of 88,926 net contracts.
This week’s current strength score (the trader positioning range over the past three years, measured from 0 to 100) shows the speculators are currently Bullish-Extreme with a score of 99.0 percent. The commercials are Bearish with a score of 21.3 percent and the small traders (not shown in chart) are Bearish with a score of 21.0 percent.
| 10-Year Treasury Note Statistics | SPECULATORS | COMMERCIALS | SMALL TRADERS |
| – Percent of Open Interest Longs: | 22.3 | 66.6 | 9.0 |
| – Percent of Open Interest Shorts: | 18.2 | 65.7 | 14.0 |
| – Net Position: | 164,491 | 36,905 | -201,396 |
| – Gross Longs: | 906,368 | 2,710,030 | 367,441 |
| – Gross Shorts: | 741,877 | 2,673,125 | 568,837 |
| – Long to Short Ratio: | 1.2 to 1 | 1.0 to 1 | 0.6 to 1 |
| NET POSITION TREND: | |||
| – COT Index Score (3 Year Range Pct): | 99.0 | 21.3 | 21.0 |
| – COT Index Reading (3 Year Range): | Bullish-Extreme | Bearish | Bearish |
| NET POSITION MOVEMENT INDEX: | |||
| – 6-Week Change in Strength Index: | 14.0 | -16.7 | 11.6 |
Ultra 10-Year Notes Futures:
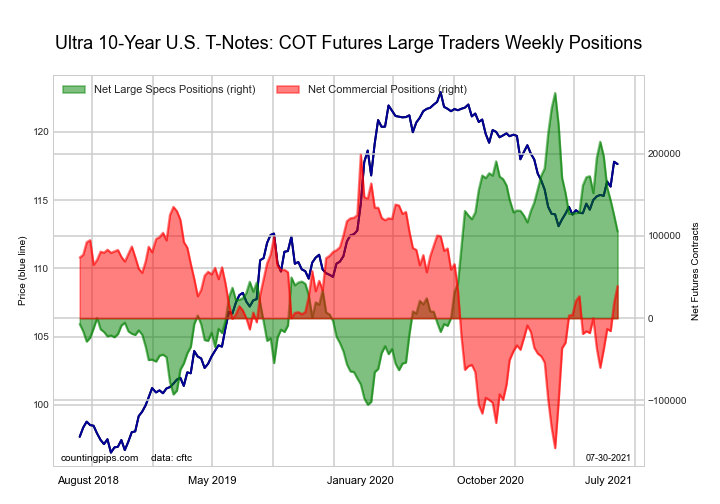 The Ultra 10-Year Notes large speculator standing this week was a net position of 105,428 contracts in the data reported through Tuesday. This was a weekly decline of -19,386 contracts from the previous week which had a total of 124,814 net contracts.
This week’s current strength score (the trader positioning range over the past three years, measured from 0 to 100) shows the speculators are currently Bullish with a score of 55.6 percent. The commercials are Bullish with a score of 55.2 percent and the small traders (not shown in chart) are Bearish-Extreme with a score of 10.7 percent.
| Ultra 10-Year Notes Statistics | SPECULATORS | COMMERCIALS | SMALL TRADERS |
| – Percent of Open Interest Longs: | 14.8 | 76.3 | 8.5 |
| – Percent of Open Interest Shorts: | 7.8 | 73.7 | 18.2 |
| – Net Position: | 105,428 | 39,203 | -144,631 |
| – Gross Longs: | 220,903 | 1,136,010 | 126,680 |
| – Gross Shorts: | 115,475 | 1,096,807 | 271,311 |
| – Long to Short Ratio: | 1.9 to 1 | 1.0 to 1 | 0.5 to 1 |
| NET POSITION TREND: | |||
| – COT Index Score (3 Year Range Pct): | 55.6 | 55.2 | 10.7 |
| – COT Index Reading (3 Year Range): | Bullish | Bullish | Bearish-Extreme |
| NET POSITION MOVEMENT INDEX: | |||
| – 6-Week Change in Strength Index: | -23.5 | 21.2 | 10.2 |
US Treasury Bonds Futures:
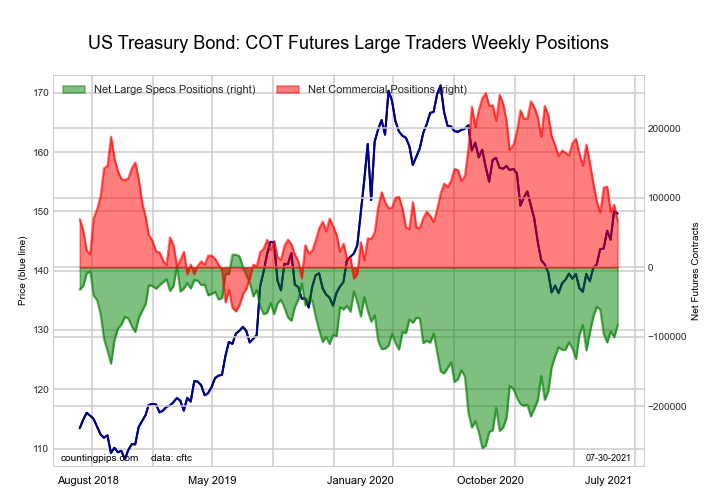 The US Treasury Bonds large speculator standing this week was a net position of -82,915 contracts in the data reported through Tuesday. This was a weekly increase of 17,693 contracts from the previous week which had a total of -100,608 net contracts.
This week’s current strength score (the trader positioning range over the past three years, measured from 0 to 100) shows the speculators are currently Bullish with a score of 63.6 percent. The commercials are Bearish with a score of 41.4 percent and the small traders (not shown in chart) are Bullish with a score of 65.4 percent.
| US Treasury Bonds Statistics | SPECULATORS | COMMERCIALS | SMALL TRADERS |
| – Percent of Open Interest Longs: | 9.9 | 72.0 | 16.2 |
| – Percent of Open Interest Shorts: | 16.9 | 66.4 | 14.9 |
| – Net Position: | -82,915 | 66,824 | 16,091 |
| – Gross Longs: | 117,946 | 853,940 | 192,630 |
| – Gross Shorts: | 200,861 | 787,116 | 176,539 |
| – Long to Short Ratio: | 0.6 to 1 | 1.1 to 1 | 1.1 to 1 |
| NET POSITION TREND: | |||
| – COT Index Score (3 Year Range Pct): | 63.6 | 41.4 | 65.4 |
| – COT Index Reading (3 Year Range): | Bullish | Bearish | Bullish |
| NET POSITION MOVEMENT INDEX: | |||
| – 6-Week Change in Strength Index: | -9.4 | -8.7 | 42.4 |
Ultra US Treasury Bonds Futures:
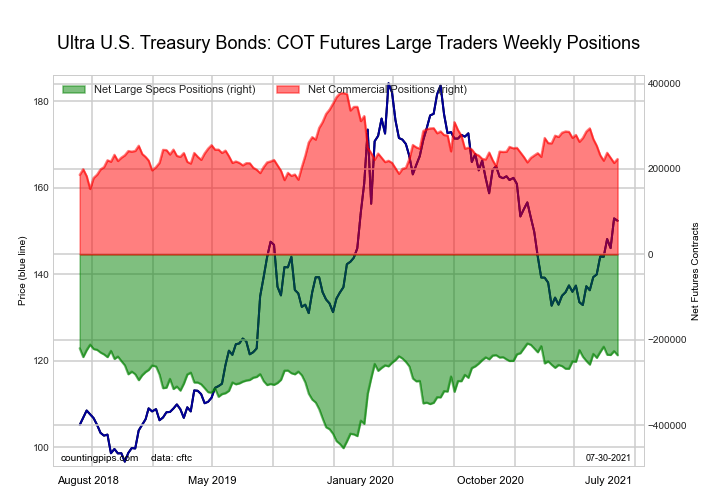 The Ultra US Treasury Bonds large speculator standing this week was a net position of -236,239 contracts in the data reported through Tuesday. This was a weekly decrease of -9,602 contracts from the previous week which had a total of -226,637 net contracts.
This week’s current strength score (the trader positioning range over the past three years, measured from 0 to 100) shows the speculators are currently Bullish-Extreme with a score of 88.9 percent. The commercials are Bearish with a score of 31.2 percent and the small traders (not shown in chart) are Bearish with a score of 37.5 percent.
| Ultra US Treasury Bonds Statistics | SPECULATORS | COMMERCIALS | SMALL TRADERS |
| – Percent of Open Interest Longs: | 9.5 | 77.9 | 12.3 |
| – Percent of Open Interest Shorts: | 28.7 | 59.8 | 11.3 |
| – Net Position: | -236,239 | 223,412 | 12,827 |
| – Gross Longs: | 117,812 | 962,619 | 152,000 |
| – Gross Shorts: | 354,051 | 739,207 | 139,173 |
| – Long to Short Ratio: | 0.3 to 1 | 1.3 to 1 | 1.1 to 1 |
| NET POSITION TREND: | |||
| – COT Index Score (3 Year Range Pct): | 88.9 | 31.2 | 37.5 |
| – COT Index Reading (3 Year Range): | Bullish-Extreme | Bearish | Bearish |
| NET POSITION MOVEMENT INDEX: | |||
| – 6-Week Change in Strength Index: | 2.5 | -13.8 | 17.8 |
Article By CountingPips.com – Receive our weekly COT Reports by Email
*COT Report: The COT data, released weekly to the public each Friday, is updated through the most recent Tuesday (data is 3 days old) and shows a quick view of how large speculators or non-commercials (for-profit traders) were positioned in the futures markets.
The CFTC categorizes trader positions according to commercial hedgers (traders who use futures contracts for hedging as part of the business), non-commercials (large traders who speculate to realize trading profits) and nonreportable traders (usually small traders/speculators).
Find CFTC criteria here: (http://www.cftc.gov/MarketReports/CommitmentsofTraders/ExplanatoryNotes/index.htm).

- The Tech‑heavy NASDAQ Index jumped by more than 3.3%. The offshore yuan is trading at its highest level since 2023 Jul 31, 2026
- USD/JPY After Volatility: Multiple Events in One Day Jul 31, 2026
- The US indices sell off amid renewed US-Iran clashes. Oil jumps by 7% Jul 30, 2026
- USD/JPY Temporary in Equilibrium: Multiple Factors in Focus Jul 30, 2026
- GBP/USD at Month’s Lows: The Outlook Remains Weak Jul 29, 2026
- Crude oil falls below $80 per barrel. Australia sees inflation slowdown Jul 29, 2026
- The US Tech sector hit by sell‑off. Oil prices decline on renewed negotiations Jul 28, 2026
- Gold Declines, Focus on Fed and Falling Oil Prices Jul 28, 2026
- This week will be one of the most crowded for central‑bank meetings Jul 27, 2026
- EUR/USD Ahead of a Key Week: Holding Near Lows Jul 27, 2026