Archive for Forex and Currency News – Page 9

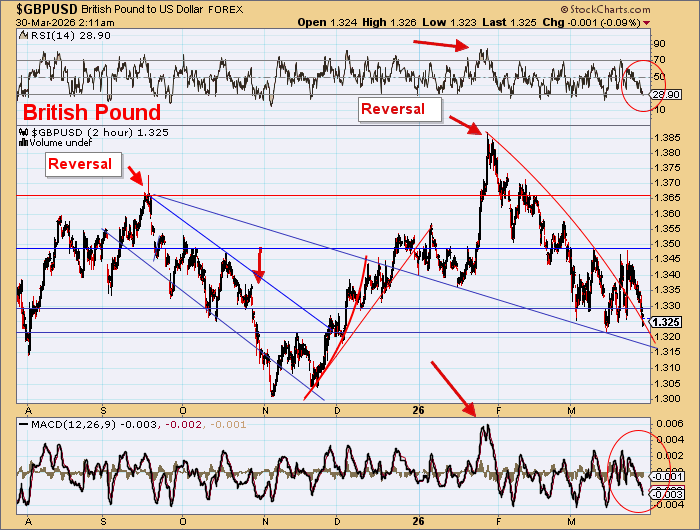
GBP/USD Managed to Rise, but Pressure Factors Remain in Place

By Analytical Department RoboForex

GBP/USD rose to 1.3450 on Wednesday. Expectations of de-escalation in the Middle East supported the pound, as lower oil prices reduced inflationary risks for the British economy, which is heavily dependent on energy imports.

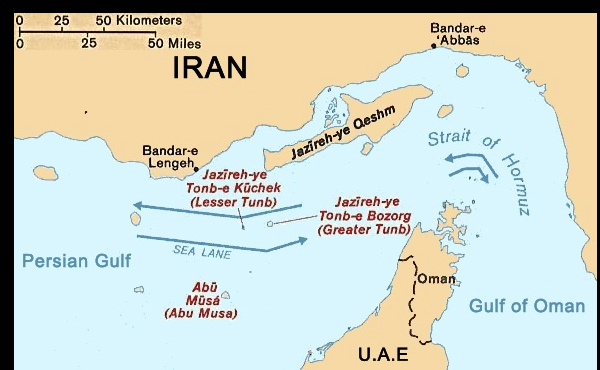
Despite this localised strengthening, investors continue to monitor the development of the conflict between the United States, Israel and Iran closely. Its consequences could significantly affect the global economy. The situation remains uncertain: US President Donald Trump has suggested the war could end soon, but Iran’s Islamic Revolutionary Guard Corps stated that oil shipments through the Strait of Hormuz will not resume while attacks by the United States and Israel continue.

Amid these external risks, investors are also revising expectations for UK monetary policy. On average, a Bank of England interest rate cut in the second quarter is now considered possible.

Domestic factors continue to weigh on the pound. Weak economic statistics and political uncertainty in the UK maintain downside risks for the currency. An additional source of tension may be the local elections, scheduled to take place in two months.

Technical Analysis

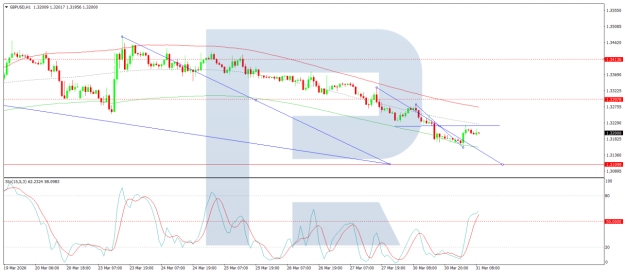
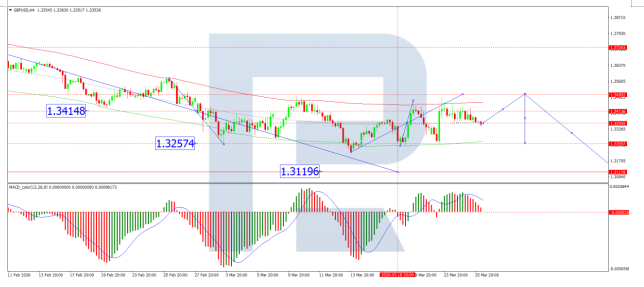
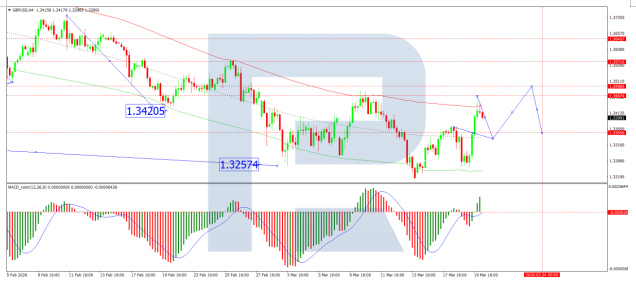
On the H4 GBP/USD chart, the market is forming a wide consolidation range around the 1.3382 level, currently extending up to 1.3474. A decline to 1.3384 is expected in the near term. Following the completion of this correction, the formation of a new consolidation range is likely. An upside breakout would open potential for a continuation wave to 1.3515, while a downside breakout would suggest further movement towards 1.3133. Technically, this scenario is confirmed by the MACD indicator, whose signal line is above the zero level and pointing strictly upwards.

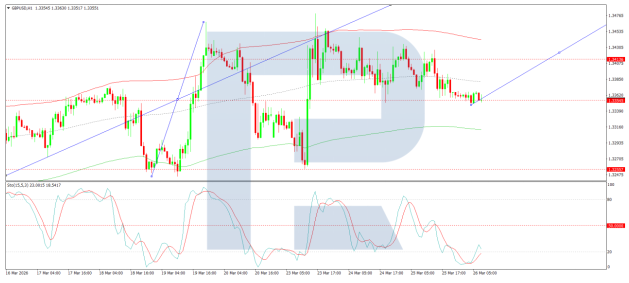
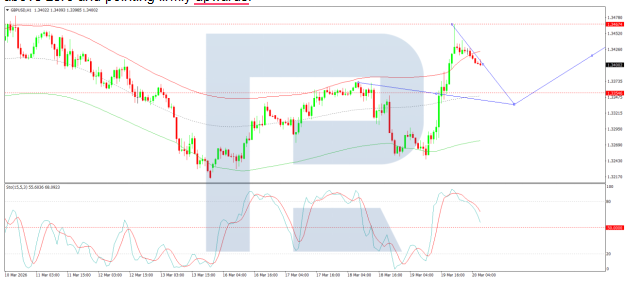
On the H1 chart, the market has formed a compact consolidation range around the 1.3434 level. A downside breakout would initiate a wave structure extending to 1.3382. Should this level be breached, further downside potential towards 1.3125 would open. Conversely, an upside breakout from the range could trigger a growth wave to the 1.3515 level. Technically, this scenario is supported by the Stochastic oscillator, with its signal line above the 50 level and pointing strictly upwards.

Conclusion

GBP/USD has found temporary relief amid hopes for Middle East de-escalation, which has helped moderate oil prices and ease inflationary concerns for the UK. However, the underlying picture remains uncertain, with geopolitical risks, domestic economic weakness, and political tensions continuing to cloud the outlook. While technical indicators suggest potential for further upside in the near term, the broader trend will likely depend on whether geopolitical conditions stabilise and whether the Bank of England signals a clearer policy direction.


Disclaimer

Any forecasts contained herein are based on the author’s particular opinion. This analysis may not be treated as trading advice. RoboForex bears no responsibility for trading results based on trading recommendations and reviews contained herein.

EUR/USD in Turbulence: Market Questions When Conflict Over Iran Will End

By Analytical Department RoboForex

EUR/USD is trading around 1.1608 on Tuesday. The US dollar attempted to recover from a sharp intraday decline the previous day, which had been driven by expectations of a faster resolution to the conflict involving Iran, temporarily reducing demand for the dollar as a safe-haven asset.

US President Donald Trump stated that the military operation in Iran is nearing completion and is progressing faster than initial estimates, which had suggested a duration of four to five weeks. He also announced plans to reduce oil sanctions and deploy US Navy ships to escort tankers through the Strait of Hormuz in an effort to contain rising oil prices.

Previously, the dollar had strengthened significantly due to safe-haven demand. The escalation of the Middle East conflict and rising energy prices had intensified fears of prolonged economic disruption and a fresh wave of inflation.

Investor attention is now shifting to macroeconomic statistics from the United States. The February consumer price index (CPI) is scheduled for release on Wednesday, followed by the January PCE index on Friday. Market participants believe these data points will not yet fully capture the conflict’s impact on inflation expectations.

Technical Analysis

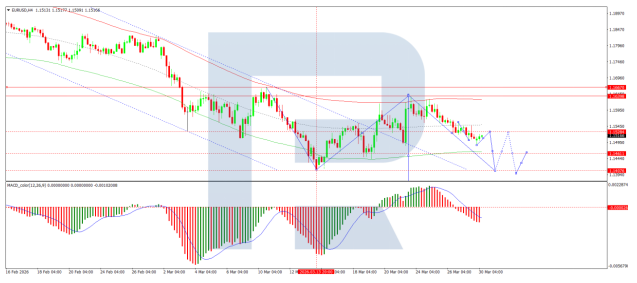
On the H4 chart of EUR/USD, the market is forming a consolidation range around the 1.1588 level. An upward wave is expected, with a continuation towards the 1.1668 level. Thereafter, the beginning of a new downward wave within the broader trend is anticipated, targeting 1.1419 as a local objective. Technically, this scenario is confirmed by the MACD indicator, whose signal line remains below zero and is pointing strictly downwards, reflecting sustained bearish momentum with potential for further downside.

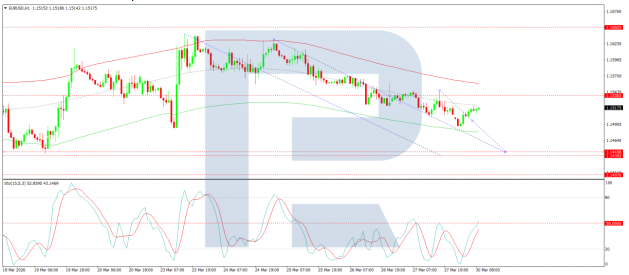
On the H1 chart, the market is forming the structure of the next growth wave towards the 1.1668 level. After reaching this level, a decline to 1.1419 is expected, followed by the initiation of a new growth wave to 1.1650. Technically, this scenario is supported by the Stochastic oscillator, with its signal line below 50 and pointing strictly upwards towards the 80 level.

Conclusion

EUR/USD remains highly sensitive to geopolitical developments, with signals of a potential de-escalation in the Iran conflict temporarily weighing on the dollar’s safe-haven appeal. However, the broader technical picture suggests any upside may be limited, with bearish momentum likely to reassert itself once the current corrective wave completes. Upcoming US inflation data will provide crucial clues about whether recent energy price increases are beginning to filter through to consumer prices, potentially influencing Fed policy expectations.


Disclaimer

Any forecasts contained herein are based on the author’s particular opinion. This analysis may not be treated as trading advice. RoboForex bears no responsibility for trading results based on trading recommendations and reviews contained herein.

Currency Speculator Positions see AUD, BRL Bets rise. Yen, Euro Bets drop

By InvestMacro

Speculators OI FX Futures COT Chart

Here are the latest charts and statistics for the Commitment of Traders (COT) data published by the Commodities Futures Trading Commission (CFTC).

The latest COT data is updated through Tuesday March 3rd and shows a quick view of how large market participants (for-profit speculators and commercial traders) were positioned in the futures markets. All currency positions are in direct relation to the US dollar where, for example, a bet for the euro is a bet that the euro will rise versus the dollar while a bet against the euro will be a bet that the euro will decline versus the dollar.

Weekly Speculator Changes led by Australian Dollar & Brazilian Real

Speculators Nets FX Futures COT Chart

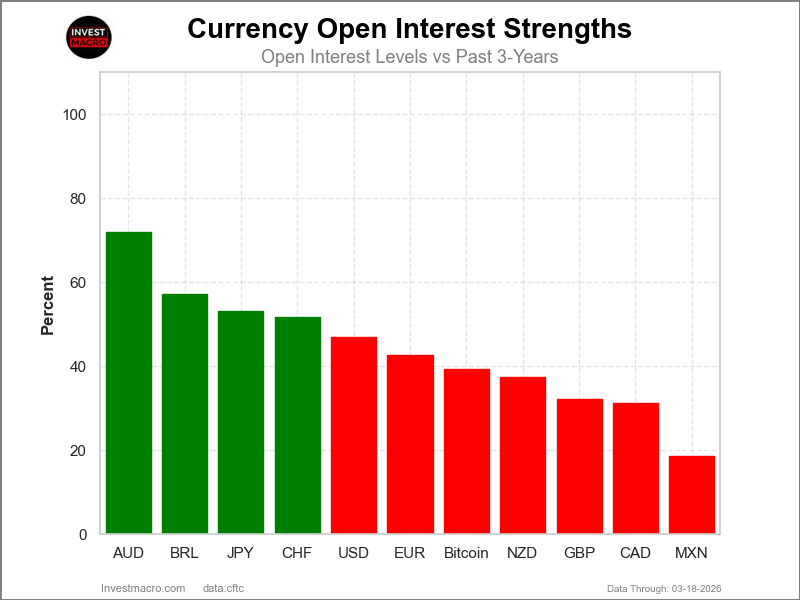
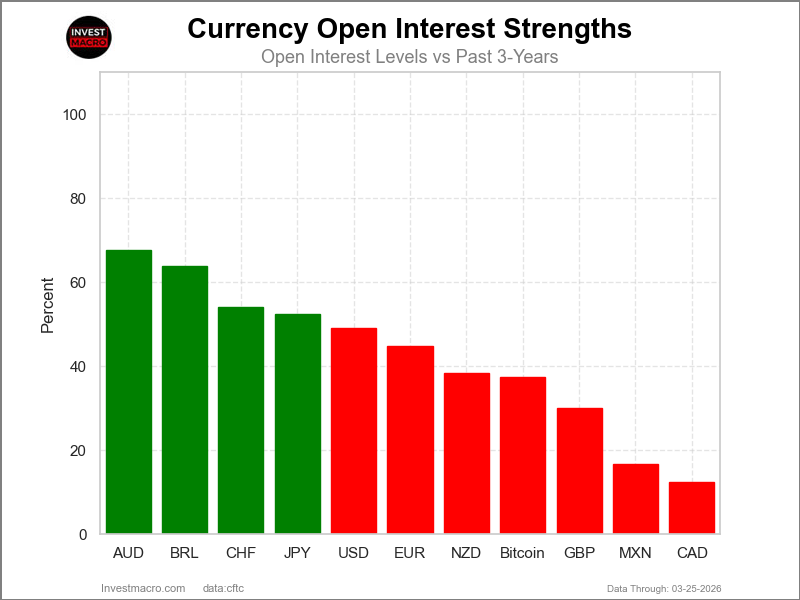
Open Interest Strength Levels show where current Open Futures Contracts are highest and lowest (higher interest can fuel trends and setup for more potential moves & vice versa) for currency markets.

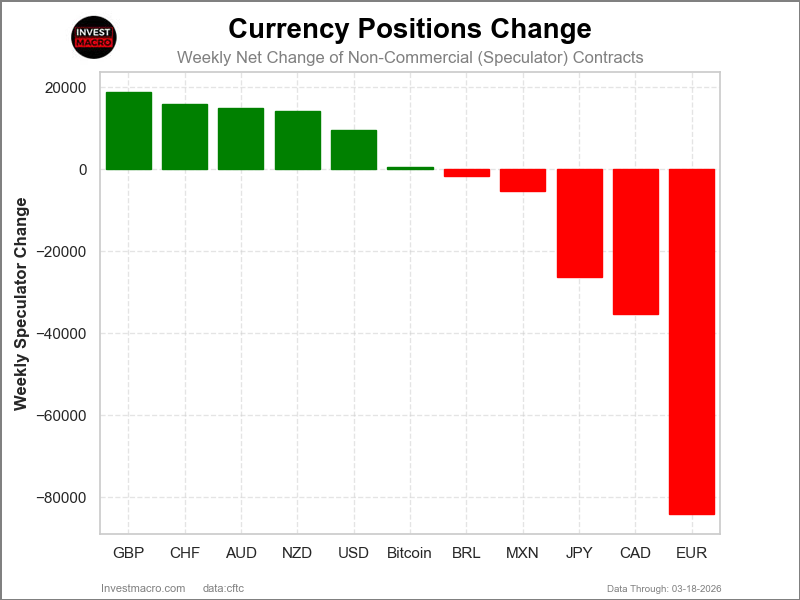
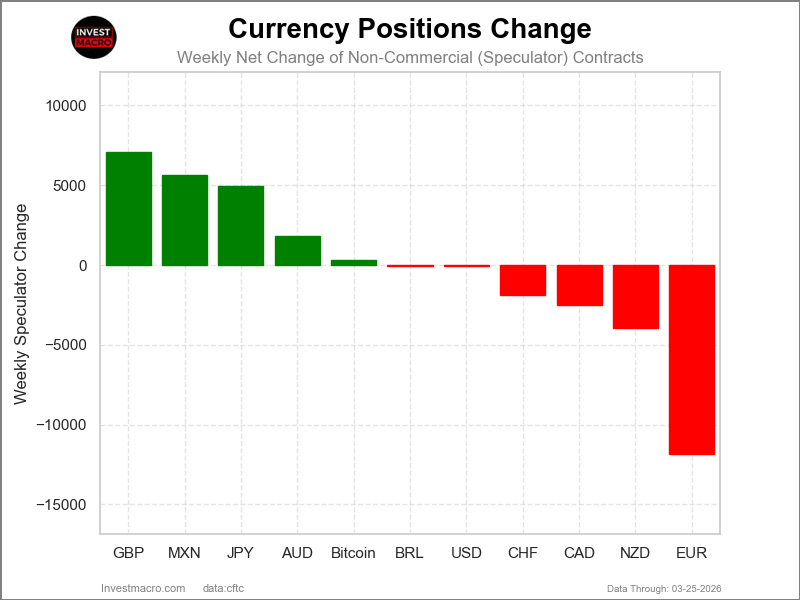
The COT currency market speculator bets were overall lower this week as just two out of the eleven currency markets we cover had higher positioning while the other nine markets had lower speculator contracts.

Leading the gains for the currency markets was the Australian Dollar (15,118 contracts) with the Brazilian Real (8,296 contracts) also having a positive week.

The currencies seeing declines in speculator bets on the week were the Japanese Yen (-28,114 contracts), the EuroFX (-20,358 contracts), the British Pound (-15,614 contracts), the Canadian Dollar (-6,528 contracts), Mexican Peso (-5,837 contracts), the New Zealand Dollar (-4,767 contracts), the US Dollar Index (-3,200 contracts), Bitcoin (-161 contracts) and with the Swiss Franc (-97 contracts) also registering lower bets on the week.

Weekly Currency Speculator Positions see AUD, BRL bets rise. Yen, Euro bets drop

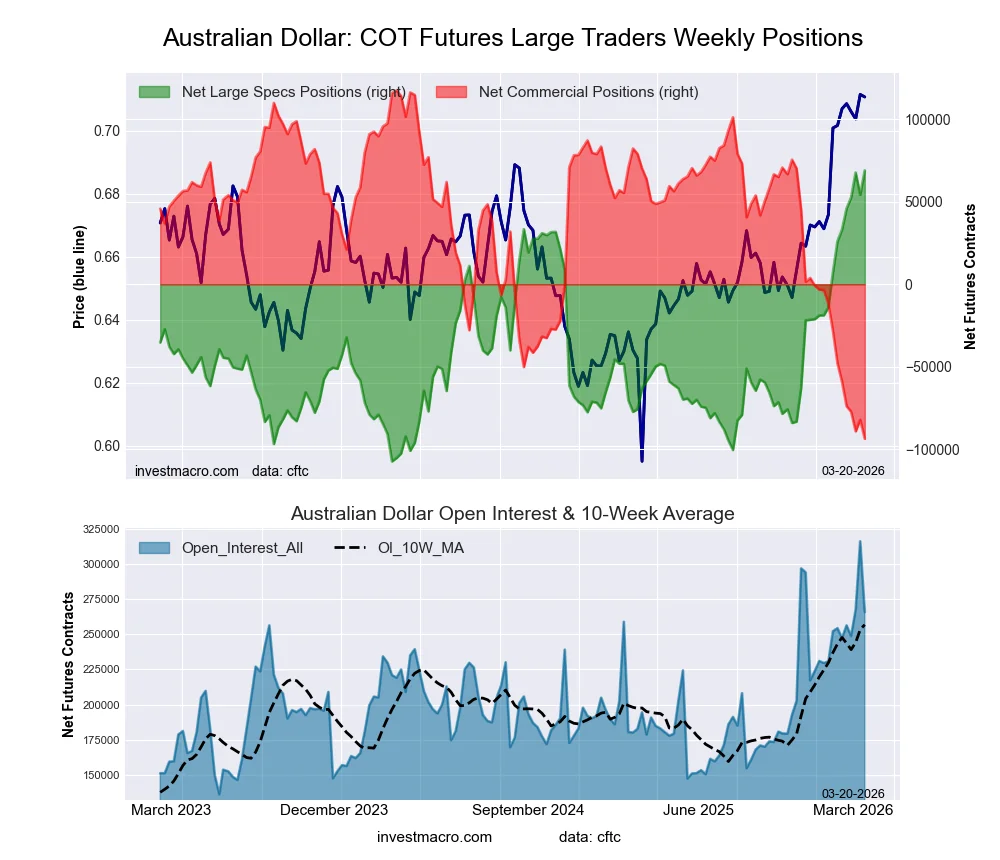
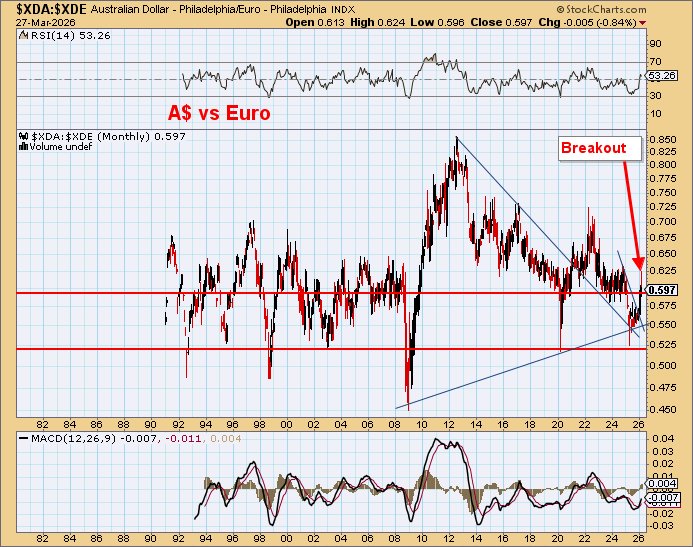
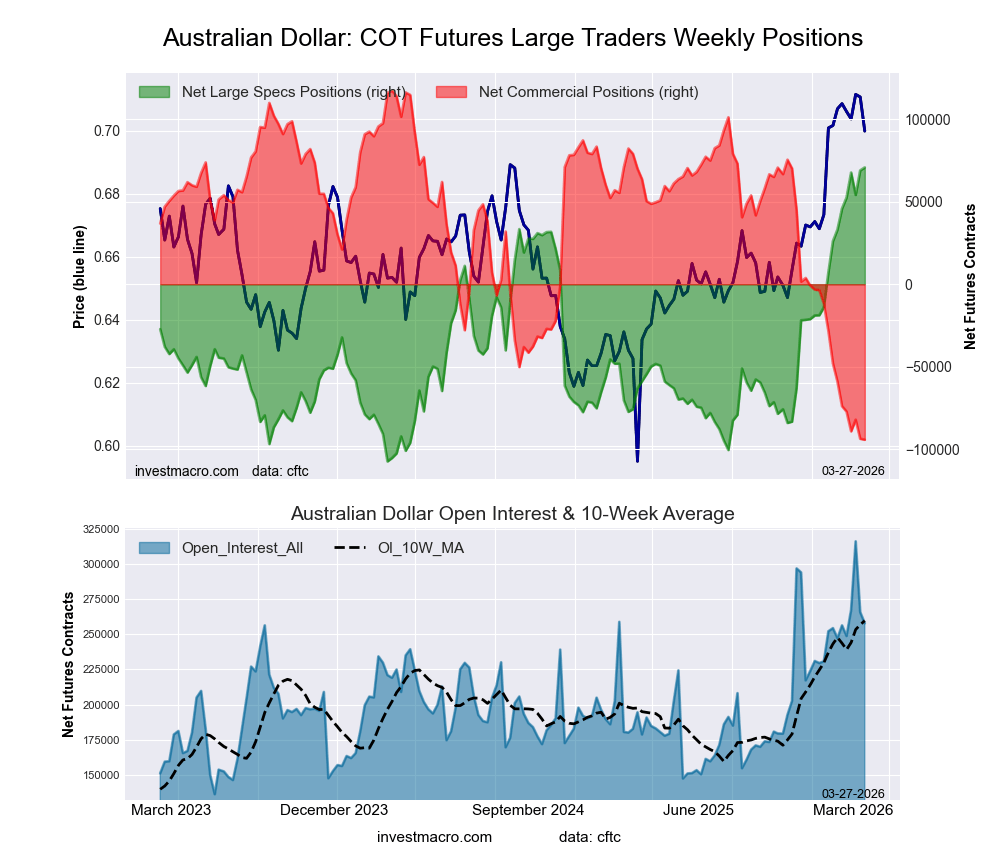
The Australian Dollar speculator position continued to surge higher this week. It rose over 15,000 contracts and is now higher for the fourteenth consecutive week. Over these last 14 weeks, speculators have added 151,938 net contracts to the Aussie position. This has taken the overall position from highly bearish in November to a total of +67,762 contracts this week and the current positioning continues to be at its highest levels since 2017. In the currency spot market, however, with the Iran war breaking out this week, the Aussie dipped this week after touching its highest levels since 2023 in previous weeks. The Aussie made a bearish doji candlestick on the weekly charts and has been overbought for many weeks on the weekly Relative Strength Index (RSI) indicator. The Australian Dollar has not traditionally been a safe haven currency—actually the opposite, so caution is warranted going forward with this currency.

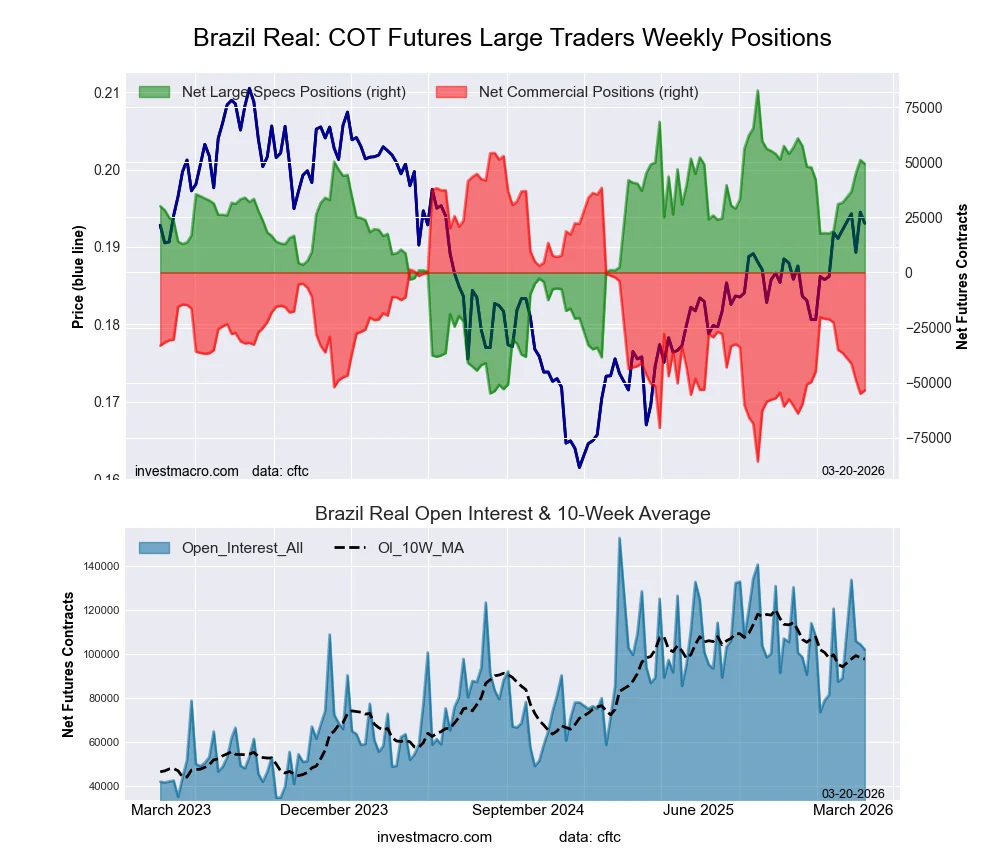
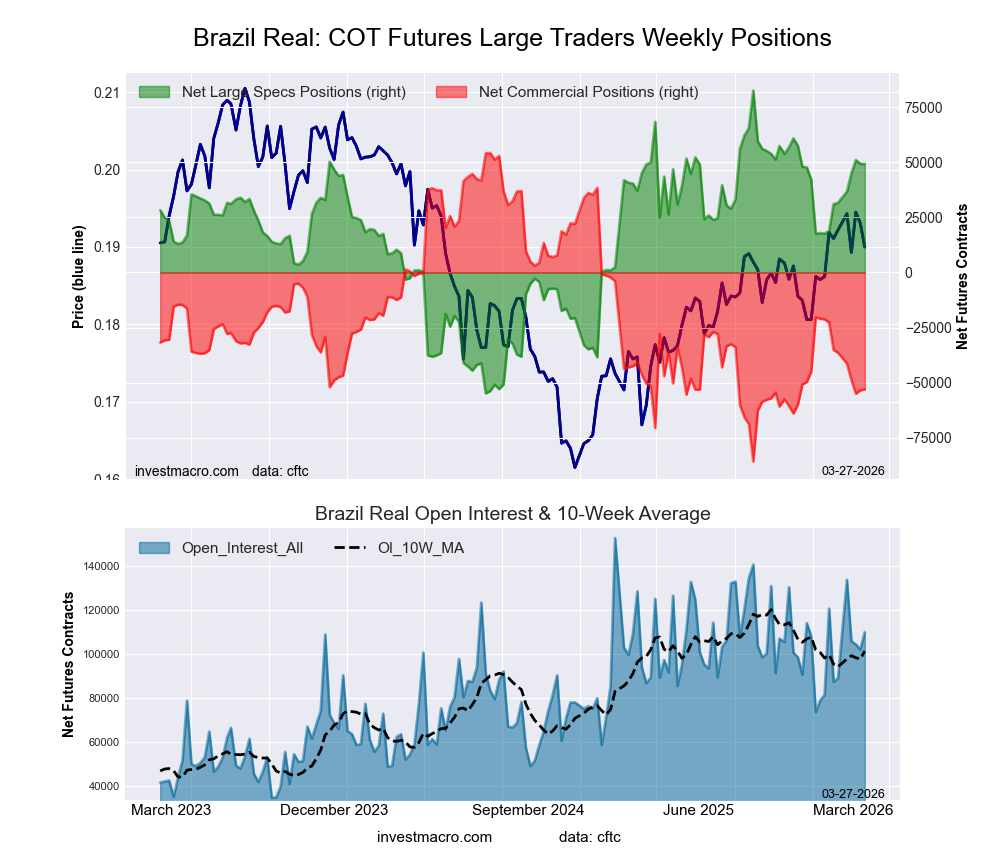
The Brazilian Real was the next highest gainer this week with a rise of over 8,000 contracts. The Real now has been up in seven out of the past eight weeks for an eight-week gain of 27,353 net contracts. The Real position currently sits at a +44,970 contract net position, which is the highest level since December. In the currency spot market, the Real saw a strong dip (-2.63%) this week after a recent strong run that had brought the BRL to the highest level since 2024 against the US Dollar. The Real is also not considered a safe haven currency, so this currency also bears watching.

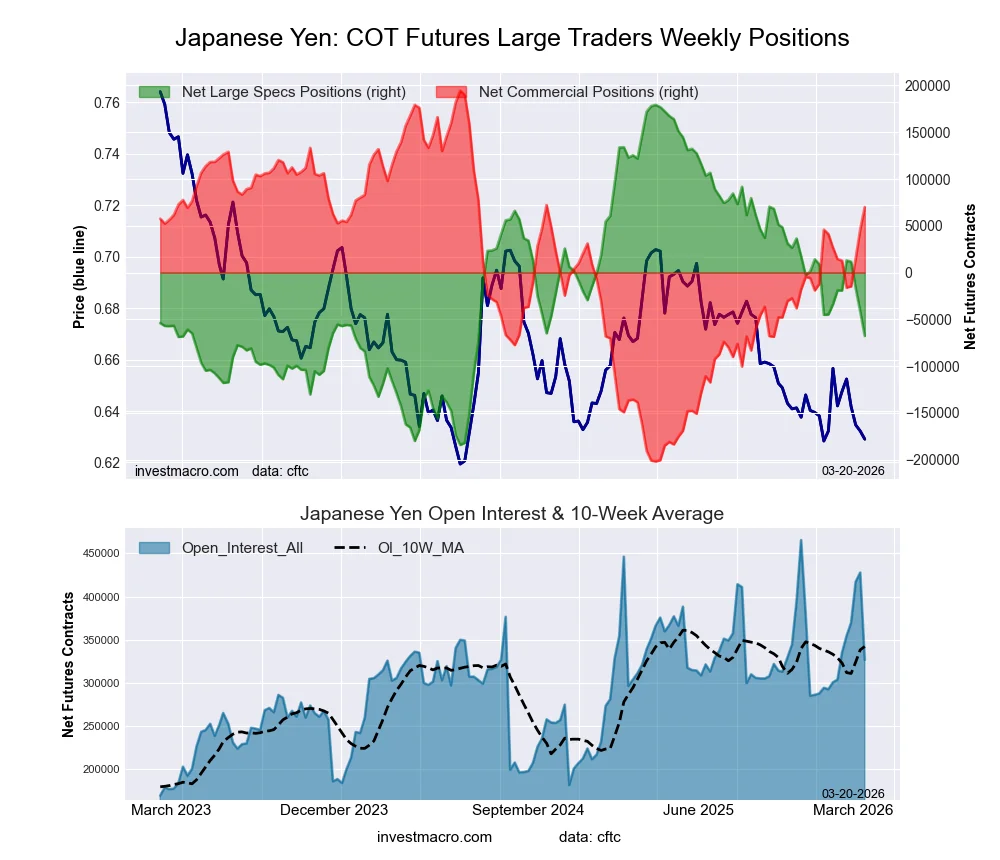
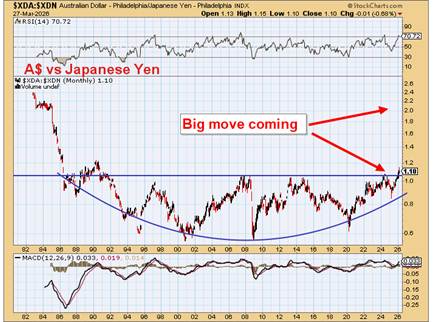
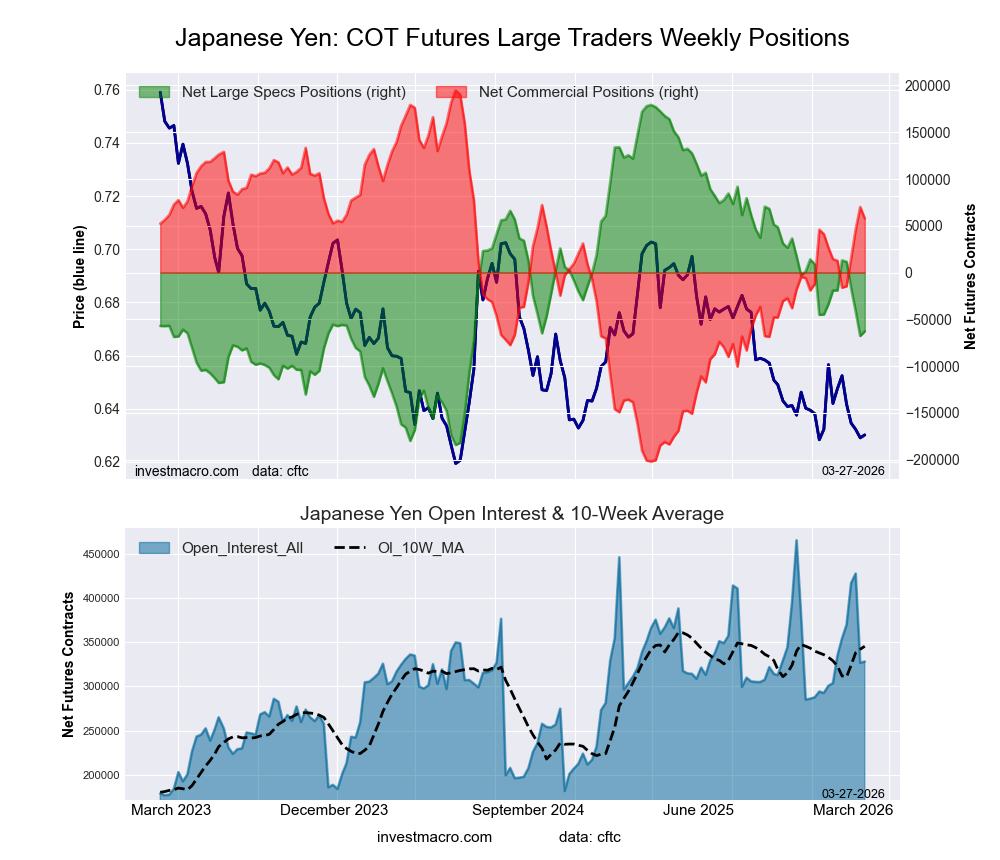
The Japanese Yen was the biggest loser on the week in terms of speculator changes in positions. The Yen lost -28,114 contracts this week and fell for a second consecutive week. This has pulled the Yen back into an overall negative or bearish territory with a total net position, as of Tuesday, at -16,575 contracts. In the forex market, the Yen has typically been a safe haven currency but did not receive safe haven flows this week as the currency fell by over 1%. It continued to lose ground to the US Dollar for the third consecutive week as the USD/JPY trades at the 157.82 exchange rate in the spot currency markets, which is a historically strong rate for the US Dollar versus the Yen.

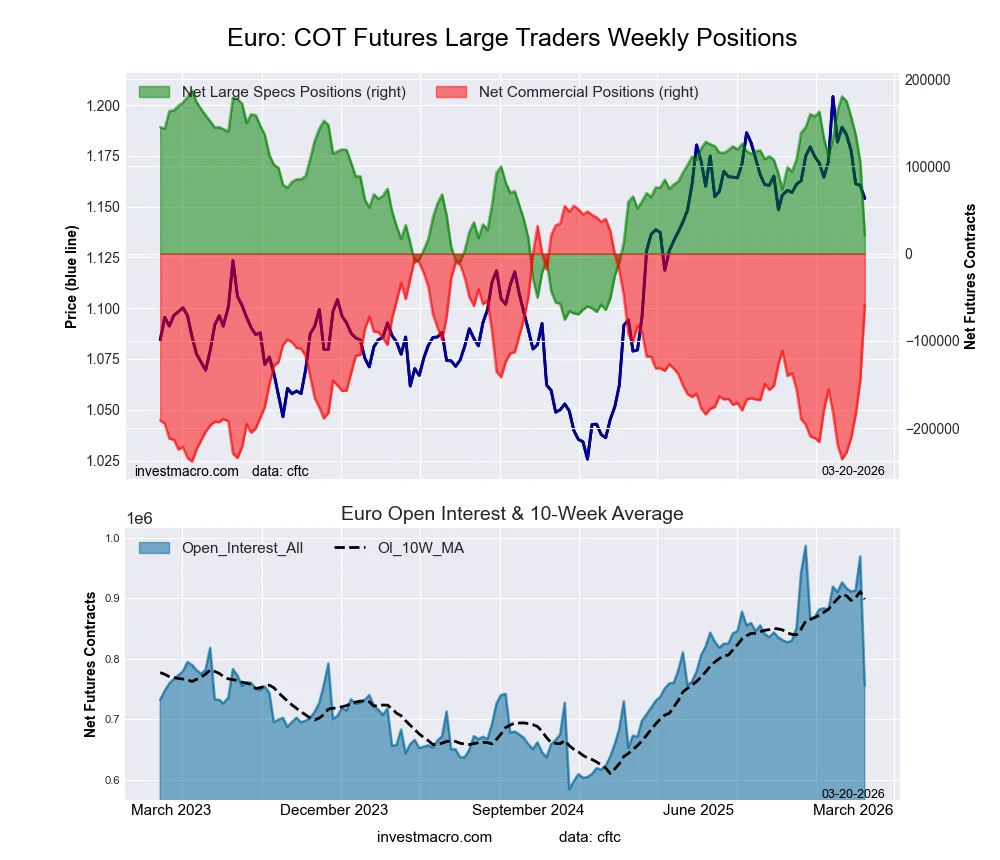
The Euro positions also took a strong hit this week, and the Euro positioning has now dropped for three consecutive weeks with a total of -43,807 net contracts taken off the bullish position. Overall, the Euro currency has been in a strong speculative bullish position, with the position being over +100,000 contracts for fourteen consecutive weeks and for thirty-four out of the past thirty-eight weeks dating back to June 2025. In the currency spot market this week, the Euro fell by almost 2% as the Iran war raged, and the Euro closed at 1.1605. Just about six weeks ago, the Euro touched a high of 1.2110 against the US Dollar but has now dipped back into its range from 1.15 to about 1.19 that the currency has traded in since June.

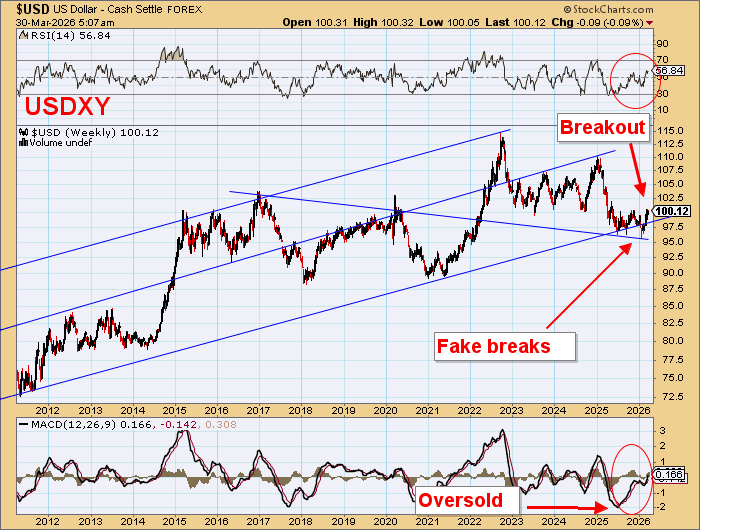
The US Dollar Index speculator positions fell for a second straight week this week and continue to be in an smallish overall net bearish position at -4,989 contracts. However, in the Forex market, the US Dollar Index started to see some strength as the week grew on, and the US Dollar is a traditional safe haven currency (along with the Swiss Franc and the Japanese Yen). The speculator data is through Tuesday and the speculator contracts may see an abrupt shift next week as the war drags on. Currently, the US Dollar Index trades at the 98.98 level, which is its highest close in about six weeks and there is the 100.00 psychological price level waiting above to test on further gains.

Bitcoin and the US Dollar Index lead Price Performance this week

Bitcoin saw a bit of a rebound this week with a 3.81% gain and led in the weekly price performances. The US Dollar Index was higher this week by 1.52% and received safe haven bids due to the Iran war. The Canadian Dollar was higher by 0.36% and undoubtedly received some strength off of the oil price going higher.

On the downside, the British Pound Sterling was lower by -0.71% followed by the Swiss Franc which fell by -1.13%. The Japanese Yen was next with a -1.19% shortfall while the Australian Dollar was lower by -1.35% and the New Zealand Dollar was lower by -1.69%. The Euro dropped a little less than 2% with a -1.84% 5-day decline. The Brazilian Real had a sharp decline at -2.63% and the Mexican Peso was the biggest loser on the week with a -3.28% decrease.


Currencies Data:

Speculators FX Futures COT Data Table
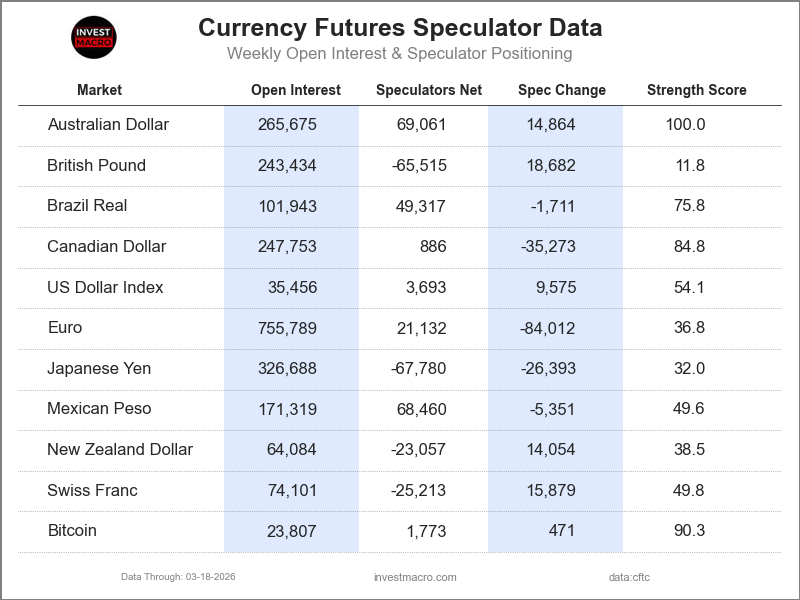
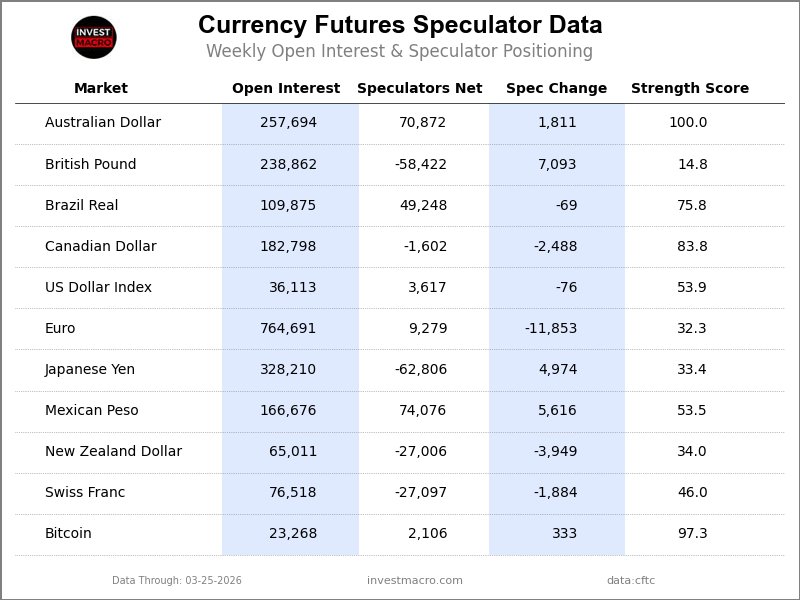
Legend: Open Interest | Speculators Current Net Position | Weekly Specs Change | Specs Strength Score compared to last 3-Years (0-100 range)


Strength Scores led by Australian Dollar & Canadian Dollar

Speculators Strength Scores FX Futures COT Chart
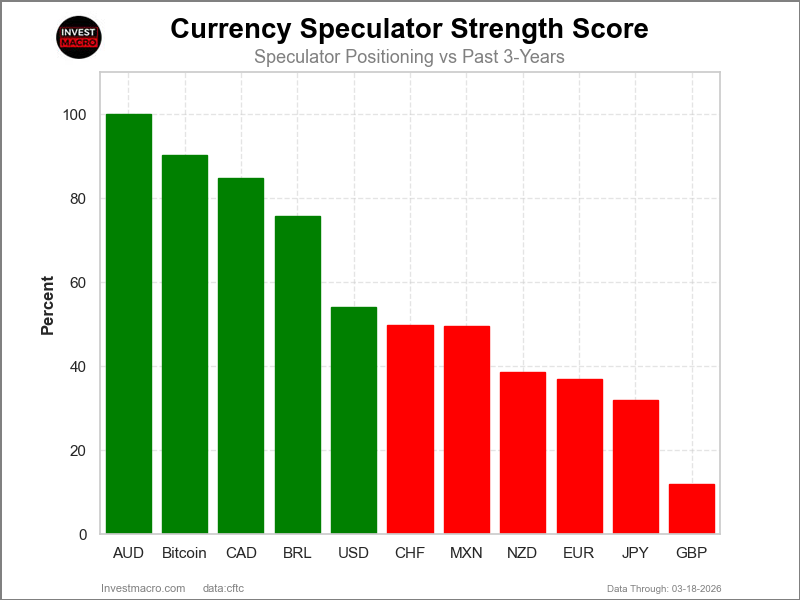
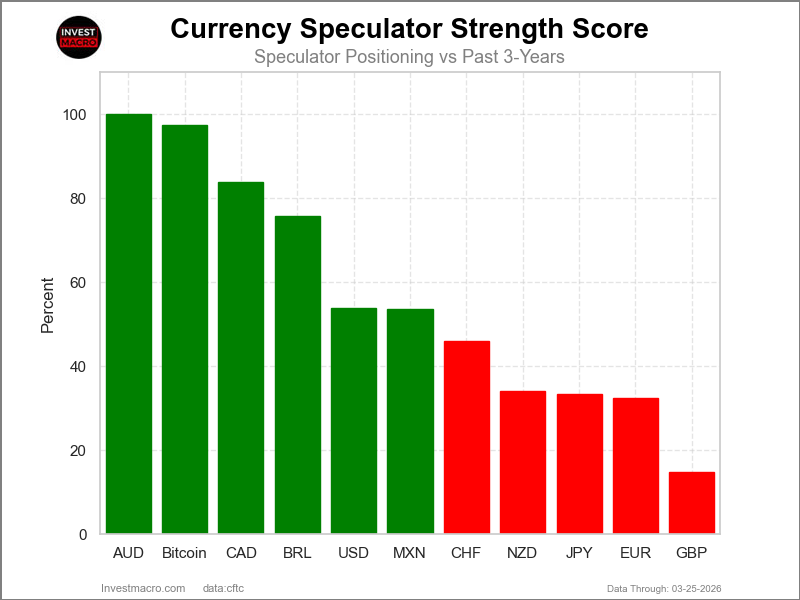
COT Strength Scores (a normalized measure of Speculator positions over a 3-Year range, from 0 to 100 where above 80 is Extreme-Bullish and below 20 is Extreme-Bearish) showed that the Australian Dollar (100 percent) and the Canadian Dollar (97 percent) lead the currency markets this week. The EuroFX (81 percent), Bitcoin (74 percent) and the Brazilian Real (73 percent) come in as the next highest in the weekly strength scores.

On the downside, the British Pound (9 percent) and the Swiss Franc (17 percent) come in at the lowest strength levels currently and are in Extreme-Bearish territory (below 20 percent). The next lowest strength scores are the New Zealand Dollar (26 percent) and the US Dollar Index (31 percent).

3-Year Strength Statistics:
US Dollar Index (30.7 percent) vs US Dollar Index previous week (39.3 percent)
EuroFX (80.7 percent) vs EuroFX previous week (88.5 percent)
British Pound Sterling (8.7 percent) vs British Pound Sterling previous week (15.4 percent)
Japanese Yen (46.1 percent) vs Japanese Yen previous week (53.9 percent)
Swiss Franc (17.2 percent) vs Swiss Franc previous week (17.4 percent)
Canadian Dollar (97.1 percent) vs Canadian Dollar previous week (100.0 percent)
Australian Dollar (100.0 percent) vs Australian Dollar previous week (91.4 percent)
New Zealand Dollar (25.6 percent) vs New Zealand Dollar previous week (31.1 percent)
Mexican Peso (55.6 percent) vs Mexican Peso previous week (59.8 percent)
Brazilian Real (72.7 percent) vs Brazilian Real previous week (66.6 percent)
Bitcoin (74.1 percent) vs Bitcoin previous week (77.5 percent)


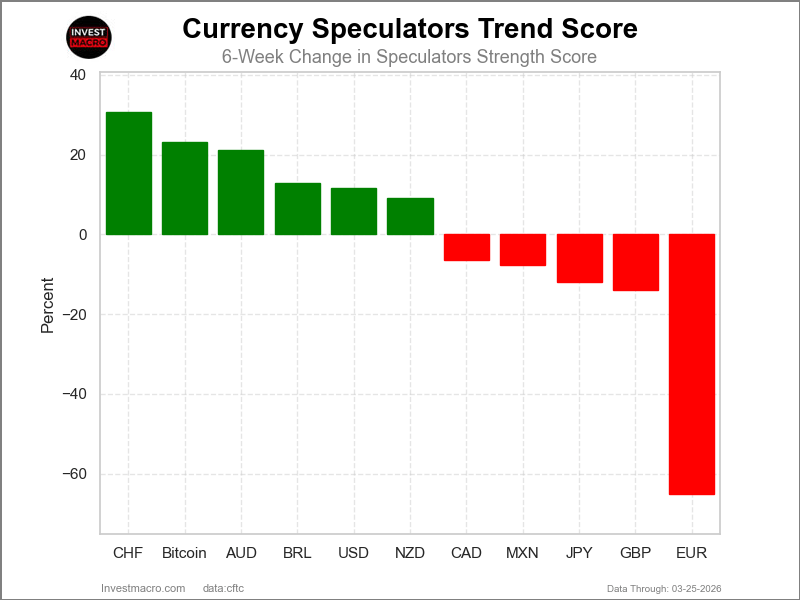
Australian Dollar & Canadian Dollar top the 6-Week Strength Trends
Speculators Trends FX Futures COT Chart
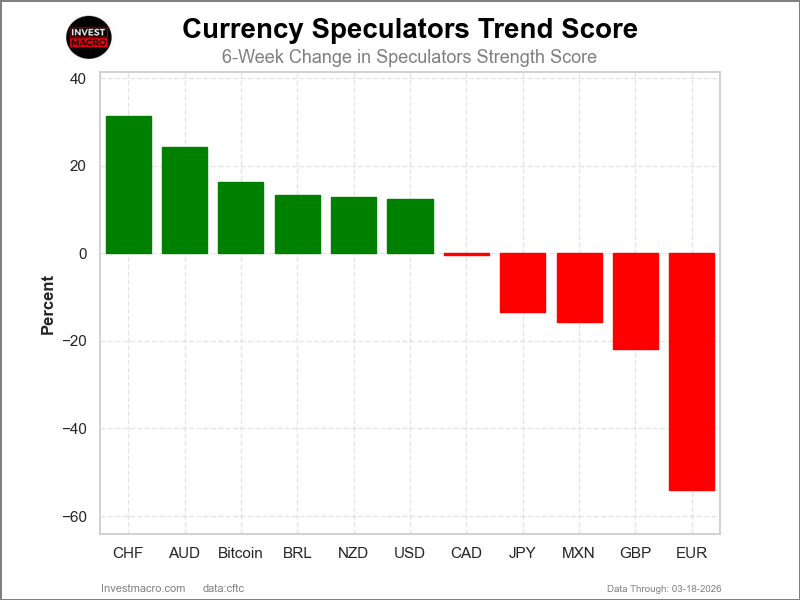
COT Strength Score Trends (or move index, calculates the 6-week changes in strength scores) showed that the Australian Dollar (47 percent) and the Canadian Dollar (28 percent) lead the past six weeks trends for the currencies. The Brazilian Real (20 percent), the New Zealand Dollar (17 percent) and Bitcoin (15 percent) are the next highest positive movers in the 3-Year trends data.

The British Pound (-22 percent) leads the downside trend scores currently with the Mexican Peso (-21 percent) following next with lower trend scores.

3-Year Strength Trends:
US Dollar Index (3.9 percent) vs US Dollar Index previous week (5.2 percent)
EuroFX (9.4 percent) vs EuroFX previous week (9.2 percent)
British Pound Sterling (-21.5 percent) vs British Pound Sterling previous week (-13.5 percent)
Japanese Yen (7.8 percent) vs Japanese Yen previous week (15.6 percent)
Swiss Franc (3.9 percent) vs Swiss Franc previous week (4.5 percent)
Canadian Dollar (28.1 percent) vs Canadian Dollar previous week (31.2 percent)
Australian Dollar (46.6 percent) vs Australian Dollar previous week (40.8 percent)
New Zealand Dollar (17.5 percent) vs New Zealand Dollar previous week (22.0 percent)
Mexican Peso (-21.3 percent) vs Mexican Peso previous week (-14.6 percent)
Brazilian Real (19.9 percent) vs Brazilian Real previous week (13.7 percent)
Bitcoin (15.1 percent) vs Bitcoin previous week (23.4 percent)


Individual COT Forex Markets:

US Dollar Index Futures:
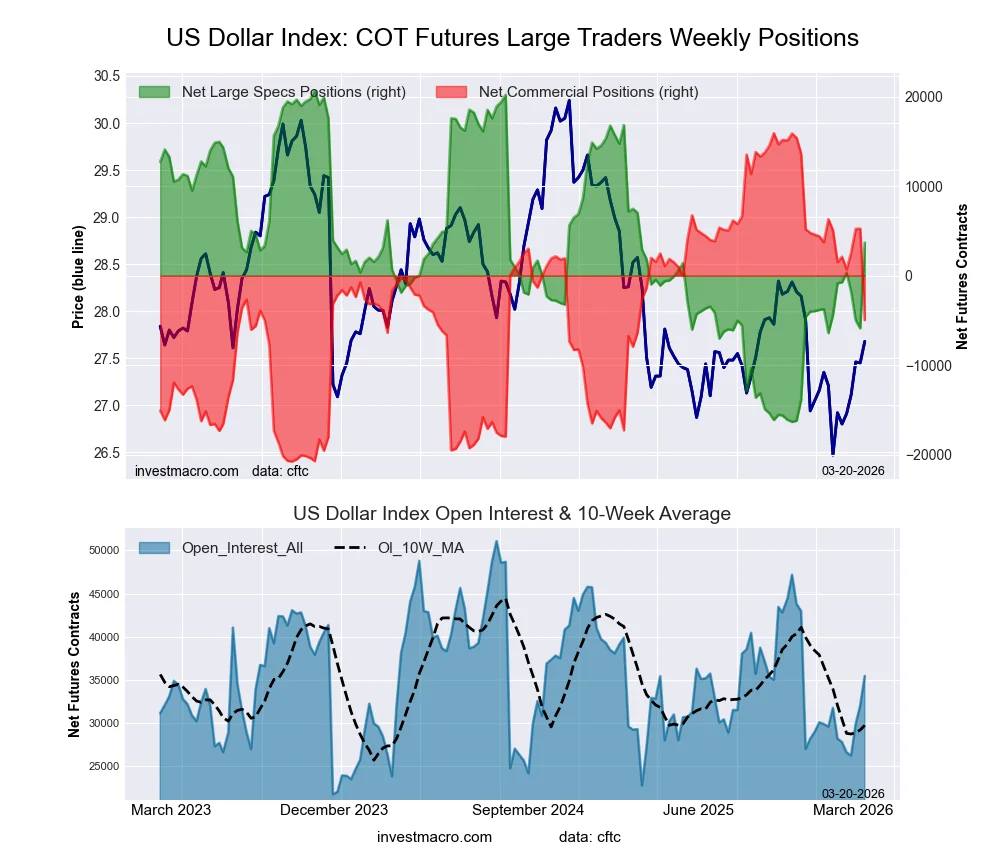
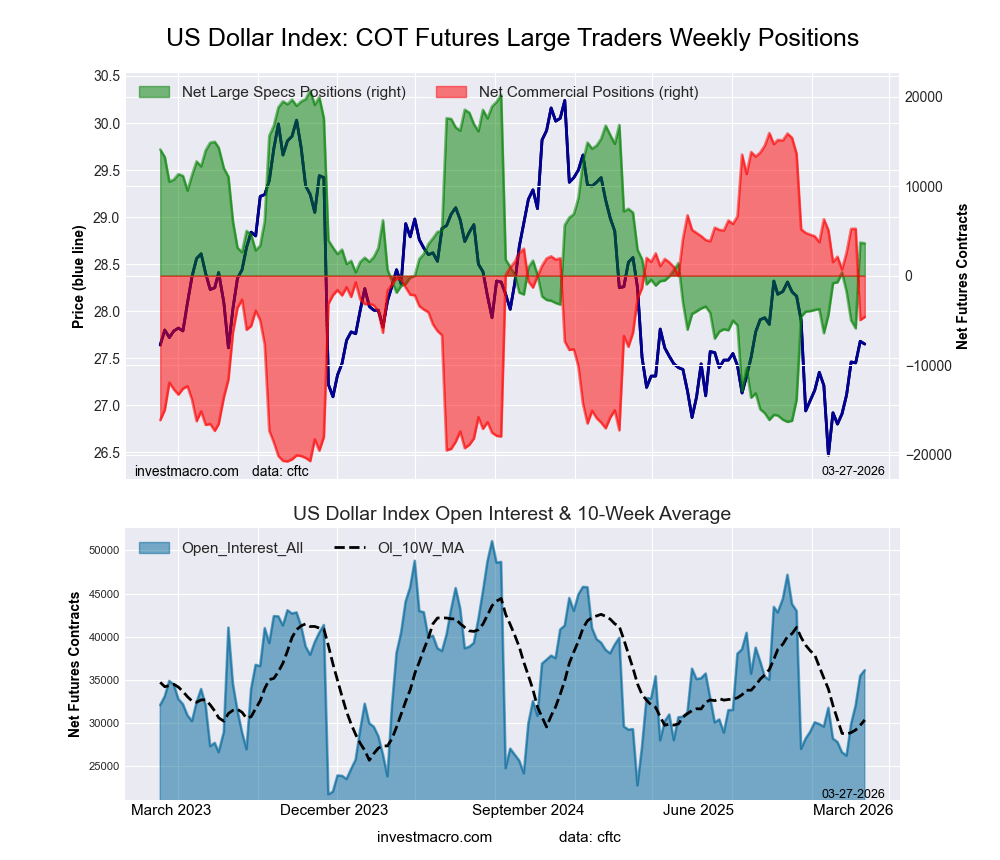
US Dollar Index Forex Futures COT ChartThe US Dollar Index large speculator standing this week equaled a net position of -4,989 contracts in the data reported through Tuesday. This was a weekly decline of -3,200 contracts from the previous week which had a total of -1,789 net contracts.

This week’s current strength score (the trader positioning range over the past three years, measured from 0 to 100) shows the speculators are currently Bearish with a score of 30.7 percent. The commercials are Bullish with a score of 70.8 percent and the small traders (not shown in chart) are Bearish with a score of 34.9 percent.

Price Trend-Following Model: Weak Downtrend

Our weekly trend-following model classifies the current market price position as: Weak Downtrend.

US DOLLAR INDEX StatisticsSPECULATORSCOMMERCIALSSMALL TRADERS
– Percent of Open Interest Longs:50.429.711.8
– Percent of Open Interest Shorts:67.112.212.5
– Net Position:-4,9895,223-234
– Gross Longs:15,0618,8823,513
– Gross Shorts:20,0503,6593,747
– Long to Short Ratio:0.8 to 12.4 to 10.9 to 1
NET POSITION TREND:
– Strength Index Score (3 Year Range Pct):30.770.834.9
– Strength Index Reading (3 Year Range):BearishBullishBearish
NET POSITION MOVEMENT INDEX:
– 6-Week Change in Strength Index:3.9-2.9-6.1


Euro Currency Futures:

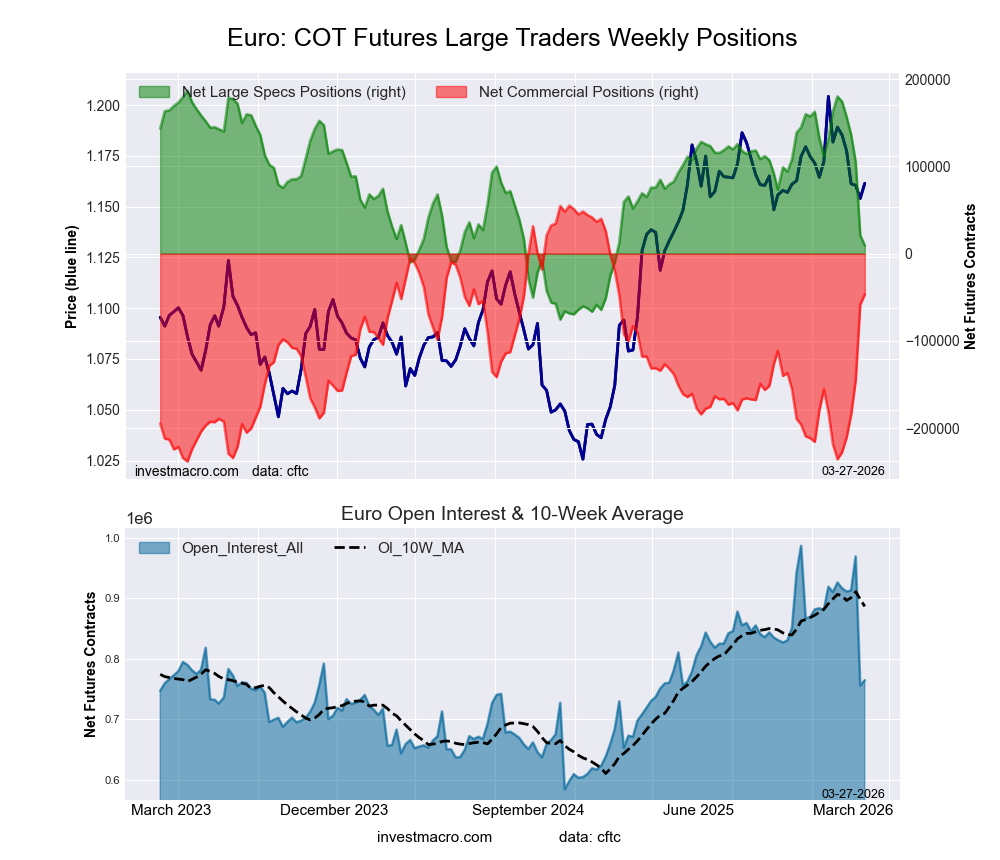
Euro Currency Futures COT ChartThe Euro Currency large speculator standing this week equaled a net position of 136,498 contracts in the data reported through Tuesday. This was a weekly reduction of -20,358 contracts from the previous week which had a total of 156,856 net contracts.

This week’s current strength score (the trader positioning range over the past three years, measured from 0 to 100) shows the speculators are currently Bullish-Extreme with a score of 80.7 percent. The commercials are Bearish-Extreme with a score of 18.3 percent and the small traders (not shown in chart) are Bullish with a score of 76.0 percent.

Price Trend-Following Model: Weak Uptrend

Our weekly trend-following model classifies the current market price position as: Weak Uptrend.

EURO Currency StatisticsSPECULATORSCOMMERCIALSSMALL TRADERS
– Percent of Open Interest Longs:32.353.210.1
– Percent of Open Interest Shorts:17.373.44.8
– Net Position:136,498-184,59348,095
– Gross Longs:294,586485,71391,926
– Gross Shorts:158,088670,30643,831
– Long to Short Ratio:1.9 to 10.7 to 12.1 to 1
NET POSITION TREND:
– Strength Index Score (3 Year Range Pct):80.718.376.0
– Strength Index Reading (3 Year Range):Bullish-ExtremeBearish-ExtremeBullish
NET POSITION MOVEMENT INDEX:
– 6-Week Change in Strength Index:9.4-9.98.8


British Pound Sterling Futures:

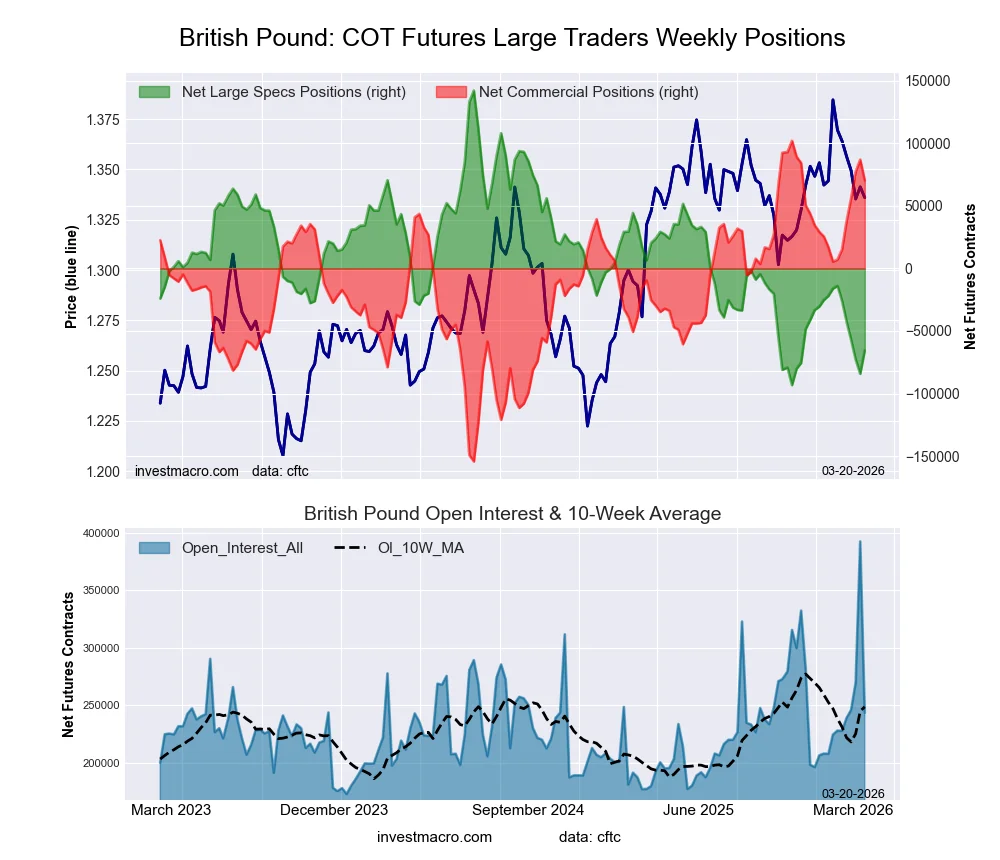
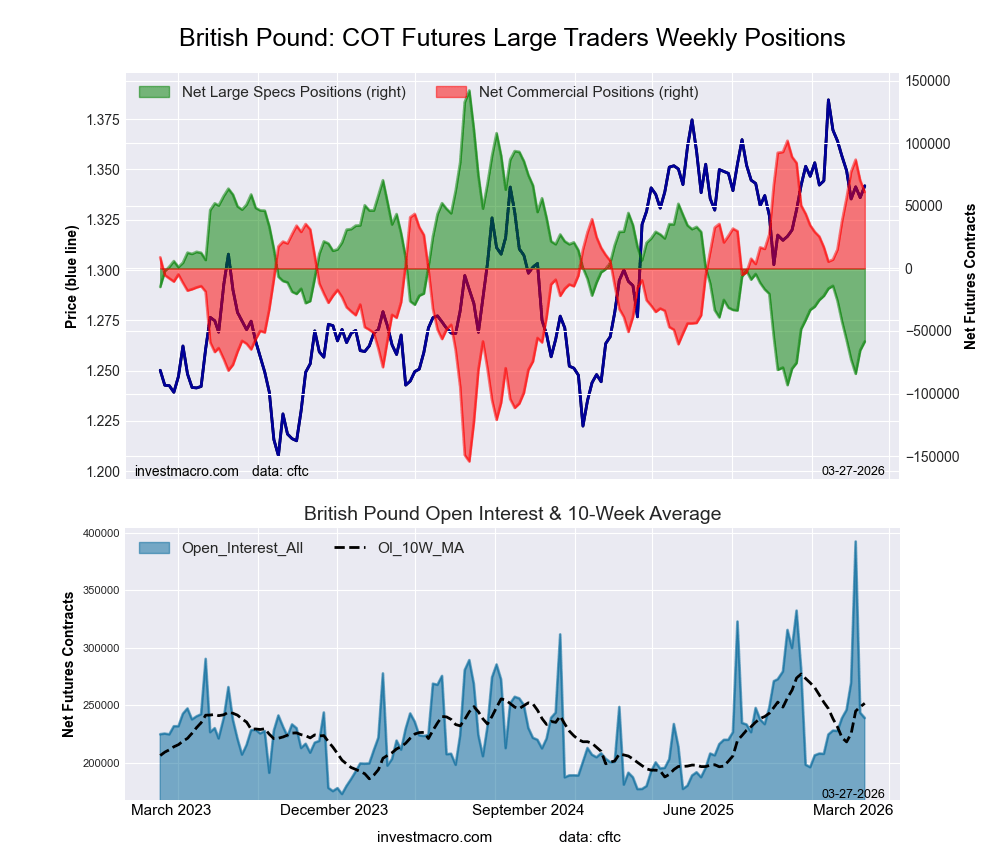
British Pound Sterling Futures COT ChartThe British Pound Sterling large speculator standing this week equaled a net position of -72,686 contracts in the data reported through Tuesday. This was a weekly decrease of -15,614 contracts from the previous week which had a total of -57,072 net contracts.

This week’s current strength score (the trader positioning range over the past three years, measured from 0 to 100) shows the speculators are currently Bearish-Extreme with a score of 8.7 percent. The commercials are Bullish-Extreme with a score of 90.4 percent and the small traders (not shown in chart) are Bearish with a score of 41.2 percent.

Price Trend-Following Model: Weak Uptrend

Our weekly trend-following model classifies the current market price position as: Weak Uptrend.

BRITISH POUND StatisticsSPECULATORSCOMMERCIALSSMALL TRADERS
– Percent of Open Interest Longs:22.160.59.6
– Percent of Open Interest Shorts:49.031.811.4
– Net Position:-72,68677,305-4,619
– Gross Longs:59,499163,15626,010
– Gross Shorts:132,18585,85130,629
– Long to Short Ratio:0.5 to 11.9 to 10.8 to 1
NET POSITION TREND:
– Strength Index Score (3 Year Range Pct):8.790.441.2
– Strength Index Reading (3 Year Range):Bearish-ExtremeBullish-ExtremeBearish
NET POSITION MOVEMENT INDEX:
– 6-Week Change in Strength Index:-21.523.5-24.7


Japanese Yen Futures:

Japanese Yen Forex Futures COT ChartThe Japanese Yen large speculator standing this week equaled a net position of -16,575 contracts in the data reported through Tuesday. This was a weekly decline of -28,114 contracts from the previous week which had a total of 11,539 net contracts.

This week’s current strength score (the trader positioning range over the past three years, measured from 0 to 100) shows the speculators are currently Bearish with a score of 46.1 percent. The commercials are Bullish with a score of 54.7 percent and the small traders (not shown in chart) are Bearish with a score of 40.8 percent.

Price Trend-Following Model: Strong Downtrend

Our weekly trend-following model classifies the current market price position as: Strong Downtrend.

JAPANESE YEN StatisticsSPECULATORSCOMMERCIALSSMALL TRADERS
– Percent of Open Interest Longs:32.444.69.5
– Percent of Open Interest Shorts:36.341.09.1
– Net Position:-16,57515,0071,568
– Gross Longs:134,945186,02739,530
– Gross Shorts:151,520171,02037,962
– Long to Short Ratio:0.9 to 11.1 to 11.0 to 1
NET POSITION TREND:
– Strength Index Score (3 Year Range Pct):46.154.740.8
– Strength Index Reading (3 Year Range):BearishBullishBearish
NET POSITION MOVEMENT INDEX:
– 6-Week Change in Strength Index:7.8-6.6-5.5


Swiss Franc Futures:

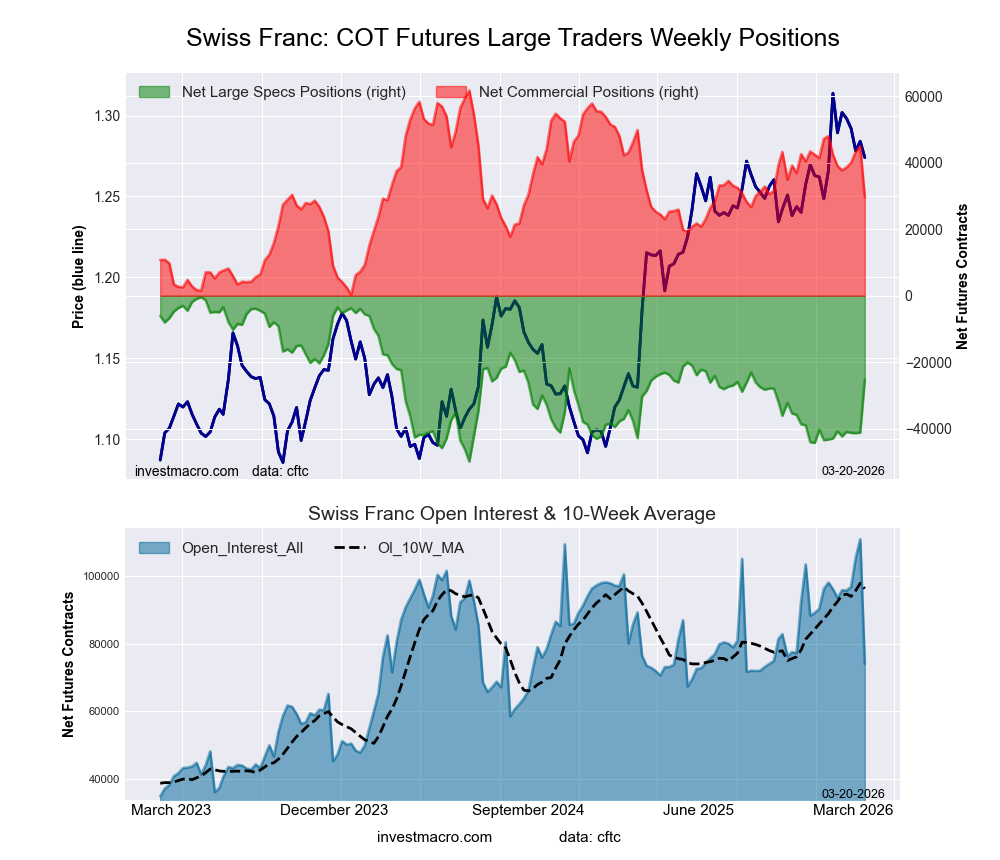
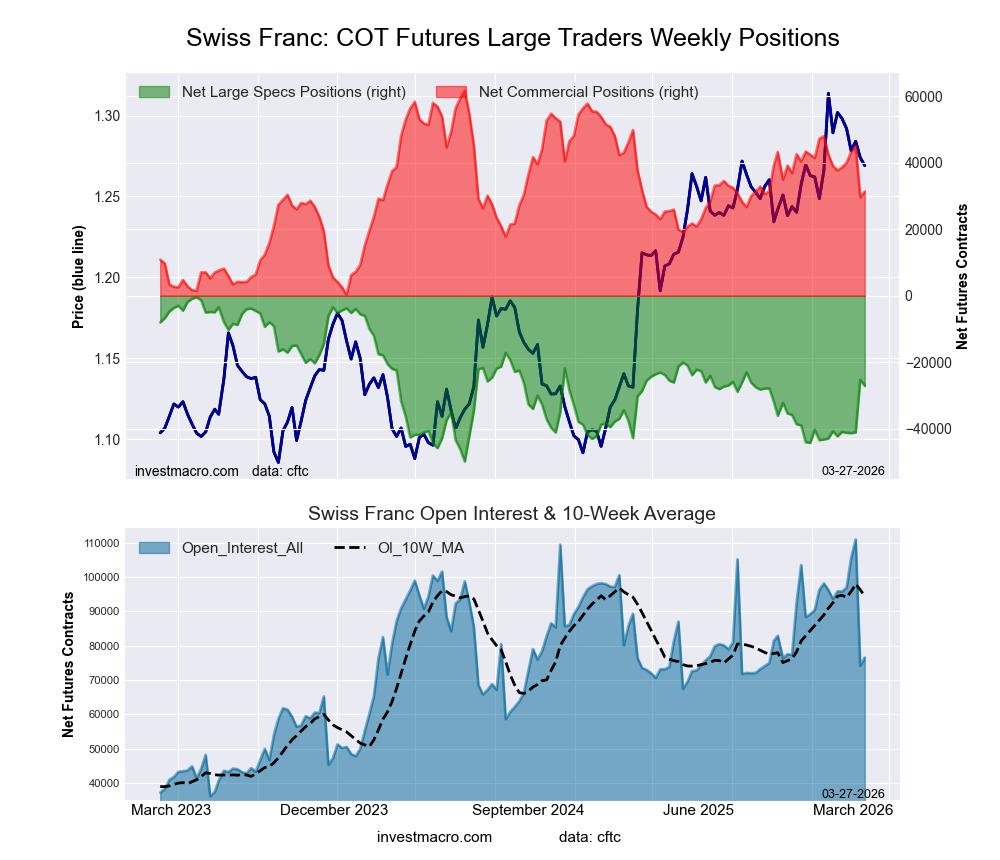
Swiss Franc Forex Futures COT ChartThe Swiss Franc large speculator standing this week equaled a net position of -41,283 contracts in the data reported through Tuesday. This was a weekly fall of -97 contracts from the previous week which had a total of -41,186 net contracts.

This week’s current strength score (the trader positioning range over the past three years, measured from 0 to 100) shows the speculators are currently Bearish-Extreme with a score of 17.2 percent. The commercials are Bullish with a score of 70.0 percent and the small traders (not shown in chart) are Bullish with a score of 70.3 percent.

Price Trend-Following Model: Uptrend

Our weekly trend-following model classifies the current market price position as: Uptrend.

SWISS FRANC StatisticsSPECULATORSCOMMERCIALSSMALL TRADERS
– Percent of Open Interest Longs:11.868.614.6
– Percent of Open Interest Shorts:50.927.616.5
– Net Position:-41,28343,280-1,997
– Gross Longs:12,39072,32415,357
– Gross Shorts:53,67329,04417,354
– Long to Short Ratio:0.2 to 12.5 to 10.9 to 1
NET POSITION TREND:
– Strength Index Score (3 Year Range Pct):17.270.070.3
– Strength Index Reading (3 Year Range):Bearish-ExtremeBullishBullish
NET POSITION MOVEMENT INDEX:
– 6-Week Change in Strength Index:3.9-7.611.7


Canadian Dollar Futures:

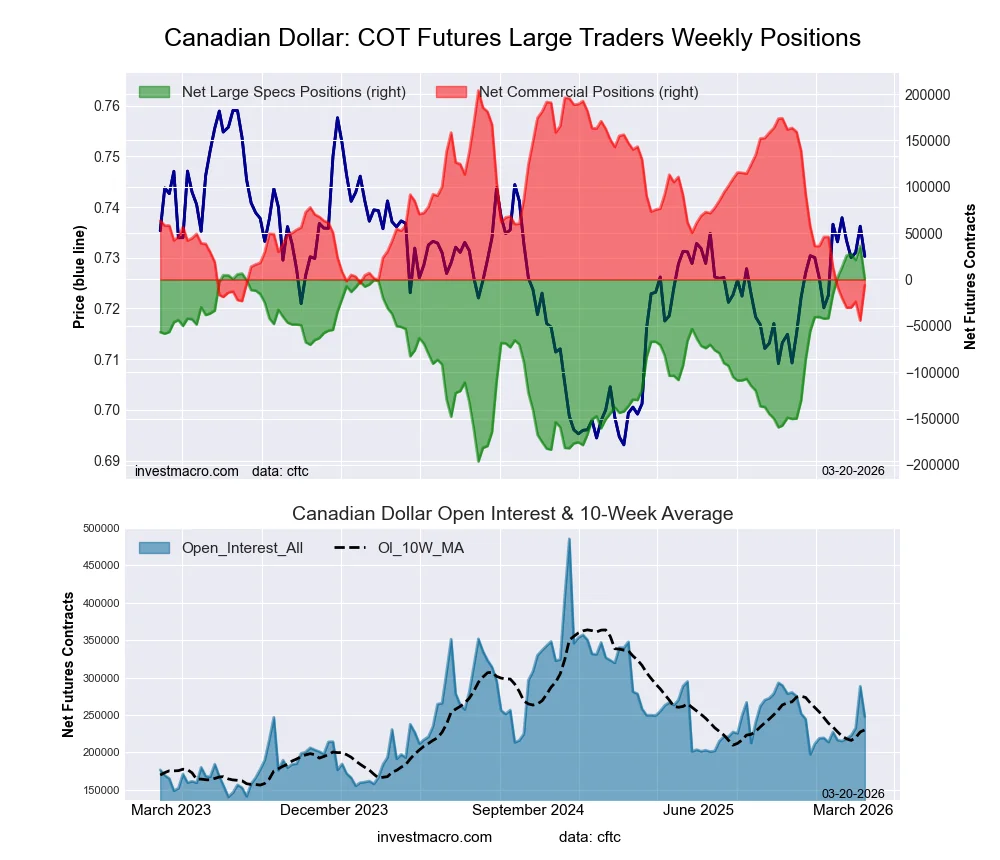
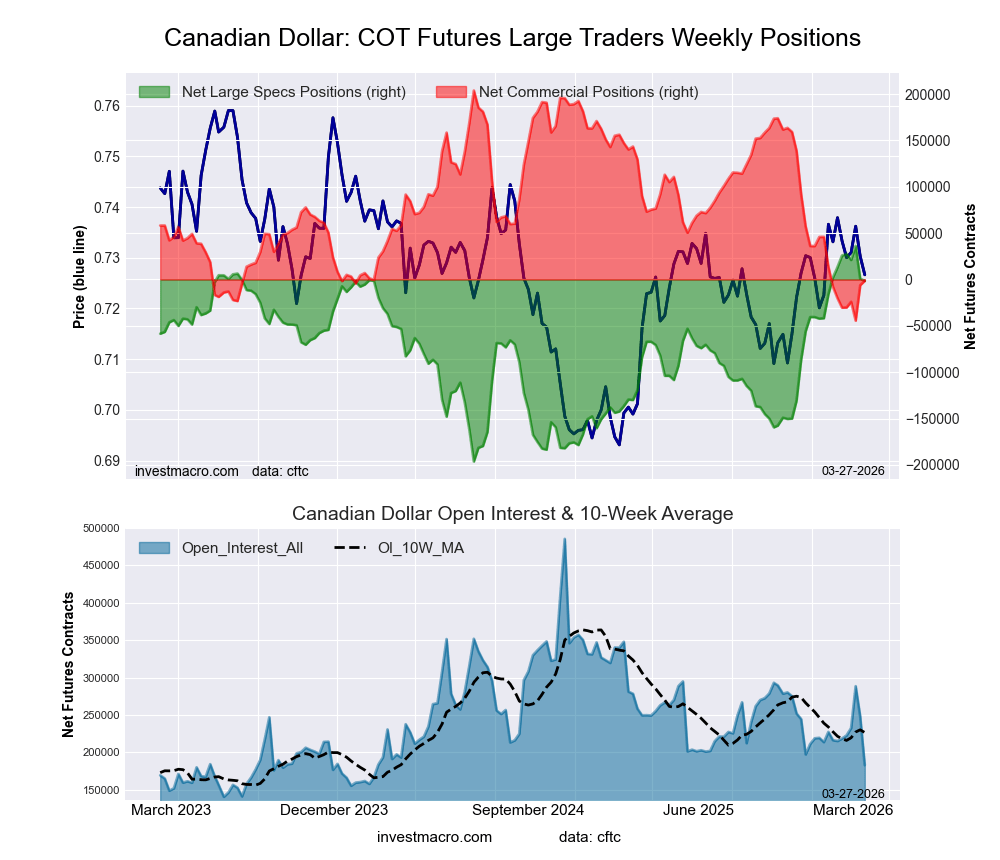
Canadian Dollar Forex Futures COT ChartThe Canadian Dollar large speculator standing this week equaled a net position of 21,050 contracts in the data reported through Tuesday. This was a weekly decline of -6,528 contracts from the previous week which had a total of 27,578 net contracts.

This week’s current strength score (the trader positioning range over the past three years, measured from 0 to 100) shows the speculators are currently Bullish-Extreme with a score of 97.1 percent. The commercials are Bearish-Extreme with a score of 2.7 percent and the small traders (not shown in chart) are Bullish with a score of 53.7 percent.

Price Trend-Following Model: Strong Uptrend

Our weekly trend-following model classifies the current market price position as: Strong Uptrend.

CANADIAN DOLLAR StatisticsSPECULATORSCOMMERCIALSSMALL TRADERS
– Percent of Open Interest Longs:40.443.512.9
– Percent of Open Interest Shorts:31.453.811.6
– Net Position:21,050-24,0563,006
– Gross Longs:94,008101,02930,071
– Gross Shorts:72,958125,08527,065
– Long to Short Ratio:1.3 to 10.8 to 11.1 to 1
NET POSITION TREND:
– Strength Index Score (3 Year Range Pct):97.12.753.7
– Strength Index Reading (3 Year Range):Bullish-ExtremeBearish-ExtremeBullish
NET POSITION MOVEMENT INDEX:
– 6-Week Change in Strength Index:28.1-29.920.1


Australian Dollar Futures:

Australian Dollar Forex Futures COT ChartThe Australian Dollar large speculator standing this week equaled a net position of 67,762 contracts in the data reported through Tuesday. This was a weekly increase of 15,118 contracts from the previous week which had a total of 52,644 net contracts.

This week’s current strength score (the trader positioning range over the past three years, measured from 0 to 100) shows the speculators are currently Bullish-Extreme with a score of 100.0 percent. The commercials are Bearish-Extreme with a score of 0.0 percent and the small traders (not shown in chart) are Bullish-Extreme with a score of 85.9 percent.

Price Trend-Following Model: Uptrend

Our weekly trend-following model classifies the current market price position as: Uptrend.

AUSTRALIAN DOLLAR StatisticsSPECULATORSCOMMERCIALSSMALL TRADERS
– Percent of Open Interest Longs:51.127.315.2
– Percent of Open Interest Shorts:25.760.77.1
– Net Position:67,762-89,24921,487
– Gross Longs:136,51572,99140,551
– Gross Shorts:68,753162,24019,064
– Long to Short Ratio:2.0 to 10.4 to 12.1 to 1
NET POSITION TREND:
– Strength Index Score (3 Year Range Pct):100.00.085.9
– Strength Index Reading (3 Year Range):Bullish-ExtremeBearish-ExtremeBullish-Extreme
NET POSITION MOVEMENT INDEX:
– 6-Week Change in Strength Index:46.6-37.5-9.2


New Zealand Dollar Futures:

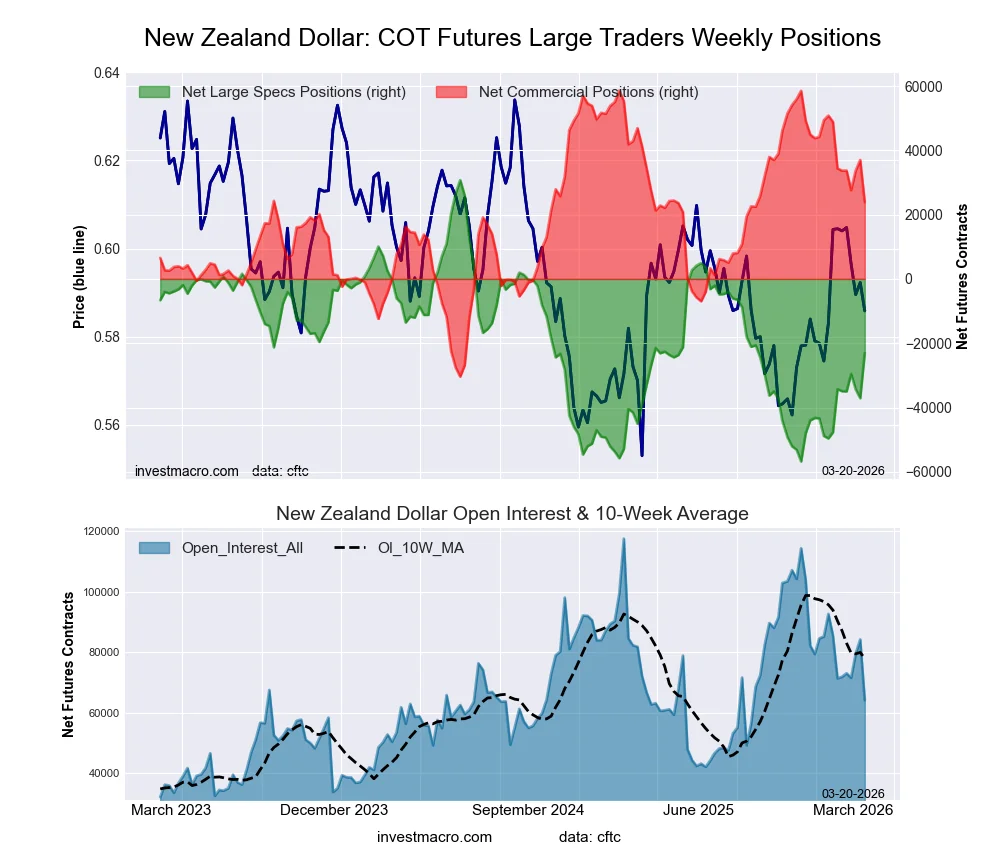
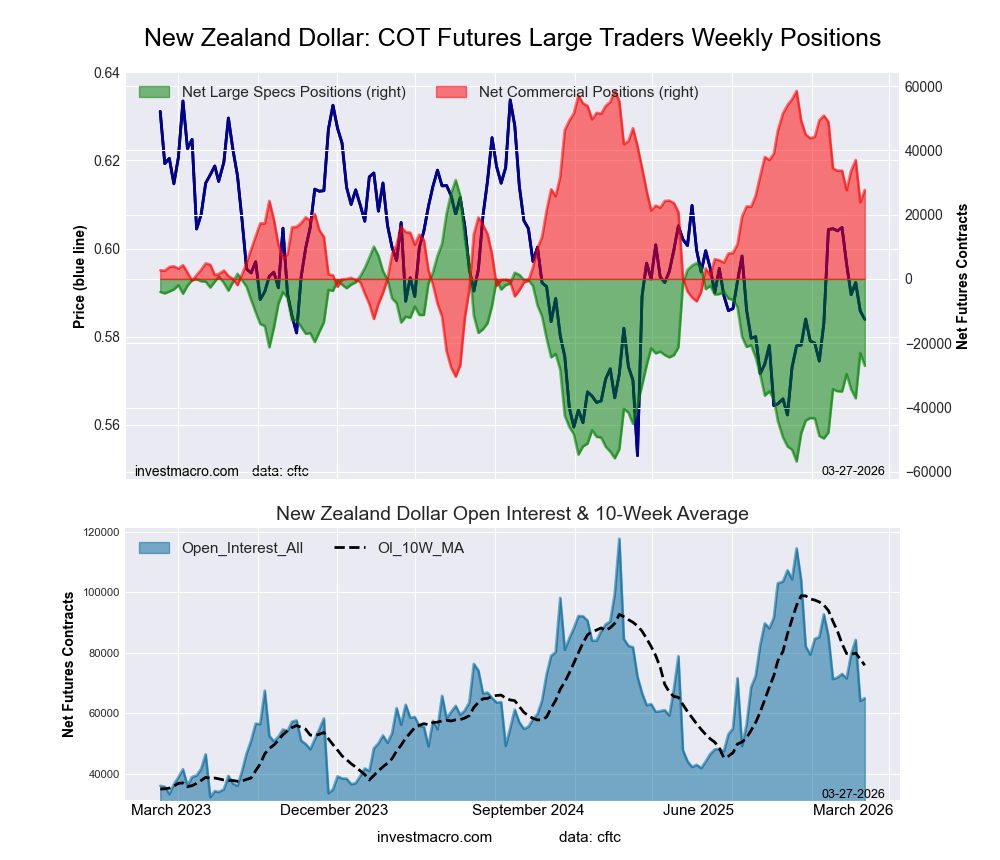
New Zealand Dollar Forex Futures COT ChartThe New Zealand Dollar large speculator standing this week equaled a net position of -34,334 contracts in the data reported through Tuesday. This was a weekly lowering of -4,767 contracts from the previous week which had a total of -29,567 net contracts.

This week’s current strength score (the trader positioning range over the past three years, measured from 0 to 100) shows the speculators are currently Bearish with a score of 25.6 percent. The commercials are Bullish with a score of 72.0 percent and the small traders (not shown in chart) are Bullish with a score of 60.7 percent.

Price Trend-Following Model: Weak Uptrend

Our weekly trend-following model classifies the current market price position as: Weak Uptrend.

NEW ZEALAND DOLLAR StatisticsSPECULATORSCOMMERCIALSSMALL TRADERS
– Percent of Open Interest Longs:16.669.65.5
– Percent of Open Interest Shorts:59.827.24.7
– Net Position:-34,33433,689645
– Gross Longs:13,17655,3244,396
– Gross Shorts:47,51021,6353,751
– Long to Short Ratio:0.3 to 12.6 to 11.2 to 1
NET POSITION TREND:
– Strength Index Score (3 Year Range Pct):25.672.060.7
– Strength Index Reading (3 Year Range):BearishBullishBullish
NET POSITION MOVEMENT INDEX:
– 6-Week Change in Strength Index:17.5-19.224.0


Mexican Peso Futures:

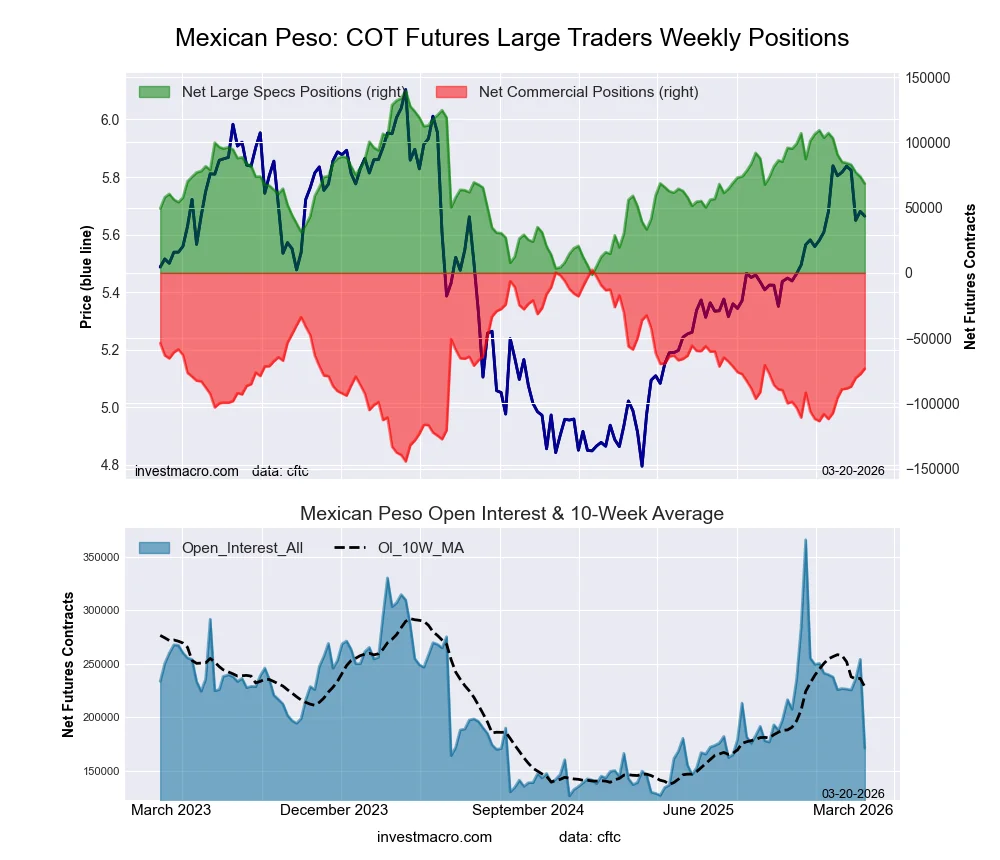
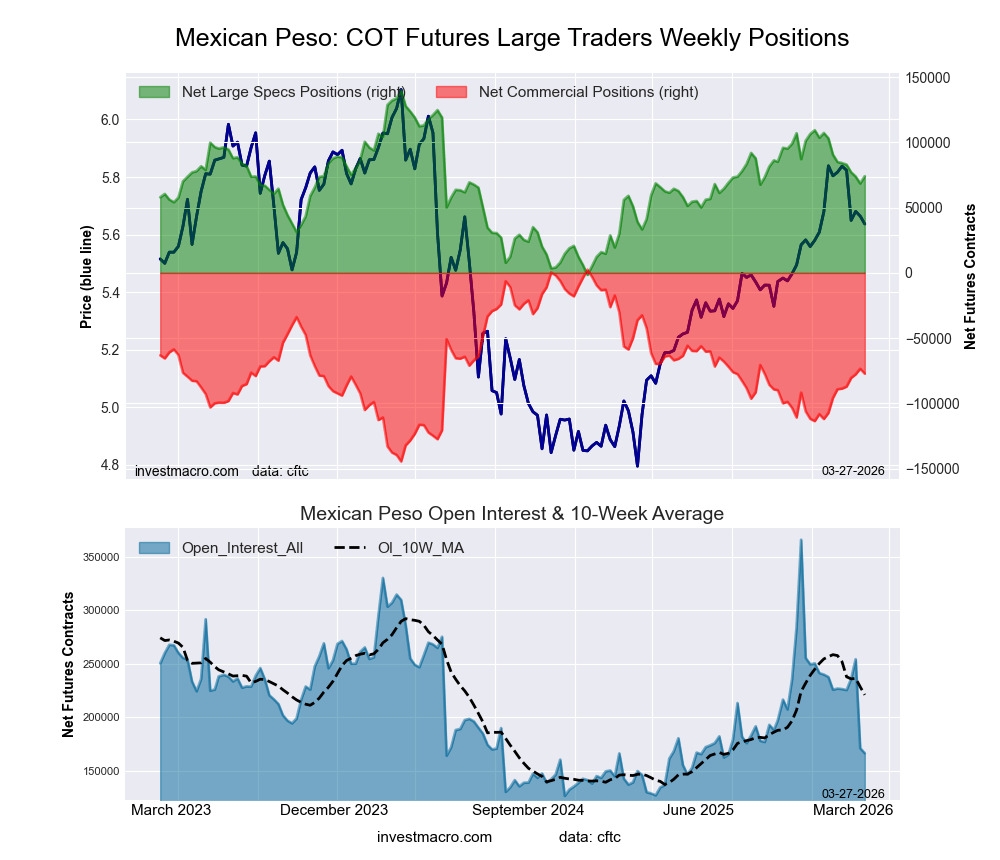
Mexican Peso Futures COT ChartThe Mexican Peso large speculator standing this week equaled a net position of 77,043 contracts in the data reported through Tuesday. This was a weekly decline of -5,837 contracts from the previous week which had a total of 82,880 net contracts.

This week’s current strength score (the trader positioning range over the past three years, measured from 0 to 100) shows the speculators are currently Bullish with a score of 55.6 percent. The commercials are Bearish with a score of 43.5 percent and the small traders (not shown in chart) are Bearish with a score of 42.0 percent.

Price Trend-Following Model: Uptrend

Our weekly trend-following model classifies the current market price position as: Uptrend.

MEXICAN PESO StatisticsSPECULATORSCOMMERCIALSSMALL TRADERS
– Percent of Open Interest Longs:53.638.02.5
– Percent of Open Interest Shorts:21.072.11.0
– Net Position:77,043-80,5163,473
– Gross Longs:126,53189,6365,852
– Gross Shorts:49,488170,1522,379
– Long to Short Ratio:2.6 to 10.5 to 12.5 to 1
NET POSITION TREND:
– Strength Index Score (3 Year Range Pct):55.643.542.0
– Strength Index Reading (3 Year Range):BullishBearishBearish
NET POSITION MOVEMENT INDEX:
– 6-Week Change in Strength Index:-21.321.4-7.3


Brazilian Real Futures:

Brazil Real Futures COT ChartThe Brazilian Real large speculator standing this week equaled a net position of 44,970 contracts in the data reported through Tuesday. This was a weekly advance of 8,296 contracts from the previous week which had a total of 36,674 net contracts.

This week’s current strength score (the trader positioning range over the past three years, measured from 0 to 100) shows the speculators are currently Bullish with a score of 72.7 percent. The commercials are Bearish with a score of 26.4 percent and the small traders (not shown in chart) are Bearish with a score of 42.4 percent.

Price Trend-Following Model: Uptrend

Our weekly trend-following model classifies the current market price position as: Uptrend.

BRAZIL REAL StatisticsSPECULATORSCOMMERCIALSSMALL TRADERS
– Percent of Open Interest Longs:67.427.54.5
– Percent of Open Interest Shorts:24.973.60.9
– Net Position:44,970-48,7933,823
– Gross Longs:71,26729,0324,810
– Gross Shorts:26,29777,825987
– Long to Short Ratio:2.7 to 10.4 to 14.9 to 1
NET POSITION TREND:
– Strength Index Score (3 Year Range Pct):72.726.442.4
– Strength Index Reading (3 Year Range):BullishBearishBearish
NET POSITION MOVEMENT INDEX:
– 6-Week Change in Strength Index:19.9-19.71.1


Bitcoin Futures:

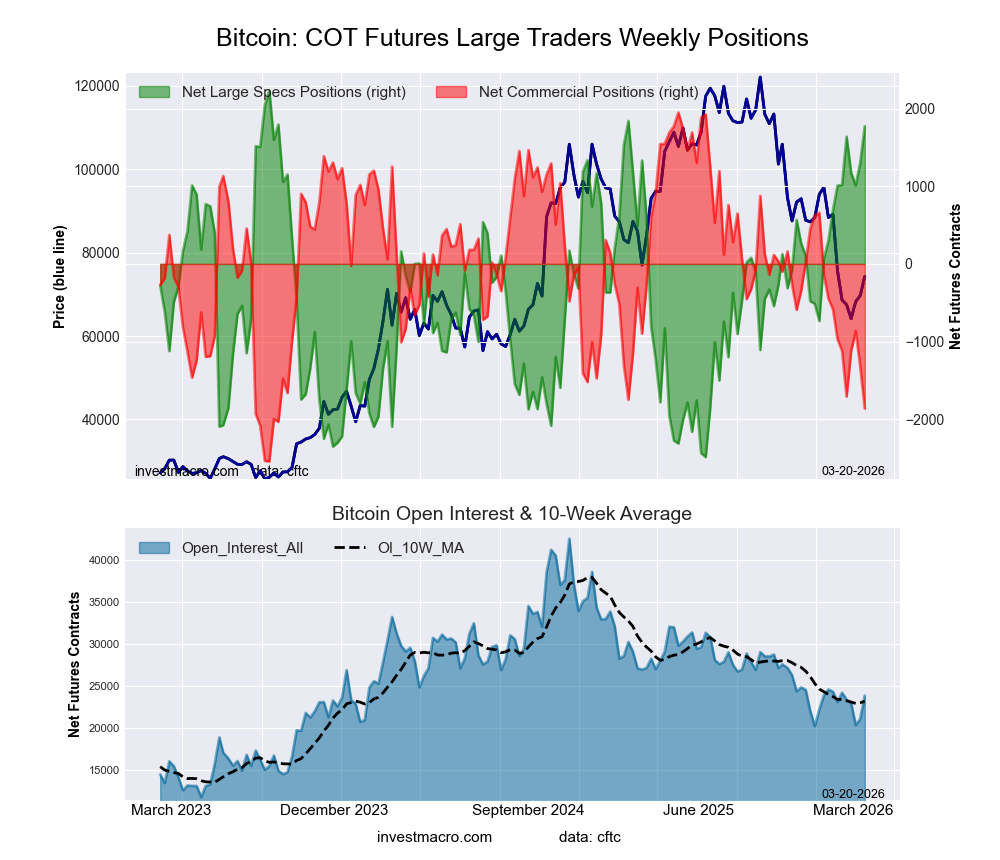
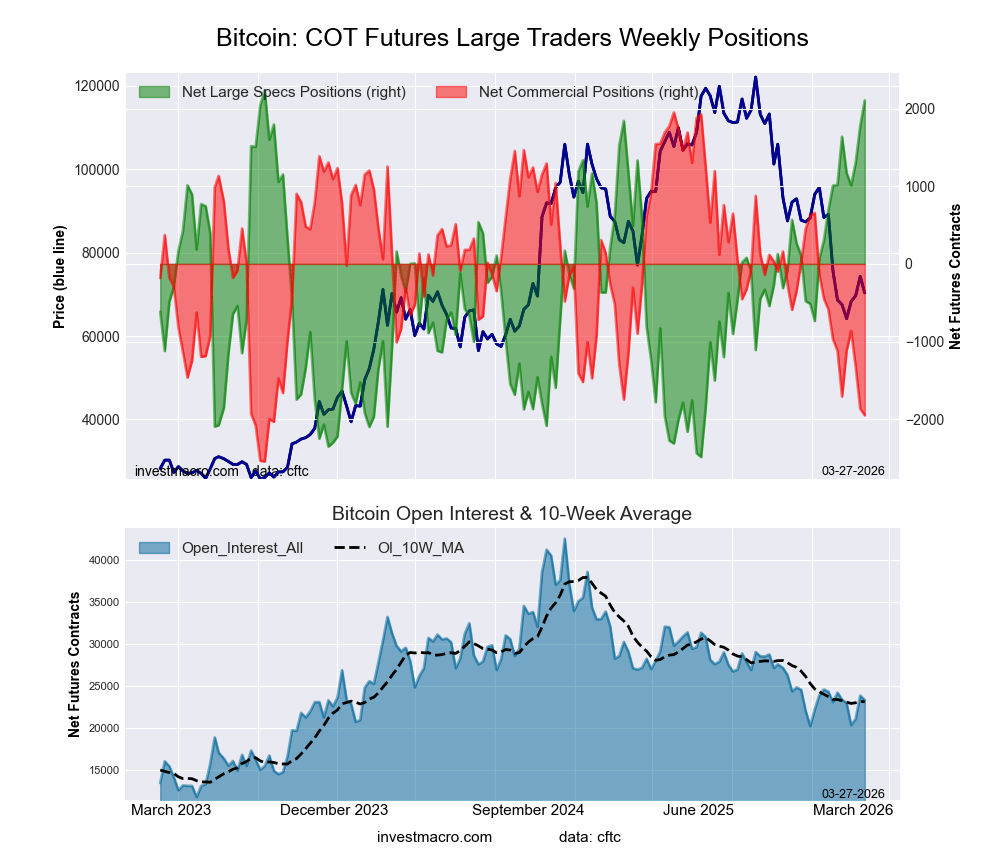
Bitcoin Crypto Futures COT ChartThe Bitcoin large speculator standing this week equaled a net position of 1,011 contracts in the data reported through Tuesday. This was a weekly fall of -161 contracts from the previous week which had a total of 1,172 net contracts.

This week’s current strength score (the trader positioning range over the past three years, measured from 0 to 100) shows the speculators are currently Bullish with a score of 74.1 percent. The commercials are Bearish with a score of 37.4 percent and the small traders (not shown in chart) are Bearish with a score of 29.6 percent.

Price Trend-Following Model: Strong Downtrend

Our weekly trend-following model classifies the current market price position as: Strong Downtrend.

BITCOIN StatisticsSPECULATORSCOMMERCIALSSMALL TRADERS
– Percent of Open Interest Longs:76.83.75.7
– Percent of Open Interest Shorts:71.87.96.4
– Net Position:1,011-862-149
– Gross Longs:15,5857511,149
– Gross Shorts:14,5741,6131,298
– Long to Short Ratio:1.1 to 10.5 to 10.9 to 1
NET POSITION TREND:
– Strength Index Score (3 Year Range Pct):74.137.429.6
– Strength Index Reading (3 Year Range):BullishBearishBearish
NET POSITION MOVEMENT INDEX:
– 6-Week Change in Strength Index:15.1-9.3-15.3


Article By InvestMacroReceive our weekly COT Newsletter

*COT Report: The COT data, released weekly to the public each Friday, is updated through the most recent Tuesday (data is 3 days old) and shows a quick view of how large speculators or non-commercials (for-profit traders) were positioned in the futures markets.

The CFTC categorizes trader positions according to commercial hedgers (traders who use futures contracts for hedging as part of the business), non-commercials (large traders who speculate to realize trading profits) and nonreportable traders (usually small traders/speculators) as well as their open interest (contracts open in the market at time of reporting). See CFTC criteria here.

Week Ahead: Dollar set to tighten grip on FX throne?

By ForexTime 

  • FXTM’s USDInd ↑ 2% MTD 
  • Dollar best performing G10 currency MTD
  • Geopolitical risk + US CPI combo = fresh volatility?
  • Over past year US CPI decision triggered moves of ↑ 0.2% & ↓ 0.6% 
  • Technical levels: 98.00, 99.00 and 100.00

Global markets have been thrown into turmoil due to the deepening conflict in the Middle East.

As the confrontation between the US, Israel and Iran rages on, investor sentiment remains fragile with fears intensifying of a wider conflict in the region.

Mounting geopolitical risk and top-tier data could provide fresh trading opportunities in the week ahead:

Monday, 9th March

  • CN50: China PPI, CPI
  • EUR: Germany industrial production
  • TWN: Taiwan trade

Tuesday, 10th March

  • AUD: Australia Westpac consumer confidence
  • JPY: Japan GDP, money stock
  • EUR: EU finance ministers meet in Brussels to discuss policy
  • ZAR: South Africa GDP
  • Saudi Aramco earnings.

Wednesday, 11th March

  • EUR: Germany CPI
  • JPY: Japan PPI
  • USDInd: US CPI, federal budget balance

Thursday, 12th March

  • ZAR: South Africa manufacturing production
  • USDInd: US housing starts, trade, initial jobless claims
  • GBP: BOE Governor Andrew Bailey speech


Friday, 13th June

  • CAD: Canada unemployment
  • EUR: Eurozone industrial production
  • NZD: New Zealand BusinessNZ manufacturing PMI
  • GBP: UK industrial production, trade balance
  • USDInd: US consumer income, PCE price index, GDP, University of Michigan consumer sentiment

The spotlight shines on FXTM’s USDInd which has surged on safe haven flows as investors scrambled to price in the chaos.

Note: FXTM’s USDInd measures how the dollar performs against a basket of six different G10 currencies, including the Euro, British Pound, Japanese Yen, and Canadian dollar, Swedish krona & Swiss franc.

Here is how they are weighted:

  • Euro: 57.6%
  • JPY: 13.6%
  • GBP: 11.9%
  • CAD: 9.1%
  • SEK: 4.2%
  • CHF: 3.6%

Geopolitical conflict and key US data could spell fresh volatility for the USDInd.

Here are 4 reasons why:

1.  US-Israel war with Iran

The ongoing US-Israeli offensive against Iran has jolted financial markets, sparking a wave of risk aversion.

This has sent investors sprinting toward safe-haven destinations, including the US dollar.

  • Should the situation worsen and risk spilling over into a wider conflict, the dollar may be boosted further by safe-haven flows.
  • Signs of easing tensions may boost the market mood, weakening the dollar as appetite for safe-haven assets cools.

2. US CPI + PCE combo

The latest US inflation reports are likely to shape expectations around the Fed’s future policy moves.

  • Wednesday 11th March – US Feb CPI
  • CPI year-on-year (Feb 2025 vs. Feb 2026) to rise 2.5%

———————————————————————————————————

  • Friday 13th March – US Jan PCE – Fed’s preferred inflation gauge
  • Core PCE year-on-year to rise 3.1% from 3.0%.

This week alone, aggressively rising energy prices have raised inflationary fears – forcing markets to push back against bets around lower US rates.

  • The USDInd could jump if the incoming inflation reports reveal signs of rising price pressures.
  • Any signs of cooling prices pressures may support the argument around lower US rates.

Over the past 12 months, the US CPI has triggered upside moves on the USDInd of as much as 0.2% or declines of 0.6% in a 6-hour window post-release.

Traders are currently pricing a 60% chance that the Fed cuts rates at least twice in 2025.

3.  Europe data dump

A string of key data across Europe including, German industrial production and CPI could influence sentiment toward the European economy and the Euro.

It is worth noting that the EUR makes up roughly 58% of the USDInd weight.

  • Stronger than expected data from Europe may weigh on the USDInd as the euro appreciates.
  • Disappointing data from Europe could boost the USDInd as the euro weakens.

4. Technical forces

FXTM’s USDInd is pushing higher on the daily charts. However, the Relative Strength Index is close to 70 – signalling that prices are nearly overbought.

  •  A solid breakout and weekly close above 99.00 could signal a move back toward 100.00 and 100.50.
  •  Sustained weakness below 99.00 could see price decline back toward the 200-day SMA and the 50-day SMA at 98.00.


Forex-Time-LogoArticle by ForexTime


ForexTime Ltd (FXTM) is an award winning international online forex broker regulated by CySEC 185/12 www.forextime.com

EUR/USD Under Pressure: Middle East Risks Outweigh All Else

By Analytical Department RoboForex

EUR/USD is holding near 1.1620 on Friday, with the US dollar on track to gain approximately 1% by the end of the week. The dollar is benefiting from safe-haven demand amid the escalating conflict in the Middle East and rising crude oil prices.

The joint US-Israel military operation against Iran continues into its seventh day. Tehran has responded with a fresh wave of missile and drone strikes targeting Gulf countries.

US President Donald Trump also stated that he would like to be involved in selecting Iran’s next leader. At the same time, he described the appointment of Mojtaba Khamenei – son of the late Supreme Leader – as unlikely.

Rising oil prices have heightened concerns over a new wave of global inflation, reinforcing expectations that the Federal Reserve may delay interest rate cuts. Markets now anticipate the first Fed rate cut no earlier than September or October, revised down from the previous July forecast.

This week, the dollar strengthened most notably against the euro, reflecting the European economy’s heavy reliance on oil imports from the Middle East.

Technical Analysis

On the H4 chart, EUR/USD is forming a compact consolidation range around the 1.1600 level. The current structure suggests a high probability of a wave developing towards 1.1533, with scope to extend further to 1.1500.

A downside breakout from this range would open the door for the second half of the momentum to unfold, with targets at least around 1.1400. Technically, this scenario is confirmed by the MACD indicator, whose signal line is below zero and pointing strictly downwards, reflecting sustained bearish momentum.

On the H1 chart, the market has completed a growth wave targeting 1.1620, followed by a decline to form a consolidation range around 1.1600. An upside breakout from this range could trigger another growth leg to 1.1660, potentially extending to 1.1675, after which the broader downward trend is likely to resume towards 1.1500.

A downside breakout from the range would activate a continuation wave towards 1.1500, which could mark the completion of the third wave in the broader downward trend. This scenario is confirmed by the Stochastic oscillator, whose signal line has turned away from 80, indicating a short-term downward swing towards the 20 level.

Conclusion

EUR/USD remains under significant pressure as geopolitical tensions in the Middle East drive safe-haven flows into the US dollar, while pushing oil prices higher and stoking inflation concerns. The combination of delayed Fed rate cut expectations and Europe’s particular vulnerability to energy disruptions has exacerbated the euro’s weakness. With technical indicators pointing firmly lower, further downside appears likely, though short-term consolidation around key levels may precede the next leg of the downtrend.


Disclaimer

Any forecasts contained herein are based on the author’s particular opinion. This analysis may not be treated as trading advice. RoboForex bears no responsibility for trading results based on trading recommendations and reviews contained herein.
GBP/USD: Market Not Expecting BoE Rate Cut in March

By Analytical Department RoboForex

GBP/USD contracted to 1.3350 on Thursday, with the pound remaining under pressure and trading near three-month lows.

Pressure on the dollar has eased over the past 24 hours following reports that Iran has offered to discuss terms for a potential end to the conflict. According to The New York Times, representatives of the Iranian Ministry of Intelligence made contact with the CIA through intermediaries, just one day after the commencement of joint US-Israel attacks. However, Israeli authorities have advised Washington not to respond to this proposal just yet.

Investors are also weighing the impact of rising energy prices on the Bank of England’s (BoE) future policy. With inflationary risks rising, expectations of an imminent rate cut have diminished significantly.

The market now assigns only a 20% probability of a BoE rate cut this month, a sharp decline from around 75% just a week ago.

Meanwhile, the UK’s Office for Budget Responsibility (OBR) has downgraded its economic growth forecast for 2026 to 1.1%, down from the previously anticipated 1.4%. However, the outlook for 2027 and 2028 remains more optimistic, with annual growth projected at around 1.6%. A gradual decline in government borrowing and inflation is also expected.

Technical Analysis

On the H4 GBP/USD chart, the market is forming a wide consolidation range around the 1.3326 level, currently extending up to 1.3393. A decline to 1.3131 is expected in the near term. Following this correction, a new consolidation phase is likely. An upside breakout would pave the way for the wave to extend to 1.3410, while a downside breakout would suggest further movement towards 1.2971. This scenario is confirmed by the MACD indicator, which shows its signal line below the zero line and pointing firmly downwards.

On the H1 chart, the market has formed a compact consolidation range around the 1.3333 level. A downside breakout has initiated a wave structure extending to 1.3266. If this level is breached, further downside potential towards 1.3125 is possible. This scenario is supported by the Stochastic oscillator, whose signal line is below the 50 level and pointing firmly downwards.

Conclusion

GBP/USD remains under pressure, with shifting central bank expectations and geopolitical developments driving price action. The dramatic reversal in BoE rate-cut probabilities – from 75% to just 20% in a week – reflects growing concerns about inflation driven by rising energy prices. While tentative diplomatic signals from Iran have temporarily eased dollar strength, the technical outlook for the pair remains decidedly bearish, with further downside anticipated in the near term.


Disclaimer

Any forecasts contained herein are based on the author’s particular opinion. This analysis may not be treated as trading advice. RoboForex bears no responsibility for trading results based on trading recommendations and reviews contained herein.
USD/JPY to Quickly Return to Growth: Momentum Favours the US Dollar

By Analytical Department RoboForex

USD/JPY paused briefly midweek after a series of solid gains, currently trading at 157.59. The Japanese currency remains under pressure from a strengthening US dollar amid concerns that a prolonged conflict in the Middle East could keep energy prices elevated and heighten inflation risks.

The market has also revised its expectations for Federal Reserve rate cuts, shifting the likelihood of a reduction from July to September. Amid escalating geopolitical tensions, the dollar has emerged as a primary safe-haven asset, particularly as the US-Israel military operation against Iran enters its fifth phase.

US President Donald Trump suggested that the strikes could lead to a change of power in Iran. However, any new regime might prove equally problematic, underscoring the uncertainty surrounding the conflict’s outcome.

Japanese Finance Minister Satsuki Katayama reiterated that currency interventions remain a potential tool to support the yen. According to her, authorities are monitoring exchange rate dynamics with heightened urgency and are coordinating their actions with the US.

Technical Analysis

On the H4 USD/JPY chart, the market is forming a consolidation range around 157.00, which is currently extending to 157.92. A decline to test the 157.00 level from above is expected today. Following this, a potential growth leg towards 158.06 is likely. Technically, this scenario is supported by the MACD indicator, whose signal line is well above the zero line and pointing firmly downward.

On the H1 chart, USD/JPY is forming a downward wave pattern, targeting the 157.00 level, with a possible extension to 156.66, and further growth towards 158.38 anticipated thereafter. Technically, this scenario is confirmed by the Stochastic oscillator, with its signal line above the 20 level and pointing firmly downward.

Conclusion

USD/JPY’s brief consolidation appears temporary, with the broader trend favouring further upside for the dollar. Geopolitical tensions in the Middle East have reinforced the dollar’s safe-haven status, pushing back expectations for Fed rate cuts and creating a supportive backdrop for the pair. Despite verbal intervention warnings from Japanese officials, the technical outlook suggests USD/JPY is poised to resume its upward trajectory once the current correction runs its course.


Disclaimer

Any forecasts contained herein are based on the author’s particular opinion. This analysis may not be treated as trading advice. RoboForex bears no responsibility for trading results based on trading recommendations and reviews contained herein.
EUR/USD Reacts to Geopolitics and Data: Week Opens Nervously

By Analytical Department RoboForex

EUR/USD rose to 1.1790 on Monday. The US dollar attempted to strengthen, but part of its rally was subsequently pared back. Demand for safe-haven assets intensified over the weekend amid an escalation of the conflict in the Middle East.

The US and Israel conducted strikes on Iran, resulting in the death of the country’s supreme leader, Ayatollah Ali Khamenei. Reports also emerged of the effective closure of the Strait of Hormuz, a crucial route for global oil supplies. Tehran has responded with attacks on American targets in the region, fuelling fears of a broader conflict.

Additional support for the dollar came from US producer inflation data. January’s PPI rose more sharply than expected, suggesting that companies are passing on tariff-related costs to consumers, which complicates the outlook for a potential Federal Reserve rate cut.

Nevertheless, the market continues to price in two 25-basis-point rate cuts from the Fed this year. The prevailing sentiment is that volatility and geopolitical risks could eventually force the central bank to ease its monetary policy.

Technical Analysis

On the H4 chart of EUR/USD, the market is forming a consolidation range around the 1.1834 level. A downside breakout is expected, with the decline continuing to 1.1712, and the potential for the trend to extend further to 1.1590. Technically, this bearish scenario is confirmed by the MACD indicator, whose signal line is below zero and pointing firmly downwards, reflecting sustained bearish momentum.

On the H1 chart, the market is forming the structure of the next downward wave towards 1.1712. After reaching this level, a corrective rise to 1.1768 is anticipated, followed by the start of a new downward wave to 1.1650. Technically, this scenario is supported by the Stochastic oscillator, with its signal line below 50 and pointing firmly downwards towards the 20 level.

Conclusion

The euro is navigating a complex landscape, with safe-haven flows and geopolitical tensions in the Middle East initially boosting the US dollar, while hotter-than-expected US PPI data adds another layer of uncertainty to Fed policy. Although the market still anticipates rate cuts later this year, the immediate technical outlook for EUR/USD appears bearish, suggesting further downside in the short term.


Disclaimer

Any forecasts contained herein are based on the author’s particular opinion. This analysis may not be treated as trading advice. RoboForex bears no responsibility for trading results based on trading recommendations and reviews contained herein.
Currency Speculators push Aussie Bets Higher, Euro & GBP Bets fall this week

By InvestMacro

Speculators OI FX Futures COT Chart

Open Interest Strength Levels show where current Open Futures Contracts are highest and lowest (higher interest can fuel trends and setup for more potential moves & vice versa) for currency markets.


Here are the latest charts and statistics for the Commitment of Traders (COT) data published by the Commodities Futures Trading Commission (CFTC).

The latest COT data is updated through Tuesday February 24th and shows a quick view of how large market participants (for-profit speculators and commercial traders) were positioned in the futures markets. All currency positions are in direct relation to the US dollar where, for example, a bet for the euro is a bet that the euro will rise versus the dollar while a bet against the euro will be a bet that the euro will decline versus the dollar.

Weekly Speculator Changes led by Australian Dollar & New Zealand Dollar

Speculators Nets FX Futures COT Chart
The COT currency market speculator bets were overall lower this week as just four out of the eleven currency markets we cover had higher positioning while the other seven markets had lower speculator contracts.

Leading the gains for the currency markets was the Australian Dollar (6,713 contracts) with the New Zealand Dollar (5,446 contracts), the Brazilian Real (2,012 contracts) and the Canadian Dollar (1,752 contracts) also seeing gaining weeks.

The currencies seeing declines in speculator bets on the week were the EuroFX (-17,624 contracts), the British Pound (-14,668 contracts), the US Dollar Index (-2,117 contracts), the Japanese Yen (-1,416 contracts), the Mexican Peso (-1,242 contracts), Bitcoin (-466 contracts) and with the Swiss Franc (-305 contracts) also recording lower bets on the week.

Speculators push Aussie Bets Higher, Euro & GBP Bets fall this week

Highlighting the currency speculator positioning for last week through Tuesday was the continued bullishness for speculators in the Australian dollar. The New Zealand dollar speculator bets continued to improve despite being bearish while the Euro bets took a breather and the British pound speculator position went increasingly bearish.

First off, the Australian dollar speculator position rose this week for a 13th consecutive week, with speculator positions adding a total of +136,820 net contracts over that time period. This has taken the Australian dollar net position from a total of -84,176 contracts on November 25th to this week’s net position of 52,644 contracts. This is the best level for the Australian dollar net position since October 24th of 2017, a span of 435 weeks. The Australian dollar in the foreign exchange market has continued to rally since the beginning of the year and is up by almost 6.50 percent since the start of 2026. Since the AUD lows in February of last year, the Australian dollar has risen by over 16 percent against the US dollar. The Aussie has been able to hold above the major 0.7000 level and closed out the week above the 0.7100 exchange rate. The AUD has been having its highest weekly closes at the highest levels since early 2023.

The New Zealand dollar speculator position has been improving steadily, with weekly speculator bets improving in six out of the last eleven weeks for an eleven-week gain of 27,214 net contracts. These gains date back to December 9th when the net position totaled -56,781 net contracts, which was the all-time low or most bearish level in history for the NZD speculator positions. Since then, the bets have been improving and this week reached a -29,567 net contract level, the best level or least bearish standing of the past twenty weeks. In the spot price market, the NZD has been up in six out of the past seven weeks and is currently trading right around the major psychological level of 0.6000 threshold, which also coincides with the two hundred weekly moving average.

Euro speculator bets took a breather this week and fell for a second consecutive week. The Euro speculator positions have been mixed over the last ten weeks, with five weeks of falling speculator bets and five weeks of gaining speculator bets. Although the net change over the last ten weeks has been roughly a +12,000 net contracts. Overall, the speculator positioning for the Euro remains highly bullish with this week’s net position over +156,000 contracts. This marks the 13th consecutive week that the net position has been over +100,000 net contracts, and this is the 33rd out of the last 37 weeks that the net position has been over +100,000 net contracts. In the forex markets, the Euro closed over the 1.1820 level this week after seeing a small weekly gain. Continued overhead and major resistance resides at 1.2000, while there is support at the 1.1750 level, as well as the 1.1600 level below.

The British pound sterling saw its third week of strong bearish positioning and has now dropped by over -43,000 net contracts in the past three weeks. Previously, the British pound sterling had seen ten straight weeks of gains, so these last three weeks have cooled off that streak of bets. This week’s net position of negative -57,072 net contracts is the most bearish level of the past eleven weeks. Overall, the British pound sterling has been in bearish territory for 31 consecutive weeks dating back to July 2025. In the foreign exchange markets, the British pound sterling closed out the week at the 1.3480 level and has fallen for three out of the past four weeks. Currently, the bulls and the bears are battling it out around the 1.3500 area to see if this currency is gonna continue higher or take a breather and retreat lower. Since the beginning of 2025, the British pound has been up by approximately 11 percent against the US dollar in that time-frame.

The US dollar index bets dipped this week following four consecutive weeks of gains that had brought the US dollar index net position into a small bullish level last week. Last week’s pop up into the bullish level was the first time since June 2025 that the US dollar index had seen a bullish net contract position, a span of 36 weeks. This week’s dollar index speculator position dipped by over -2,100 contracts, bringing the overall net positioning to -1,789 net contracts. Essentially, this is a neutral position for speculator contracts and shows there is no dominant trend in where the speculators are leaning, with uncertainty as to whether we go up or down from here. In the Forex markets, the USD index had a small dip this week in price and is settling in and consolidating around the 97.50 exchange rate. The USD index has overhead resistance at the 98.00 level, while there is also strong support below as prices have bounced off the 96.50 level at least three times since June and have been unable to hold below that level for any amount of time.

Brazilian Real leads Currency Market Price Performance

This week’s five-day price performance was led by the Brazilian real, which rose by over one percent with a 1.03 percent gain on the week. The Swiss franc came in second with a 0.91 percent increase, followed by the Australian dollar, which rose by 0.50 percent on the week.

The New Zealand dollar was higher by 0.40 percent, followed by the Canadian dollar, which saw an uptick by 0.35 percent. The Euro was marginally higher at 0.32 percent.

On the downside, Bitcoin saw a -3.02 percent shortfall on the week. The Mexican peso was down by -0.62 percent, followed by the Japanese yen with a similar -0.61 percent decline. The US dollar index was lower by -0.11 percent, and the British pound was virtually unchanged with a small edge lower by -0.02 percent.

Over the past thirty days, the Australian dollar has been the standout performer with a 6.49 percent gain over that period. The Brazilian real has been up by 4.87 percent while the Swiss franc has been higher by 4.55 percent and the New Zealand dollar has also floated higher by 4.29 percent in the 30-day time-frame.


Currencies Data:

Speculators FX Futures COT Data Table
Legend: Open Interest | Speculators Current Net Position | Weekly Specs Change | Specs Strength Score compared to last 3-Years (0-100 range)


Strength Scores led by Canadian Dollar & Australian Dollar

Speculators Strength Scores FX Futures COT Chart
COT Strength Scores (a normalized measure of Speculator positions over a 3-Year range, from 0 to 100 where above 80 is Extreme-Bullish and below 20 is Extreme-Bearish, a 50 score is right down the middle of the past 3-Years) showed that the Canadian Dollar (100 percent) and the Australian Dollar (100 percent) lead the currency markets this week. The EuroFX (88 percent), Bitcoin (78 percent) and the Mexican Peso (67 percent) come in as the next highest in the weekly strength scores.

On the downside, the British Pound (15 percent) and the Swiss Franc (17 percent) come in at the lowest strength levels currently and are both in Extreme-Bearish territory (below 20 percent). The next lowest strength scores are the New Zealand Dollar (31 percent) and the US Dollar Index (39 percent).

3-Year Strength Statistics:
US Dollar Index (39.3 percent) vs US Dollar Index previous week (45.0 percent)
EuroFX (88.5 percent) vs EuroFX previous week (95.2 percent)
British Pound Sterling (15.4 percent) vs British Pound Sterling previous week (21.6 percent)
Japanese Yen (53.9 percent) vs Japanese Yen previous week (54.3 percent)
Swiss Franc (17.4 percent) vs Swiss Franc previous week (18.1 percent)
Canadian Dollar (100.0 percent) vs Canadian Dollar previous week (99.2 percent)
Australian Dollar (100.0 percent) vs Australian Dollar previous week (95.8 percent)
New Zealand Dollar (31.1 percent) vs New Zealand Dollar previous week (24.9 percent)
Mexican Peso (66.8 percent) vs Mexican Peso previous week (67.5 percent)
Brazilian Real (66.6 percent) vs Brazilian Real previous week (63.0 percent)
Bitcoin (77.5 percent) vs Bitcoin previous week (87.4 percent)


Australian Dollar & Canadian Dollar top the 6-Week Strength Trends

Speculators Trends FX Futures COT Chart
COT Strength Score Trends (or move index, calculates the 6-week changes in strength scores) showed that the Australian Dollar (45 percent) and the Canadian Dollar (31 percent) lead the past six weeks trends for the currencies. Bitcoin (23 percent), the New Zealand Dollar (22 percent) and the Japanese Yen (16 percent) are the next highest positive movers in the 3-Year trends data.

The British Pound (-14 percent) leads the downside trend scores currently with the Mexican Peso (-12 percent) following next with a lower trend score.

3-Year Strength Trends:
US Dollar Index (5.2 percent) vs US Dollar Index previous week (11.2 percent)
EuroFX (9.2 percent) vs EuroFX previous week (4.4 percent)
British Pound Sterling (-13.5 percent) vs British Pound Sterling previous week (-5.0 percent)
Japanese Yen (15.6 percent) vs Japanese Yen previous week (1.1 percent)
Swiss Franc (4.5 percent) vs Swiss Franc previous week (-1.2 percent)
Canadian Dollar (31.2 percent) vs Canadian Dollar previous week (29.7 percent)
Australian Dollar (44.6 percent) vs Australian Dollar previous week (40.5 percent)
New Zealand Dollar (22.0 percent) vs New Zealand Dollar previous week (9.5 percent)
Mexican Peso (-12.1 percent) vs Mexican Peso previous week (-14.7 percent)
Brazilian Real (13.7 percent) vs Brazilian Real previous week (-7.6 percent)
Bitcoin (23.4 percent) vs Bitcoin previous week (50.3 percent)


Individual COT Forex Markets:

US Dollar Index Futures:

US Dollar Index Forex Futures COT ChartThe US Dollar Index large speculator standing this week came in at a net position of -1,789 contracts in the data reported through Tuesday. This was a weekly reduction of -2,117 contracts from the previous week which had a total of 328 net contracts.

This week’s current strength score (the trader positioning range over the past three years, measured from 0 to 100) shows the speculators are currently Bearish with a score of 39.3 percent. The commercials are Bullish with a score of 63.6 percent and the small traders (not shown in chart) are Bearish with a score of 25.1 percent.

Price Trend-Following Model: Downtrend

Our weekly trend-following model classifies the current market price position as: Downtrend.

US DOLLAR INDEX StatisticsSPECULATORSCOMMERCIALSSMALL TRADERS
– Percent of Open Interest Longs:50.731.78.1
– Percent of Open Interest Shorts:57.521.911.1
– Net Position:-1,7892,582-793
– Gross Longs:13,2958,3122,119
– Gross Shorts:15,0845,7302,912
– Long to Short Ratio:0.9 to 11.5 to 10.7 to 1
NET POSITION TREND:
– Strength Index Score (3 Year Range Pct):39.363.625.1
– Strength Index Reading (3 Year Range):BearishBullishBearish
NET POSITION MOVEMENT INDEX:
– 6-Week Change in Strength Index:5.2-3.2-13.7


Euro Currency Futures:

Euro Currency Futures COT ChartThe Euro Currency large speculator standing this week came in at a net position of 156,856 contracts in the data reported through Tuesday. This was a weekly fall of -17,624 contracts from the previous week which had a total of 174,480 net contracts.

This week’s current strength score (the trader positioning range over the past three years, measured from 0 to 100) shows the speculators are currently Bullish-Extreme with a score of 88.5 percent. The commercials are Bearish-Extreme with a score of 9.3 percent and the small traders (not shown in chart) are Bullish-Extreme with a score of 88.6 percent.

Price Trend-Following Model: Uptrend

Our weekly trend-following model classifies the current market price position as: Uptrend.

EURO Currency StatisticsSPECULATORSCOMMERCIALSSMALL TRADERS
– Percent of Open Interest Longs:32.454.710.2
– Percent of Open Interest Shorts:15.177.84.3
– Net Position:156,856-210,90354,047
– Gross Longs:294,873498,04493,336
– Gross Shorts:138,017708,94739,289
– Long to Short Ratio:2.1 to 10.7 to 12.4 to 1
NET POSITION TREND:
– Strength Index Score (3 Year Range Pct):88.59.388.6
– Strength Index Reading (3 Year Range):Bullish-ExtremeBearish-ExtremeBullish-Extreme
NET POSITION MOVEMENT INDEX:
– 6-Week Change in Strength Index:9.2-10.614.6


British Pound Sterling Futures:

British Pound Sterling Futures COT ChartThe British Pound Sterling large speculator standing this week came in at a net position of -57,072 contracts in the data reported through Tuesday. This was a weekly fall of -14,668 contracts from the previous week which had a total of -42,404 net contracts.

This week’s current strength score (the trader positioning range over the past three years, measured from 0 to 100) shows the speculators are currently Bearish-Extreme with a score of 15.4 percent. The commercials are Bullish-Extreme with a score of 82.1 percent and the small traders (not shown in chart) are Bullish with a score of 55.6 percent.

Price Trend-Following Model: Uptrend

Our weekly trend-following model classifies the current market price position as: Uptrend.

BRITISH POUND StatisticsSPECULATORSCOMMERCIALSSMALL TRADERS
– Percent of Open Interest Longs:27.355.211.9
– Percent of Open Interest Shorts:50.532.411.5
– Net Position:-57,07256,176896
– Gross Longs:67,213135,80429,236
– Gross Shorts:124,28579,62828,340
– Long to Short Ratio:0.5 to 11.7 to 11.0 to 1
NET POSITION TREND:
– Strength Index Score (3 Year Range Pct):15.482.155.6
– Strength Index Reading (3 Year Range):Bearish-ExtremeBullish-ExtremeBullish
NET POSITION MOVEMENT INDEX:
– 6-Week Change in Strength Index:-13.512.02.9


Japanese Yen Futures:

Japanese Yen Forex Futures COT ChartThe Japanese Yen large speculator standing this week came in at a net position of 11,539 contracts in the data reported through Tuesday. This was a weekly fall of -1,416 contracts from the previous week which had a total of 12,955 net contracts.

This week’s current strength score (the trader positioning range over the past three years, measured from 0 to 100) shows the speculators are currently Bullish with a score of 53.9 percent. The commercials are Bearish with a score of 47.2 percent and the small traders (not shown in chart) are Bearish with a score of 45.1 percent.

Price Trend-Following Model: Downtrend

Our weekly trend-following model classifies the current market price position as: Downtrend.

JAPANESE YEN StatisticsSPECULATORSCOMMERCIALSSMALL TRADERS
– Percent of Open Interest Longs:40.438.410.5
– Percent of Open Interest Shorts:37.342.49.7
– Net Position:11,539-14,7293,190
– Gross Longs:149,364141,91838,952
– Gross Shorts:137,825156,64735,762
– Long to Short Ratio:1.1 to 10.9 to 11.1 to 1
NET POSITION TREND:
– Strength Index Score (3 Year Range Pct):53.947.245.1
– Strength Index Reading (3 Year Range):BullishBearishBearish
NET POSITION MOVEMENT INDEX:
– 6-Week Change in Strength Index:15.6-15.39.9


Swiss Franc Futures:

Swiss Franc Forex Futures COT ChartThe Swiss Franc large speculator standing this week came in at a net position of -41,186 contracts in the data reported through Tuesday. This was a weekly reduction of -305 contracts from the previous week which had a total of -40,881 net contracts.

This week’s current strength score (the trader positioning range over the past three years, measured from 0 to 100) shows the speculators are currently Bearish-Extreme with a score of 17.4 percent. The commercials are Bullish with a score of 64.7 percent and the small traders (not shown in chart) are Bullish-Extreme with a score of 83.8 percent.

Price Trend-Following Model: Strong Uptrend

Our weekly trend-following model classifies the current market price position as: Strong Uptrend.

SWISS FRANC StatisticsSPECULATORSCOMMERCIALSSMALL TRADERS
– Percent of Open Interest Longs:11.969.019.0
– Percent of Open Interest Shorts:54.427.617.8
– Net Position:-41,18640,0071,179
– Gross Longs:11,52566,77818,411
– Gross Shorts:52,71126,77117,232
– Long to Short Ratio:0.2 to 12.5 to 11.1 to 1
NET POSITION TREND:
– Strength Index Score (3 Year Range Pct):17.464.783.8
– Strength Index Reading (3 Year Range):Bearish-ExtremeBullishBullish-Extreme
NET POSITION MOVEMENT INDEX:
– 6-Week Change in Strength Index:4.5-11.721.0


Canadian Dollar Futures:

Canadian Dollar Forex Futures COT ChartThe Canadian Dollar large speculator standing this week came in at a net position of 27,578 contracts in the data reported through Tuesday. This was a weekly lift of 1,752 contracts from the previous week which had a total of 25,826 net contracts.

This week’s current strength score (the trader positioning range over the past three years, measured from 0 to 100) shows the speculators are currently Bullish-Extreme with a score of 100.0 percent. The commercials are Bearish-Extreme with a score of 0.0 percent and the small traders (not shown in chart) are Bullish with a score of 52.8 percent.

Price Trend-Following Model: Uptrend

Our weekly trend-following model classifies the current market price position as: Uptrend.

CANADIAN DOLLAR StatisticsSPECULATORSCOMMERCIALSSMALL TRADERS
– Percent of Open Interest Longs:41.742.313.6
– Percent of Open Interest Shorts:29.355.912.4
– Net Position:27,578-30,2602,682
– Gross Longs:92,81294,07430,230
– Gross Shorts:65,234124,33427,548
– Long to Short Ratio:1.4 to 10.8 to 11.1 to 1
NET POSITION TREND:
– Strength Index Score (3 Year Range Pct):100.00.052.8
– Strength Index Reading (3 Year Range):Bullish-ExtremeBearish-ExtremeBullish
NET POSITION MOVEMENT INDEX:
– 6-Week Change in Strength Index:31.2-32.517.4


Australian Dollar Futures:

Australian Dollar Forex Futures COT ChartThe Australian Dollar large speculator standing this week came in at a net position of 52,644 contracts in the data reported through Tuesday. This was a weekly increase of 6,713 contracts from the previous week which had a total of 45,931 net contracts.

This week’s current strength score (the trader positioning range over the past three years, measured from 0 to 100) shows the speculators are currently Bullish-Extreme with a score of 100.0 percent. The commercials are Bearish-Extreme with a score of 0.0 percent and the small traders (not shown in chart) are Bullish-Extreme with a score of 92.7 percent.

Price Trend-Following Model: Strong Uptrend

Our weekly trend-following model classifies the current market price position as: Strong Uptrend.

AUSTRALIAN DOLLAR StatisticsSPECULATORSCOMMERCIALSSMALL TRADERS
– Percent of Open Interest Longs:48.930.317.1
– Percent of Open Interest Shorts:27.861.47.2
– Net Position:52,644-77,31324,669
– Gross Longs:121,66175,38042,604
– Gross Shorts:69,017152,69317,935
– Long to Short Ratio:1.8 to 10.5 to 12.4 to 1
NET POSITION TREND:
– Strength Index Score (3 Year Range Pct):100.00.092.7
– Strength Index Reading (3 Year Range):Bullish-ExtremeBearish-ExtremeBullish-Extreme
NET POSITION MOVEMENT INDEX:
– 6-Week Change in Strength Index:44.6-37.84.7


New Zealand Dollar Futures:

New Zealand Dollar Forex Futures COT ChartThe New Zealand Dollar large speculator standing this week came in at a net position of -29,567 contracts in the data reported through Tuesday. This was a weekly boost of 5,446 contracts from the previous week which had a total of -35,013 net contracts.

This week’s current strength score (the trader positioning range over the past three years, measured from 0 to 100) shows the speculators are currently Bearish with a score of 31.1 percent. The commercials are Bullish with a score of 65.2 percent and the small traders (not shown in chart) are Bullish with a score of 77.2 percent.

Price Trend-Following Model: Strong Uptrend

Our weekly trend-following model classifies the current market price position as: Strong Uptrend.

NEW ZEALAND DOLLAR StatisticsSPECULATORSCOMMERCIALSSMALL TRADERS
– Percent of Open Interest Longs:19.470.27.0
– Percent of Open Interest Shorts:60.731.64.3
– Net Position:-29,56727,6571,910
– Gross Longs:13,83950,2265,009
– Gross Shorts:43,40622,5693,099
– Long to Short Ratio:0.3 to 12.2 to 11.6 to 1
NET POSITION TREND:
– Strength Index Score (3 Year Range Pct):31.165.277.2
– Strength Index Reading (3 Year Range):BearishBullishBullish
NET POSITION MOVEMENT INDEX:
– 6-Week Change in Strength Index:22.0-24.431.5


Mexican Peso Futures:

Mexican Peso Futures COT ChartThe Mexican Peso large speculator standing this week came in at a net position of 82,880 contracts in the data reported through Tuesday. This was a weekly lowering of -1,242 contracts from the previous week which had a total of 84,122 net contracts.

This week’s current strength score (the trader positioning range over the past three years, measured from 0 to 100) shows the speculators are currently Bullish with a score of 66.8 percent. The commercials are Bearish with a score of 33.8 percent and the small traders (not shown in chart) are Bearish with a score of 46.3 percent.

Price Trend-Following Model: Uptrend

Our weekly trend-following model classifies the current market price position as: Uptrend.

MEXICAN PESO StatisticsSPECULATORSCOMMERCIALSSMALL TRADERS
– Percent of Open Interest Longs:55.937.73.1
– Percent of Open Interest Shorts:19.176.31.3
– Net Position:82,880-87,1274,247
– Gross Longs:126,00985,0187,071
– Gross Shorts:43,129172,1452,824
– Long to Short Ratio:2.9 to 10.5 to 12.5 to 1
NET POSITION TREND:
– Strength Index Score (3 Year Range Pct):66.833.846.3
– Strength Index Reading (3 Year Range):BullishBearishBearish
NET POSITION MOVEMENT INDEX:
– 6-Week Change in Strength Index:-12.112.4-2.1


Brazilian Real Futures:

Brazil Real Futures COT ChartThe Brazilian Real large speculator standing this week came in at a net position of 36,674 contracts in the data reported through Tuesday. This was a weekly rise of 2,012 contracts from the previous week which had a total of 31,643 net contracts.

This week’s current strength score (the trader positioning range over the past three years, measured from 0 to 100) shows the speculators are currently Bullish with a score of 66.6 percent. The commercials are Bearish with a score of 31.7 percent and the small traders (not shown in chart) are Bearish with a score of 47.5 percent.

Price Trend-Following Model: Strong Uptrend

Our weekly trend-following model classifies the current market price position as: Strong Uptrend.

BRAZIL REAL StatisticsSPECULATORSCOMMERCIALSSMALL TRADERS
– Percent of Open Interest Longs:53.538.44.3
– Percent of Open Interest Shorts:26.069.40.8
– Net Position:36,674-41,3944,720
– Gross Longs:71,43151,2775,780
– Gross Shorts:34,75792,6711,060
– Long to Short Ratio:2.1 to 10.6 to 15.5 to 1
NET POSITION TREND:
– Strength Index Score (3 Year Range Pct):66.631.747.5
– Strength Index Reading (3 Year Range):BullishBearishBearish
NET POSITION MOVEMENT INDEX:
– 6-Week Change in Strength Index:13.7-14.69.0


Bitcoin Futures:

Bitcoin Crypto Futures COT ChartThe Bitcoin large speculator standing this week came in at a net position of 1,172 contracts in the data reported through Tuesday. This was a weekly reduction of -466 contracts from the previous week which had a total of 1,638 net contracts.

This week’s current strength score (the trader positioning range over the past three years, measured from 0 to 100) shows the speculators are currently Bullish with a score of 77.5 percent. The commercials are Bearish with a score of 31.7 percent and the small traders (not shown in chart) are Bearish with a score of 34.6 percent.

Price Trend-Following Model: Strong Downtrend

Our weekly trend-following model classifies the current market price position as: Strong Downtrend.

BITCOIN StatisticsSPECULATORSCOMMERCIALSSMALL TRADERS
– Percent of Open Interest Longs:71.62.15.1
– Percent of Open Interest Shorts:66.57.05.3
– Net Position:1,172-1,120-52
– Gross Longs:16,4104851,162
– Gross Shorts:15,2381,6051,214
– Long to Short Ratio:1.1 to 10.3 to 11.0 to 1
NET POSITION TREND:
– Strength Index Score (3 Year Range Pct):77.531.734.6
– Strength Index Reading (3 Year Range):BullishBearishBearish
NET POSITION MOVEMENT INDEX:
– 6-Week Change in Strength Index:23.4-22.0-6.1


Article By InvestMacroReceive our weekly COT Newsletter

*COT Report: The COT data, released weekly to the public each Friday, is updated through the most recent Tuesday (data is 3 days old) and shows a quick view of how large speculators or non-commercials (for-profit traders) were positioned in the futures markets.

The CFTC categorizes trader positions according to commercial hedgers (traders who use futures contracts for hedging as part of the business), non-commercials (large traders who speculate to realize trading profits) and nonreportable traders (usually small traders/speculators) as well as their open interest (contracts open in the market at time of reporting). See CFTC criteria here.

USD/JPY Declines, but the Overall Outlook for the Yen Remains Hazy

By Analytical Department RoboForex

USD/JPY is trading lower at 155.79 on Friday. Meanwhile, the yen remains under pressure at the end of the week. It is on track to record a second consecutive weekly decline amid ongoing uncertainty surrounding Bank of Japan (BoJ) policy.

This week, the Japanese government nominated two academics known for favouring loose monetary policy to the BoJ board. Prime Minister Sanae Takaichi, following a meeting with BoJ Governor Kazuo Ueda, expressed concerns about the possibility of further interest rate hikes.

In contrast, board member Hajime Takata, who holds a more hawkish stance, has called for additional policy tightening. He also indicated that the bank’s price stability target is nearly achieved.

Governor Ueda himself noted that the BoJ will carefully assess incoming economic data at its March and April meetings, leaving the door open to a potential short-term rate hike.

Economic statistics are also influencing market expectations. Inflation in Tokyo has slowed to its lowest level in over a year, partly due to government subsidies for utilities. This has reinforced expectations that the central bank may refrain from tightening policy in the near term.

Technical Analysis

On the H4 chart, USD/JPY is forming a consolidation range around the 156.15 level. A decline towards 155.50 is expected today, after which a corrective move back towards 156.15 may follow. A breakout above this range could open the way to further gains towards 157.50. Conversely, a break below the range would signal a continuation of the downward move, initially towards 154.18, with scope to extend towards 151.82. Technically, this bearish scenario is supported by the MACD indicator, whose signal line remains above zero but is pointing firmly lower.

On the H1 chart, the pair has broken below the 156.15 level and is forming a downward wave towards 155.40. A subsequent correction back to 156.15 cannot be ruled out. This short-term bearish bias is confirmed by the Stochastic oscillator, with its signal line below 50 and pointing lower.

Conclusion

USD/JPY is declining amid persistent uncertainty regarding the Bank of Japan’s next policy move. Market expectations are being pulled between hawkish signals from some board members and more cautious communication from the leadership, reinforced by softer Tokyo inflation data. Technical analysis suggests scope for further short-term downside, although a corrective bounce remains possible.


Disclaimer

Any forecasts contained herein are based on the author’s particular opinion. This analysis may not be treated as trading advice. RoboForex bears no responsibility for trading results based on trading recommendations and reviews contained herein.