Archive for Forex and Currency News – Page 8

EUR/USD: Middle East Conflict Still Determines Sentiment

By Analytical Department RoboForex

EUR/USD edged higher on Monday after earlier declines, reaching 1.1516. The US dollar continues to draw support from safe-haven demand amid the ongoing Middle East conflict, which has now entered its fifth week with no signs of resolution.

Tensions escalated following Donald Trump’s remarks regarding the possible confiscation of Iranian oil and control of the export hub on Kharg Island. At the same time, the US is increasing its military presence in the region and preparing for potentially prolonged operations. Iran-aligned forces, including the Houthis in Yemen, have also joined the conflict.

Rising oil prices in this environment are amplifying inflation risks and reinforcing expectations of tighter Federal Reserve policy. The market is increasingly pricing in the possibility of a rate hike this year, marking a notable shift from earlier expectations of rate cuts.

Investor focus now turns to US macroeconomic data. This week will see the release of labour market indicators, including JOLTS and ADP figures, as well as the key March employment report due on Friday.

Technical Analysis

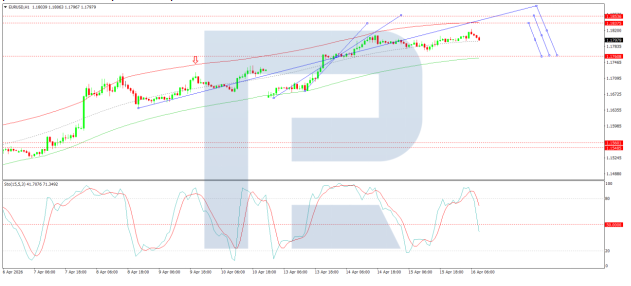
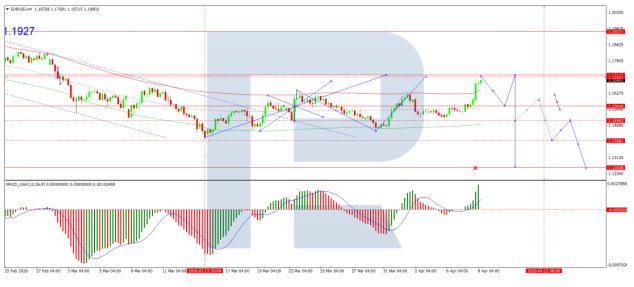
On the H4 chart, EUR/USD is forming a consolidation range around 1.1528. A downside breakout is expected, with a continuation wave to 1.1404 as a near-term target, followed by a subsequent rebound to 1.1528. Technically, this scenario is confirmed by the MACD indicator – its signal line is below zero and pointing firmly downwards, reflecting sustained bearish momentum and the potential for the downtrend to persist.

On the H1 chart, the market is forming the structure of the next downward wave towards 1.1440. After reaching this level, a rebound to 1.1535 is expected, potentially extending the move to 1.1647. Technically, this scenario is confirmed by the Stochastic oscillator – its signal line is below 50 and pointing firmly downwards towards 20.

Conclusion

EUR/USD remains firmly driven by geopolitical forces, with the Middle East conflict entering its fifth week and showing no signs of de-escalation. The US dollar’s safe-haven appeal continues to dominate, while escalating tensions and rising oil prices have shifted market expectations from rate cuts to the possibility of a Fed hike later this year. Technical indicators point to further near-term downside, although this week’s US labour market data could introduce volatility. Until there is a tangible shift in the geopolitical landscape, the euro is likely to remain under pressure.


Disclaimer

Any forecasts contained herein are based on the author’s particular opinion. This analysis may not be treated as trading advice. RoboForex bears no responsibility for trading results based on trading recommendations and reviews contained herein.

Euro Large Speculator Bets dropped to 55-Week Low

By InvestMacro

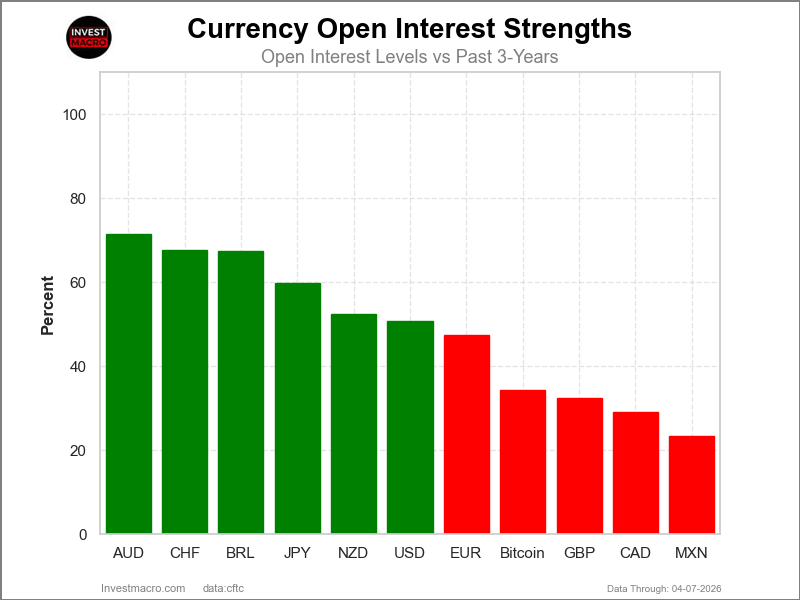
Speculators OI FX Futures COT Chart

Here are the latest charts and statistics for the Commitment of Traders (COT) data published by the Commodities Futures Trading Commission (CFTC).

The latest COT data is updated through Tuesday March 24th and shows a quick view of how large market participants (for-profit speculators and commercial traders) were positioned in the futures markets. All currency positions are in direct relation to the US dollar where, for example, a bet for the euro is a bet that the euro will rise versus the dollar while a bet against the euro will be a bet that the euro will decline versus the dollar.

Weekly Speculator Changes led by British Pound & Mexican Peso

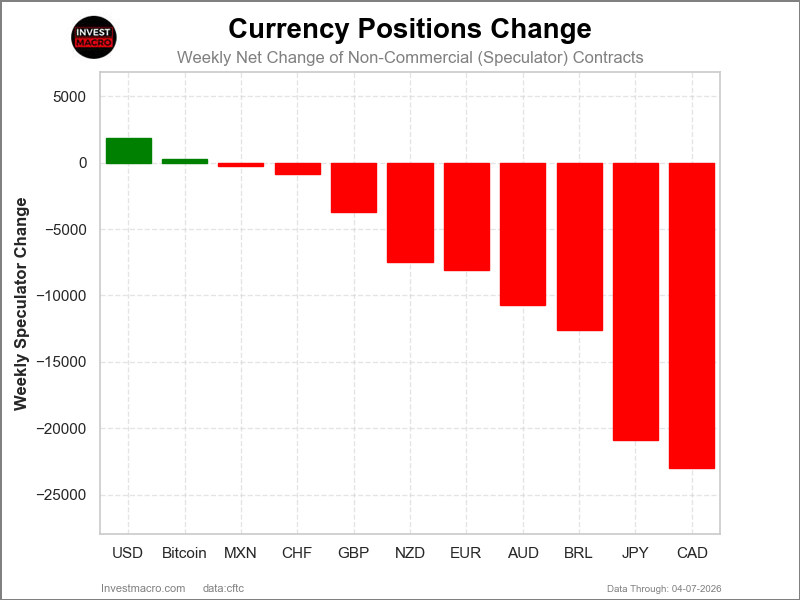
Speculators Nets FX Futures COT Chart
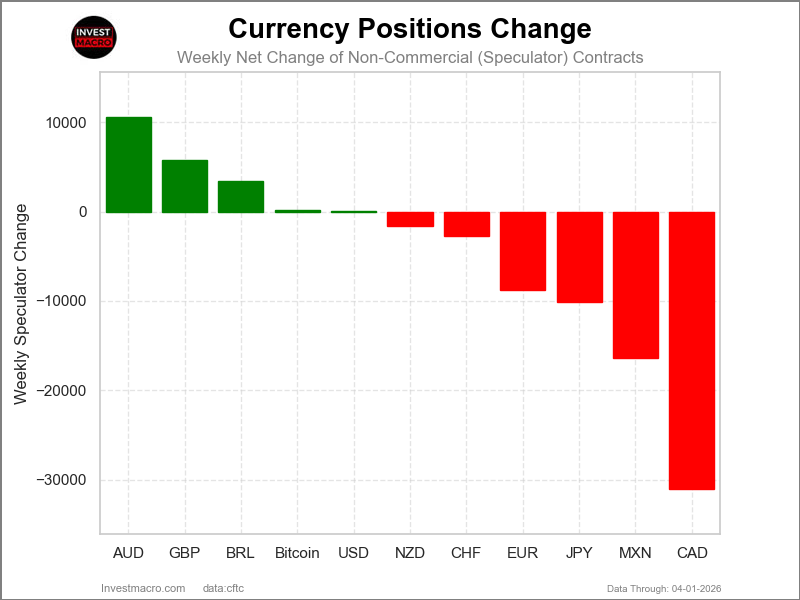
The COT currency market speculator bets were slightly lower this week as five out of the eleven currency markets we cover had higher positioning while the other six markets had lower speculator contracts.

Leading the gains for the currency markets was the British Pound (7,093 contracts) with the Mexican Peso (5,616 contracts), the Japanese Yen (4,974 contracts), the Australian Dollar (1,811 contracts) and Bitcoin (333 contracts) also showing positive weeks.

The currencies seeing declines in speculator bets on the week were the EuroFX (-11,853 contracts), the Canadian Dollar (-2,488 contracts), the New Zealand Dollar (-3,949 contracts), the Swiss Franc (-1,884 contracts), the US Dollar Index (-76 contracts) and with the Brazilian Real (-69 contracts) also registering lower bets on the week.

Euro Speculator Bets dropped to 55-Week Low

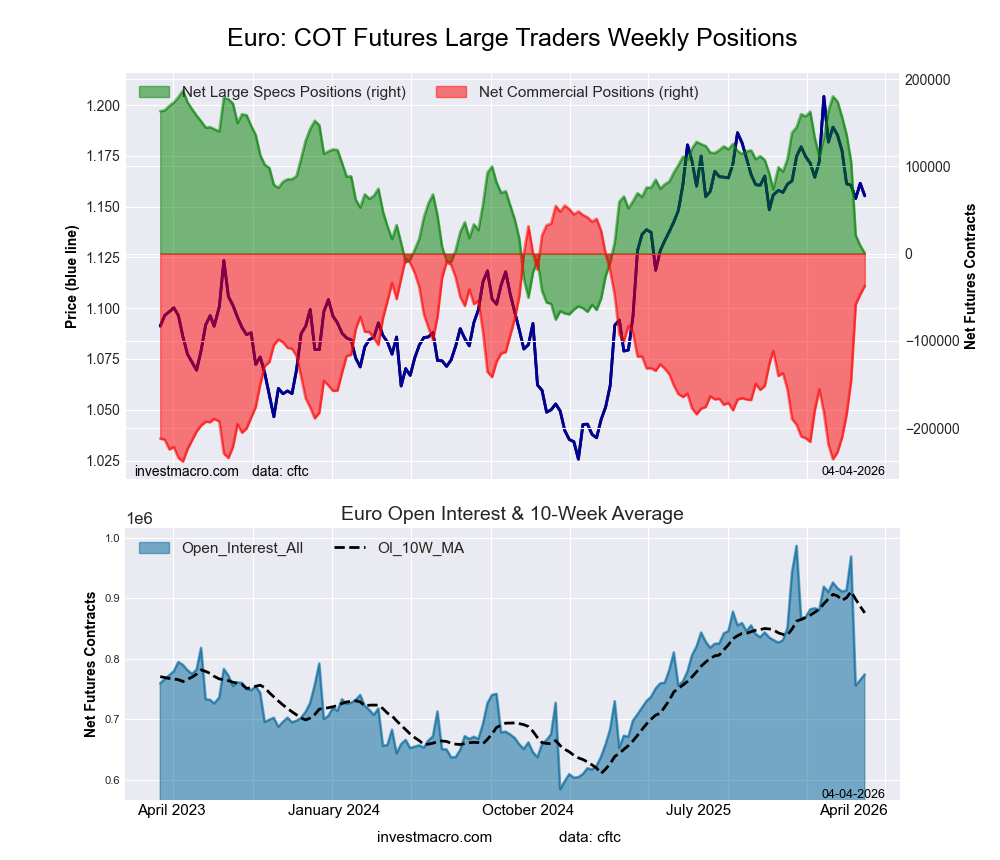
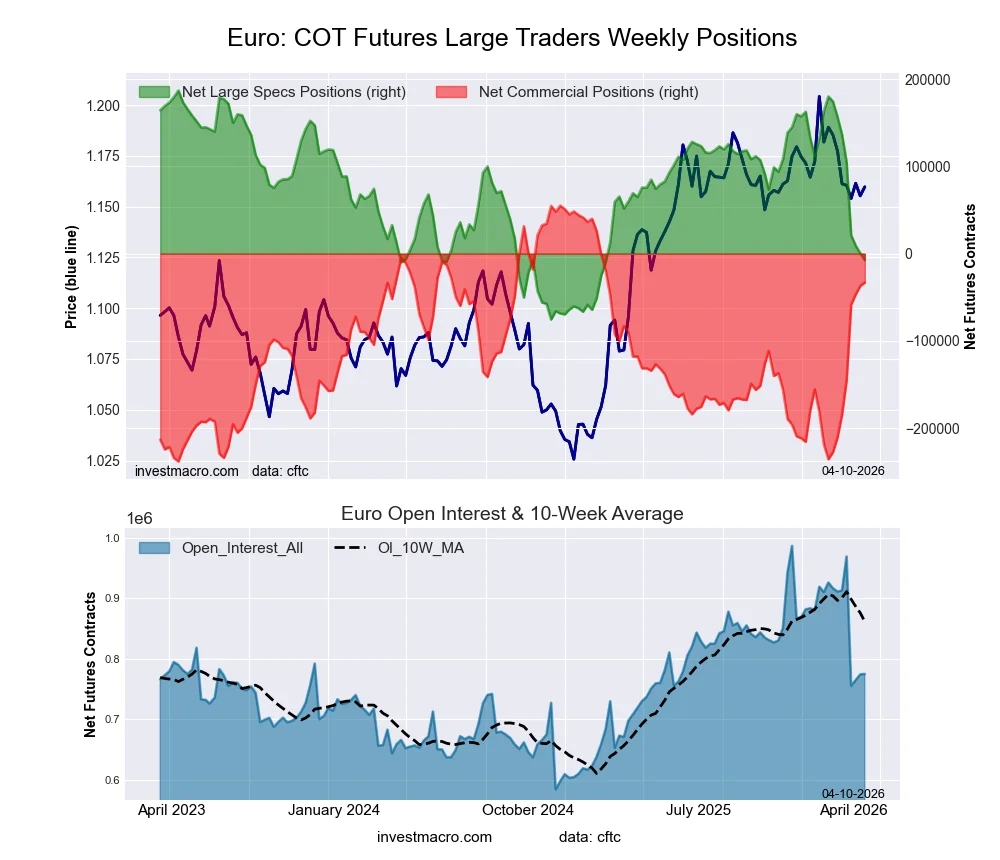
Highlighting the Currencies speculator positions this week was the continued drop in the Euro speculator bullish position. It has been quite a turnaround for the Euro speculator positions in recent weeks as speculators pushed the Euro net positions to an all-time top ten high bullish position on February 10th at a total of 180,305 net contracts. Since that recent high, Euro positions have fallen for six consecutive weeks and by -171,026 net contracts over that time period. This has brought the overall speculator position down from 180,305 bullish positions to this week’s net contract level of just 9,279 contracts. Overall, the Euro position has continuously been in a bullish standing since March 11th of 2025. The Euro price has now fallen below the 1.1600 exchange rate in the Currency markets and has now declined in six out of the last nine weeks and currently trades at the 1.1556 area. The Euro traded as high as 1.2110 late in January before the Iran war broke out and has now come back towards the 1.1500 major support level.

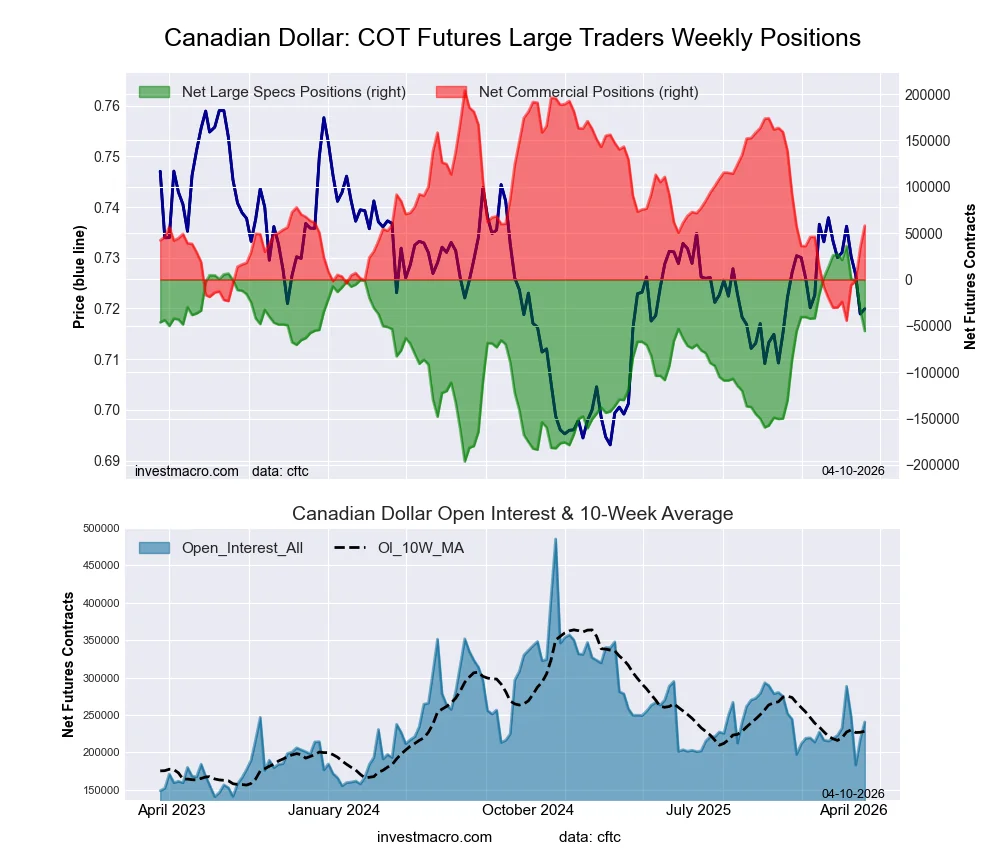
The Canadian Dollar speculative position this week fell by approximately -2,500 contracts and has now fallen three out of the past four weeks. This negative sentiment has brought the Canadian Dollar speculator position back into a small bearish position of -1,602 net positions this week. The Canadian Dollar contracts had been in a strong bearish position for the past few years before seeing a turnaround and rising into bullish bets in early February. That had pushed the bullish position up to as high as +36,159 contracts on March 10th. However, since then, the speculative position has fallen off and culminated in a bearish level this week. The Canadian Dollar in the Currency markets has been on the decline as well and has fallen for three consecutive weeks against the US Dollar. The Canadian Dollar recently bounced to lower levels off the 200-week moving average (CAD traded as high as 0.7431 in late January) and has now trended lower to this week’s close at 0.7225.

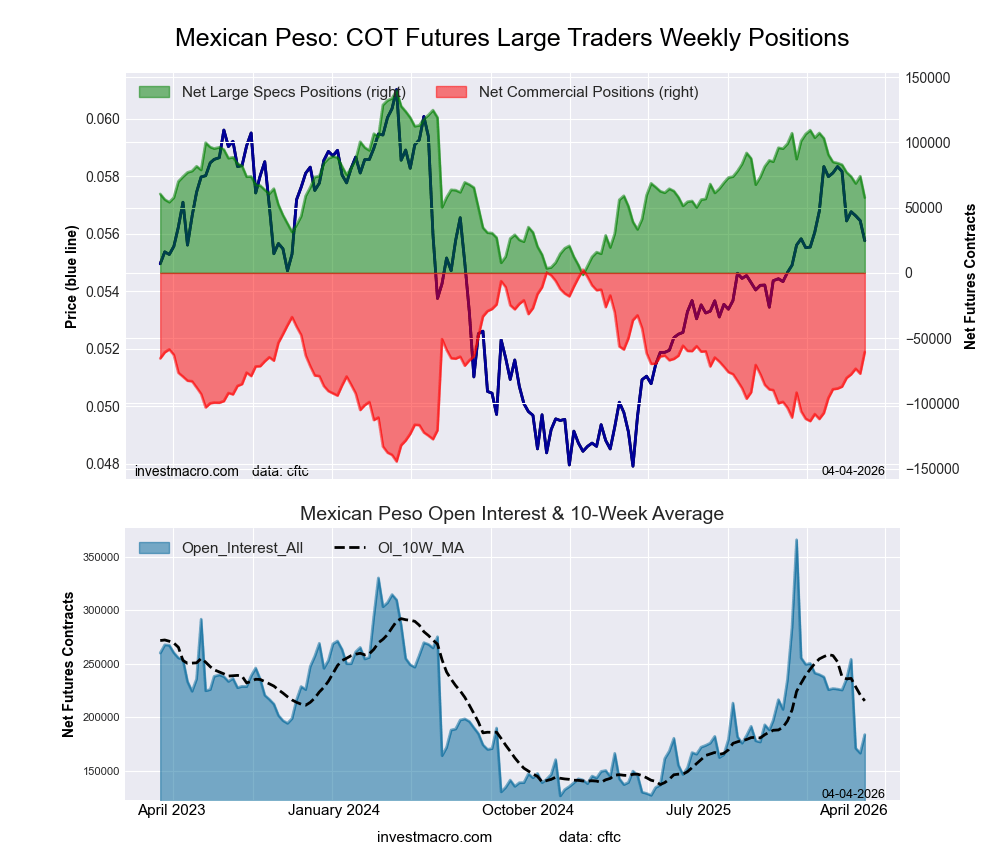
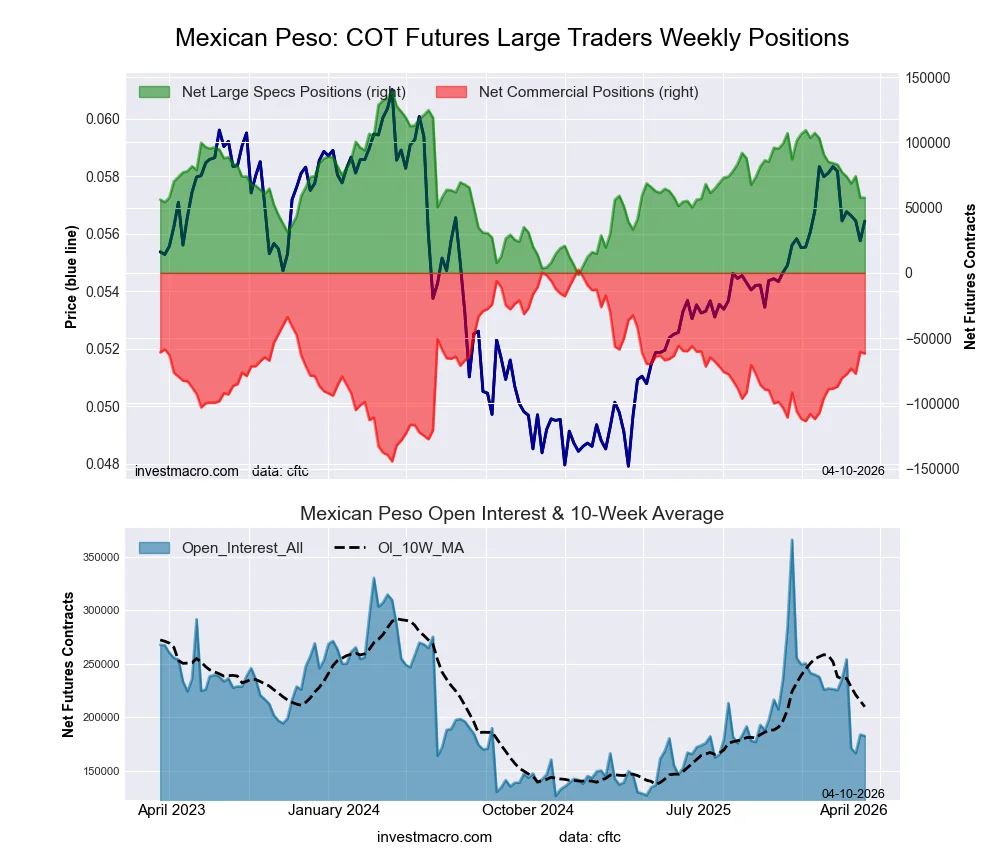
The Mexican Peso position rebounded this week with a gain of over 5,500 net contracts. This breaks an eight-week losing streak that had seen the overall net position fall from 103,114 net contracts on January 27th to a total of 68,460 net contracts on March 17th. This week’s gain brings the overall net position back above +70,000 contracts to +74,076 net contracts. Overall, the Mexican Peso has pretty much seen strong bullish speculator positions dating back to March of 2023 through the current period (save for a small bullish positioning streak in late 2024). The Mexican Peso in the Currency markets this week, although, has continued on a decline for five consecutive weeks against the US Dollar. However, overall, the Mexican Peso has been higher against the US Dollar since the beginning of 2025 by approximately 15%.

The US Dollar Index contracts were virtually unchanged this week with a small decline of just 76 contracts. Overall, the US Dollar net positioning has now been in a consecutive bullish position for two weeks straight after seeing a large +9,575 net contract change on March 17th. The US Dollar Index in the Currency markets has now been higher in four out of the past six weeks and trades right around the major 100.00 level, which may determine the currency’s direction in the near and medium term. The US Dollar Index has now rallied by approximately 5% since hitting a low near 95.36 in January.

Brazilian Real and US Dollar Index lead weekly Currency Market Price Performance

The Currency Market Price Performance this week was heavily skewed towards the downside as only two currencies had positive returns over the past five days, while nine currencies had lower prices on the week. The Brazilian Real led the way with a 0.95% increase on the week and was followed by the US Dollar Index, which improved by 0.58%.

On the downside, the biggest loser on the week was Bitcoin, which fell by -5.78%, with the next largest decliner on the week being the Australian Dollar, which fell by -2.14%. The Peso, the Mexican Peso, declined by -1.57%, followed by the New Zealand Dollar, which fell by -1.45%. The Swiss Franc was lower by -1.3%. The Canadian Dollar dipped by -1.22%, while the Japanese Yen decreased by -0.66%. The British Pound Sterling was lower by -0.59%, and the Euro rounds out the decliners on the week with a -0.53% dip.

Over the past 30 days, all of the Currency markets were lower except for the US Dollar Index, which is up by 3.80% over that time period.


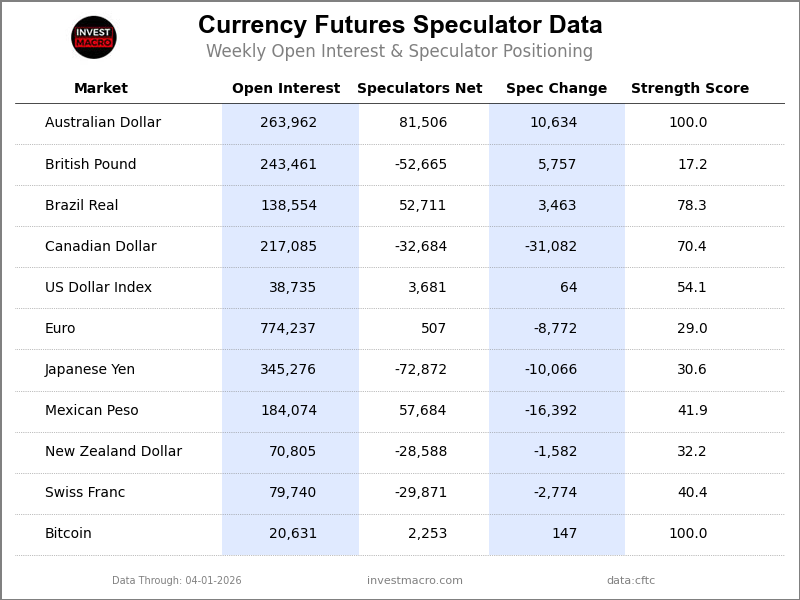
Currencies Data:

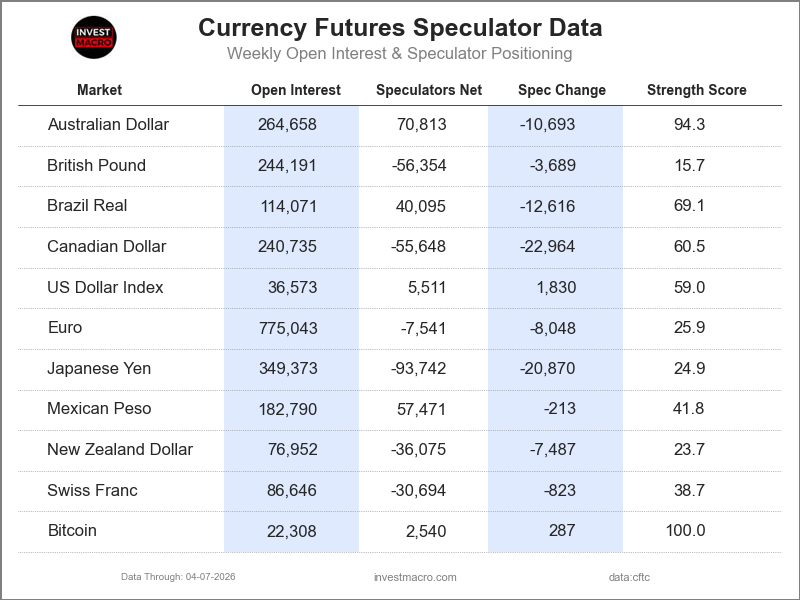
Speculators FX Futures COT Data Table
Legend: Open Interest | Speculators Current Net Position | Weekly Specs Change | Specs Strength Score compared to last 3-Years (0-100 range)


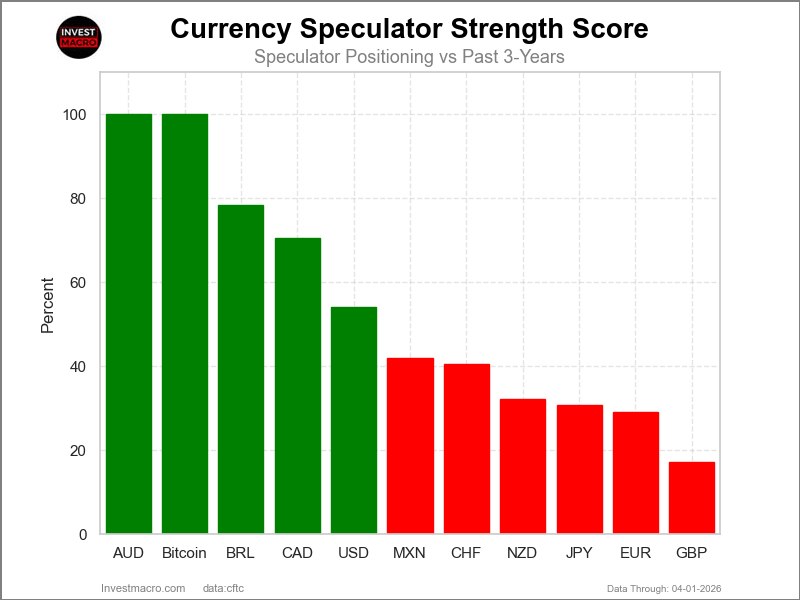
Strength Scores led by Australian Dollar & Bitcoin
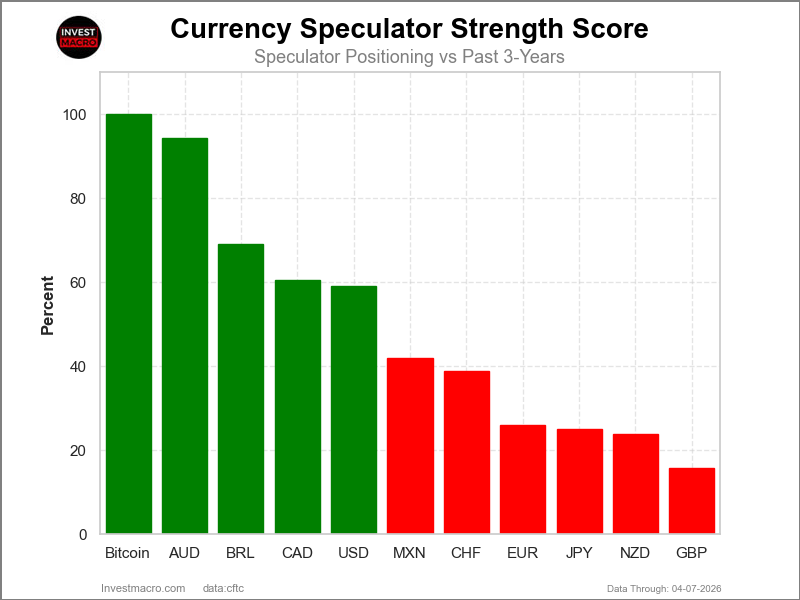
Speculators Strength Scores FX Futures COT Chart
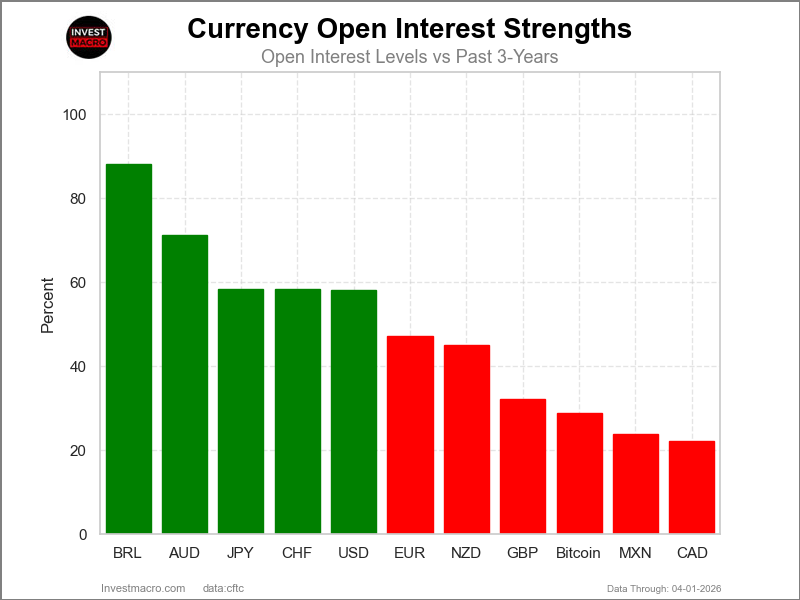
COT Strength Scores (a normalized measure of Speculator positions over a 3-Year range, from 0 to 100 where above 80 is Extreme-Bullish and below 20 is Extreme-Bearish) showed that the Australian Dollar (100 percent) and the Bitcoin (97 percent) lead the currency markets this week. The Canadian Dollar (84 percent), Brazilian Real (76 percent) and the US Dollar Index (54 percent) come in as the next highest in the weekly strength scores.

On the downside, the British Pound (15 percent) comes in at the lowest strength levels currently and are in Extreme-Bearish territory (below 20 percent). The next lowest strength scores are the EuroFX (32 percent), the Japanese Yen (33 percent) and the New Zealand Dollar (34 percent).

3-Year Strength Statistics:
US Dollar Index (53.9 percent) vs US Dollar Index previous week (54.1 percent)
EuroFX (32.3 percent) vs EuroFX previous week (36.8 percent)
British Pound Sterling (14.8 percent) vs British Pound Sterling previous week (11.8 percent)
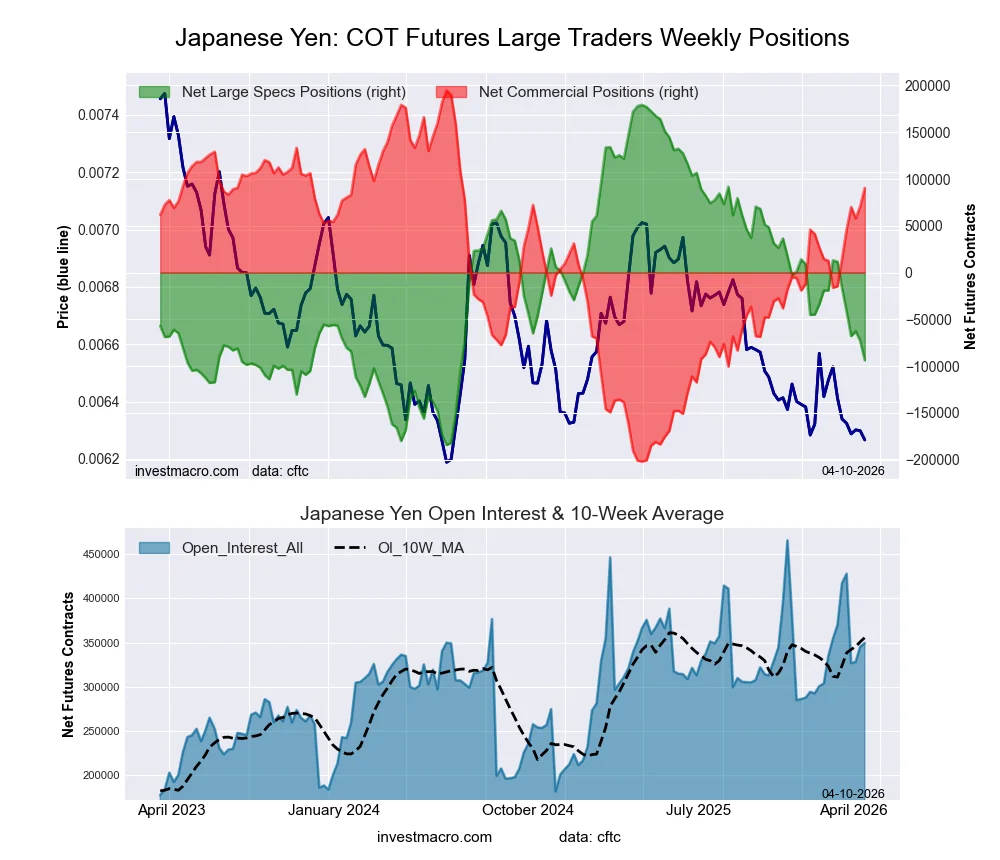
Japanese Yen (33.4 percent) vs Japanese Yen previous week (32.0 percent)
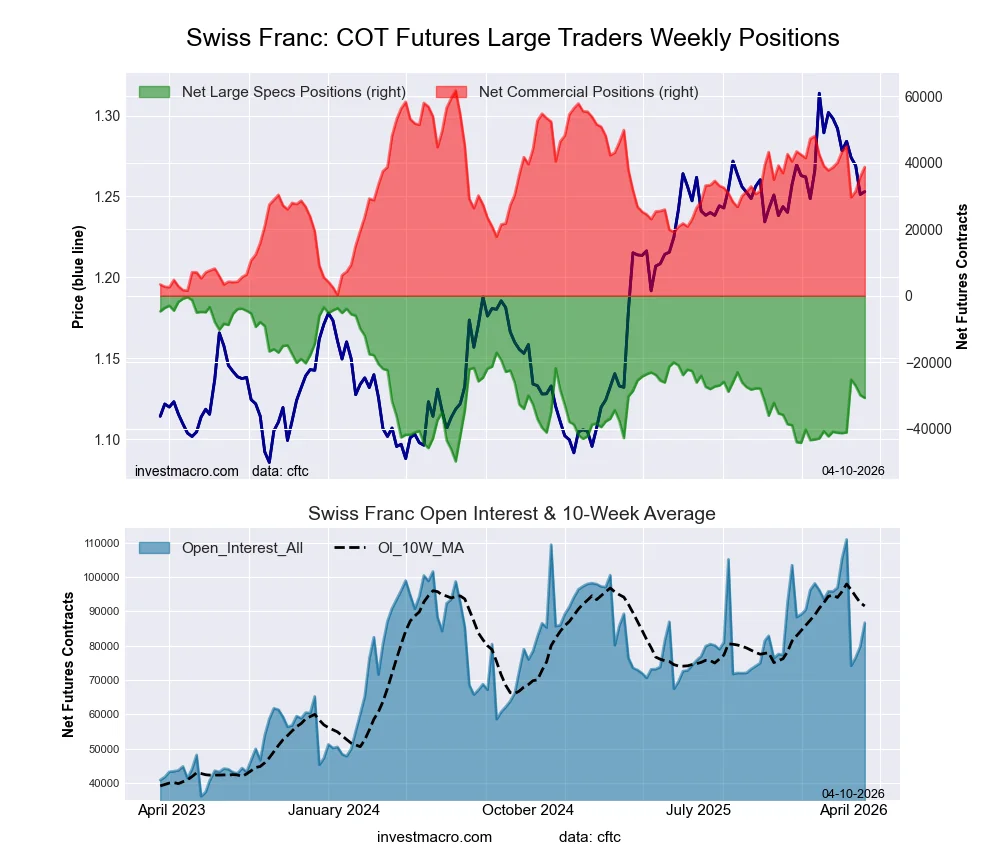
Swiss Franc (46.0 percent) vs Swiss Franc previous week (49.8 percent)
Canadian Dollar (83.8 percent) vs Canadian Dollar previous week (84.8 percent)
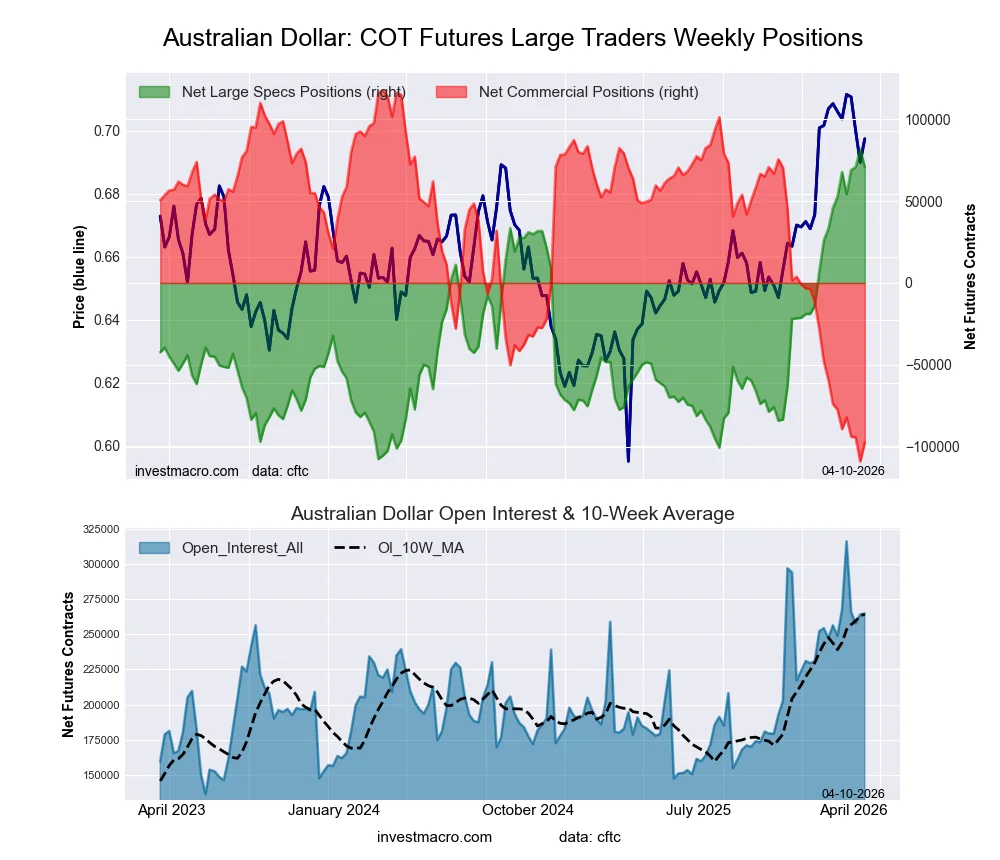
Australian Dollar (100.0 percent) vs Australian Dollar previous week (99.0 percent)
New Zealand Dollar (34.0 percent) vs New Zealand Dollar previous week (38.5 percent)
Mexican Peso (53.5 percent) vs Mexican Peso previous week (49.6 percent)
Brazilian Real (75.8 percent) vs Brazilian Real previous week (75.8 percent)
Bitcoin (97.3 percent) vs Bitcoin previous week (90.3 percent)


Swiss Franc & Bitcoin top the 6-Week Strength Trends

Speculators Trends FX Futures COT Chart
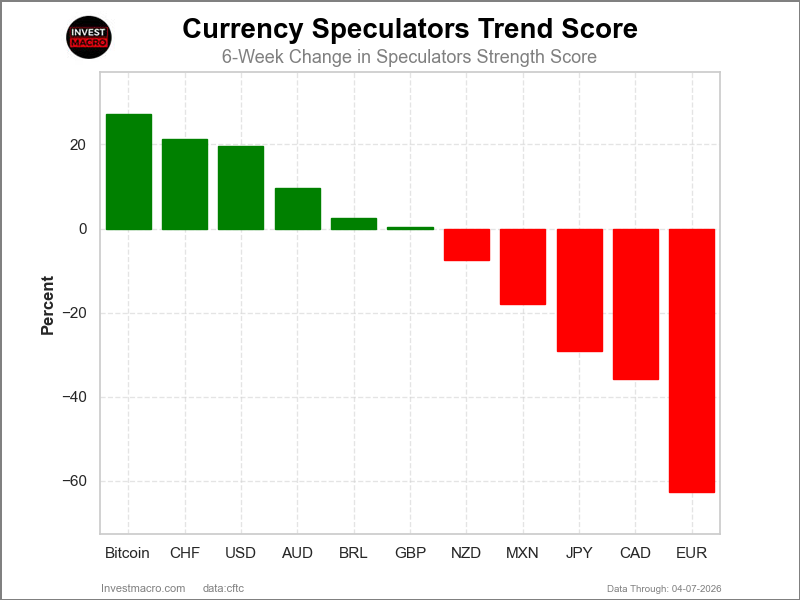
COT Strength Score Trends (or move index, calculates the 6-week changes in strength scores) showed that the Swiss Franc (31 percent) and Bitcoin (23 percent) lead the past six weeks trends for the currencies. The Australian Dollar (21 percent), the Brazilian Real (13 percent) and the US Dollar Index (12 percent) are the next highest positive movers in the 3-Year trends data.

The EuroFX (-65 percent) leads the downside trend scores currently with the British Pound (-14 percent), Japanese Yen (-12 percent) and the Mexican Peso (-8 percent) following next with lower trend scores.

3-Year Strength Trends:
US Dollar Index (11.7 percent) vs US Dollar Index previous week (12.3 percent)
EuroFX (-65.1 percent) vs EuroFX previous week (-54.1 percent)
British Pound Sterling (-13.9 percent) vs British Pound Sterling previous week (-21.9 percent)
Japanese Yen (-12.0 percent) vs Japanese Yen previous week (-13.4 percent)
Swiss Franc (30.7 percent) vs Swiss Franc previous week (31.4 percent)
Canadian Dollar (-6.4 percent) vs Canadian Dollar previous week (-0.5 percent)
Australian Dollar (21.1 percent) vs Australian Dollar previous week (24.1 percent)
New Zealand Dollar (9.0 percent) vs New Zealand Dollar previous week (12.8 percent)
Mexican Peso (-7.7 percent) vs Mexican Peso previous week (-15.7 percent)
Brazilian Real (12.8 percent) vs Brazilian Real previous week (13.4 percent)
Bitcoin (23.1 percent) vs Bitcoin previous week (16.2 percent)


Individual COT Forex Markets:

US Dollar Index Futures:

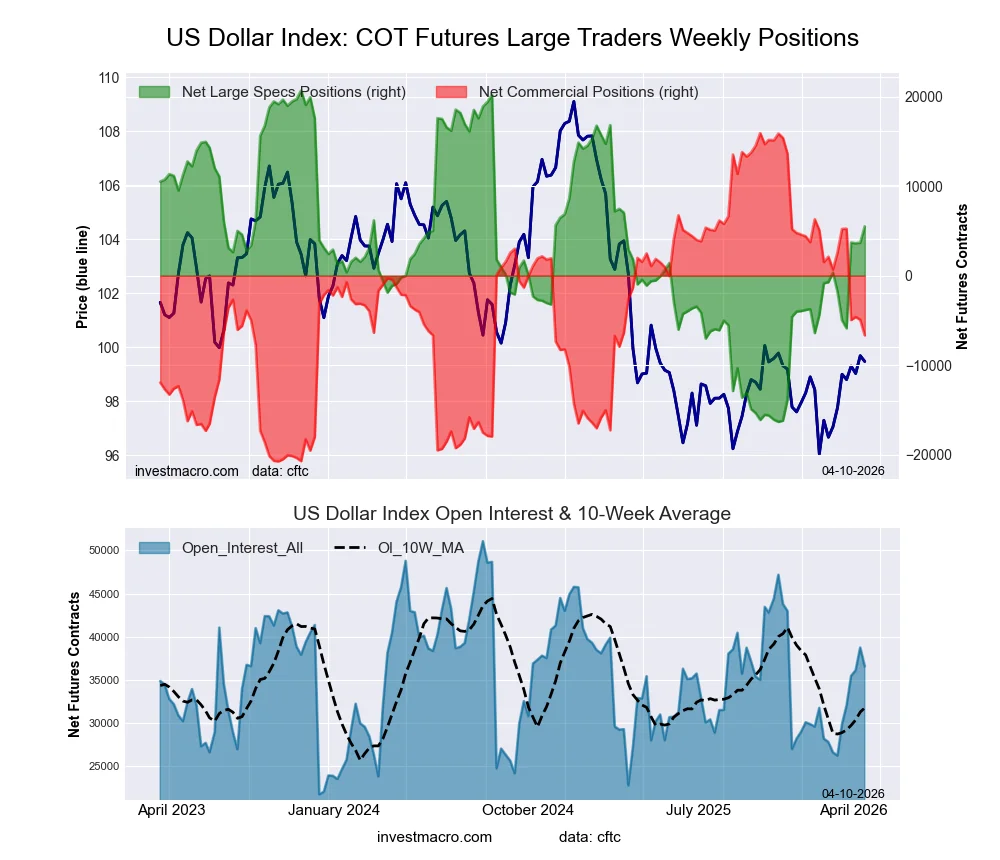
US Dollar Index Forex Futures COT ChartThe US Dollar Index large speculator standing this week came in at a net position of 3,617 contracts in the data reported through Tuesday. This was a weekly reduction of -76 contracts from the previous week which had a total of 3,693 net contracts.

This week’s current strength score (the trader positioning range over the past three years, measured from 0 to 100) shows the speculators are currently Bullish with a score of 53.9 percent. The commercials are Bearish with a score of 44.0 percent and the small traders (not shown in chart) are Bullish with a score of 56.4 percent.

Price Trend-Following Model: Weak Downtrend

Our weekly trend-following model classifies the current market price position as: Weak Downtrend.

US DOLLAR INDEX StatisticsSPECULATORSCOMMERCIALSSMALL TRADERS
– Percent of Open Interest Longs:56.629.58.0
– Percent of Open Interest Shorts:46.642.35.3
– Net Position:3,617-4,615998
– Gross Longs:20,45710,6522,903
– Gross Shorts:16,84015,2671,905
– Long to Short Ratio:1.2 to 10.7 to 11.5 to 1
NET POSITION TREND:
– Strength Index Score (3 Year Range Pct):53.944.056.4
– Strength Index Reading (3 Year Range):BullishBearishBullish
NET POSITION MOVEMENT INDEX:
– 6-Week Change in Strength Index:11.7-18.341.7


Euro Currency Futures:

Euro Currency Futures COT ChartThe Euro Currency large speculator standing this week came in at a net position of 9,279 contracts in the data reported through Tuesday. This was a weekly lowering of -11,853 contracts from the previous week which had a total of 21,132 net contracts.

This week’s current strength score (the trader positioning range over the past three years, measured from 0 to 100) shows the speculators are currently Bearish with a score of 32.3 percent. The commercials are Bullish with a score of 65.3 percent and the small traders (not shown in chart) are Bullish with a score of 53.6 percent.

Price Trend-Following Model: Weak Uptrend

Our weekly trend-following model classifies the current market price position as: Weak Uptrend.

EURO Currency StatisticsSPECULATORSCOMMERCIALSSMALL TRADERS
– Percent of Open Interest Longs:26.258.111.1
– Percent of Open Interest Shorts:24.964.26.2
– Net Position:9,279-46,75837,479
– Gross Longs:200,025444,11884,972
– Gross Shorts:190,746490,87647,493
– Long to Short Ratio:1.0 to 10.9 to 11.8 to 1
NET POSITION TREND:
– Strength Index Score (3 Year Range Pct):32.365.353.6
– Strength Index Reading (3 Year Range):BearishBullishBullish
NET POSITION MOVEMENT INDEX:
– 6-Week Change in Strength Index:-65.164.4-38.0


British Pound Sterling Futures:

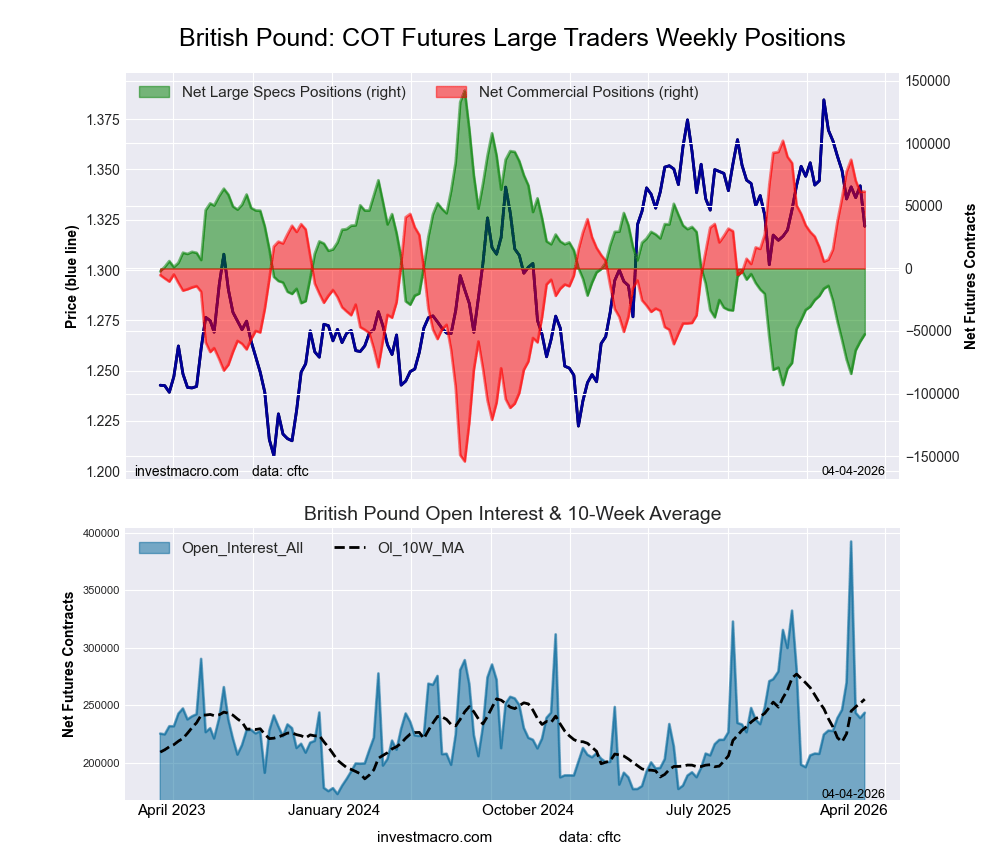
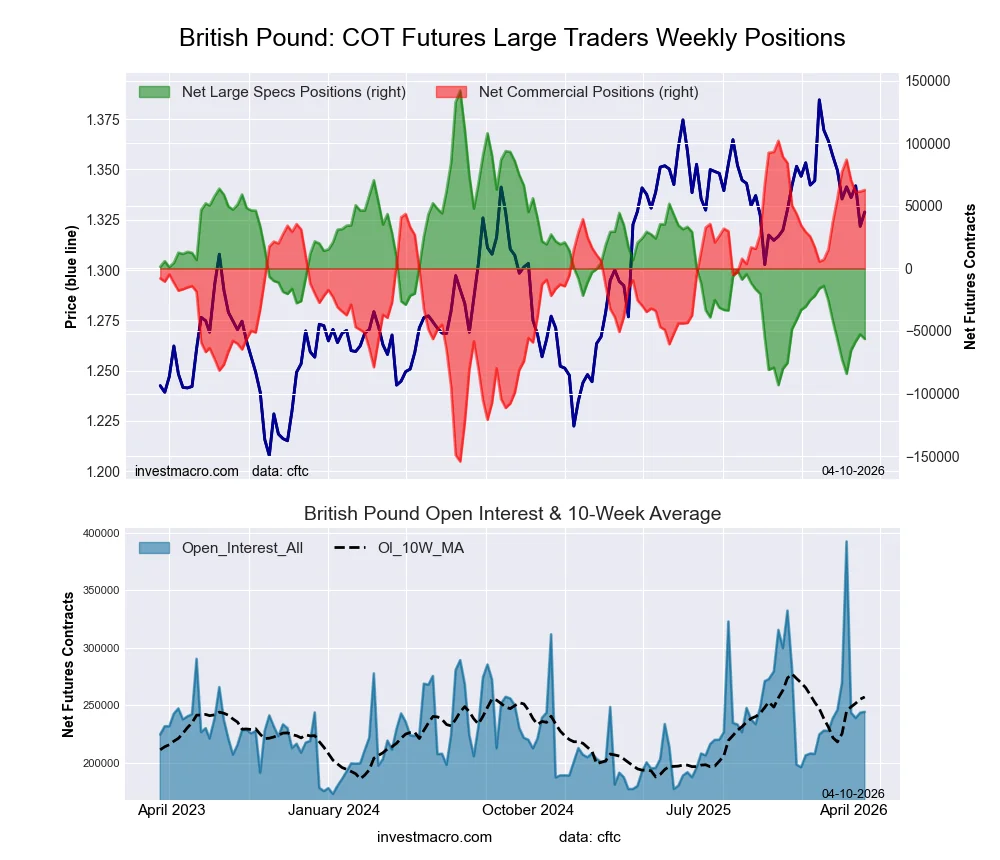
British Pound Sterling Futures COT ChartThe British Pound Sterling large speculator standing this week came in at a net position of -58,422 contracts in the data reported through Tuesday. This was a weekly boost of 7,093 contracts from the previous week which had a total of -65,515 net contracts.

This week’s current strength score (the trader positioning range over the past three years, measured from 0 to 100) shows the speculators are currently Bearish-Extreme with a score of 14.8 percent. The commercials are Bullish-Extreme with a score of 84.1 percent and the small traders (not shown in chart) are Bearish with a score of 46.1 percent.

Price Trend-Following Model: Weak Uptrend

Our weekly trend-following model classifies the current market price position as: Weak Uptrend.

BRITISH POUND StatisticsSPECULATORSCOMMERCIALSSMALL TRADERS
– Percent of Open Interest Longs:19.567.910.8
– Percent of Open Interest Shorts:43.942.311.9
– Net Position:-58,42261,187-2,765
– Gross Longs:46,459162,12825,772
– Gross Shorts:104,881100,94128,537
– Long to Short Ratio:0.4 to 11.6 to 10.9 to 1
NET POSITION TREND:
– Strength Index Score (3 Year Range Pct):14.884.146.1
– Strength Index Reading (3 Year Range):Bearish-ExtremeBullish-ExtremeBearish
NET POSITION MOVEMENT INDEX:
– 6-Week Change in Strength Index:-13.918.0-35.0


Japanese Yen Futures:

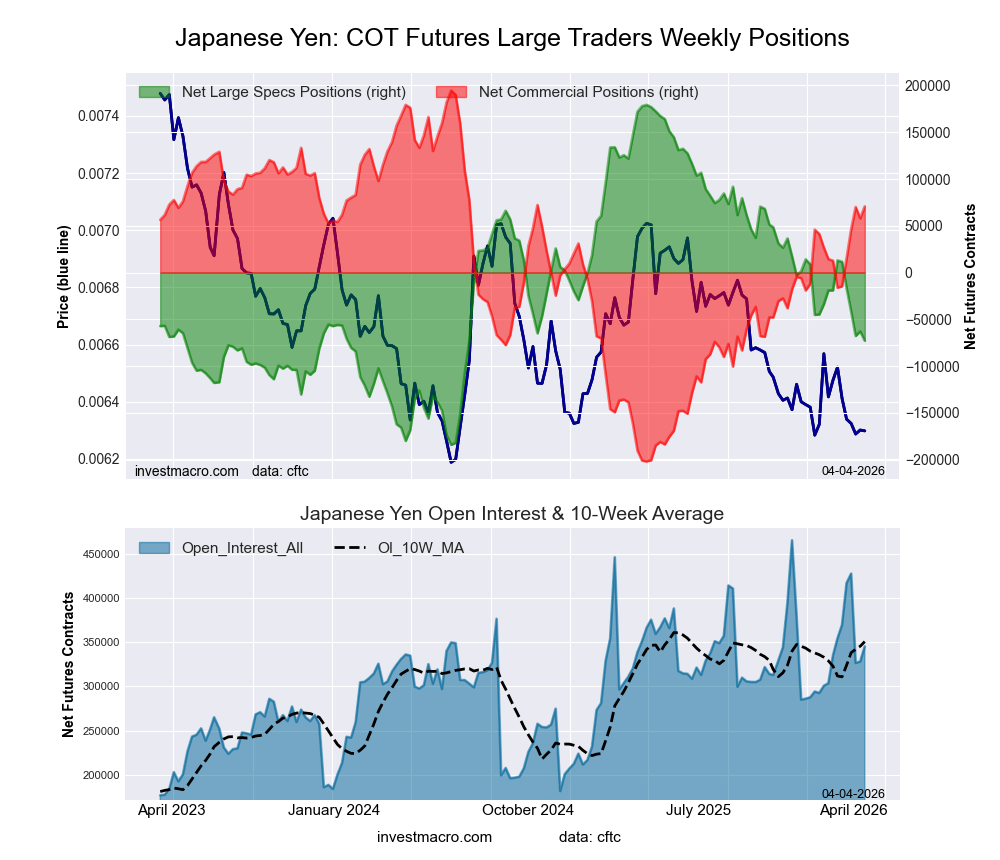
Japanese Yen Forex Futures COT ChartThe Japanese Yen large speculator standing this week came in at a net position of -62,806 contracts in the data reported through Tuesday. This was a weekly lift of 4,974 contracts from the previous week which had a total of -67,780 net contracts.

This week’s current strength score (the trader positioning range over the past three years, measured from 0 to 100) shows the speculators are currently Bearish with a score of 33.4 percent. The commercials are Bullish with a score of 65.5 percent and the small traders (not shown in chart) are Bearish with a score of 49.4 percent.

Price Trend-Following Model: Strong Downtrend

Our weekly trend-following model classifies the current market price position as: Strong Downtrend.

JAPANESE YEN StatisticsSPECULATORSCOMMERCIALSSMALL TRADERS
– Percent of Open Interest Longs:29.951.012.6
– Percent of Open Interest Shorts:49.133.411.1
– Net Position:-62,80657,9014,905
– Gross Longs:98,271167,44341,460
– Gross Shorts:161,077109,54236,555
– Long to Short Ratio:0.6 to 11.5 to 11.1 to 1
NET POSITION TREND:
– Strength Index Score (3 Year Range Pct):33.465.549.4
– Strength Index Reading (3 Year Range):BearishBullishBearish
NET POSITION MOVEMENT INDEX:
– 6-Week Change in Strength Index:-12.011.4-3.9


Swiss Franc Futures:

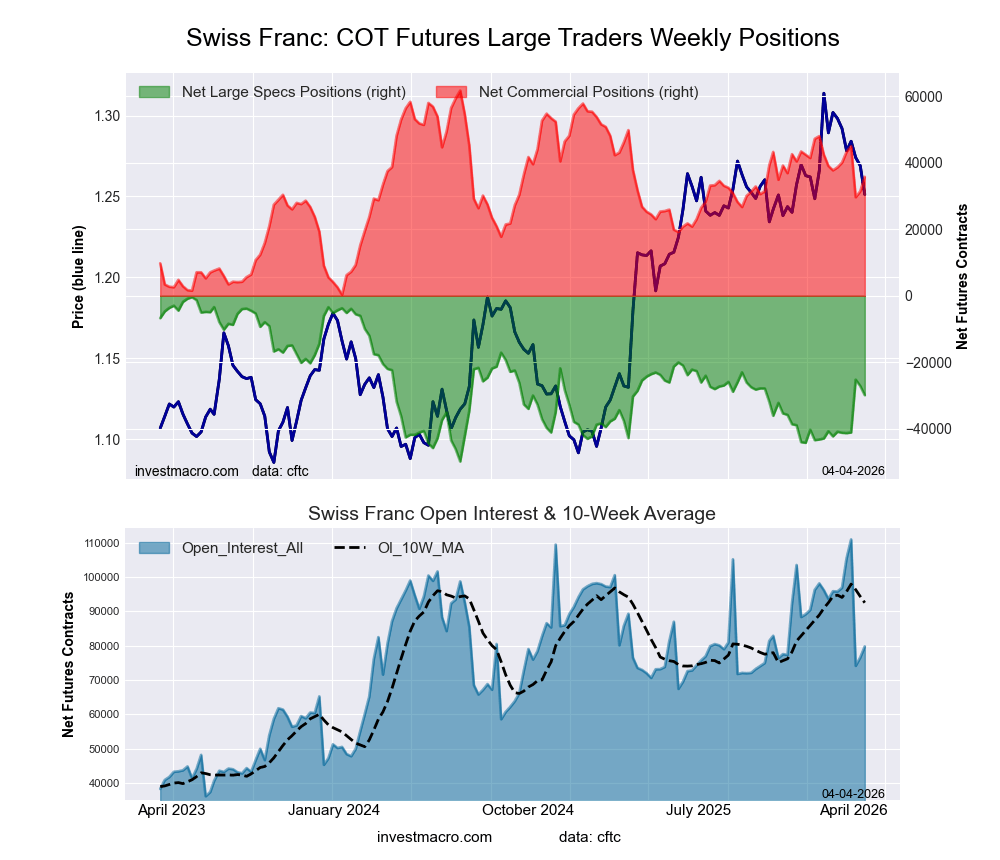
Swiss Franc Forex Futures COT ChartThe Swiss Franc large speculator standing this week came in at a net position of -27,097 contracts in the data reported through Tuesday. This was a weekly decline of -1,884 contracts from the previous week which had a total of -25,213 net contracts.

This week’s current strength score (the trader positioning range over the past three years, measured from 0 to 100) shows the speculators are currently Bearish with a score of 46.0 percent. The commercials are Bullish with a score of 50.6 percent and the small traders (not shown in chart) are Bullish with a score of 60.7 percent.

Price Trend-Following Model: Weak Uptrend

Our weekly trend-following model classifies the current market price position as: Weak Uptrend.

SWISS FRANC StatisticsSPECULATORSCOMMERCIALSSMALL TRADERS
– Percent of Open Interest Longs:10.272.616.5
– Percent of Open Interest Shorts:45.631.622.1
– Net Position:-27,09731,364-4,267
– Gross Longs:7,83155,55412,634
– Gross Shorts:34,92824,19016,901
– Long to Short Ratio:0.2 to 12.3 to 10.7 to 1
NET POSITION TREND:
– Strength Index Score (3 Year Range Pct):46.050.660.7
– Strength Index Reading (3 Year Range):BearishBullishBullish
NET POSITION MOVEMENT INDEX:
– 6-Week Change in Strength Index:30.7-10.3-37.5


Canadian Dollar Futures:

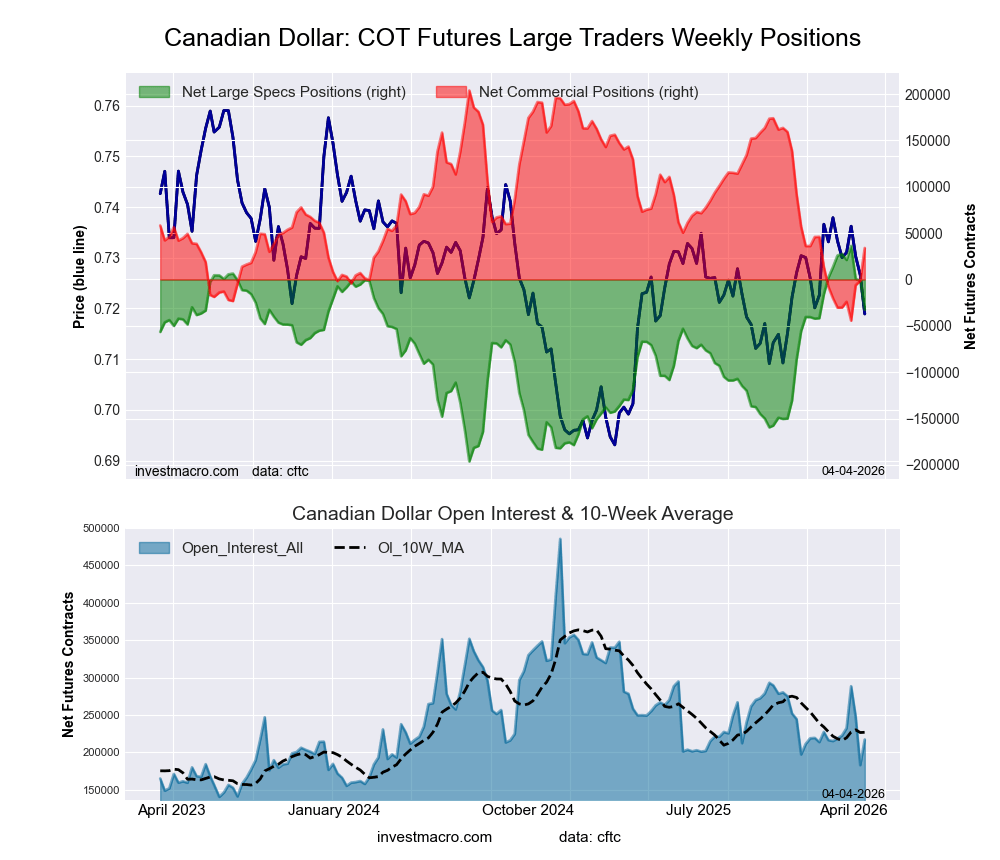
Canadian Dollar Forex Futures COT ChartThe Canadian Dollar large speculator standing this week came in at a net position of -1,602 contracts in the data reported through Tuesday. This was a weekly decrease of -2,488 contracts from the previous week which had a total of 886 net contracts.

This week’s current strength score (the trader positioning range over the past three years, measured from 0 to 100) shows the speculators are currently Bullish-Extreme with a score of 83.8 percent. The commercials are Bearish-Extreme with a score of 17.3 percent and the small traders (not shown in chart) are Bullish with a score of 53.6 percent.

Price Trend-Following Model: Weak Uptrend

Our weekly trend-following model classifies the current market price position as: Weak Uptrend.

CANADIAN DOLLAR StatisticsSPECULATORSCOMMERCIALSSMALL TRADERS
– Percent of Open Interest Longs:34.144.217.3
– Percent of Open Interest Shorts:35.044.915.7
– Net Position:-1,602-1,3712,973
– Gross Longs:62,38280,78831,593
– Gross Shorts:63,98482,15928,620
– Long to Short Ratio:1.0 to 11.0 to 11.1 to 1
NET POSITION TREND:
– Strength Index Score (3 Year Range Pct):83.817.353.6
– Strength Index Reading (3 Year Range):Bullish-ExtremeBearish-ExtremeBullish
NET POSITION MOVEMENT INDEX:
– 6-Week Change in Strength Index:-6.47.6-11.0


Australian Dollar Futures:

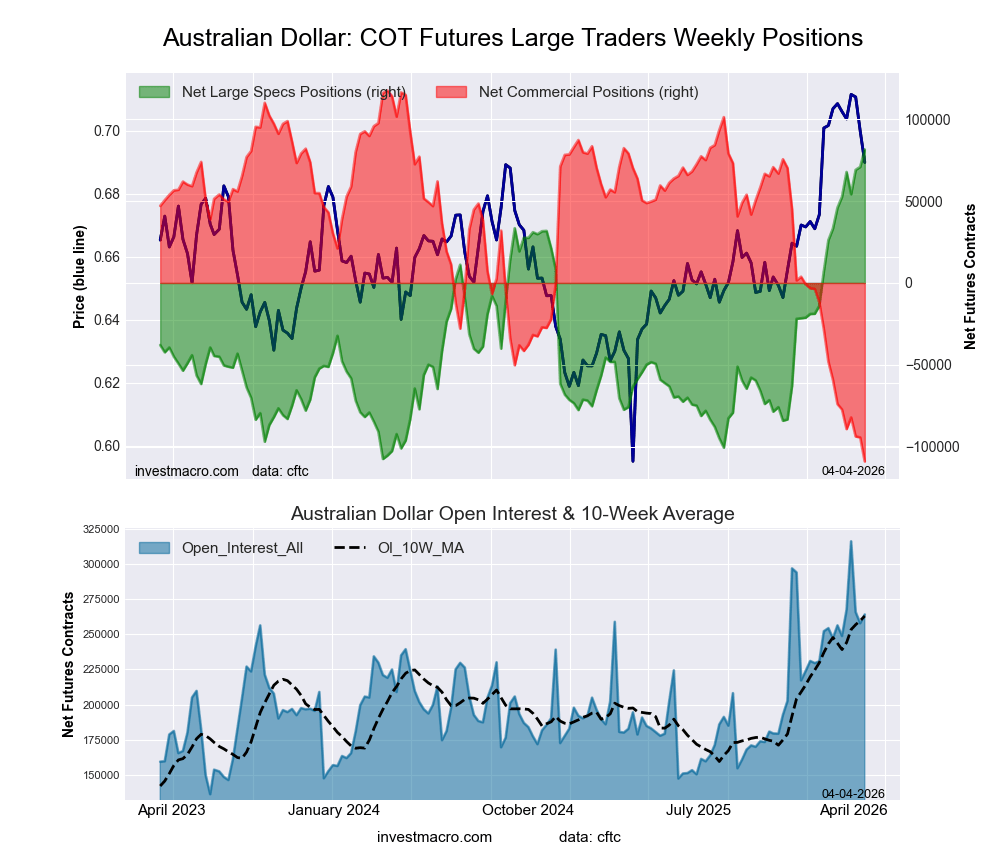
Australian Dollar Forex Futures COT ChartThe Australian Dollar large speculator standing this week came in at a net position of 70,872 contracts in the data reported through Tuesday. This was a weekly gain of 1,811 contracts from the previous week which had a total of 69,061 net contracts.

This week’s current strength score (the trader positioning range over the past three years, measured from 0 to 100) shows the speculators are currently Bullish-Extreme with a score of 100.0 percent. The commercials are Bearish-Extreme with a score of 0.0 percent and the small traders (not shown in chart) are Bullish-Extreme with a score of 90.2 percent.

Price Trend-Following Model: Uptrend

Our weekly trend-following model classifies the current market price position as: Uptrend.

AUSTRALIAN DOLLAR StatisticsSPECULATORSCOMMERCIALSSMALL TRADERS
– Percent of Open Interest Longs:51.531.115.5
– Percent of Open Interest Shorts:24.067.76.4
– Net Position:70,872-94,36723,495
– Gross Longs:132,62980,06339,940
– Gross Shorts:61,757174,43016,445
– Long to Short Ratio:2.1 to 10.5 to 12.4 to 1
NET POSITION TREND:
– Strength Index Score (3 Year Range Pct):100.00.090.2
– Strength Index Reading (3 Year Range):Bullish-ExtremeBearish-ExtremeBullish-Extreme
NET POSITION MOVEMENT INDEX:
– 6-Week Change in Strength Index:21.1-16.6-5.2


New Zealand Dollar Futures:

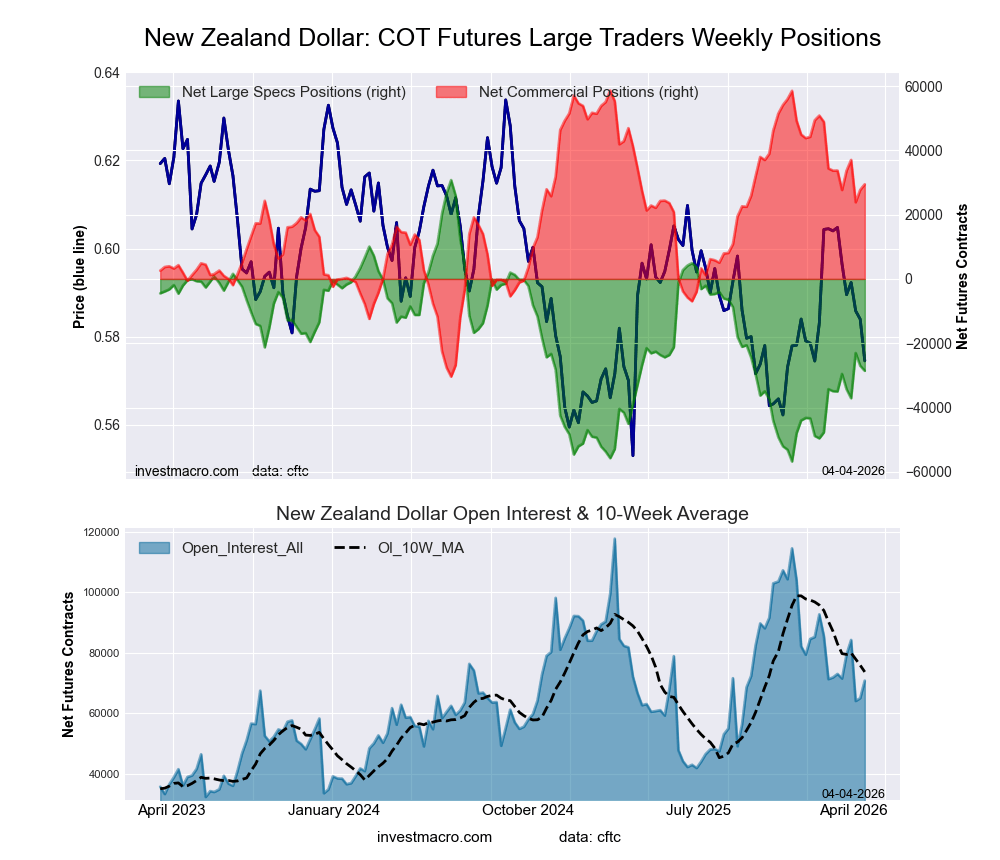
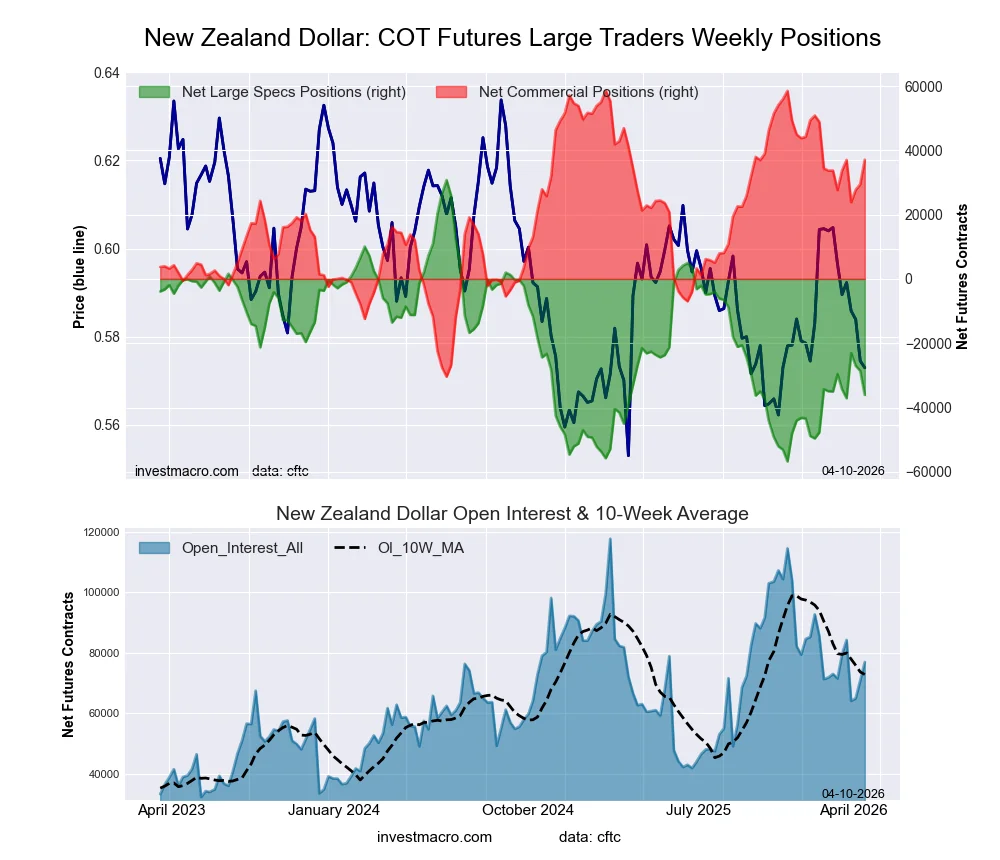
New Zealand Dollar Forex Futures COT ChartThe New Zealand Dollar large speculator standing this week came in at a net position of -27,006 contracts in the data reported through Tuesday. This was a weekly reduction of -3,949 contracts from the previous week which had a total of -23,057 net contracts.

This week’s current strength score (the trader positioning range over the past three years, measured from 0 to 100) shows the speculators are currently Bearish with a score of 34.0 percent. The commercials are Bullish with a score of 65.3 percent and the small traders (not shown in chart) are Bearish with a score of 43.4 percent.

Price Trend-Following Model: Weak Uptrend

Our weekly trend-following model classifies the current market price position as: Weak Uptrend.

NEW ZEALAND DOLLAR StatisticsSPECULATORSCOMMERCIALSSMALL TRADERS
– Percent of Open Interest Longs:16.777.55.2
– Percent of Open Interest Shorts:58.234.96.3
– Net Position:-27,00627,694-688
– Gross Longs:10,84750,3933,403
– Gross Shorts:37,85322,6994,091
– Long to Short Ratio:0.3 to 12.2 to 10.8 to 1
NET POSITION TREND:
– Strength Index Score (3 Year Range Pct):34.065.343.4
– Strength Index Reading (3 Year Range):BearishBullishBearish
NET POSITION MOVEMENT INDEX:
– 6-Week Change in Strength Index:9.0-6.7-25.0


Mexican Peso Futures:

Mexican Peso Futures COT ChartThe Mexican Peso large speculator standing this week came in at a net position of 74,076 contracts in the data reported through Tuesday. This was a weekly lift of 5,616 contracts from the previous week which had a total of 68,460 net contracts.

This week’s current strength score (the trader positioning range over the past three years, measured from 0 to 100) shows the speculators are currently Bullish with a score of 53.5 percent. The commercials are Bearish with a score of 45.8 percent and the small traders (not shown in chart) are Bearish with a score of 40.3 percent.

Price Trend-Following Model: Weak Uptrend

Our weekly trend-following model classifies the current market price position as: Weak Uptrend.

MEXICAN PESO StatisticsSPECULATORSCOMMERCIALSSMALL TRADERS
– Percent of Open Interest Longs:55.340.73.5
– Percent of Open Interest Shorts:10.987.01.6
– Net Position:74,076-77,2323,156
– Gross Longs:92,24667,7585,899
– Gross Shorts:18,170144,9902,743
– Long to Short Ratio:5.1 to 10.5 to 12.2 to 1
NET POSITION TREND:
– Strength Index Score (3 Year Range Pct):53.545.840.3
– Strength Index Reading (3 Year Range):BullishBearishBearish
NET POSITION MOVEMENT INDEX:
– 6-Week Change in Strength Index:-7.78.1-5.7


Brazilian Real Futures:

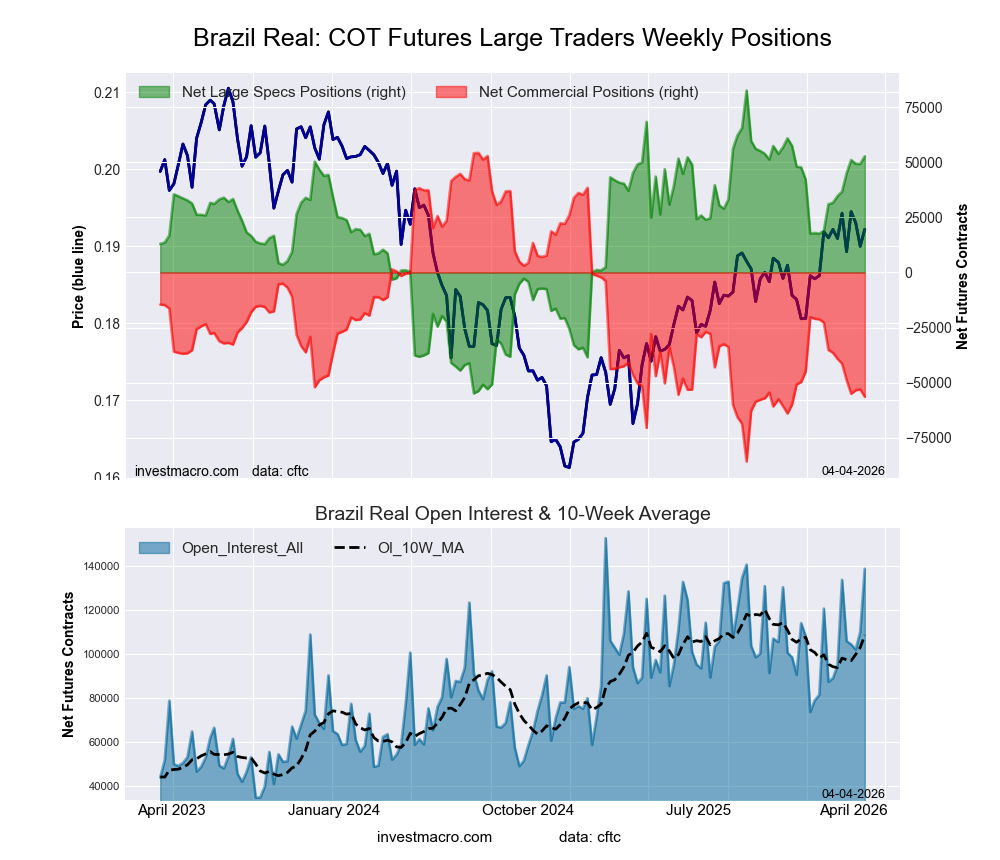
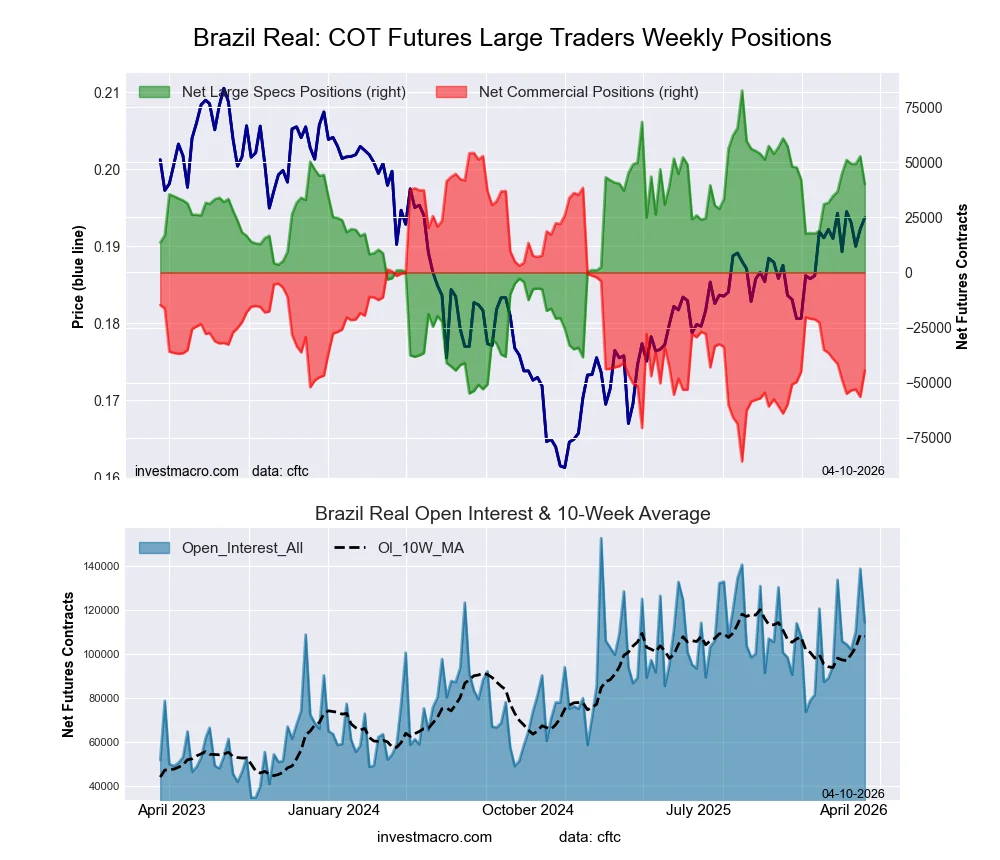
Brazil Real Futures COT ChartThe Brazilian Real large speculator standing this week came in at a net position of 49,248 contracts in the data reported through Tuesday. This was a weekly reduction of -69 contracts from the previous week which had a total of 49,317 net contracts.

This week’s current strength score (the trader positioning range over the past three years, measured from 0 to 100) shows the speculators are currently Bullish with a score of 75.8 percent. The commercials are Bearish with a score of 23.4 percent and the small traders (not shown in chart) are Bearish with a score of 42.4 percent.

Price Trend-Following Model: Uptrend

Our weekly trend-following model classifies the current market price position as: Uptrend.

BRAZIL REAL StatisticsSPECULATORSCOMMERCIALSSMALL TRADERS
– Percent of Open Interest Longs:68.621.54.3
– Percent of Open Interest Shorts:23.869.80.9
– Net Position:49,248-53,0673,819
– Gross Longs:75,35423,5934,777
– Gross Shorts:26,10676,660958
– Long to Short Ratio:2.9 to 10.3 to 15.0 to 1
NET POSITION TREND:
– Strength Index Score (3 Year Range Pct):75.823.442.4
– Strength Index Reading (3 Year Range):BullishBearishBearish
NET POSITION MOVEMENT INDEX:
– 6-Week Change in Strength Index:12.8-11.9-5.7


Bitcoin Futures:

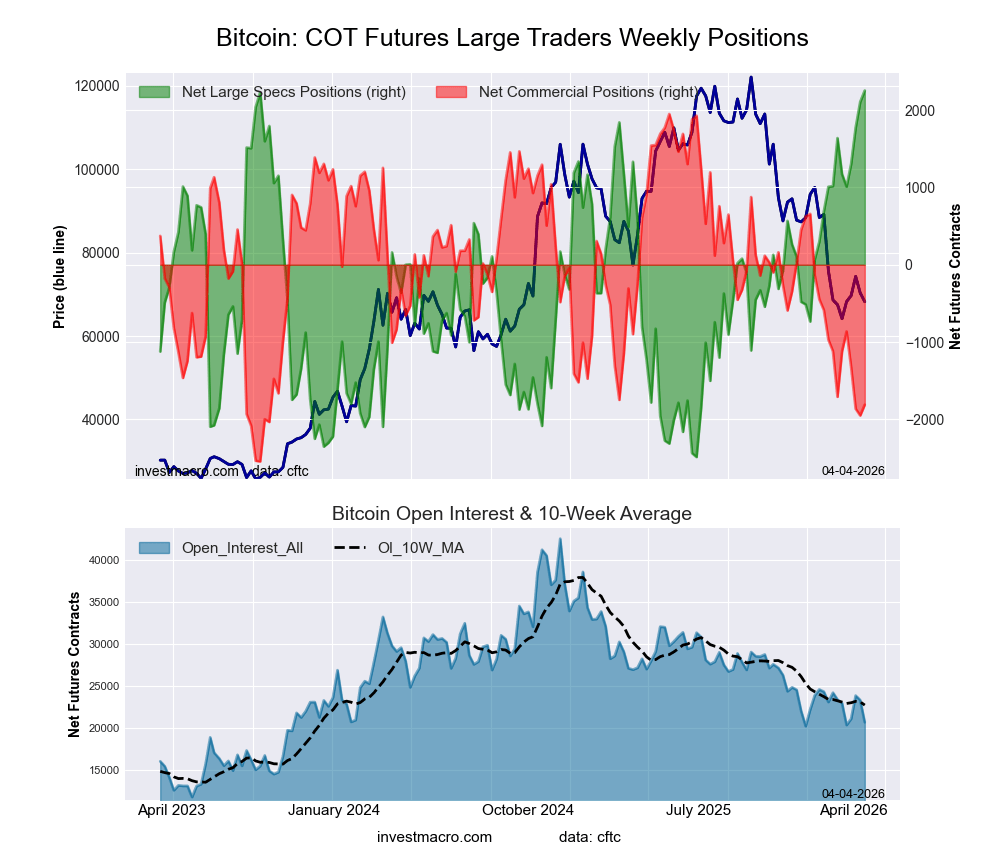
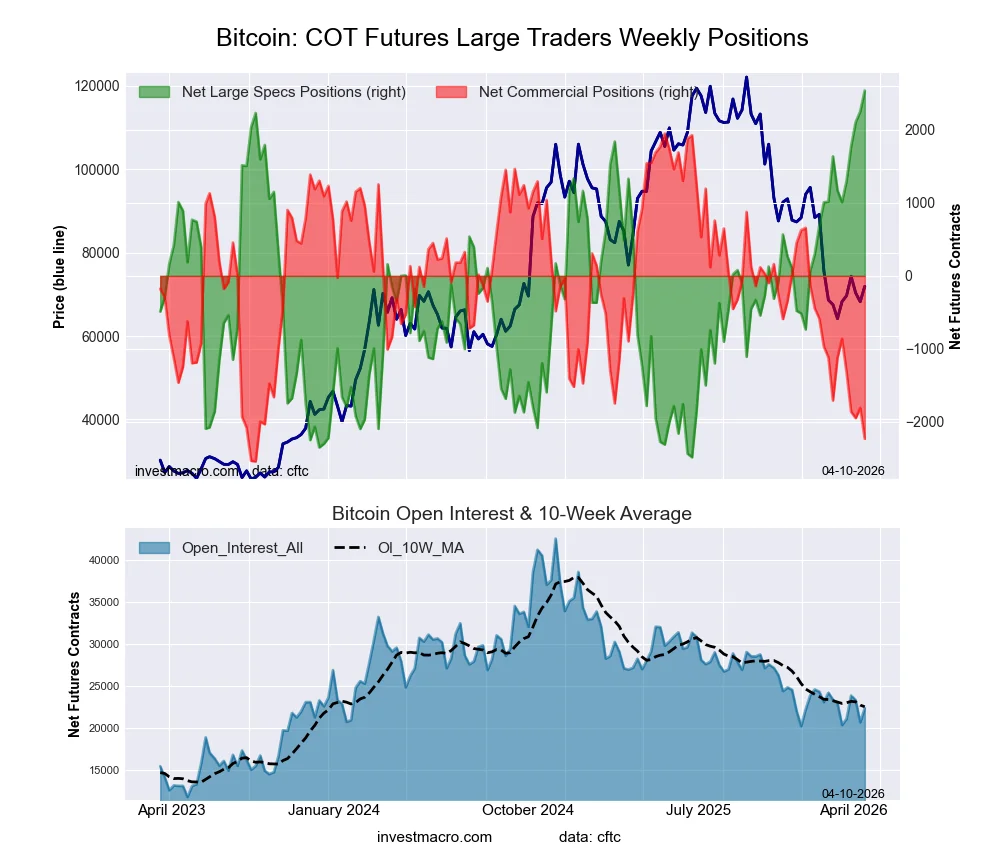
Bitcoin Crypto Futures COT ChartThe Bitcoin large speculator standing this week came in at a net position of 2,106 contracts in the data reported through Tuesday. This was a weekly gain of 333 contracts from the previous week which had a total of 1,773 net contracts.

This week’s current strength score (the trader positioning range over the past three years, measured from 0 to 100) shows the speculators are currently Bullish-Extreme with a score of 97.3 percent. The commercials are Bearish-Extreme with a score of 13.2 percent and the small traders (not shown in chart) are Bearish with a score of 29.2 percent.

Price Trend-Following Model: Downtrend

Our weekly trend-following model classifies the current market price position as: Downtrend.

BITCOIN StatisticsSPECULATORSCOMMERCIALSSMALL TRADERS
– Percent of Open Interest Longs:68.21.04.7
– Percent of Open Interest Shorts:59.19.35.4
– Net Position:2,106-1,949-157
– Gross Longs:15,8612241,097
– Gross Shorts:13,7552,1731,254
– Long to Short Ratio:1.2 to 10.1 to 10.9 to 1
NET POSITION TREND:
– Strength Index Score (3 Year Range Pct):97.313.229.2
– Strength Index Reading (3 Year Range):Bullish-ExtremeBearish-ExtremeBearish
NET POSITION MOVEMENT INDEX:
– 6-Week Change in Strength Index:23.1-18.5-13.3


Article By InvestMacroReceive our weekly COT Newsletter

*COT Report: The COT data, released weekly to the public each Friday, is updated through the most recent Tuesday (data is 3 days old) and shows a quick view of how large speculators or non-commercials (for-profit traders) were positioned in the futures markets.

The CFTC categorizes trader positions according to commercial hedgers (traders who use futures contracts for hedging as part of the business), non-commercials (large traders who speculate to realize trading profits) and nonreportable traders (usually small traders/speculators) as well as their open interest (contracts open in the market at time of reporting). See CFTC criteria here.

GBP/USD Eyes Middle East: Details Matter to the Market

By Analytical Department RoboForex

GBP/USD traded at 1.3364 on Thursday. The pair declined over the previous two sessions and is now showing signs of a tentative recovery amid expectations of a possible de-escalation in the Middle East conflict.

The US has reportedly presented Iran with a 15-point settlement plan following discussions about a potential month-long truce. However, Iran has rejected participation in negotiations, stating that US diplomacy cannot be trusted.

In the UK, February inflation figures matched expectations. Headline CPI held steady at 3%, while core inflation edged up slightly to 3.2% against a forecast of 3.1%. However, the data had limited impact on the market, as it reflected conditions prior to the latest escalation in the Middle East.

Against the backdrop of lower oil prices, investors are revising their expectations for Bank of England policy. The market is now pricing in fewer than two rate hikes before year-end, with total expected tightening estimated at approximately 68 basis points, down from nearly 75 basis points previously.

Technical Analysis

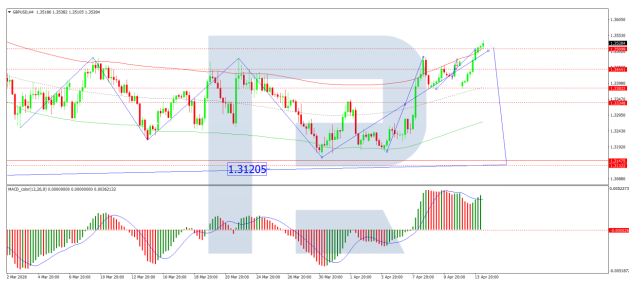
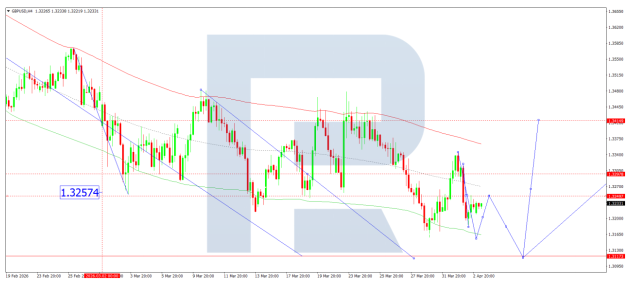
On the H4 GBP/USD chart, the market is forming a broad consolidation range around 1.3354, currently extending up to 1.3434. A decline to 1.3255 is expected in the near term, followed by the formation of a new consolidation range. An upside breakout would pave the way for a continuation wave to 1.3494, while a downside breakout would suggest further movement to 1.3119. Technically, this scenario is confirmed by the MACD indicator, whose signal line is above zero and pointing firmly downwards.

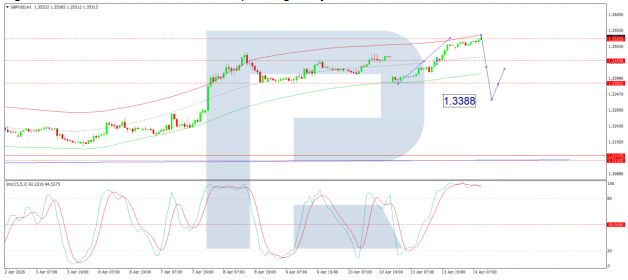
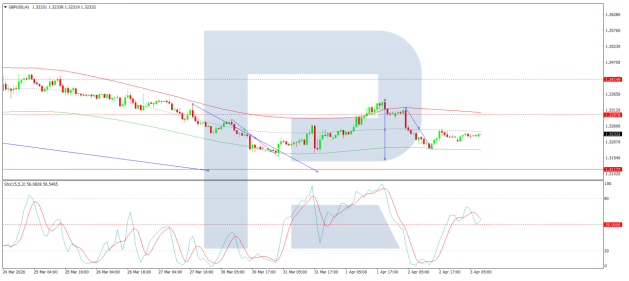
On the H1 chart, the market has formed a compact consolidation range around 1.3355. A downside breakout has initiated a wave structure extending to 1.3255. Should this level be breached, further downside towards 1.3125 is likely. Conversely, an upside breakout from the range could trigger a growth wave to 1.3494. Technically, this scenario is confirmed by the Stochastic oscillator, with its signal line below 20 and pointing firmly downwards.

Conclusion

GBP/USD is navigating competing forces amid short-term volatility driven by geopolitical headlines. While tentative signs of a potential US–Iran truce have offered some relief to markets, Iran’s rejection of negotiations underscores the fragility of hopes for de-escalation. Meanwhile, UK inflation data – though in line with forecasts – has been largely overlooked given its pre-escalation timeframe. Lower oil prices have prompted markets to scale back expectations for Bank of England tightening, offering modest support for sterling. With technical indicators pointing to continued consolidation and the Middle East situation remaining fluid, the pair’s near-term direction will likely hinge on further geopolitical developments.


Disclaimer

Any forecasts contained herein are based on the author’s particular opinion. This analysis may not be treated as trading advice. RoboForex bears no responsibility for trading results based on trading recommendations and reviews contained herein.

USD/JPY Maintains Growth Mood: Market Sympathies on the US Dollar Side

By Analytical Department RoboForex

USD/JPY continues its upward trajectory on Wednesday, rising to 158.78 following a volatile start to the week. Pressure on the yen has eased amid a pullback in oil prices and expectations of a potential resolution to the Middle East conflict-a development of particular significance for Japan’s energy-importing economy.

The move comes amid reports of US diplomatic efforts aimed at resolving the conflict with Iran. However, scepticism persists in the market, as Tehran had previously denied the existence of any negotiations with Washington.

Additional support for the yen stems from expectations of possible government intervention. Japanese officials have signalled their readiness to take necessary measures to stabilise the currency.

It has also been reported that Japan’s Ministry of Finance is in contact with market participants regarding potential intervention in the oil futures market, given its impact on the yen.

Technical Analysis

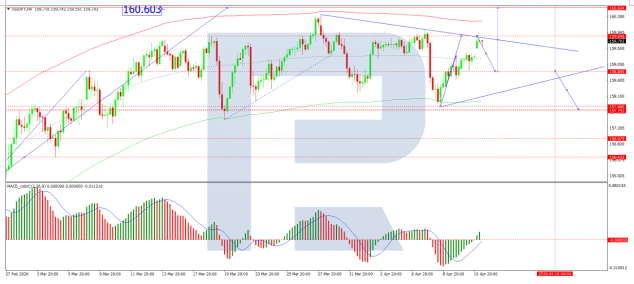
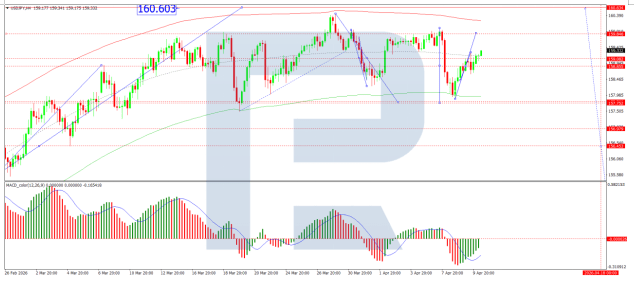
On the H4 chart, USD/JPY is forming a consolidation range around the 158.60 level. A decline to 157.40 is expected today, followed by an increase to 158.50. Should the market break upwards from this range, a correction towards 160.10 would be relevant to consider. Subsequently, a new downward impulse to 157.40 is anticipated, with the potential for the correction to extend to 156.00.

Technically, this scenario is confirmed by the MACD indicator-its signal line is below zero and pointing strictly downwards, reflecting the potential for continued correction.

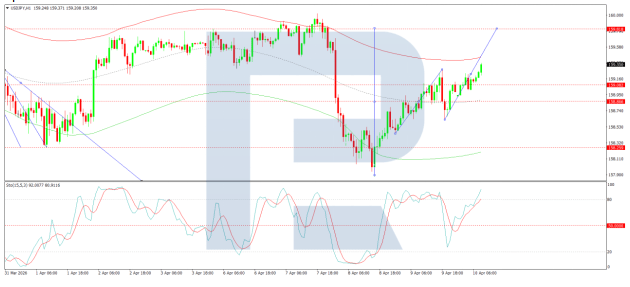
On the H1 chart, the market is shaping a downward wave pattern towards 157.40. Reaching this target level will be considered today. Following the completion of this wave, the development of the next growth wave to 160.10 (test from below) is expected.

The scenario is confirmed by the Stochastic oscillator-its signal line is below the 50 level and pointing strictly downwards towards 20, indicating that short-term downside potential remains.

Conclusion

USD/JPY remains in a growth-oriented mood as easing oil prices and tentative hopes for diplomatic progress in the Middle East offer some relief to the yen. While reports of US-led negotiations with Iran have contributed to a pullback in energy markets, market scepticism persists given Tehran’s earlier denial of talks. Japanese authorities stand ready to intervene should volatility spike, adding an element of caution for traders. Technical indicators point to a short-term correction lower before the broader upward trend potentially resumes towards 160.10. The yen’s trajectory remains closely tied to developments in both energy markets and geopolitical tensions, which continue to shape the Bank of Japan’s policy landscape.


Disclaimer

Any forecasts contained herein are based on the author’s particular opinion. This analysis may not be treated as trading advice. RoboForex bears no responsibility for trading results based on trading recommendations and reviews contained herein.

EUR/USD Declines: All Market Risks Remain Valid

By Analytical Department RoboForex

EUR/USD fell to 1.1549 on Monday, with the US dollar extending gains from the previous session amid heightened demand for safe-haven assets as the Middle East conflict escalates.

The confrontation between the US and Israel against Iran has entered its fourth week with no signs of de-escalation. Donald Trump has threatened to strike Iran’s energy infrastructure if the Strait of Hormuz is not reopened. Tehran has announced it is prepared to attack key US and Israeli targets in the region in response.

Elevated oil prices continue to fuel inflationary concerns and reduce the likelihood of an imminent Federal Reserve rate cut. Some market participants are even beginning to consider the possibility of a rate hike later this year.

Last week, the Fed held rates steady as expected. Jerome Powell noted that it remains too early to assess the full economic impact of the Iran conflict.

The European Central Bank, the Bank of England, and the Bank of Japan also left rates unchanged but signalled their readiness to tighten policy further should inflationary pressures persist.

Technical Analysis

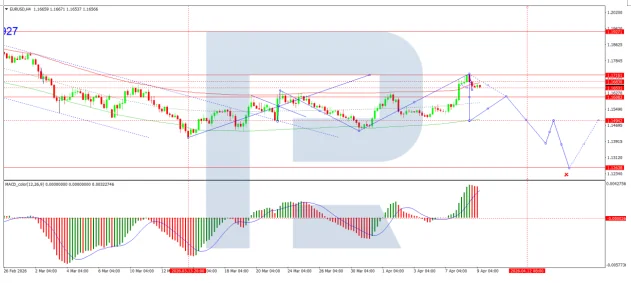
On the H4 chart, EUR/USD is forming a consolidation range around 1.1526. An upside breakout is expected, with a continuation wave towards 1.1647 as a near-term target. Subsequently, a new downward wave is anticipated to 1.1529. Technically, this scenario is confirmed by the MACD indicator – its signal line is above zero and pointing firmly upwards, reflecting ongoing bullish momentum and the potential for the uptrend to continue.

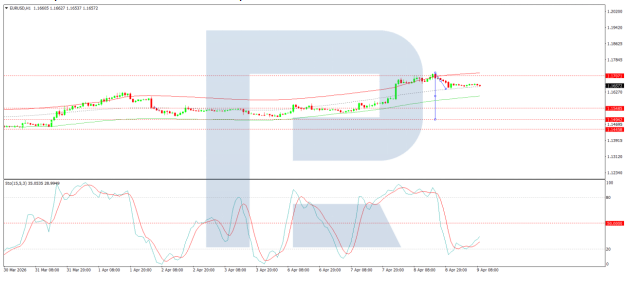
On the H1 chart, the market is forming the structure of the next downward wave towards 1.1499. After reaching this level, a rebound to 1.1556 is expected, with potential for the subsequent growth wave to extend to 1.1647. Technically, this scenario is confirmed by the Stochastic oscillator – its signal line is below 50 and pointing firmly downwards towards 20.

Conclusion

EUR/USD remains under pressure as geopolitical risks in the Middle East continue to drive safe-haven demand for the US dollar. With the conflict entering its fourth week and oil prices remaining elevated, inflationary concerns persist, delaying expectations for Fed rate cuts. Central banks across major economies remain alert, keeping tightening on the table. While technical indicators suggest potential short-term rebound, the broader outlook for the euro remains fragile as market risks show no signs of abating.


Disclaimer

Any forecasts contained herein are based on the author’s particular opinion. This analysis may not be treated as trading advice. RoboForex bears no responsibility for trading results based on trading recommendations and reviews contained herein.

Currency Speculators sharply drop Euro, CAD bets while boosting GBP, CHF & AUD

By InvestMacro | COT | Data Tables | COT Leaders | Downloads | COT Newsletter

Speculators OI FX Futures COT Chart

Here are the latest charts and statistics for the Commitment of Traders (COT) data published by the Commodities Futures Trading Commission (CFTC).

The latest COT data is updated through Tuesday March 17th and shows a quick view of how large market participants (for-profit speculators and commercial traders) were positioned in the futures markets. All currency positions are in direct relation to the US dollar where, for example, a bet for the euro is a bet that the euro will rise versus the dollar while a bet against the euro will be a bet that the euro will decline versus the dollar.

Weekly Speculator Changes led by GBP, Swiss Franc, Australian & New Zealand Dollars

Speculators Nets FX Futures COT Chart
The COT currency market speculator bets were overall slightly higher this week as six out of the eleven currency markets we cover had higher positioning while the other five markets had lower speculator contracts.

Leading the gains for the currency markets was British Pound (18,682 contracts) with the Swiss Franc (15,879 contracts), the Australian Dollar (14,864 contracts), the New Zealand Dollar (14,054 contracts), the US Dollar Index (9,575 contracts) and Bitcoin (471 contracts) also showing a small positive week.

The currencies seeing declines in speculator bets on the week were the EuroFX (-84,012 contracts), the Canadian Dollar (-35,273 contracts), the Japanese Yen (-26,393 contracts), the Mexican Peso (-5,351 contracts) and with the Brazilian Real (-1,711 contracts) also registering lower bets on the week.

Currency Speculators sharply drop Euro, CAD bets while boosting GBP, CHF & AUD

The COT market data for Currencies this week saw a bunch of extremely significant changes in the speculator positioning through Tuesday.

First off, the biggest mover on the week was the Euro, which saw a gigantic drawback in speculative bullish bets by -84,012 contracts. This marks the biggest drawdown for one week in Euro futures history. The Euro position has now fallen for five consecutive weeks, and that has taken off roughly -160,000 contracts from the bullish position, which has now fallen to a paltry +21,132 net contracts this week. This breaks a streak of fifteen consecutive weeks where the net contract position was over 100,000 contracts. In the currency exchange market, the Euro managed to have a gaining week after a couple of strong down weeks and trades right below the psychological 1.1600 resistance level, with support below at the 1.1475 to 1.1500 exchange levels.

Next up, the Canadian Dollar contracts saw a similar shortfall on the week with a -35,273 net contract decline this week. Unlike the Euro, the Canadian Dollar contracts had been ascending over the past weeks – as speculator contracts had risen in seven out of the previous eight weeks and had pushed the net contract position up to a +36,159 net contract position on March 10th. After this week’s sharp decline, the net position is virtually unchanged at a small +886 net speculator position. The CAD price in the currency markets has been treading water without much direction recently with the CAD ranging between 0.7200 and 0.7400 over the past eight weeks.

On the plus side, the British Pound Sterling saw a strong rise this week after declining in the previous five consecutive weeks. This week’s gain by over +18,000 net contracts was the highest weekly gain out of the past three months dating back to December 16th, 2025. However, the British Pound Sterling net position remains bearish. Overall, this currency speculator position has now been in a continuous bearish position for the past 34 weeks, dating back to July 22nd of 2025. In the Foreign Exchange Markets, the British Pound Sterling against the US Dollar saw a modest rise this week for the first time out of the past four weeks and now trades right around the 1.3300 exchange level. The Pound Sterling has recently been retreating after reaching a high in January around the 1.3870 level.

The Swiss Franc saw strong speculator demand this week with a gain of over +15,000 contracts. The Swiss Franc speculator position is usually a safe haven bid, and you would typically think the speculator position would be super strong. But there has been quite a lot of hedging in the Swiss Franc futures markets, so many of the moves are counterintuitive. However, this week obviously saw some safe haven speculator bids. While the Franchas been super strong in the Exchange Markets against the US Dollar, with the price of the Franc up around 17% higher since the beginning of January 2025. Currently, the Franc against the US Dollar trades at the 1.2797 exchange rate and has been as high as 1.3219 in late January.

The Australian Dollar, on the other hand, has been traditionally the anti-safe haven or high beta and usually plummets along with weakened speculator sentiment in uncertain times. However, the Australian Dollar continues to see strong speculator inflows. Speculator positions have gained in 15 out of the past 16 weeks, with an inflow of +153,237 net contracts over that time. This has brought the overall speculator position to a bullish level of +69,061 net contracts. This is the highest level for a standing speculator position since 2017, or a difference of about 441 weeks. The Australian Dollar against the US Dollar in the forex market dipped this week but remains trading right at the important psychological support and resistance level of 0.7000.

The New Zealand Dollar speculator position also saw strong inflows this week with a weekly gain of 14,054 net contracts. The New Zealand Dollar has been somewhat on a different path than the Australian Dollar, as the overall net position has been bearish for the past 35 weeks, dating back to July 15th, 2025. Over that time, we have seen a few record-breaking bearish positions, with December 9th reaching the highest bearish level on record at -56,781 net contracts. Since that all-time bearish position, the New Zealand Dollar speculator position has shed almost 30,000 contracts, and this week leveled the position at -23,057 net contracts. In the Forex Markets, the New Zealand Dollar against the US Dollar has been in a multi-year downtrend, with prices in January hitting the 200-weekly moving average and fading lower and with the NZD trading currently at 0.5840 exchange levels.

Leading the Currencies market price performances was the Euro and British Pound

Seeing the highest weekly price changes this week was the Euro with a 1.35% increase over the last five days. The British Pound Sterling came in second with a 0.90% change, while the New Zealand Dollar saw a 0.89% gain on the week. Next up, the Mexican Peso was higher by 0.62%, followed by the Australian Dollar which rose by 0.56%. The Swiss Franc was also higher by 0.42% on the week. The Japanese Yen managed to see an uptick by 0.28%, while the Canadian Dollar was virtually unchanged but edged up by 0.04% on the week.

The Brazilian Real dipped by -0.03%, while the US Dollar Index was lower by -0.79%. Bitcoin saw the biggest shortfall in the week with a -1.80% decline.


Currencies Data:

Speculators FX Futures COT Data Table
Legend: Open Interest | Speculators Current Net Position | Weekly Specs Change | Specs Strength Score compared to last 3-Years (0-100 range)


Strength Scores led by Australian Dollar & Bitcoin

Speculators Strength Scores FX Futures COT Chart
COT Strength Scores (a normalized measure of Speculator positions over a 3-Year range, from 0 to 100 where above 80 is Extreme-Bullish and below 20 is Extreme-Bearish) showed that the Australian Dollar (100 percent) and the Bitcoin (90 percent) lead the currency markets this week. The Canadian Dollar (85 percent), Brazilian Real (76 percent) and the US Dollar Index (54 percent) come in as the next highest in the weekly strength scores.

On the downside, the British Pound (12 percent) comes in at the lowest strength levels currently and are in Extreme-Bearish territory (below 20 percent). The next lowest strength scores are the Japanese Yen (32 percent), the EuroFX (37 percent) and the New Zealand Dollar (39 percent).

3-Year Strength Statistics:
US Dollar Index (54.1 percent) vs US Dollar Index previous week (28.3 percent)
EuroFX (36.8 percent) vs EuroFX previous week (68.8 percent)
British Pound Sterling (11.8 percent) vs British Pound Sterling previous week (3.8 percent)
Japanese Yen (32.0 percent) vs Japanese Yen previous week (39.3 percent)
Swiss Franc (49.8 percent) vs Swiss Franc previous week (17.6 percent)
Canadian Dollar (84.8 percent) vs Canadian Dollar previous week (100.0 percent)
Australian Dollar (100.0 percent) vs Australian Dollar previous week (91.6 percent)
New Zealand Dollar (38.5 percent) vs New Zealand Dollar previous week (22.5 percent)
Mexican Peso (49.6 percent) vs Mexican Peso previous week (53.4 percent)
Brazilian Real (75.8 percent) vs Brazilian Real previous week (77.1 percent)
Bitcoin (90.3 percent) vs Bitcoin previous week (80.3 percent)


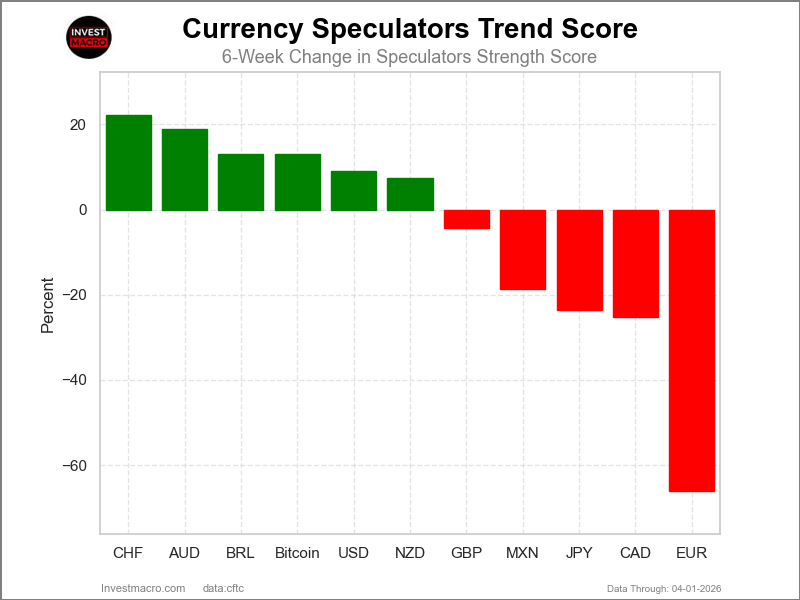
Swiss Franc & Australian Dollar top the 6-Week Strength Trends
Speculators Trends FX Futures COT Chart
COT Strength Score Trends (or move index, calculates the 6-week changes in strength scores) showed that the Swiss Franc (31 percent) and the Australian Dollar (24 percent) lead the past six weeks trends for the currencies. Bitcoin (16 percent), the New Zealand Dollar (13 percent) and the Brazilian Real (13 percent) are the next highest positive movers in the 3-Year trends data.

The EuroFX (-54 percent) leads the downside trend scores currently with the British Pound (-22 percent), Mexican Peso (-16 percent) and the Japanese Yen (-13 percent) following next with lower trend scores.

3-Year Strength Trends:
US Dollar Index (12.3 percent) vs US Dollar Index previous week (-4.0 percent)
EuroFX (-54.1 percent) vs EuroFX previous week (-10.3 percent)
British Pound Sterling (-21.9 percent) vs British Pound Sterling previous week (-28.9 percent)
Japanese Yen (-13.4 percent) vs Japanese Yen previous week (-2.1 percent)
Swiss Franc (31.4 percent) vs Swiss Franc previous week (3.6 percent)
Canadian Dollar (-0.5 percent) vs Canadian Dollar previous week (22.5 percent)
Australian Dollar (24.3 percent) vs Australian Dollar previous week (26.6 percent)
New Zealand Dollar (12.8 percent) vs New Zealand Dollar previous week (12.1 percent)
Mexican Peso (-15.7 percent) vs Mexican Peso previous week (-20.7 percent)
Brazilian Real (13.4 percent) vs Brazilian Real previous week (23.4 percent)
Bitcoin (16.2 percent) vs Bitcoin previous week (13.0 percent)


Individual COT Forex Markets:

US Dollar Index Futures:
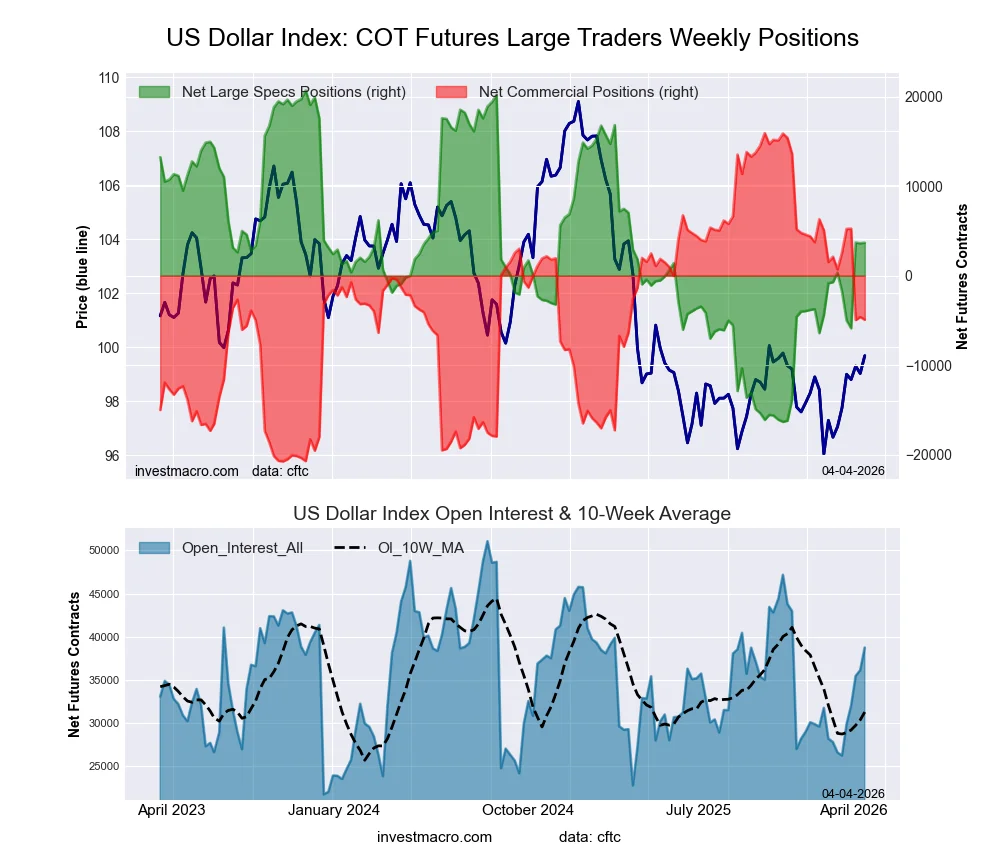
US Dollar Index Forex Futures COT ChartThe US Dollar Index large speculator standing this week resulted in a net position of 3,693 contracts in the data reported through Tuesday. This was a weekly increase of 9,575 contracts from the previous week which had a total of -5,882 net contracts.

This week’s current strength score (the trader positioning range over the past three years, measured from 0 to 100) shows the speculators are currently Bullish with a score of 54.1 percent. The commercials are Bearish with a score of 43.1 percent and the small traders (not shown in chart) are Bullish with a score of 61.1 percent.

Price Trend-Following Model: Weak Downtrend

Our weekly trend-following model classifies the current market price position as: Weak Downtrend.

US DOLLAR INDEX StatisticsSPECULATORSCOMMERCIALSSMALL TRADERS
– Percent of Open Interest Longs:60.425.28.8
– Percent of Open Interest Shorts:50.039.25.3
– Net Position:3,693-4,9571,264
– Gross Longs:21,4268,9323,132
– Gross Shorts:17,73313,8891,868
– Long to Short Ratio:1.2 to 10.6 to 11.7 to 1
NET POSITION TREND:
– Strength Index Score (3 Year Range Pct):54.143.161.1
– Strength Index Reading (3 Year Range):BullishBearishBullish
NET POSITION MOVEMENT INDEX:
– 6-Week Change in Strength Index:12.3-17.733.9


Euro Currency Futures:

Euro Currency Futures COT ChartThe Euro Currency large speculator standing this week resulted in a net position of 21,132 contracts in the data reported through Tuesday. This was a weekly decline of -84,012 contracts from the previous week which had a total of 105,144 net contracts.

This week’s current strength score (the trader positioning range over the past three years, measured from 0 to 100) shows the speculators are currently Bearish with a score of 36.8 percent. The commercials are Bullish with a score of 61.3 percent and the small traders (not shown in chart) are Bullish with a score of 53.2 percent.

Price Trend-Following Model: Weak Uptrend

Our weekly trend-following model classifies the current market price position as: Weak Uptrend.

EURO Currency StatisticsSPECULATORSCOMMERCIALSSMALL TRADERS
– Percent of Open Interest Longs:28.257.611.3
– Percent of Open Interest Shorts:25.465.36.4
– Net Position:21,132-58,43337,301
– Gross Longs:212,886435,13085,722
– Gross Shorts:191,754493,56348,421
– Long to Short Ratio:1.1 to 10.9 to 11.8 to 1
NET POSITION TREND:
– Strength Index Score (3 Year Range Pct):36.861.353.2
– Strength Index Reading (3 Year Range):BearishBullishBullish
NET POSITION MOVEMENT INDEX:
– 6-Week Change in Strength Index:-54.154.6-37.7


British Pound Sterling Futures:

British Pound Sterling Futures COT ChartThe British Pound Sterling large speculator standing this week resulted in a net position of -65,515 contracts in the data reported through Tuesday. This was a weekly rise of 18,682 contracts from the previous week which had a total of -84,197 net contracts.

This week’s current strength score (the trader positioning range over the past three years, measured from 0 to 100) shows the speculators are currently Bearish-Extreme with a score of 11.8 percent. The commercials are Bullish-Extreme with a score of 87.6 percent and the small traders (not shown in chart) are Bearish with a score of 40.7 percent.

Price Trend-Following Model: Weak Uptrend

Our weekly trend-following model classifies the current market price position as: Weak Uptrend.

BRITISH POUND StatisticsSPECULATORSCOMMERCIALSSMALL TRADERS
– Percent of Open Interest Longs:18.270.010.0
– Percent of Open Interest Shorts:45.141.212.0
– Net Position:-65,51570,330-4,815
– Gross Longs:44,293170,50924,456
– Gross Shorts:109,808100,17929,271
– Long to Short Ratio:0.4 to 11.7 to 10.8 to 1
NET POSITION TREND:
– Strength Index Score (3 Year Range Pct):11.887.640.7
– Strength Index Reading (3 Year Range):Bearish-ExtremeBullish-ExtremeBearish
NET POSITION MOVEMENT INDEX:
– 6-Week Change in Strength Index:-21.924.7-30.3


Japanese Yen Futures:

Japanese Yen Forex Futures COT ChartThe Japanese Yen large speculator standing this week resulted in a net position of -67,780 contracts in the data reported through Tuesday. This was a weekly decrease of -26,393 contracts from the previous week which had a total of -41,387 net contracts.

This week’s current strength score (the trader positioning range over the past three years, measured from 0 to 100) shows the speculators are currently Bearish with a score of 32.0 percent. The commercials are Bullish with a score of 68.6 percent and the small traders (not shown in chart) are Bearish with a score of 31.0 percent.

Price Trend-Following Model: Strong Downtrend

Our weekly trend-following model classifies the current market price position as: Strong Downtrend.

JAPANESE YEN StatisticsSPECULATORSCOMMERCIALSSMALL TRADERS
– Percent of Open Interest Longs:32.750.212.1
– Percent of Open Interest Shorts:53.428.812.8
– Net Position:-67,78070,002-2,222
– Gross Longs:106,819163,97539,497
– Gross Shorts:174,59993,97341,719
– Long to Short Ratio:0.6 to 11.7 to 10.9 to 1
NET POSITION TREND:
– Strength Index Score (3 Year Range Pct):32.068.631.0
– Strength Index Reading (3 Year Range):BearishBullishBearish
NET POSITION MOVEMENT INDEX:
– 6-Week Change in Strength Index:-13.414.0-18.2


Swiss Franc Futures:

Swiss Franc Forex Futures COT ChartThe Swiss Franc large speculator standing this week resulted in a net position of -25,213 contracts in the data reported through Tuesday. This was a weekly boost of 15,879 contracts from the previous week which had a total of -41,092 net contracts.

This week’s current strength score (the trader positioning range over the past three years, measured from 0 to 100) shows the speculators are currently Bearish with a score of 49.8 percent. The commercials are Bearish with a score of 47.8 percent and the small traders (not shown in chart) are Bullish with a score of 60.2 percent.

Price Trend-Following Model: Uptrend

Our weekly trend-following model classifies the current market price position as: Uptrend.

SWISS FRANC StatisticsSPECULATORSCOMMERCIALSSMALL TRADERS
– Percent of Open Interest Longs:11.071.816.8
– Percent of Open Interest Shorts:45.131.922.8
– Net Position:-25,21329,602-4,389
– Gross Longs:8,17553,23612,475
– Gross Shorts:33,38823,63416,864
– Long to Short Ratio:0.2 to 12.3 to 10.7 to 1
NET POSITION TREND:
– Strength Index Score (3 Year Range Pct):49.847.860.2
– Strength Index Reading (3 Year Range):BearishBearishBullish
NET POSITION MOVEMENT INDEX:
– 6-Week Change in Strength Index:31.4-15.3-25.8


Canadian Dollar Futures:

Canadian Dollar Forex Futures COT ChartThe Canadian Dollar large speculator standing this week resulted in a net position of 886 contracts in the data reported through Tuesday. This was a weekly fall of -35,273 contracts from the previous week which had a total of 36,159 net contracts.

This week’s current strength score (the trader positioning range over the past three years, measured from 0 to 100) shows the speculators are currently Bullish-Extreme with a score of 84.8 percent. The commercials are Bearish-Extreme with a score of 15.4 percent and the small traders (not shown in chart) are Bullish with a score of 60.2 percent.

Price Trend-Following Model: Uptrend

Our weekly trend-following model classifies the current market price position as: Uptrend.

CANADIAN DOLLAR StatisticsSPECULATORSCOMMERCIALSSMALL TRADERS
– Percent of Open Interest Longs:26.858.212.1
– Percent of Open Interest Shorts:26.560.89.9
– Net Position:886-6,2065,320
– Gross Longs:66,507144,31429,911
– Gross Shorts:65,621150,52024,591
– Long to Short Ratio:1.0 to 11.0 to 11.2 to 1
NET POSITION TREND:
– Strength Index Score (3 Year Range Pct):84.815.460.2
– Strength Index Reading (3 Year Range):Bullish-ExtremeBearish-ExtremeBullish
NET POSITION MOVEMENT INDEX:
– 6-Week Change in Strength Index:-0.50.7-1.3


Australian Dollar Futures:

Australian Dollar Forex Futures COT ChartThe Australian Dollar large speculator standing this week resulted in a net position of 69,061 contracts in the data reported through Tuesday. This was a weekly boost of 14,864 contracts from the previous week which had a total of 54,197 net contracts.

This week’s current strength score (the trader positioning range over the past three years, measured from 0 to 100) shows the speculators are currently Bullish-Extreme with a score of 100.0 percent. The commercials are Bearish-Extreme with a score of 0.0 percent and the small traders (not shown in chart) are Bullish-Extreme with a score of 92.8 percent.

Price Trend-Following Model: Uptrend

Our weekly trend-following model classifies the current market price position as: Uptrend.

AUSTRALIAN DOLLAR StatisticsSPECULATORSCOMMERCIALSSMALL TRADERS
– Percent of Open Interest Longs:51.231.515.4
– Percent of Open Interest Shorts:25.266.86.1
– Net Position:69,061-93,77224,711
– Gross Longs:136,07483,76940,933
– Gross Shorts:67,013177,54116,222
– Long to Short Ratio:2.0 to 10.5 to 12.5 to 1
NET POSITION TREND:
– Strength Index Score (3 Year Range Pct):100.00.092.8
– Strength Index Reading (3 Year Range):Bullish-ExtremeBearish-ExtremeBullish-Extreme
NET POSITION MOVEMENT INDEX:
– 6-Week Change in Strength Index:24.3-21.65.9


New Zealand Dollar Futures:

New Zealand Dollar Forex Futures COT ChartThe New Zealand Dollar large speculator standing this week resulted in a net position of -23,057 contracts in the data reported through Tuesday. This was a weekly gain of 14,054 contracts from the previous week which had a total of -37,111 net contracts.

This week’s current strength score (the trader positioning range over the past three years, measured from 0 to 100) shows the speculators are currently Bearish with a score of 38.5 percent. The commercials are Bullish with a score of 61.0 percent and the small traders (not shown in chart) are Bearish with a score of 41.9 percent.

Price Trend-Following Model: Weak Uptrend

Our weekly trend-following model classifies the current market price position as: Weak Uptrend.

NEW ZEALAND DOLLAR StatisticsSPECULATORSCOMMERCIALSSMALL TRADERS
– Percent of Open Interest Longs:17.277.04.8
– Percent of Open Interest Shorts:53.139.76.1
– Net Position:-23,05723,860-803
– Gross Longs:10,99849,3173,090
– Gross Shorts:34,05525,4573,893
– Long to Short Ratio:0.3 to 11.9 to 10.8 to 1
NET POSITION TREND:
– Strength Index Score (3 Year Range Pct):38.561.041.9
– Strength Index Reading (3 Year Range):BearishBullishBearish
NET POSITION MOVEMENT INDEX:
– 6-Week Change in Strength Index:12.8-11.8-9.4


Mexican Peso Futures:

Mexican Peso Futures COT ChartThe Mexican Peso large speculator standing this week resulted in a net position of 68,460 contracts in the data reported through Tuesday. This was a weekly decline of -5,351 contracts from the previous week which had a total of 73,811 net contracts.

This week’s current strength score (the trader positioning range over the past three years, measured from 0 to 100) shows the speculators are currently Bearish with a score of 49.6 percent. The commercials are Bearish with a score of 48.3 percent and the small traders (not shown in chart) are Bullish with a score of 50.4 percent.

Price Trend-Following Model: Weak Uptrend

Our weekly trend-following model classifies the current market price position as: Weak Uptrend.

MEXICAN PESO StatisticsSPECULATORSCOMMERCIALSSMALL TRADERS
– Percent of Open Interest Longs:53.142.53.5
– Percent of Open Interest Shorts:13.285.40.6
– Net Position:68,460-73,4404,980
– Gross Longs:90,99772,8215,994
– Gross Shorts:22,537146,2611,014
– Long to Short Ratio:4.0 to 10.5 to 15.9 to 1
NET POSITION TREND:
– Strength Index Score (3 Year Range Pct):49.648.350.4
– Strength Index Reading (3 Year Range):BearishBearishBullish
NET POSITION MOVEMENT INDEX:
– 6-Week Change in Strength Index:-15.715.2-1.3


Brazilian Real Futures:

Brazil Real Futures COT ChartThe Brazilian Real large speculator standing this week resulted in a net position of 49,317 contracts in the data reported through Tuesday. This was a weekly fall of -1,711 contracts from the previous week which had a total of 51,028 net contracts.

This week’s current strength score (the trader positioning range over the past three years, measured from 0 to 100) shows the speculators are currently Bullish with a score of 75.8 percent. The commercials are Bearish with a score of 23.1 percent and the small traders (not shown in chart) are Bearish with a score of 44.5 percent.

Price Trend-Following Model: Uptrend

Our weekly trend-following model classifies the current market price position as: Uptrend.

BRAZIL REAL StatisticsSPECULATORSCOMMERCIALSSMALL TRADERS
– Percent of Open Interest Longs:69.924.55.0
– Percent of Open Interest Shorts:21.577.00.9
– Net Position:49,317-53,5174,200
– Gross Longs:71,25525,0065,124
– Gross Shorts:21,93878,523924
– Long to Short Ratio:3.2 to 10.3 to 15.5 to 1
NET POSITION TREND:
– Strength Index Score (3 Year Range Pct):75.823.144.5
– Strength Index Reading (3 Year Range):BullishBearishBearish
NET POSITION MOVEMENT INDEX:
– 6-Week Change in Strength Index:13.4-13.10.2


Bitcoin Futures:

Bitcoin Crypto Futures COT ChartThe Bitcoin large speculator standing this week resulted in a net position of 1,773 contracts in the data reported through Tuesday. This was a weekly rise of 471 contracts from the previous week which had a total of 1,302 net contracts.

This week’s current strength score (the trader positioning range over the past three years, measured from 0 to 100) shows the speculators are currently Bullish-Extreme with a score of 90.3 percent. The commercials are Bearish-Extreme with a score of 15.2 percent and the small traders (not shown in chart) are Bearish with a score of 41.9 percent.

Price Trend-Following Model: Downtrend

Our weekly trend-following model classifies the current market price position as: Downtrend.

BITCOIN StatisticsSPECULATORSCOMMERCIALSSMALL TRADERS
– Percent of Open Interest Longs:70.31.65.2
– Percent of Open Interest Shorts:62.99.44.9
– Net Position:1,773-1,86289
– Gross Longs:16,7413791,246
– Gross Shorts:14,9682,2411,157
– Long to Short Ratio:1.1 to 10.2 to 11.1 to 1
NET POSITION TREND:
– Strength Index Score (3 Year Range Pct):90.315.241.9
– Strength Index Reading (3 Year Range):Bullish-ExtremeBearish-ExtremeBearish
NET POSITION MOVEMENT INDEX:
– 6-Week Change in Strength Index:16.2-19.96.7


Article By InvestMacroReceive our weekly COT Reports by Email

*COT Report: The COT data, released weekly to the public each Friday, is updated through the most recent Tuesday (data is 3 days old) and shows a quick view of how large speculators or non-commercials (for-profit traders) were positioned in the futures markets.

The CFTC categorizes trader positions according to commercial hedgers (traders who use futures contracts for hedging as part of the business), non-commercials (large traders who speculate to realize trading profits) and nonreportable traders (usually small traders/speculators) as well as their open interest (contracts open in the market at time of reporting).See CFTC criteria here.

All information and opinions on this website and contained in this article are for general informational purposes only and do not constitute investment advice.

GBP/USD Appreciates BoE Pause: Now Focus Shifts to Geopolitics

By Analytical Department RoboForex

GBP/USD rose during the previous session and is now correcting to 1.3403. The pound responded positively to the Bank of England’s decision to keep interest rates unchanged, with market attention focused on the regulator’s guidance on how the Iran conflict might influence future policy.

The Monetary Policy Committee voted unanimously for a pause (9-0), a notable shift from February’s more divided 5-4 alignment. Some members have acknowledged the possibility of future rate hikes. The BoE has adopted a wait-and-see approach amid significant uncertainty.

While the rate pause was widely anticipated, market expectations have shifted markedly. Until recently, rate cuts were priced in, but rising oil prices amid the Iran conflict have increased inflationary risks and tilted sentiment towards a more hawkish policy stance.

The BoE estimates that inflation could accelerate to 3.5% in the coming quarters and highlighted the risk that inflation expectations could become entrenched in the economy. At the same time, signs of an economic slowdown persist, which could restrain price increases, though the primary risk now centres on inflation.

Additional labour market data revealed a slowdown in wage growth to its lowest rate since late 2020. Unemployment remains at 5.2%, with employment showing signs of stabilisation. Under normal circumstances, such data might support softer rhetoric; however, the current geopolitical environment and elevated energy prices have pushed inflation risks to the forefront.

Overall, the BoE’s stance remains cautious. While the rate pause continues, the scope for policy easing is diminishing, limiting the pound’s upside potential.

Technical Analysis

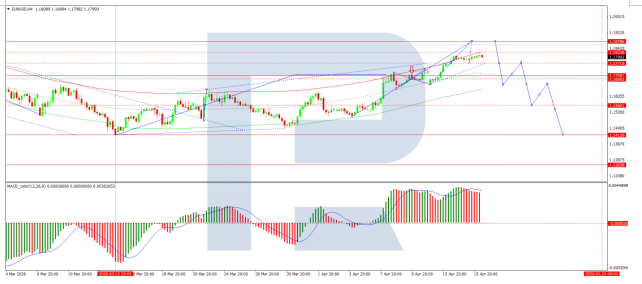
On the H4 GBP/USD chart, the market is forming a broad consolidation range around 1.3354, currently extending up to 1.3467. A decline to 1.3333 is expected in the near term, with a new consolidation range likely to form following this correction. An upside breakout would pave the way for a continuation wave towards 1.3494, while a downside breakout would suggest further movement towards 1.3133. Technically, this scenario is confirmed by the MACD indicator, whose signal line is above zero and pointing firmly upwards.

On the H1 chart, the market has formed a compact consolidation range around 1.3424. A downside breakout has initiated a wave structure extending to 1.3333. Should this level be breached, further downside towards 1.3125 is possible. Conversely, an upside breakout from the range could trigger a growth wave towards 1.3494. Technically, this scenario is confirmed by the Stochastic oscillator, with its signal line below 80 and pointing firmly downwards towards 20.

Conclusion

GBP/USD’s positive reaction to the BoE’s unanimous hold reflects market recognition that rising inflation risks – driven by geopolitical tensions and higher energy prices – are narrowing the path to policy easing. While the Bank’s cautious stance and the unanimous vote provide some support for sterling, the shift from rate-cut expectations to potential rate hikes has recalibrated market sentiment. With geopolitical developments now taking centre stage and technical indicators pointing to further consolidation, sterling’s near-term direction will likely hinge on whether inflation concerns continue to outweigh signs of domestic economic slowdown.


Disclaimer

Any forecasts contained herein are based on the author’s particular opinion. This analysis may not be treated as trading advice. RoboForex bears no responsibility for trading results based on trading recommendations and reviews contained herein.
EUR/USD Awaits Fed Decision

By Analytical Department RoboForex

EUR/USD is consolidating near 1.1532 on Wednesday, with markets adopting a wait-and-see stance ahead of the Federal Reserve’s decision.

The Fed is widely expected to keep rates unchanged. Investor attention will focus on Jerome Powell’s comments, particularly on how oil market volatility may influence the policy outlook.

Rising energy prices are increasing inflation risks, while labour market signals remain mixed and offer little guidance on rates. Markets do not expect policy easing before September or October and are currently pricing in just one rate cut before year-end.

Geopolitical tensions continue to weigh on sentiment. Iran is intensifying attacks on the region’s energy infrastructure, while US allies have not supported Donald Trump’s call to ensure shipping security through the Strait of Hormuz.

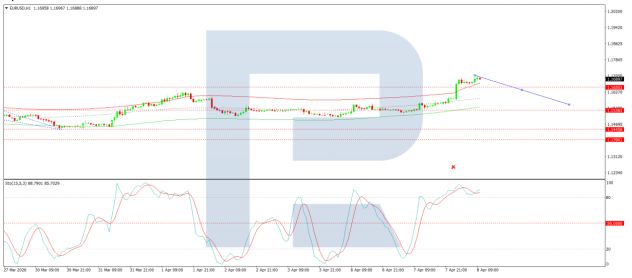
Technical Analysis

On the H4 chart, EUR/USD is forming a consolidation range around 1.1536. A move higher towards 1.1600 is expected as a near-term target, followed by a potential pullback to 1.1539. Technically, the MACD supports this scenario: its signal line remains below zero but is pointing firmly upwards, indicating building bullish momentum.

On the H1 chart, the pair is developing the next upward leg towards 1.1596. After reaching this level, a decline to 1.1530 is expected, followed by a renewed advance towards 1.1650. The Stochastic oscillator confirms this structure, with its signal line above 50 and rising towards 80.

Conclusion

EUR/USD remains in a holding pattern ahead of the Federal Reserve’s decision, with markets awaiting Powell’s assessment of how oil market volatility may shape the policy path. With only one rate cut now priced in before year-end and Middle East tensions showing no signs of easing, the dollar’s near-term direction will depend on whether the Fed signals patience or heightened concern over inflation. Technical indicators point to scope for a short-term rebound, though the broader trend will be determined by the tone of Wednesday’s announcement.


Disclaimer

Any forecasts contained herein are based on the author’s particular opinion. This analysis may not be treated as trading advice. RoboForex bears no responsibility for trading results based on trading recommendations and reviews contained herein.
GBP/USD Pauses Ahead of Bank of England Rate Decision

By Analytical Department RoboForex

GBP/USD is holding near 1.3315 on Tuesday. The pound posted a modest gain the previous day but remains close to three-month lows amid ongoing uncertainty over the impact of the Middle East conflict on the global economy and inflation. Investors continue to favour the US dollar as a key safe-haven asset.

Since the onset of the conflict involving Iran, the dollar has been the primary beneficiary of safe-haven demand, outperforming gold, government bonds, and currencies such as the Swiss franc. Meanwhile, the pound has shown relative resilience compared with several other currencies: over the past three weeks, it has declined by approximately 1.7%, while the yen and euro have lost around 2.0% and 3.0%, respectively. This relative strength is partly due to the UK’s lower dependence on energy imports and its higher interest rate environment.

The key event of the week is the Bank of England’s meeting on Thursday, where the rate is expected to remain unchanged at 3.75%. Markets are currently pricing in just one rate cut before year-end, marking a notable shift from the two cuts anticipated prior to the conflict’s escalation.

Attention will also turn to UK labour market data, which points to a gradual cooling in employment and a slowdown in wage growth. Against this backdrop, with persistent inflationary pressure and rising energy prices, the pound may face further headwinds if macroeconomic conditions continue to deteriorate.

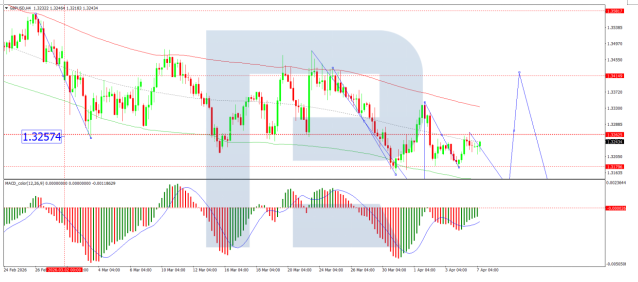
Technical Analysis

On the H4 GBP/USD chart, the market is forming a broad consolidation range around 1.3283, currently extending to 1.3333. A decline to 1.3260 is expected in the near term, after which a new consolidation range is likely to form. An upside breakout would pave the way for a continuation wave towards 1.3360, while a downside breakout would suggest further movement towards 1.3133. Technically, this scenario is confirmed by the MACD indicator, whose signal line is below the zero level and pointing sharply upwards.

On the H1 chart, the market has formed a compact consolidation range around 1.3315. A downside breakout has initiated a wave structure extending to 1.3260. Should this level be breached, further downside towards 1.3125 is likely. Conversely, an upside breakout from the range could trigger a growth wave towards 1.3350. Technically, this scenario is confirmed by the Stochastic oscillator, with its signal line above the 80 level and pointing sharply downwards.

Conclusion

GBP/USD remains in a holding pattern ahead of Thursday’s Bank of England decision, with the pound showing relative resilience compared with other major currencies despite lingering near three-month lows. The dollar continues to dominate as the preferred safe-haven asset amid ongoing Middle East tensions, while shifting rate expectations – from two cuts to just one – reflect the complex inflation dynamics facing policymakers. With UK labour data showing signs of cooling and energy prices remaining elevated, the BoE’s tone on Thursday will be crucial in determining whether sterling can break out of its current consolidation range or extend its recent losses.


Disclaimer

Any forecasts contained herein are based on the author’s particular opinion. This analysis may not be treated as trading advice. RoboForex bears no responsibility for trading results based on trading recommendations and reviews contained herein.
USD/JPY at Highest Since July 2024: Market Awaits BoJ Intervention

By Analytical Department RoboForex

USD/JPY rose to 159.29 on Friday, marking one of the weakest levels for the Japanese yen since July 2024. The yen’s decline is heightening market concerns about possible intervention by authorities in the foreign exchange market.

Bank of Japan Governor Kazuo Ueda warned that a weak yen could exacerbate imported inflation amid rising oil prices. According to him, this may accelerate the BoJ’s transition towards normalising monetary policy.

Ueda also noted that exchange rate fluctuations are now having a more pronounced impact on inflation than in the past, increasing their significance for policy decisions.

Oil prices surged following a pledge by Iran’s new Supreme Leader, Mojtaba Khamenei, to maintain the effective closure of the Strait of Hormuz. Tehran is intensifying attacks on oil and transport infrastructure across the region.

There is no sign of de-escalation in the Middle East conflict. Tough rhetoric from both Tehran and Washington indicates that the confrontation involving Iran remains far from resolution as it enters its second week.

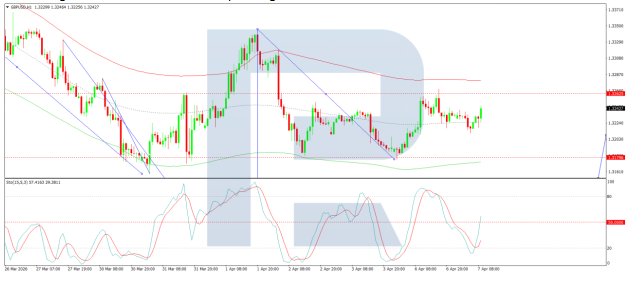
Technical Analysis

On the H4 USD/JPY chart, the market is forming a consolidation range around 159.12, currently extending to 159.60. A decline to test 159.20 from above is expected today, followed by a possible growth wave towards 159.88.

Technically, this scenario is confirmed by the MACD indicator, whose signal line is high above zero and pointing firmly upwards.

On the H1 chart, USD/JPY is forming a growth wave targeting 159.88, with a possible extension to 160.00. Thereafter, a downward correction is likely towards at least 158.55.

Technically, this scenario is supported by the Stochastic oscillator, whose signal line is above 80 and continuing to trend upwards.

Conclusion

USD/JPY has surged to multi-month highs amid a weakening yen, driven by rising oil prices and evolving expectations for BoJ policy. Governor Ueda’s remarks suggest that currency weakness may accelerate the Bank’s policy normalisation, though speculation over intervention continues to grow. With geopolitical tensions in the Middle East showing no signs of easing, and technical indicators pointing to further near-term upside, the pair appears poised to test the psychologically significant 160.00 level. However, verbal warnings from Japanese officials could amplify volatility.


Disclaimer

Any forecasts contained herein are based on the author’s particular opinion. This analysis may not be treated as trading advice. RoboForex bears no responsibility for trading results based on trading recommendations and reviews contained herein.