Archive for Forex and Currency News – Page 7

Large Currency Speculators Drop Euro Bets into Bearish Territory

By InvestMacro 

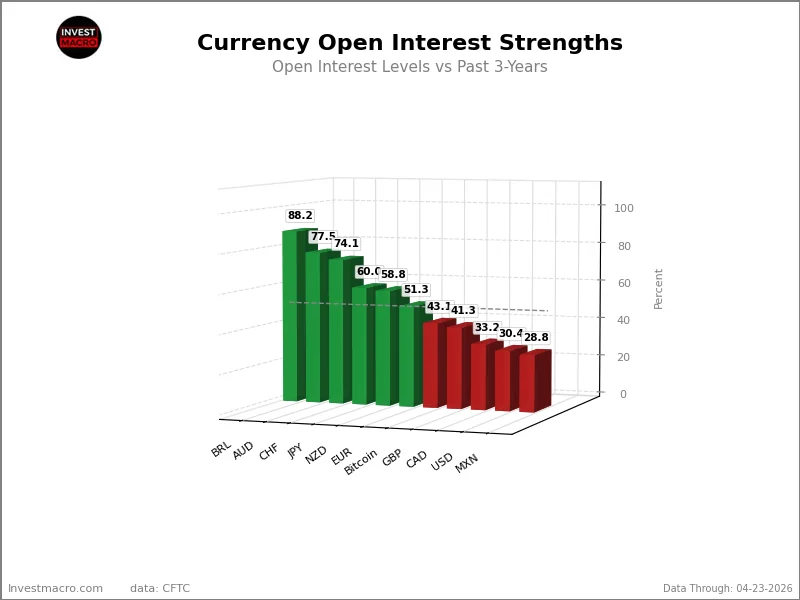
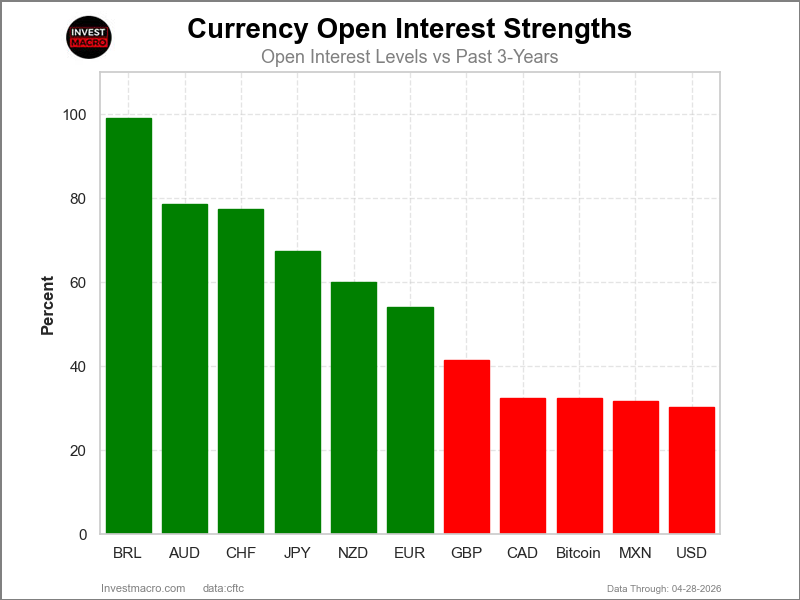
Speculators OI FX Futures COT Chart

Open Interest (OI) is the amount of contracts that are currently live in the marketplace. OI Strength shows the current strength compared to the past 3-years.


Here are the latest charts and statistics for the Commitment of Traders (COT) data published by the Commodities Futures Trading Commission (CFTC).

The latest COT data is updated through Tuesday April 7th and shows a quick view of how large market participants (for-profit speculators and commercial traders) were positioned in the futures markets. All currency positions are in direct relation to the US dollar where, for example, a bet for the euro is a bet that the euro will rise versus the dollar while a bet against the euro will be a bet that the euro will decline versus the dollar.

Weekly Speculator Changes led by Bitcoin & US Dollar Index

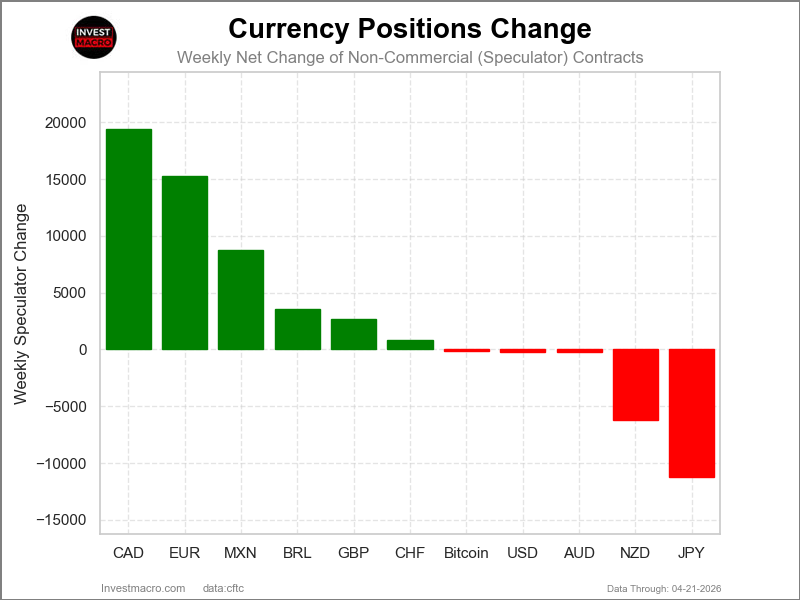
Speculators Nets FX Futures COT Chart
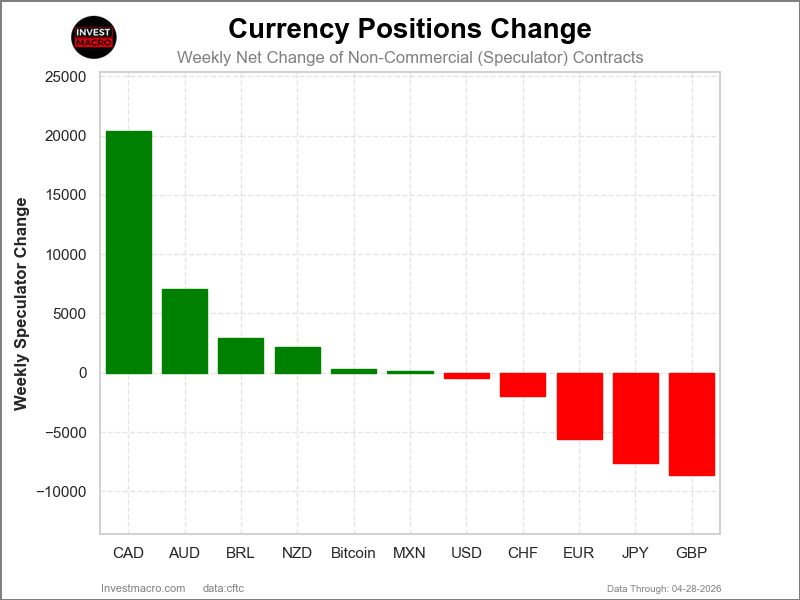
The COT currency market speculator bets were overall decisively lower this week as just two out of the eleven currency markets we cover had higher positioning while the other nine markets had lower speculator contracts.

Leading the gains for the currency markets was the US Dollar Index (1,830 contracts) with Bitcoin (287 contracts) also showing a positive week.

The currencies seeing declines in speculator bets on the week were the Canadian Dollar (-22,964 contracts), the Japanese Yen (-20,870 contracts), the Brazilian Real (-12,616 contracts), the Australian Dollar (-10,693 contracts), the EuroFX (-8,048 contracts), the New Zealand Dollar (-7,487 contracts), the British Pound (-3,689 contracts), the Swiss Franc (-823 contracts), and  with the Mexican Peso (-213 contracts) also registering lower bets on the week.

Large Currency Speculators Drop Euro Bets fall into Bearish Territory

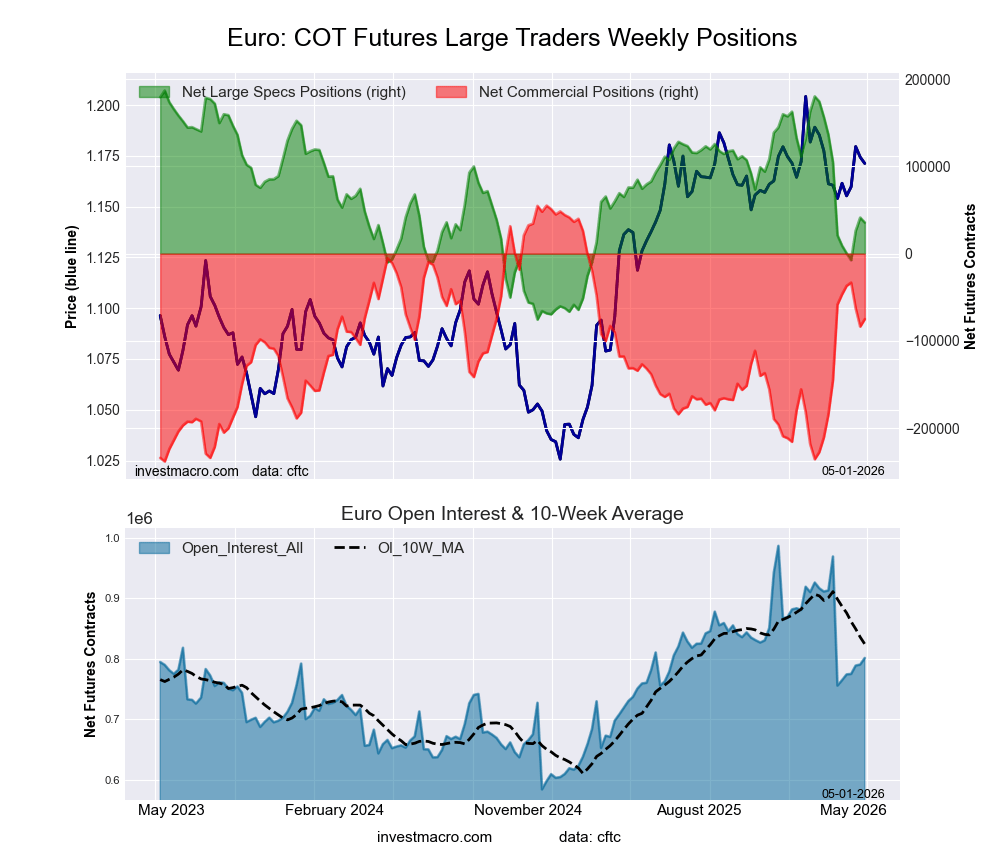
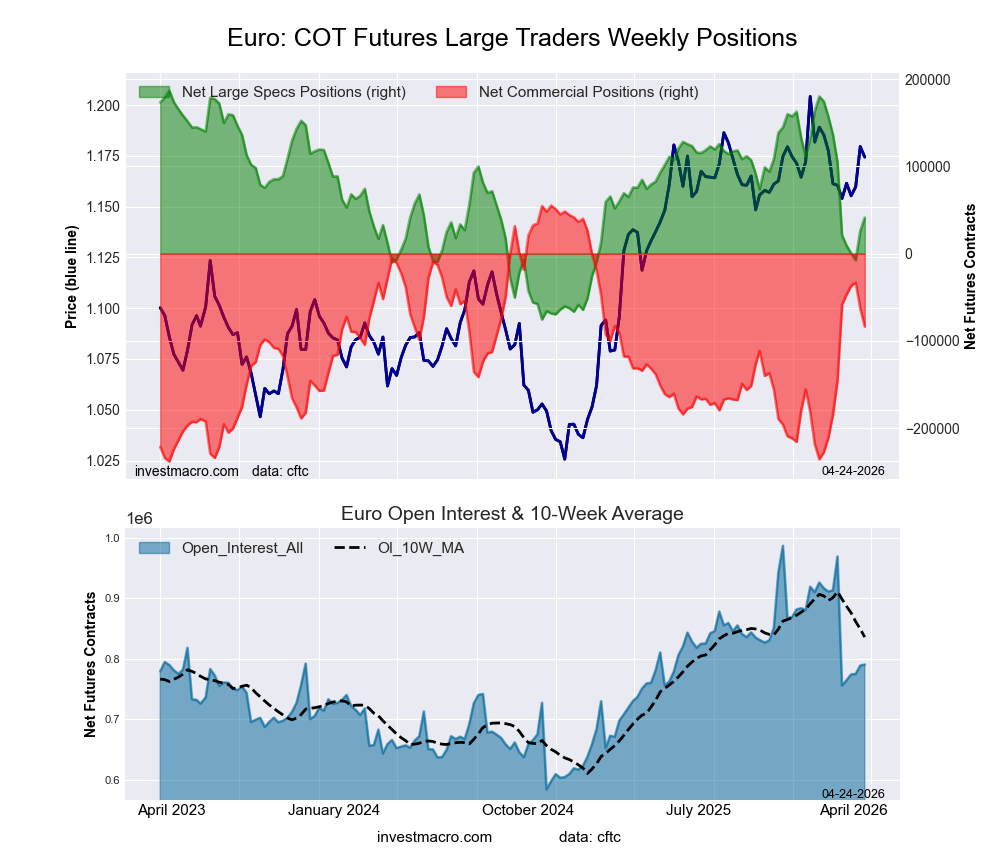
Highlighting the Currencies speculator positioning this week was the weakness in the Euro speculator positions. Euro bets fell this week by -8,048 contracts and this was the eighth consecutive week that the Euro speculator positions declined. This has been a swift turnaround for the Euro, coming from a strong bullish position into a new negative bearish level. The speculator bets were as high as +180,305 contracts on February 10th and have fallen all the way to this week’s new negative position of -7,541 contracts. This is an eight-week total decline by -187,846 net positions and marks the first bearish position in the Euro speculator positions since March 4, 2025, a span of 57 weeks.

The Euro sentiment has sold off sharply, but in the Foreign Exchange markets, the Euro price has not fared too badly and closed this week at 1.1766. Euro positions have now been in a range dating back to June 2025 between 1.1500 on the downside to a topside resistance level of 1.1935 approximately. We’ve not seen a clear break of these two levels since June.

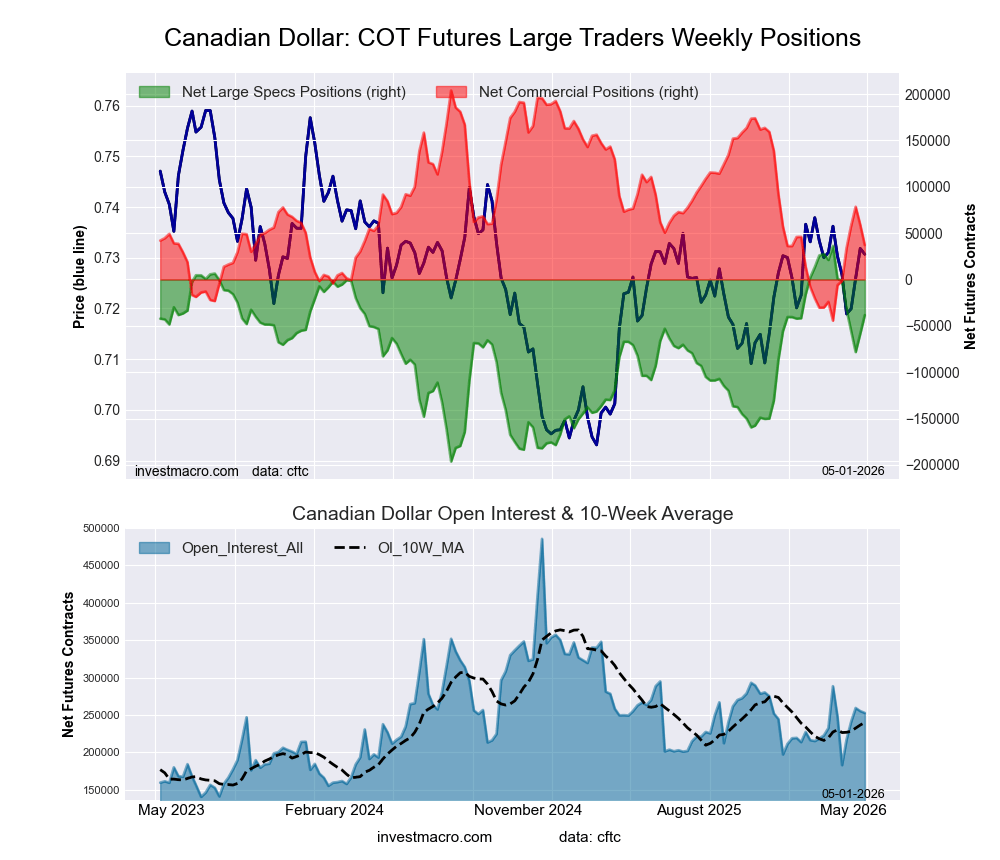
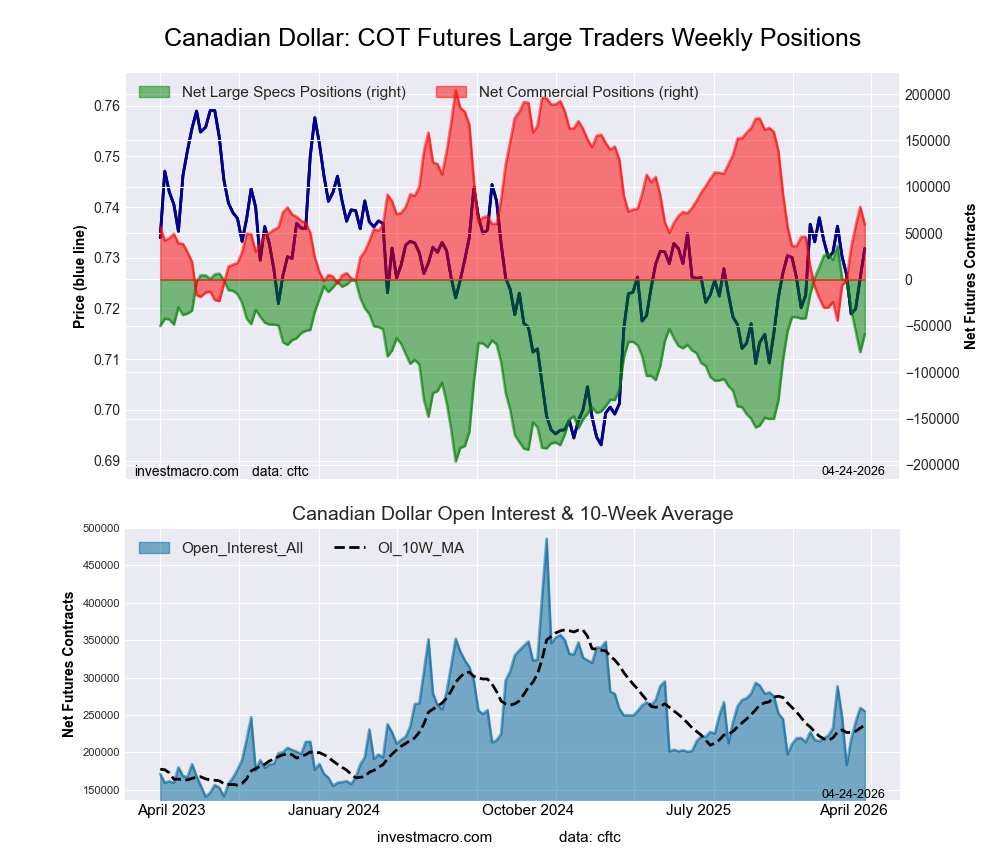
The Canadian Dollar also saw speculator weakness again this week and fell by over -22,000 contracts. This is the fourth week of bearish contracts for the Canadian Dollar positioning and has now pushed the overall net position to -55,648 net contracts, which marks the most bearish position since December 23rd. Canadian Dollar contracts had seen an overall bullish level from February 3rd until March 17th of this year before retreating back into bearish territory. In the Foreign Exchange markets, the Canadian Dollar rebounded this week after falling for four consecutive weeks and closed out the week at the exchange rate (against the US Dollar) of 0.7252. The Canadian Dollar is currently under its 200-week moving average and is trading in an ascending triangle pattern with a topside resistance of around 0.7400 while support underneath can be found at 0.7200.

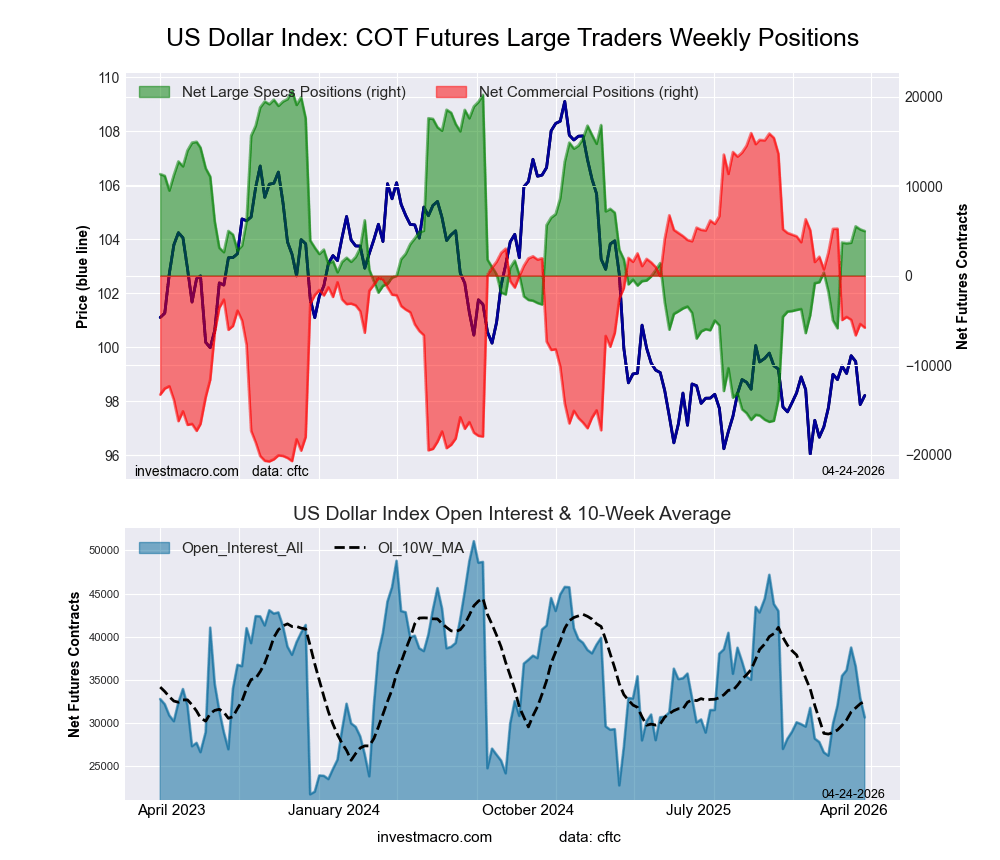
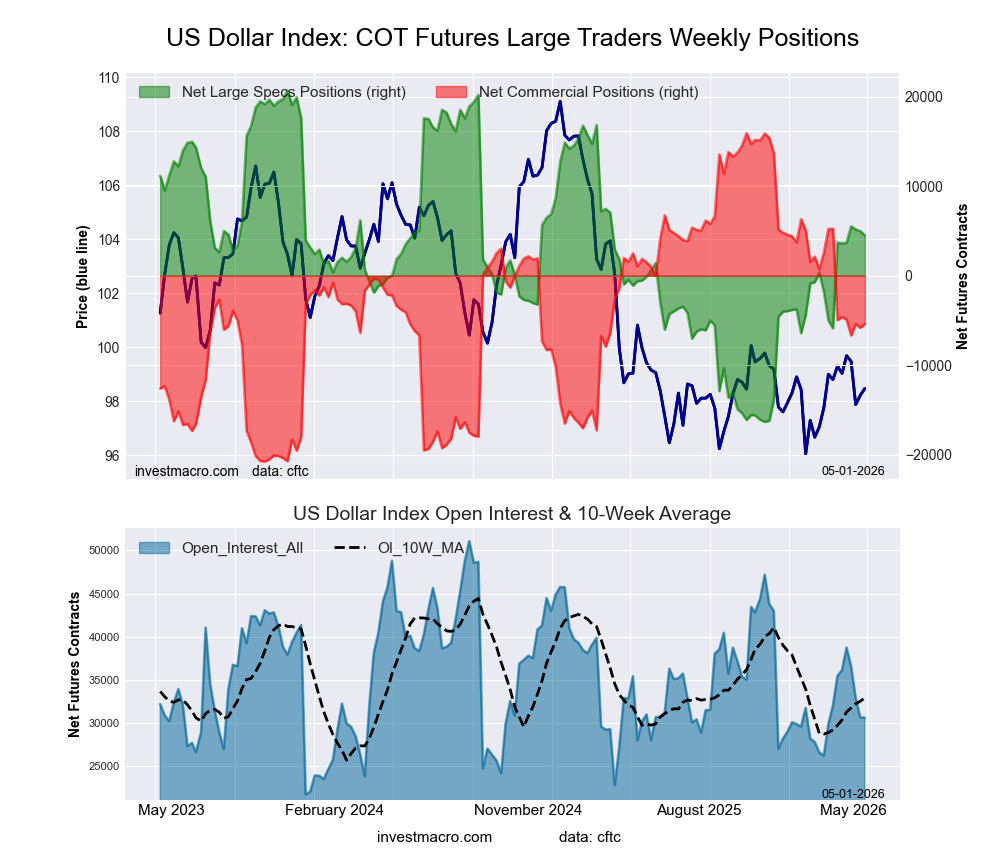
The US Dollar Index saw a gain in bullish positions this week for a second consecutive week and for the third time out of the past four weeks. The US Dollar Index has now been in an overall bullish level for the fourth consecutive week and has gone from a position of -5,882 contracts on March 10 to this week’s net position of 5,511 net contracts, which is a change of +11,393 contracts in just the past four weeks. The US Dollar Index pricing, however, has continued to be stuck in a range from 98.00 on the low side to 100.00 on the upside. The DXY has been in this range for the past six weeks, oscillating between the higher side and the lower side, and this week closed out at 98.44.

Bitcoin and the Mexican Peso lead Currency prices this week

In the Currency Markets, Bitcoin, although a cryptocurrency, rose by 6.20% for the week. The Mexican Peso was up by 3.27% over the past five days. Next up, the Brazilian Real advanced by 2.94% on the week, followed by the Australian Dollar and the New Zealand Dollar, which rose by 2.78% and 2.75%, respectively. The British Pound was up by 2.14%, while the Euro also saw a boost of 1.90%. The Swiss Franc advanced higher by 1.54% and was followed by the Canadian Dollar, which saw an increase of 0.77%. The Japanese Yen rounded out the gainers with a 0.30% uptick.

The only market that saw a decline on the week was the US Dollar Index, which fell by -1.54%.


Currencies Data:

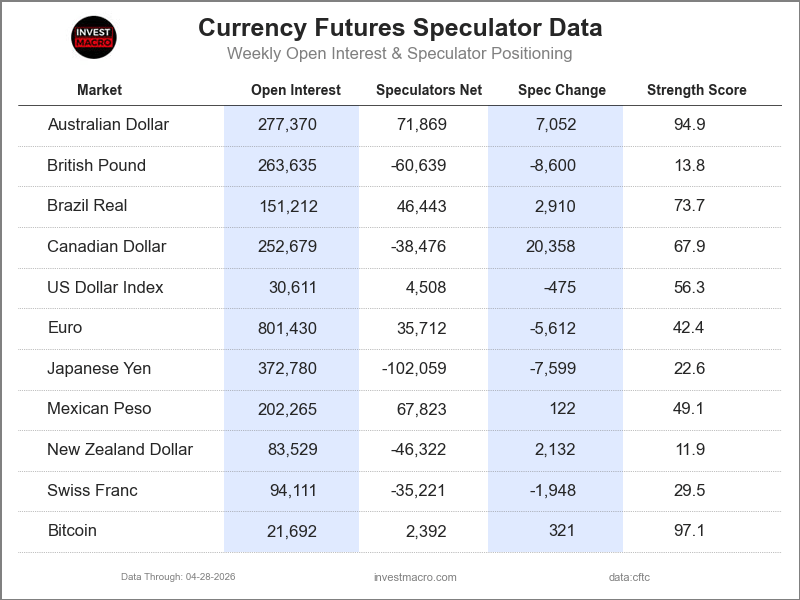
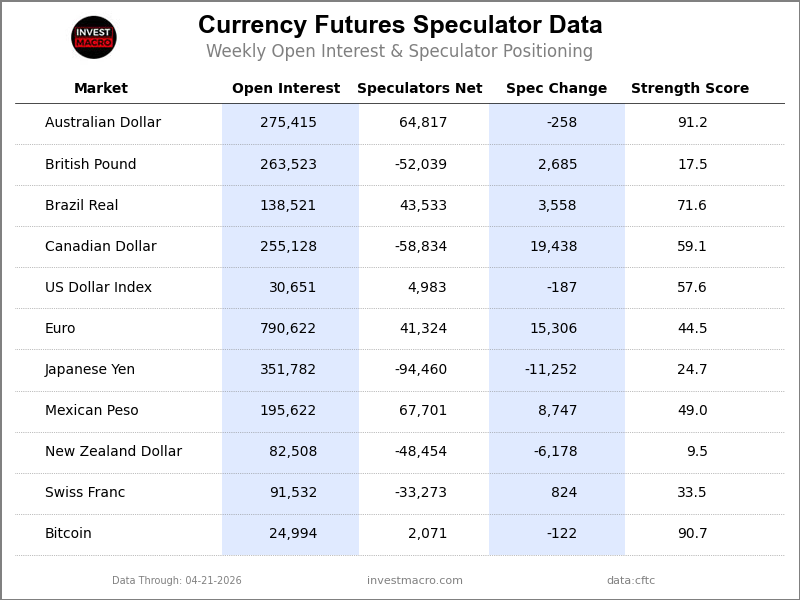
Speculators FX Futures COT Data Table
Legend: Open Interest | Speculators Current Net Position | Weekly Specs Change | Specs Strength Score compared to last 3-Years (0-100 range)


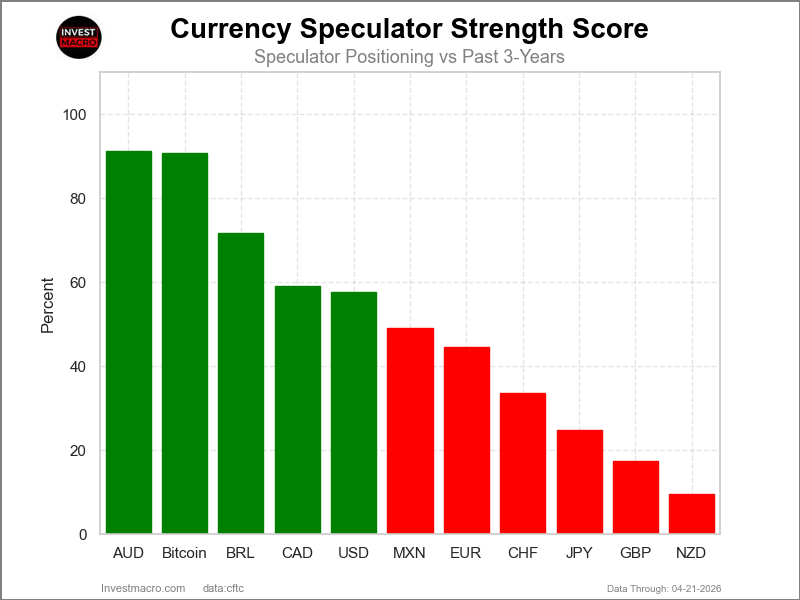
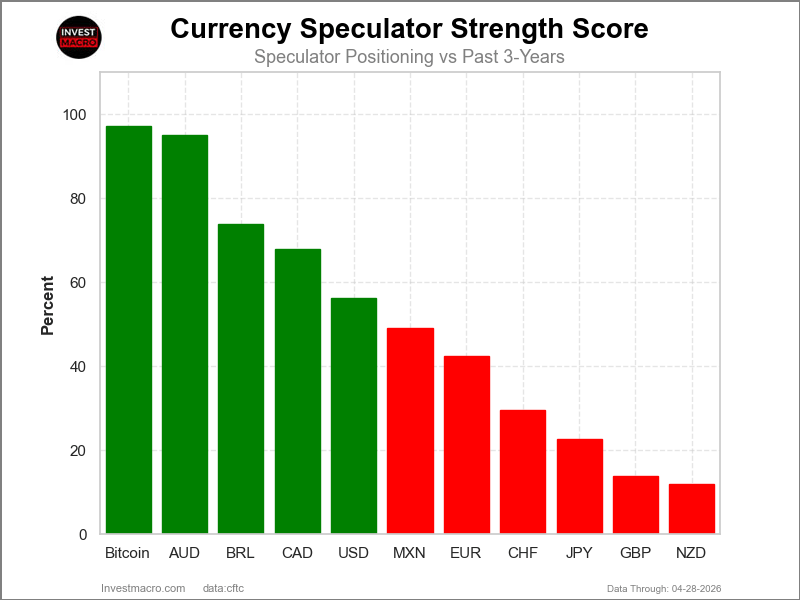
Strength Scores led by Bitcoin & Australian Dollar
Speculators Strength Scores FX Futures COT Chart
COT Strength Scores (a normalized measure of Speculator positions over a 3-Year range, from 0 to 100 where above 80 is Extreme-Bullish and below 20 is Extreme-Bearish) showed that the Bitcoin (100 percent) and the Australian Dollar (94 percent) lead the currency markets this week. The Brazilian Real (69 percent), Canadian Dollar (60 percent) and the US Dollar Index (59 percent) come in as the next highest in the weekly strength scores.

On the downside, the British Pound (16 percent) comes in at the lowest strength levels currently and are in Extreme-Bearish territory (below 20 percent). The next lowest strength scores are the New Zealand Dollar (24 percent), the Japanese Yen (25 percent) and the EuroFX (26 percent).

3-Year Strength Statistics:
US Dollar Index (59.0 percent) vs US Dollar Index previous week (54.1 percent)
EuroFX (25.9 percent) vs EuroFX previous week (29.0 percent)
British Pound Sterling (15.7 percent) vs British Pound Sterling previous week (17.2 percent)
Japanese Yen (24.9 percent) vs Japanese Yen previous week (30.6 percent)
Swiss Franc (38.7 percent) vs Swiss Franc previous week (40.4 percent)
Canadian Dollar (60.5 percent) vs Canadian Dollar previous week (70.4 percent)
Australian Dollar (94.3 percent) vs Australian Dollar previous week (100.0 percent)
New Zealand Dollar (23.7 percent) vs New Zealand Dollar previous week (32.2 percent)
Mexican Peso (41.8 percent) vs Mexican Peso previous week (41.9 percent)
Brazilian Real (69.1 percent) vs Brazilian Real previous week (78.3 percent)
Bitcoin (100.0 percent) vs Bitcoin previous week (94.3 percent)


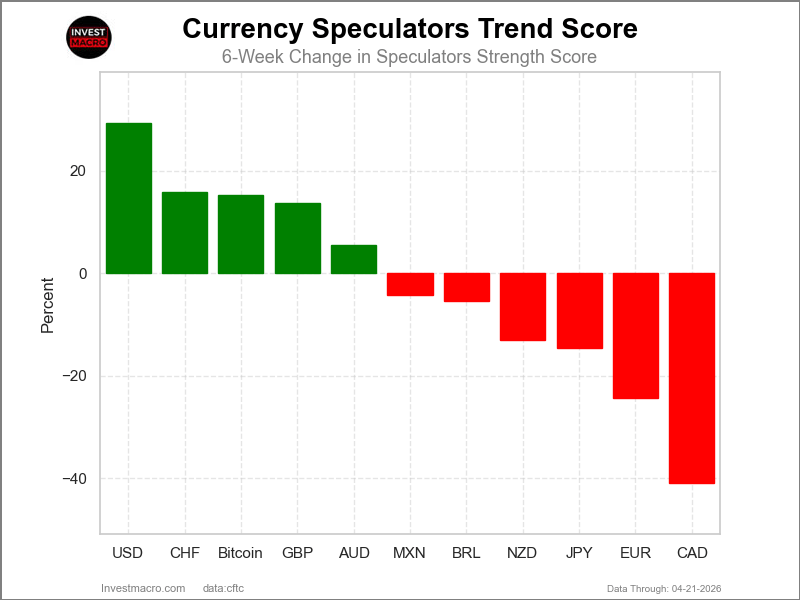
Bitcoin & Swiss Franc top the 6-Week Strength Trends

Speculators Trends FX Futures COT Chart
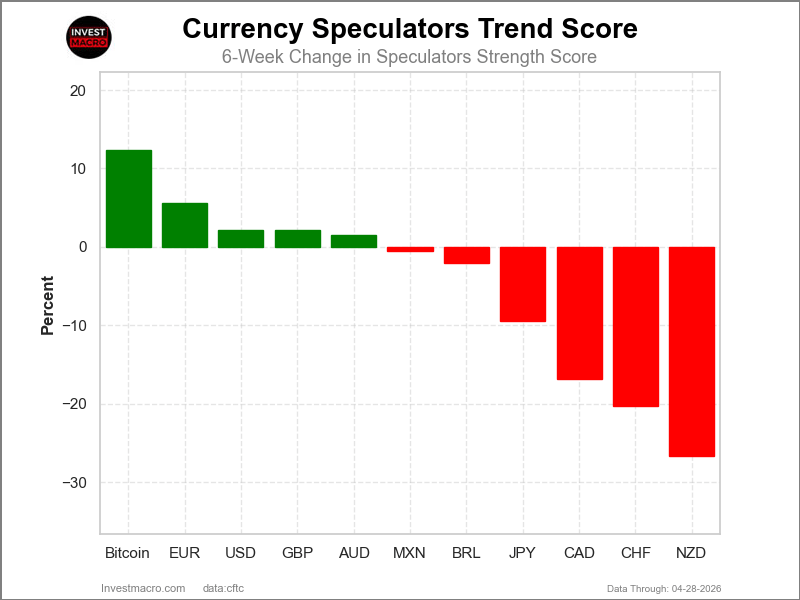
COT Strength Score Trends (or move index, calculates the 6-week changes in strength scores) showed that the Bitcoin (27 percent) and the Swiss Franc (21 percent) lead the past six weeks trends for the currencies. The US Dollar Index (20 percent), the Australian Dollar (10 percent) and the Brazilian Real (2 percent) are the next highest positive movers in the 3-Year trends data.

The EuroFX (-63 percent) leads the downside trend scores currently with the Canadian Dollar (-36 percent), Japanese Yen (-29 percent) and the Mexican Peso (-18 percent) following next with lower trend scores.

3-Year Strength Trends:
US Dollar Index (19.7 percent) vs US Dollar Index previous week (9.1 percent)
EuroFX (-62.6 percent) vs EuroFX previous week (-66.2 percent)
British Pound Sterling (0.3 percent) vs British Pound Sterling previous week (-4.4 percent)
Japanese Yen (-29.0 percent) vs Japanese Yen previous week (-23.6 percent)
Swiss Franc (21.3 percent) vs Swiss Franc previous week (22.3 percent)
Canadian Dollar (-35.8 percent) vs Canadian Dollar previous week (-25.2 percent)
Australian Dollar (9.6 percent) vs Australian Dollar previous week (18.8 percent)
New Zealand Dollar (-7.4 percent) vs New Zealand Dollar previous week (7.3 percent)
Mexican Peso (-18.0 percent) vs Mexican Peso previous week (-18.7 percent)
Brazilian Real (2.5 percent) vs Brazilian Real previous week (13.1 percent)
Bitcoin (27.2 percent) vs Bitcoin previous week (12.2 percent)


Individual COT Forex Markets:

US Dollar Index Futures:
US Dollar Index Forex Futures COT ChartPositioning Notes:

  • US Dollar Index large speculator standing this week totaled a net position of 5,511 contracts in the data reported through Tuesday.
  • Weekly Speculator position increase of 1,830 contracts from the previous week which had a total of 3,681 net contracts.
  • This week’s current strength score (range over the past 3 years, measured from 0 to 100) shows the speculators are currently Bullish with a score of 59.0 percent.
  • The Commercials are Bearish with a score of 38.4 percent.
  • The Small Traders (not shown in chart) are Bullish with a score of 59.3 percent.

Price Trend-Following Model: Weak Uptrend

Our weekly trend-following model classifies the current market price position as: Weak Uptrend.

US DOLLAR INDEX StatisticsSPECULATORSCOMMERCIALSSMALL TRADERS
– Percent of Open Interest Longs:63.121.79.6
– Percent of Open Interest Shorts:48.039.96.4
– Net Position:5,511-6,6751,164
– Gross Longs:23,0847,9263,501
– Gross Shorts:17,57314,6012,337
– Long to Short Ratio:1.3 to 10.5 to 11.5 to 1
NET POSITION TREND:
– Strength Index Score (3 Year Range Pct):59.038.459.3
– Strength Index Reading (3 Year Range):BullishBearishBullish
NET POSITION MOVEMENT INDEX:
– 6-Week Change in Strength Index:19.7-25.234.2


Euro Currency Futures:

Euro Currency Futures COT ChartPositioning Notes:

  • Euro Currency large speculator standing this week totaled a net position of -7,541 contracts in the data reported through Tuesday.
  • Weekly Speculator position lowering of -8,048 contracts from the previous week which had a total of 507 net contracts.
  • This week’s current strength score (range over the past 3 years, measured from 0 to 100) shows the speculators are currently Bearish with a score of 25.9 percent.
  • The Commercials are Bullish with a score of 69.9 percent.
  • The Small Traders (not shown in chart) are Bullish with a score of 60.4 percent.

Price Trend-Following Model: Weak Downtrend

Our weekly trend-following model classifies the current market price position as: Weak Downtrend.

EURO Currency StatisticsSPECULATORSCOMMERCIALSSMALL TRADERS
– Percent of Open Interest Longs:25.960.011.0
– Percent of Open Interest Shorts:26.964.25.7
– Net Position:-7,541-33,15040,691
– Gross Longs:200,946464,74685,038
– Gross Shorts:208,487497,89644,347
– Long to Short Ratio:1.0 to 10.9 to 11.9 to 1
NET POSITION TREND:
– Strength Index Score (3 Year Range Pct):25.969.960.4
– Strength Index Reading (3 Year Range):BearishBullishBullish
NET POSITION MOVEMENT INDEX:
– 6-Week Change in Strength Index:-62.660.6-28.2


British Pound Sterling Futures:

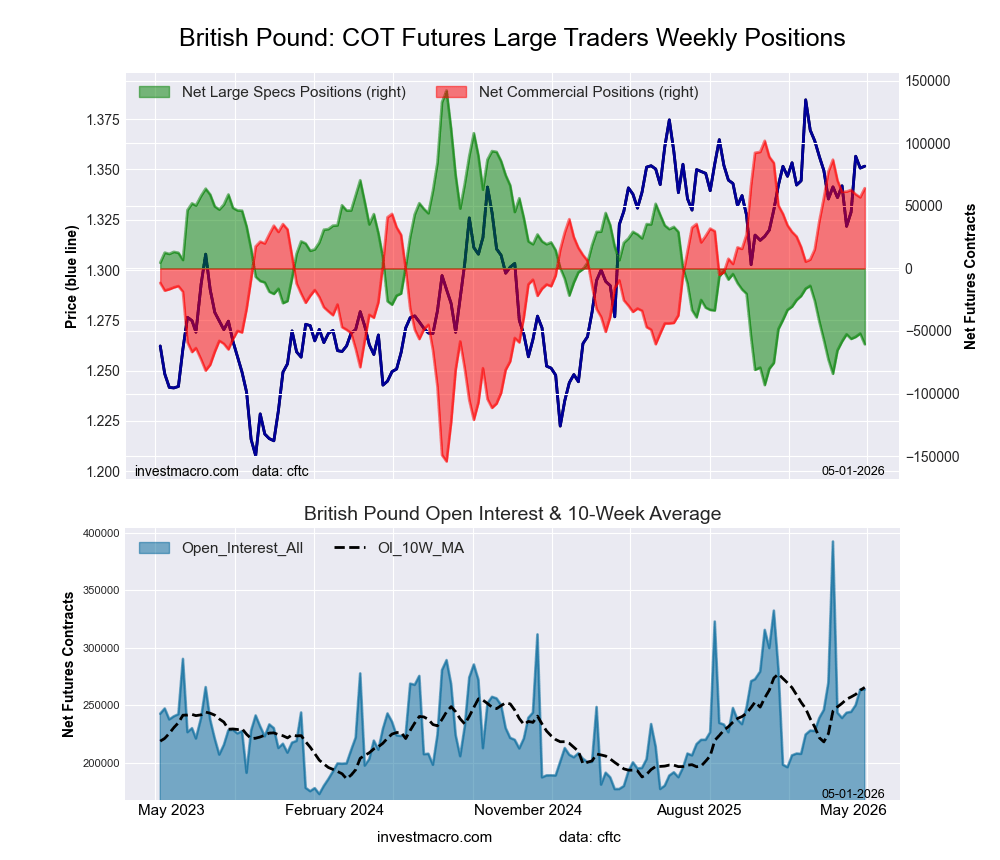
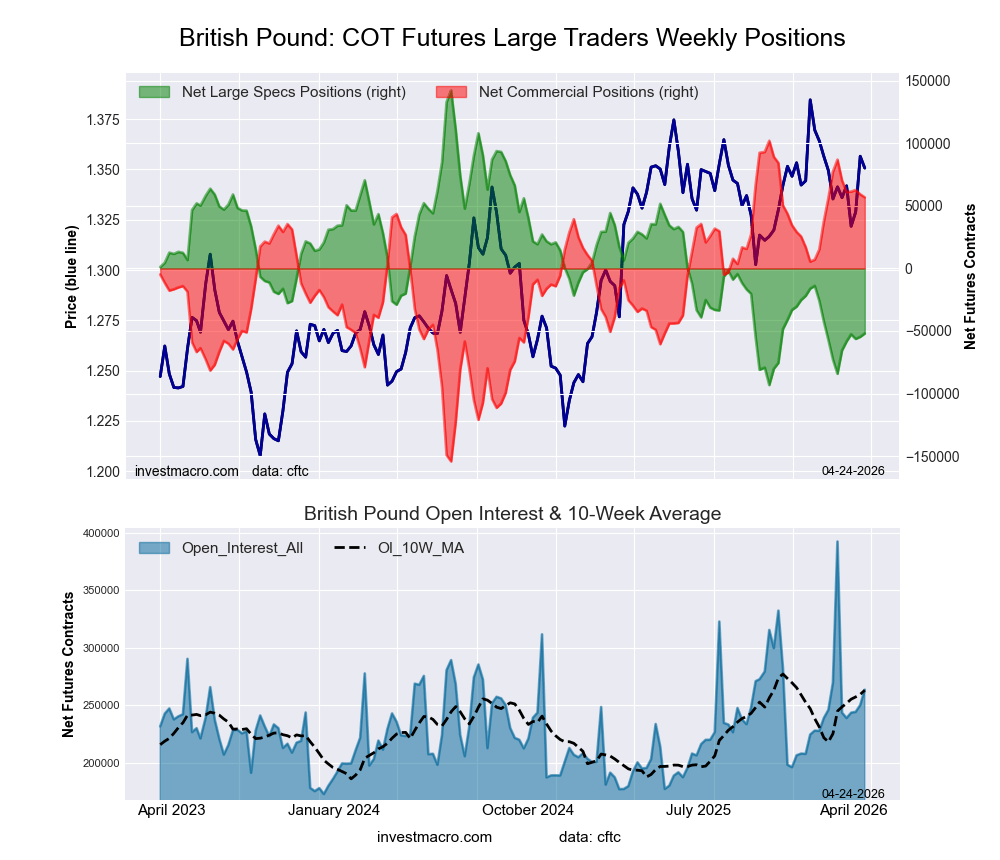
British Pound Sterling Futures COT ChartPositioning Notes:

  • British Pound Sterling large speculator standing this week totaled a net position of -56,354 contracts in the data reported through Tuesday.
  • Weekly Speculator position reduction of -3,689 contracts from the previous week which had a total of -52,665 net contracts.
  • This week’s current strength score (range over the past 3 years, measured from 0 to 100) shows the speculators are currently Bearish-Extreme with a score of 15.7 percent.
  • The Commercials are Bullish-Extreme with a score of 84.7 percent.
  • The Small Traders (not shown in chart) are Bearish with a score of 36.8 percent.

Price Trend-Following Model: Weak Downtrend

Our weekly trend-following model classifies the current market price position as: Weak Downtrend.

BRITISH POUND StatisticsSPECULATORSCOMMERCIALSSMALL TRADERS
– Percent of Open Interest Longs:19.470.59.2
– Percent of Open Interest Shorts:42.544.911.8
– Net Position:-56,35462,698-6,344
– Gross Longs:47,344172,23322,515
– Gross Shorts:103,698109,53528,859
– Long to Short Ratio:0.5 to 11.6 to 10.8 to 1
NET POSITION TREND:
– Strength Index Score (3 Year Range Pct):15.784.736.8
– Strength Index Reading (3 Year Range):Bearish-ExtremeBullish-ExtremeBearish
NET POSITION MOVEMENT INDEX:
– 6-Week Change in Strength Index:0.32.5-18.8


Japanese Yen Futures:

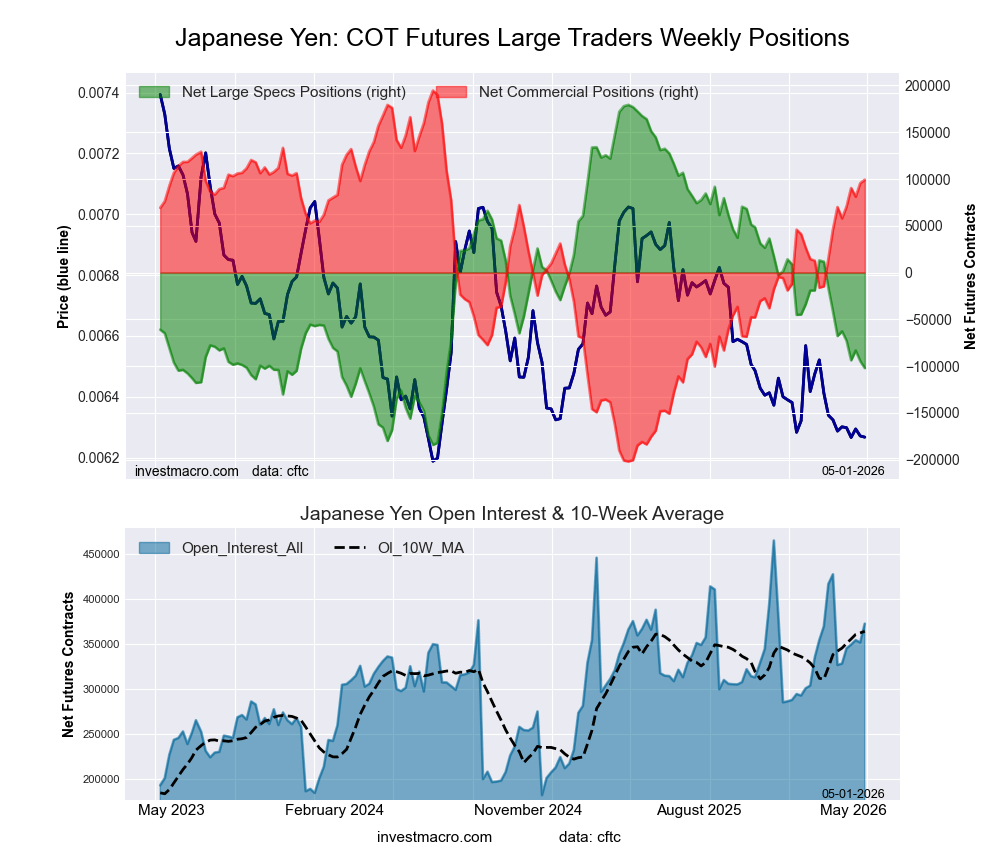
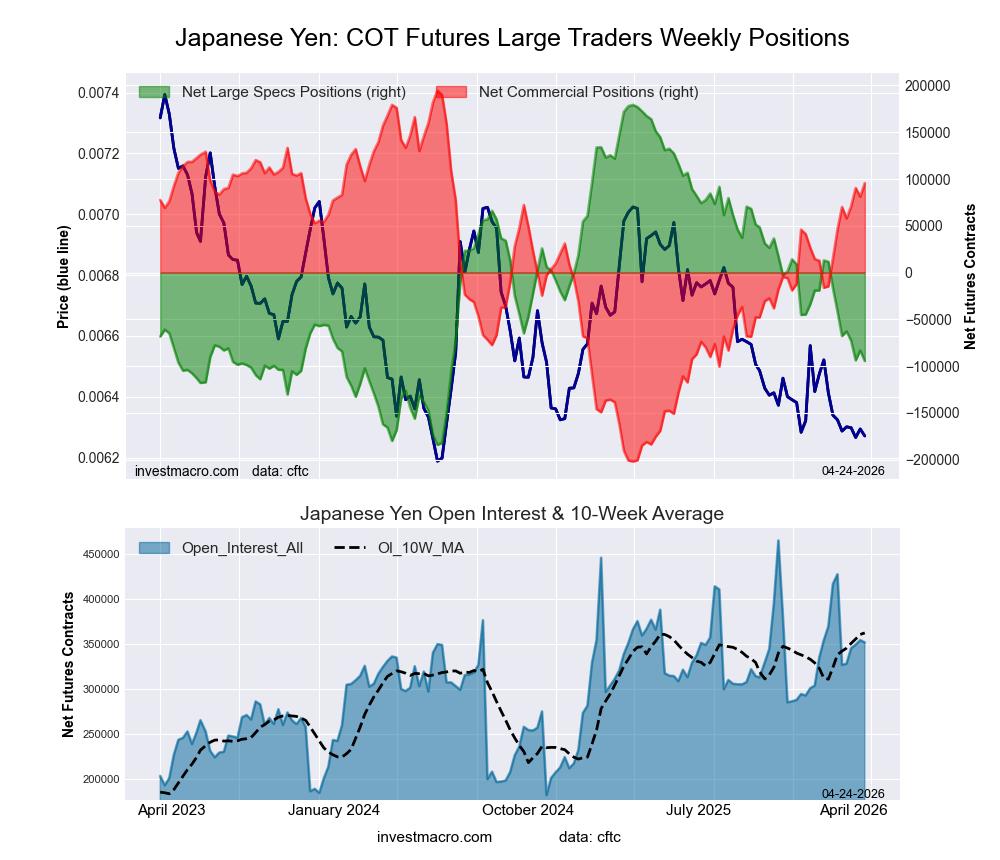
Japanese Yen Forex Futures COT ChartPositioning Notes:

  • Japanese Yen large speculator standing this week totaled a net position of -93,742 contracts in the data reported through Tuesday.
  • Weekly Speculator position decline of -20,870 contracts from the previous week which had a total of -72,872 net contracts.
  • This week’s current strength score (range over the past 3 years, measured from 0 to 100) shows the speculators are currently Bearish with a score of 24.9 percent.
  • The Commercials are Bullish with a score of 73.7 percent.
  • The Small Traders (not shown in chart) are Bearish with a score of 45.4 percent.

Price Trend-Following Model: Strong Downtrend

Our weekly trend-following model classifies the current market price position as: Strong Downtrend.

JAPANESE YEN StatisticsSPECULATORSCOMMERCIALSSMALL TRADERS
– Percent of Open Interest Longs:26.255.012.1
– Percent of Open Interest Shorts:53.029.111.1
– Net Position:-93,74290,3963,346
– Gross Longs:91,560192,10342,118
– Gross Shorts:185,302101,70738,772
– Long to Short Ratio:0.5 to 11.9 to 11.1 to 1
NET POSITION TREND:
– Strength Index Score (3 Year Range Pct):24.973.745.4
– Strength Index Reading (3 Year Range):BearishBullishBearish
NET POSITION MOVEMENT INDEX:
– 6-Week Change in Strength Index:-29.026.50.4


Swiss Franc Futures:

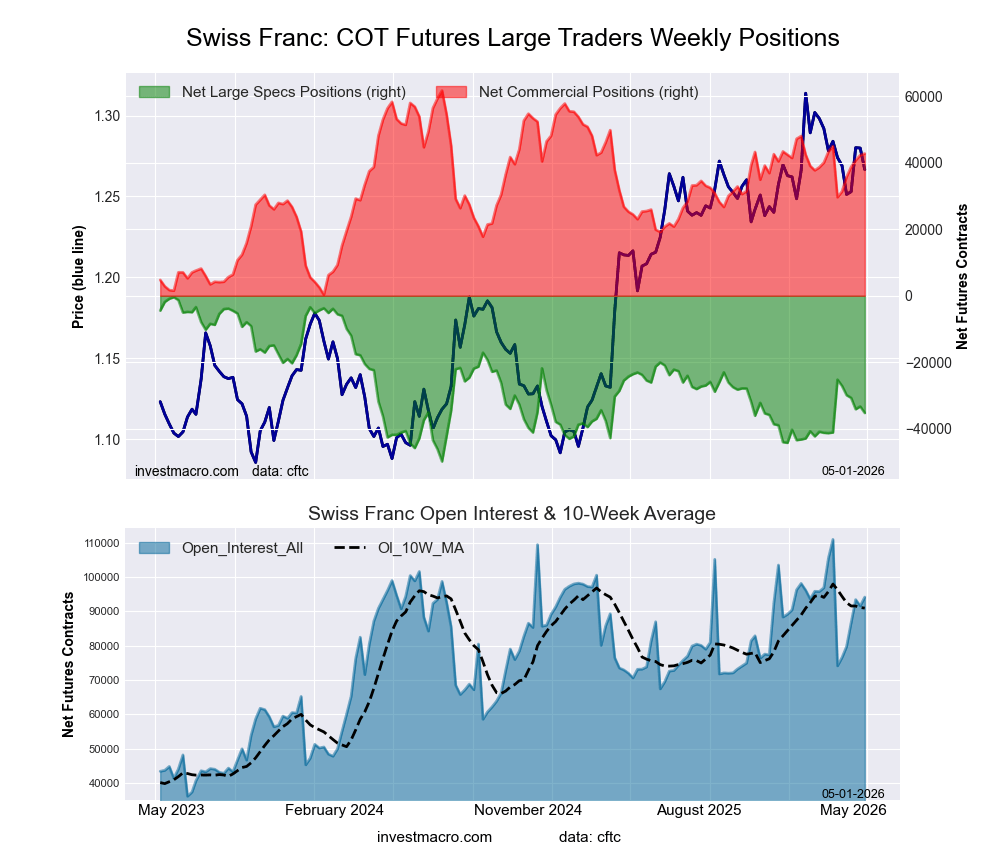
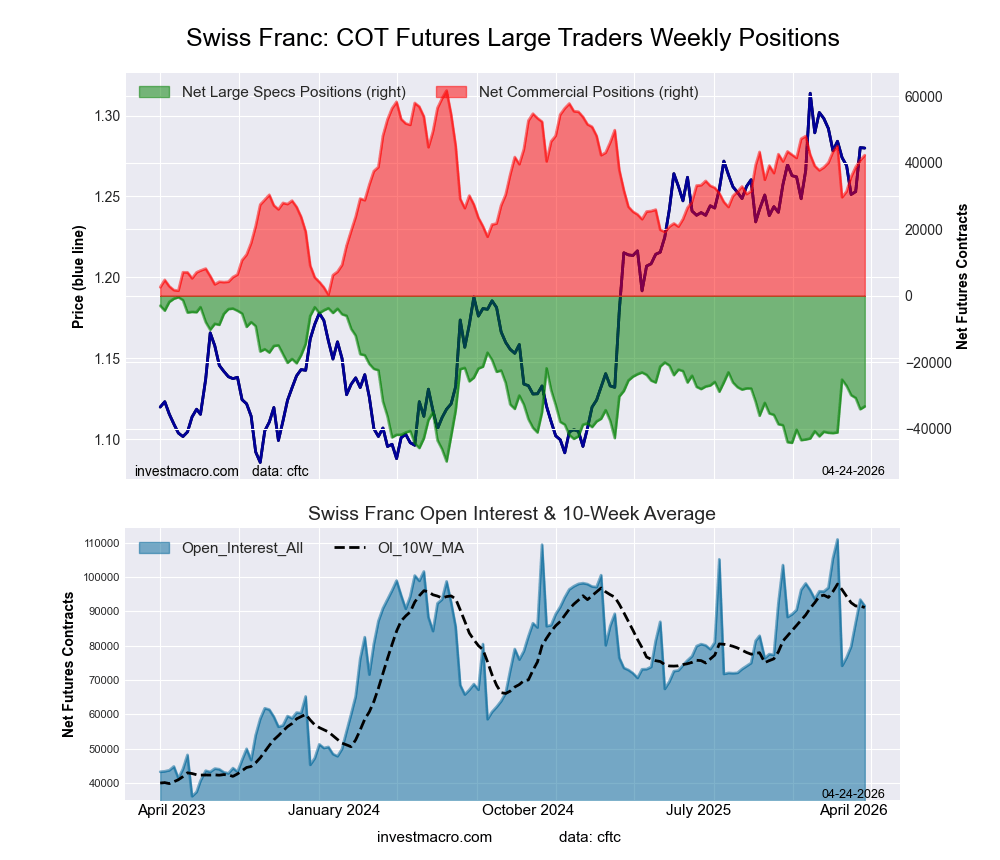
Swiss Franc Forex Futures COT ChartPositioning Notes:

  • Swiss Franc large speculator standing this week totaled a net position of -30,694 contracts in the data reported through Tuesday.
  • Weekly Speculator position lowering of -823 contracts from the previous week which had a total of -29,871 net contracts.
  • This week’s current strength score (range over the past 3 years, measured from 0 to 100) shows the speculators are currently Bearish with a score of 38.7 percent.
  • The Commercials are Bullish with a score of 62.6 percent.
  • The Small Traders (not shown in chart) are Bearish with a score of 44.9 percent.

Price Trend-Following Model: Weak Uptrend

Our weekly trend-following model classifies the current market price position as: Weak Uptrend.

SWISS FRANC StatisticsSPECULATORSCOMMERCIALSSMALL TRADERS
– Percent of Open Interest Longs:12.274.313.2
– Percent of Open Interest Shorts:47.629.622.5
– Net Position:-30,69438,686-7,992
– Gross Longs:10,58664,34611,477
– Gross Shorts:41,28025,66019,469
– Long to Short Ratio:0.3 to 12.5 to 10.6 to 1
NET POSITION TREND:
– Strength Index Score (3 Year Range Pct):38.762.644.9
– Strength Index Reading (3 Year Range):BearishBullishBearish
NET POSITION MOVEMENT INDEX:
– 6-Week Change in Strength Index:21.3-2.2-38.9


Canadian Dollar Futures:

Canadian Dollar Forex Futures COT ChartPositioning Notes:

  • Canadian Dollar large speculator standing this week totaled a net position of -55,648 contracts in the data reported through Tuesday.
  • Weekly Speculator position lowering of -22,964 contracts from the previous week which had a total of -32,684 net contracts.
  • This week’s current strength score (range over the past 3 years, measured from 0 to 100) shows the speculators are currently Bullish with a score of 60.5 percent.
  • The Commercials are Bearish with a score of 41.3 percent.
  • The Small Traders (not shown in chart) are Bearish with a score of 38.7 percent.

Price Trend-Following Model: Weak Uptrend

Our weekly trend-following model classifies the current market price position as: Weak Uptrend.

CANADIAN DOLLAR StatisticsSPECULATORSCOMMERCIALSSMALL TRADERS
– Percent of Open Interest Longs:25.258.212.9
– Percent of Open Interest Shorts:48.334.013.9
– Net Position:-55,64858,038-2,390
– Gross Longs:60,714139,98831,055
– Gross Shorts:116,36281,95033,445
– Long to Short Ratio:0.5 to 11.7 to 10.9 to 1
NET POSITION TREND:
– Strength Index Score (3 Year Range Pct):60.541.338.7
– Strength Index Reading (3 Year Range):BullishBearishBearish
NET POSITION MOVEMENT INDEX:
– 6-Week Change in Strength Index:-35.835.6-14.2


Australian Dollar Futures:

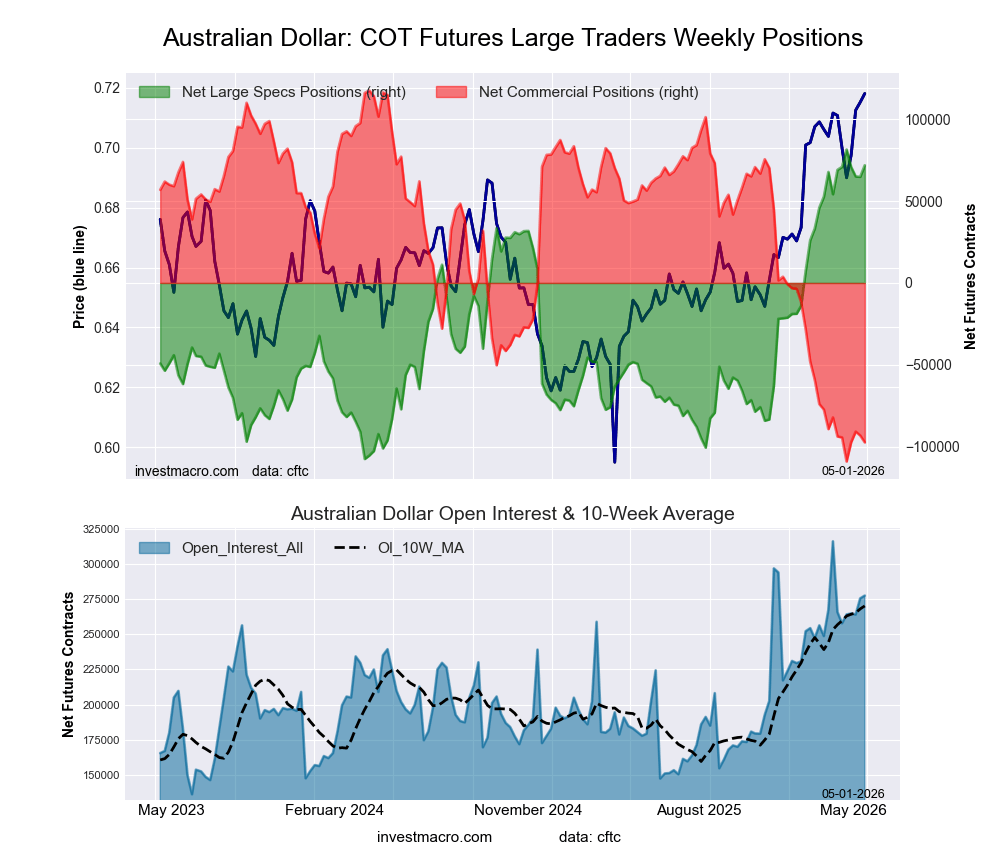
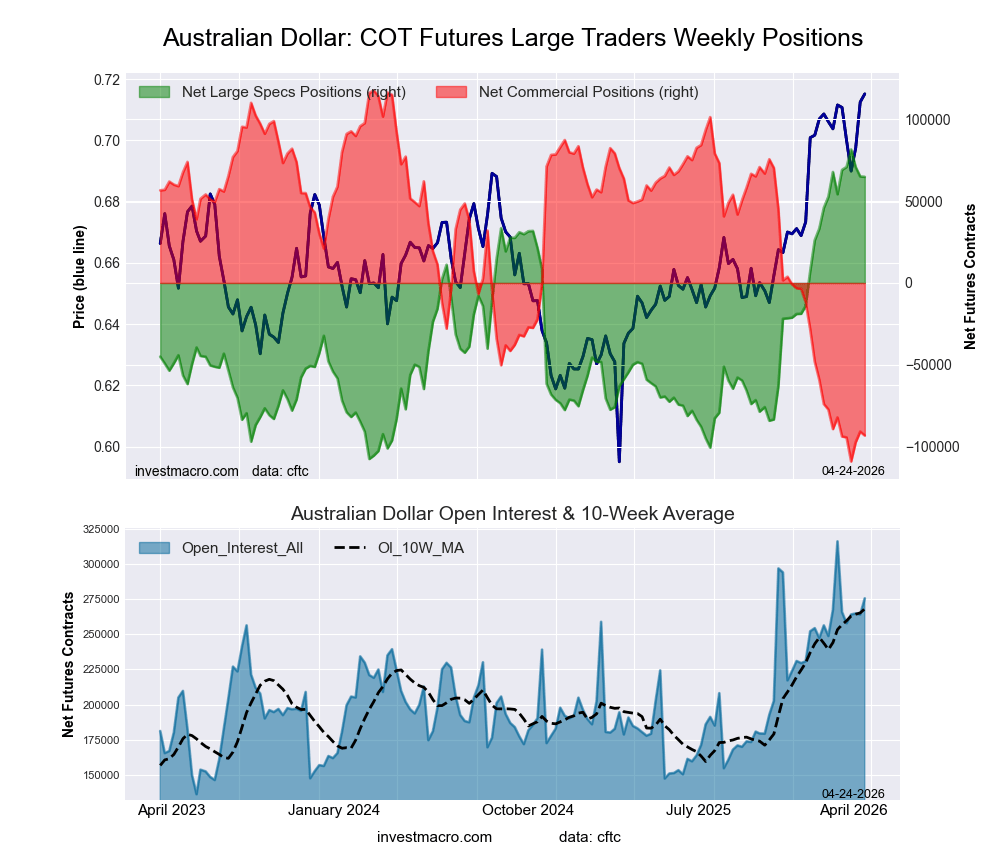
Australian Dollar Forex Futures COT ChartPositioning Notes:

  • Australian Dollar large speculator standing this week totaled a net position of 70,813 contracts in the data reported through Tuesday.
  • Weekly Speculator position reduction of -10,693 contracts from the previous week which had a total of 81,506 net contracts.
  • This week’s current strength score (range over the past 3 years, measured from 0 to 100) shows the speculators are currently Bullish-Extreme with a score of 94.3 percent.
  • The Commercials are Bearish-Extreme with a score of 5.2 percent.
  • The Small Traders (not shown in chart) are Bullish-Extreme with a score of 96.7 percent.

Price Trend-Following Model: Uptrend

Our weekly trend-following model classifies the current market price position as: Uptrend.

AUSTRALIAN DOLLAR StatisticsSPECULATORSCOMMERCIALSSMALL TRADERS
– Percent of Open Interest Longs:52.130.915.9
– Percent of Open Interest Shorts:25.467.75.9
– Net Position:70,813-97,34726,534
– Gross Longs:137,95981,87242,080
– Gross Shorts:67,146179,21915,546
– Long to Short Ratio:2.1 to 10.5 to 12.7 to 1
NET POSITION TREND:
– Strength Index Score (3 Year Range Pct):94.35.296.7
– Strength Index Reading (3 Year Range):Bullish-ExtremeBearish-ExtremeBullish-Extreme
NET POSITION MOVEMENT INDEX:
– 6-Week Change in Strength Index:9.6-8.84.0


New Zealand Dollar Futures:

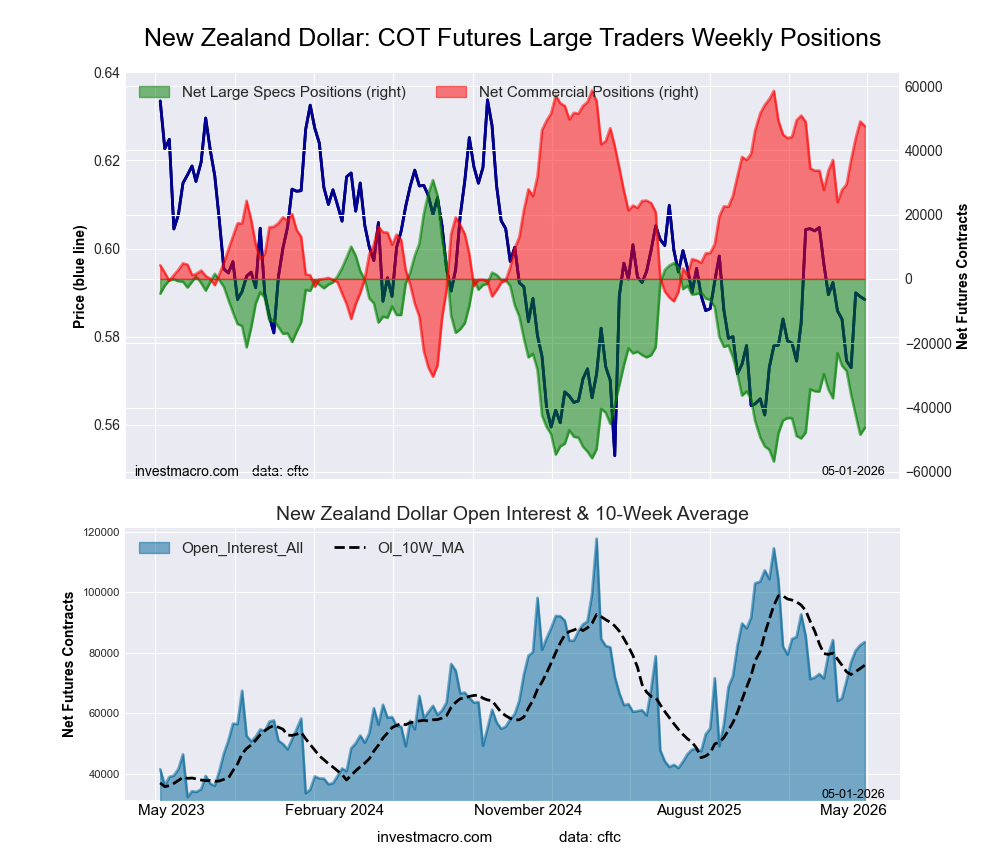
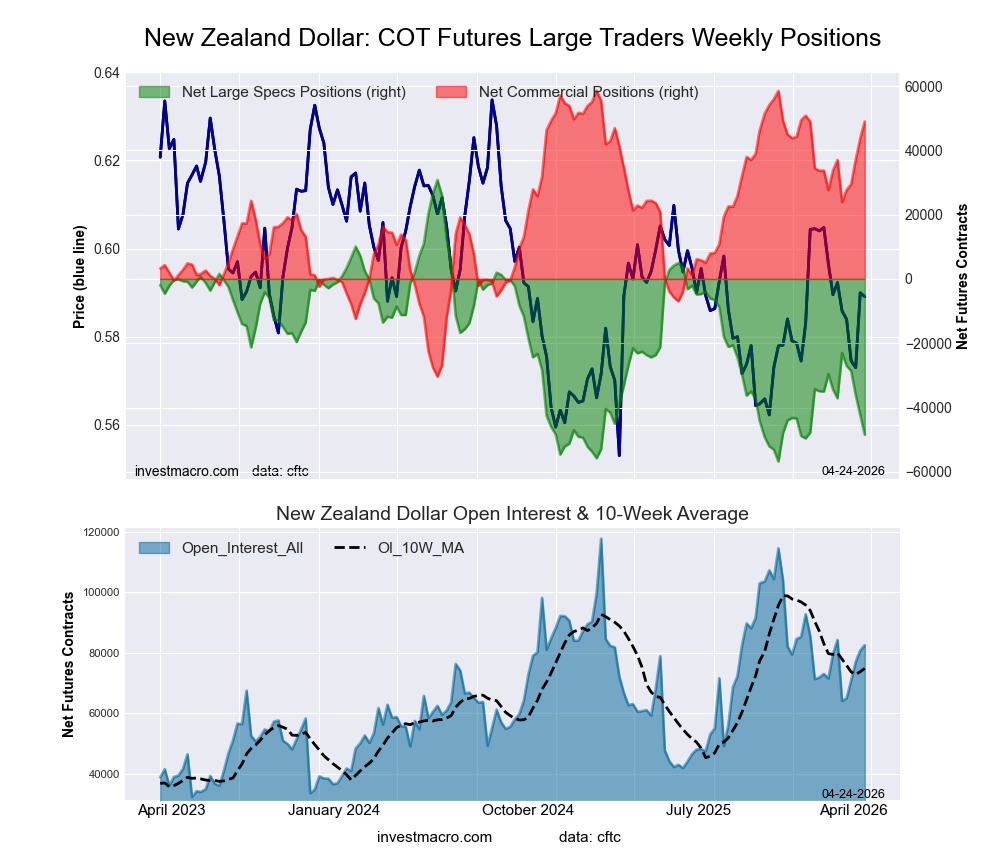
New Zealand Dollar Forex Futures COT ChartPositioning Notes:

  • New Zealand Dollar large speculator standing this week totaled a net position of -36,075 contracts in the data reported through Tuesday.
  • Weekly Speculator position reduction of -7,487 contracts from the previous week which had a total of -28,588 net contracts.
  • This week’s current strength score (range over the past 3 years, measured from 0 to 100) shows the speculators are currently Bearish with a score of 23.7 percent.
  • The Commercials are Bullish with a score of 75.8 percent.
  • The Small Traders (not shown in chart) are Bearish with a score of 39.4 percent.

Price Trend-Following Model: Downtrend

Our weekly trend-following model classifies the current market price position as: Downtrend.

NEW ZEALAND DOLLAR StatisticsSPECULATORSCOMMERCIALSSMALL TRADERS
– Percent of Open Interest Longs:16.477.45.3
– Percent of Open Interest Shorts:63.329.26.6
– Net Position:-36,07537,071-996
– Gross Longs:12,63659,5684,103
– Gross Shorts:48,71122,4975,099
– Long to Short Ratio:0.3 to 12.6 to 10.8 to 1
NET POSITION TREND:
– Strength Index Score (3 Year Range Pct):23.775.839.4
– Strength Index Reading (3 Year Range):BearishBullishBearish
NET POSITION MOVEMENT INDEX:
– 6-Week Change in Strength Index:-7.410.6-37.8


Mexican Peso Futures:

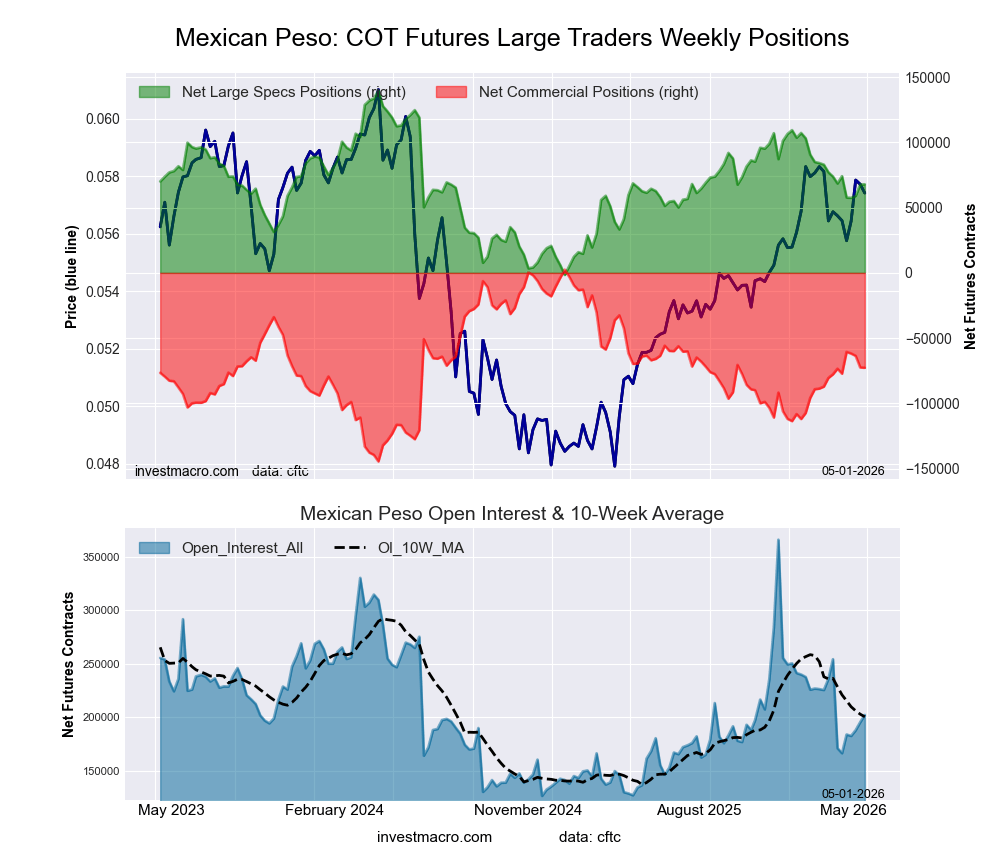
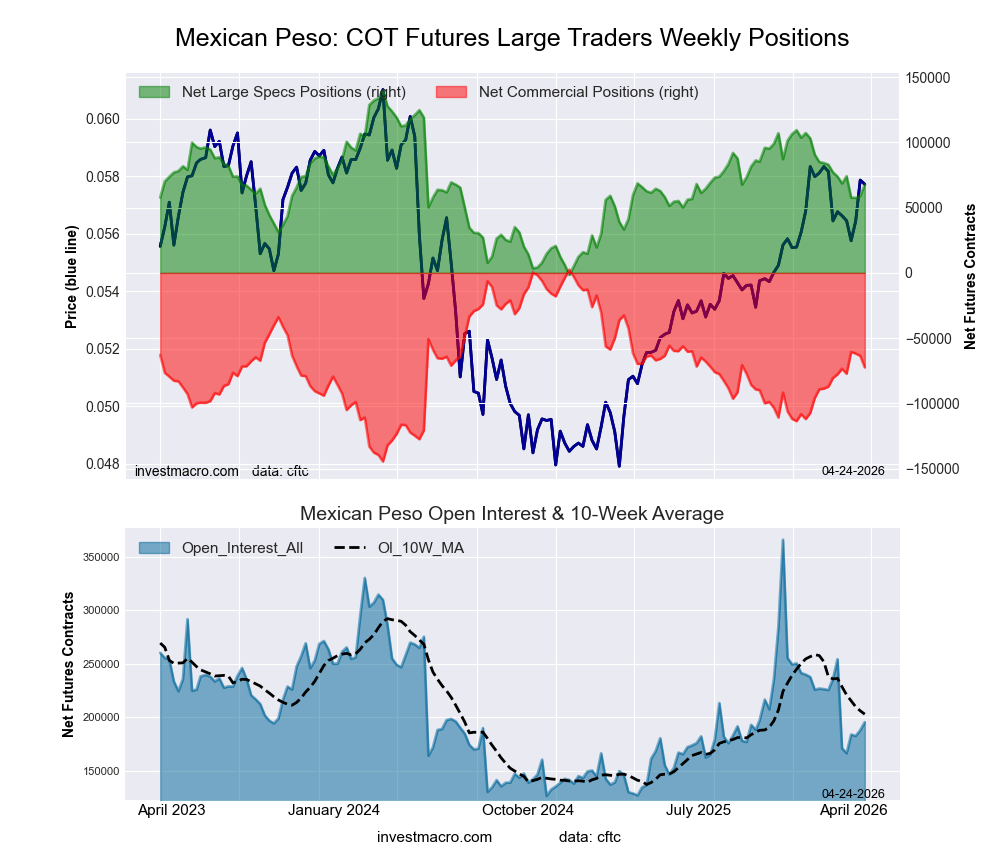
Mexican Peso Futures COT ChartPositioning Notes:

  • Mexican Peso large speculator standing this week totaled a net position of 57,471 contracts in the data reported through Tuesday.
  • Weekly Speculator position decline of -213 contracts from the previous week which had a total of 57,684 net contracts.
  • This week’s current strength score (range over the past 3 years, measured from 0 to 100) shows the speculators are currently Bearish with a score of 41.8 percent.
  • The Commercials are Bullish with a score of 56.3 percent.
  • The Small Traders (not shown in chart) are Bearish with a score of 46.7 percent.

Price Trend-Following Model: Uptrend

Our weekly trend-following model classifies the current market price position as: Uptrend.

MEXICAN PESO StatisticsSPECULATORSCOMMERCIALSSMALL TRADERS
– Percent of Open Interest Longs:49.845.83.6
– Percent of Open Interest Shorts:18.479.61.2
– Net Position:57,471-61,7874,316
– Gross Longs:91,05583,7606,529
– Gross Shorts:33,584145,5472,213
– Long to Short Ratio:2.7 to 10.6 to 13.0 to 1
NET POSITION TREND:
– Strength Index Score (3 Year Range Pct):41.856.346.7
– Strength Index Reading (3 Year Range):BearishBullishBearish
NET POSITION MOVEMENT INDEX:
– 6-Week Change in Strength Index:-18.017.30.4


Brazilian Real Futures:

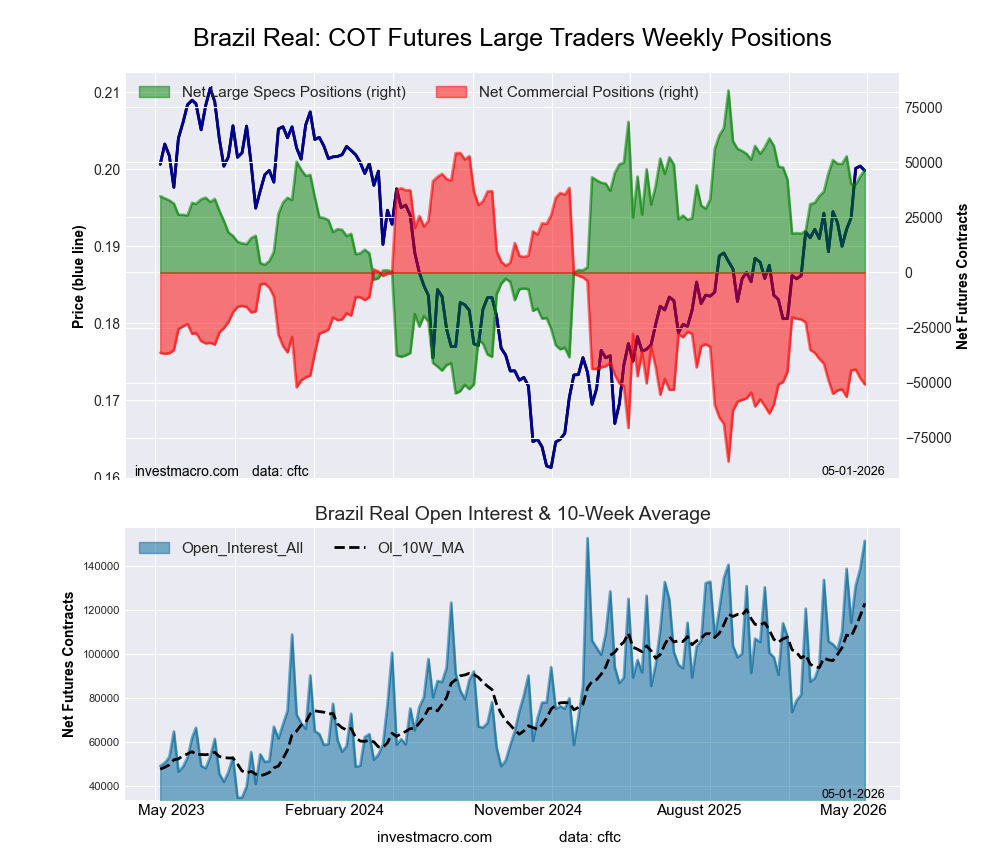
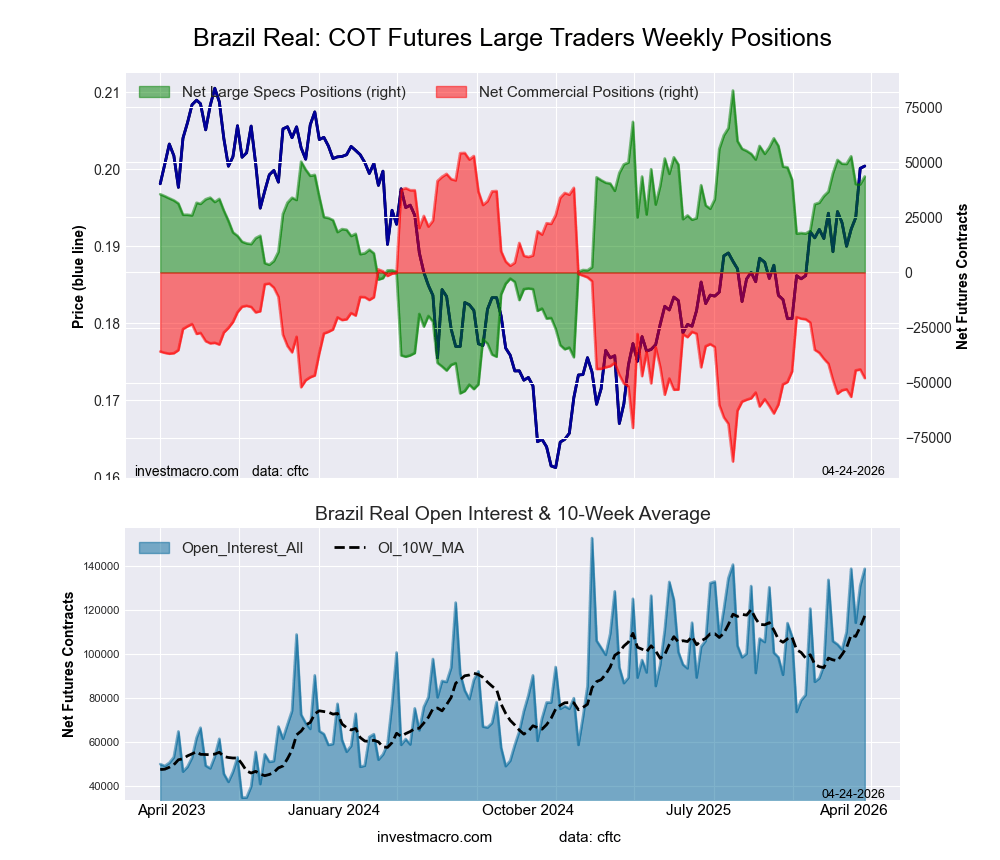
Brazil Real Futures COT ChartPositioning Notes:

  • Brazilian Real large speculator standing this week totaled a net position of 40,095 contracts in the data reported through Tuesday.
  • Weekly Speculator position decline of -12,616 contracts from the previous week which had a total of 52,711 net contracts.
  • This week’s current strength score (range over the past 3 years, measured from 0 to 100) shows the speculators are currently Bullish with a score of 69.1 percent.
  • The Commercials are Bearish with a score of 29.5 percent.
  • The Small Traders (not shown in chart) are Bearish with a score of 45.7 percent.

Price Trend-Following Model: Strong Uptrend

Our weekly trend-following model classifies the current market price position as: Strong Uptrend.

BRAZIL REAL StatisticsSPECULATORSCOMMERCIALSSMALL TRADERS
– Percent of Open Interest Longs:70.324.34.6
– Percent of Open Interest Shorts:35.163.30.7
– Net Position:40,095-44,4974,402
– Gross Longs:80,15727,6995,206
– Gross Shorts:40,06272,196804
– Long to Short Ratio:2.0 to 10.4 to 16.5 to 1
NET POSITION TREND:
– Strength Index Score (3 Year Range Pct):69.129.545.7
– Strength Index Reading (3 Year Range):BullishBearishBearish
NET POSITION MOVEMENT INDEX:
– 6-Week Change in Strength Index:2.5-2.2-1.8


Bitcoin Futures:

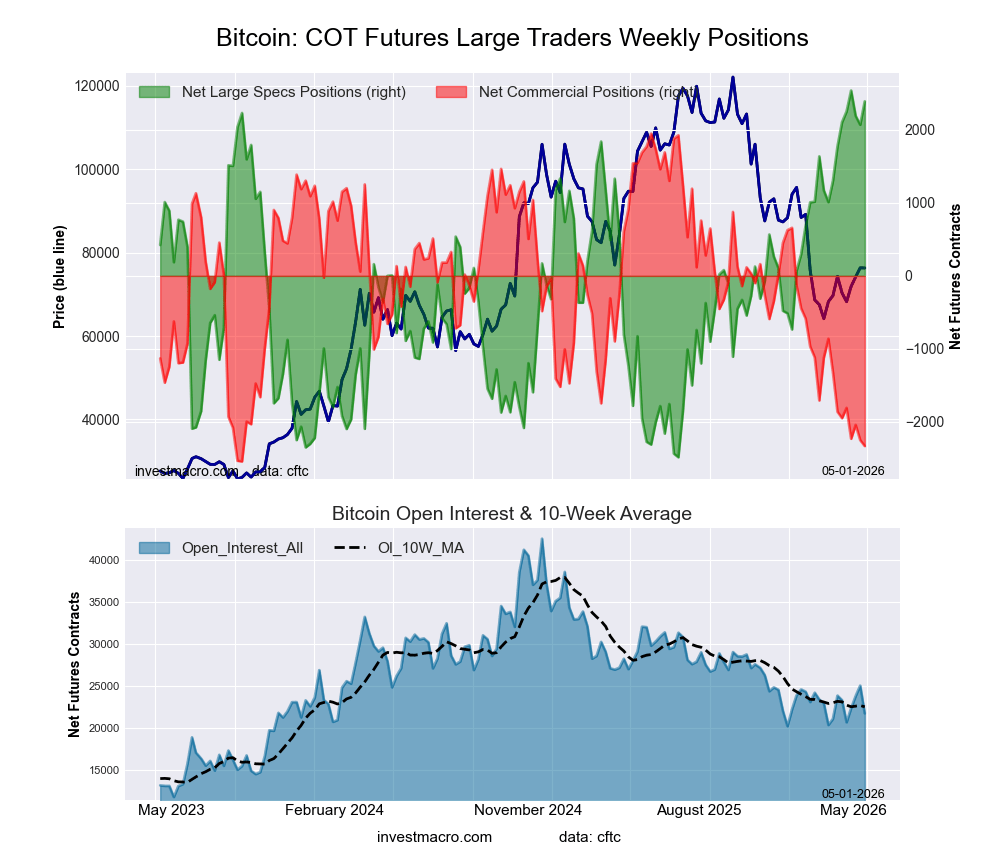
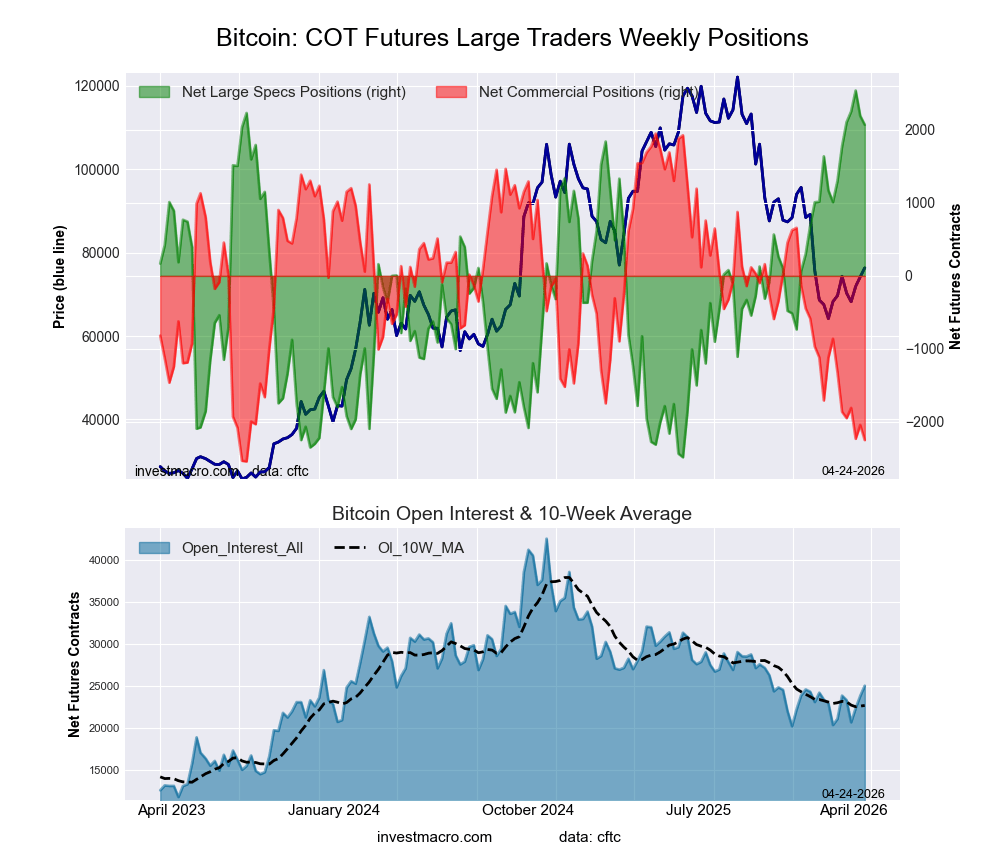
Bitcoin Crypto Futures COT ChartPositioning Notes:

  • Bitcoin large speculator standing this week totaled a net position of 2,540 contracts in the data reported through Tuesday.
  • Weekly Speculator position increase of 287 contracts from the previous week which had a total of 2,253 net contracts.
  • This week’s current strength score (range over the past 3 years, measured from 0 to 100) shows the speculators are currently Bullish-Extreme with a score of 100.0 percent.
  • The Commercials are Bearish-Extreme with a score of 6.9 percent.
  • The Small Traders (not shown in chart) are Bearish with a score of 21.4 percent.

Price Trend-Following Model: Downtrend

Our weekly trend-following model classifies the current market price position as: Downtrend.

BITCOIN StatisticsSPECULATORSCOMMERCIALSSMALL TRADERS
– Percent of Open Interest Longs:72.40.74.2
– Percent of Open Interest Shorts:61.010.75.5
– Net Position:2,540-2,232-308
– Gross Longs:16,142150927
– Gross Shorts:13,6022,3821,235
– Long to Short Ratio:1.2 to 10.1 to 10.8 to 1
NET POSITION TREND:
– Strength Index Score (3 Year Range Pct):100.06.921.4
– Strength Index Reading (3 Year Range):Bullish-ExtremeBearish-ExtremeBearish
NET POSITION MOVEMENT INDEX:
– 6-Week Change in Strength Index:27.2-24.8-13.3


Article By InvestMacroReceive our weekly COT Reports by Email

*COT Report: The COT data, released weekly to the public each Friday, is updated through the most recent Tuesday (data is 3 days old) and shows a quick view of how large speculators or non-commercials (for-profit traders) were positioned in the futures markets.

The CFTC categorizes trader positions according to commercial hedgers (traders who use futures contracts for hedging as part of the business), non-commercials (large traders who speculate to realize trading profits) and nonreportable traders (usually small traders/speculators) as well as their open interest (contracts open in the market at time of reporting).See CFTC criteria here.
All information and opinions on this website and contained in this article are for general informational purposes only and do not constitute investment advice.

USD/JPY: Yen Fared Better, but Energy Rally Not Over

By Analytical Department RoboForex

USD/JPY traded at 159.16 on Friday. The yen is retreating slightly but appears less weak than previously, amid a two-week truce between the US and Iran. The decline in oil prices following the announcement of the truce has partially reduced stagflationary risks and provided some support to the Japanese currency.

Investor focus is on the upcoming talks in Islamabad, where Vice President JD Vance will lead the US delegation. Meetings with the Iranian side are expected to clarify the prospects for further de-escalation.

However, sentiment remains subdued. Continued strikes in the region and ongoing disruptions in the Strait of Hormuz continue to put the fragile truce at risk, driving ** market uncertainty.

The yen has remained under pressure since the conflict began, losing approximately 2%. Investors are factoring in rising energy prices, which add to inflationary pressures while dampening Japan’s growth outlook.

The market is now awaiting signals from Bank of Japan Governor Kazuo Ueda ahead of the 28 April meeting, which could set the future direction of monetary policy.

Technical Analysis

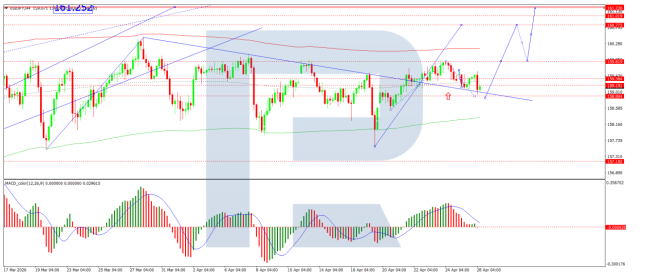
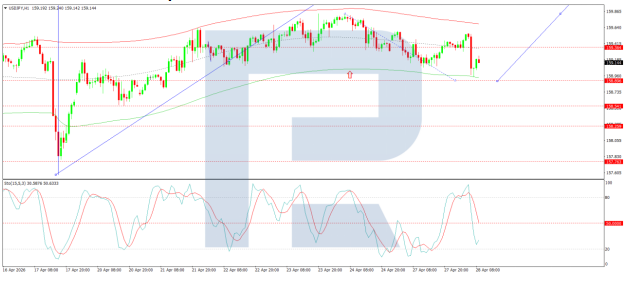
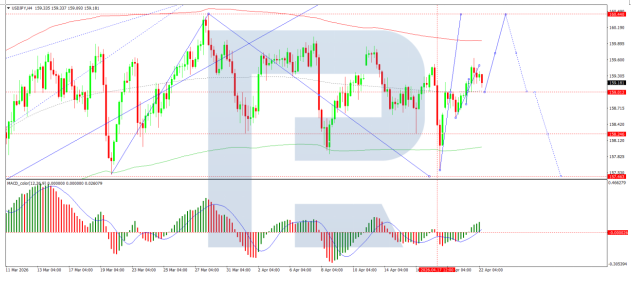
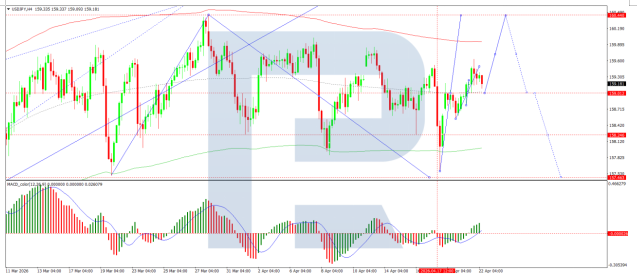
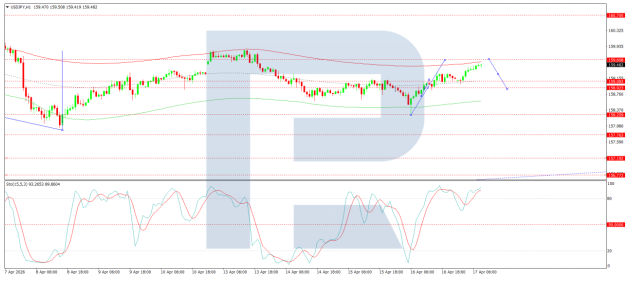
On the H4 USD/JPY chart, the market is forming a consolidation range around the 158.85 level, currently extending up to 159.30. A move higher towards 159.85 (testing from below) is expected today. Subsequently, a potential decline towards the 157.72 level will be considered. Technically, this scenario is confirmed by the MACD indicator, whose signal line is below zero and pointing upwards from low levels.

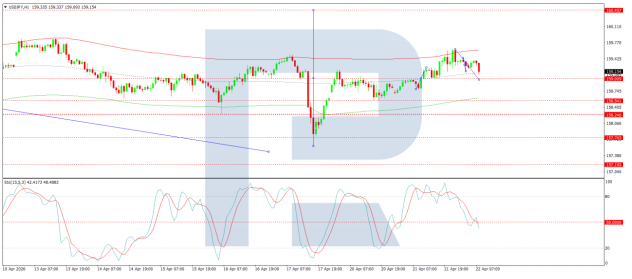
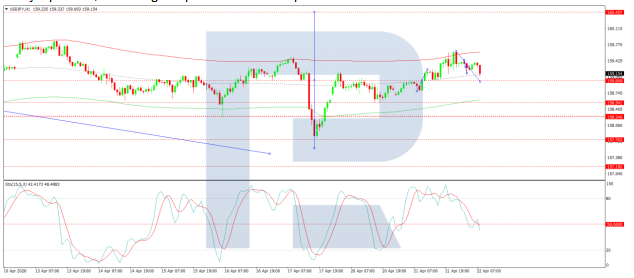
On the H1 chart, the market is forming a wave of growth towards the 159.82 level. A wave extension to the 160.00 level is possible. Thereafter, a downward wave to at least 158.85 is expected. Technically, this scenario is confirmed by the Stochastic oscillator, with its signal line below the 80 level and pointing strictly downwards.

Conclusion

USD/JPY has stabilised as the yen shows tentative signs of recovery, benefiting from the temporary truce between the US and Iran and the resulting pullback in oil prices. However, the fragility of the ceasefire – underscored by continued strikes and disruptions in the Strait of Hormuz – means that energy-driven risks remain very much alive. The yen has lost approximately 2% since the conflict began, and market attention now turns to upcoming diplomatic talks in Islamabad and BOJ Governor Ueda’s signals ahead of the 28 April policy meeting. Technically, a short-term bounce in USD/JPY appears likely, but the broader trajectory will depend on whether de-escalation holds or tensions reignite.


Disclaimer

Any forecasts contained herein are based on the author’s particular opinion. This analysis may not be treated as trading advice. RoboForex bears no responsibility for trading results based on trading recommendations and reviews contained herein.

EUR/USD on the Plus Side: Middle East Truce Proves Fragile

By Analytical Department RoboForex

EUR/USD rose to 1.1667 on Thursday. The US dollar partially recouped its losses from the previous session, as market sentiment remains cautious amid a fragile truce between the US and Iran.

The situation around the Strait of Hormuz remains tense. According to Iranian media, the passage of tankers is still restricted following new strikes in the region. Iranian representatives have alleged violations of several ceasefire conditions.

The dollar fell sharply the previous day following the announcement of a two-week truce, which led to a drop in oil prices and temporarily eased inflation fears.

An additional factor was the release of the Federal Reserve’s meeting minutes. Some participants acknowledged the possibility of raising rates to contain inflation, though many still anticipate subsequent policy easing.

Investor attention is now focused on macroeconomic data, including consumer spending reports, the PCE index, and the upcoming CPI release, which will provide further insight into inflation. All of these could determine the near-term direction of markets.

Technical Analysis

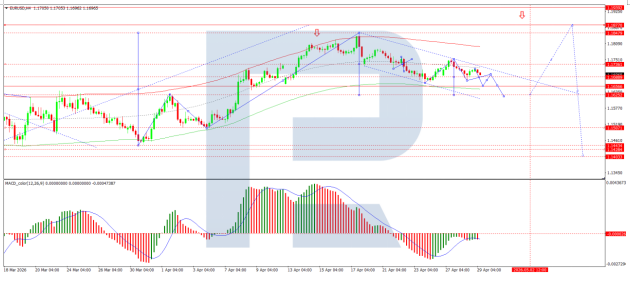
On the H4 chart of EUR/USD, the market is forming a consolidation range around 1.1683. A downward wave is expected, with a continuation to 1.1606 as a local target. Subsequently, a move higher back to 1.1683 is anticipated. Technically, this scenario is confirmed by the MACD indicator, with its signal line above zero but pointing firmly downwards, reflecting continued bearish momentum and the potential for the downtrend to persist.

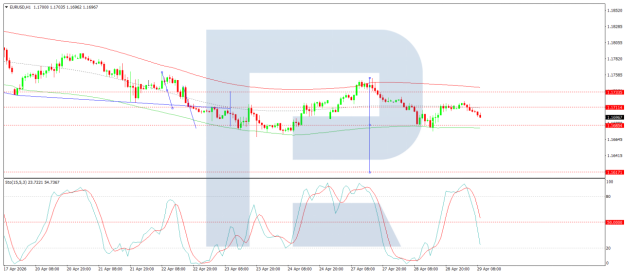
On the H1 chart, the market is forming the structure of the next downward wave to the 1.1616 level. After reaching this level, an increase to 1.1666 is expected, followed by a further decline to 1.1494. Technically, this scenario is confirmed by the Stochastic oscillator, with its signal line below 50 and pointing firmly downwards towards 20.

Conclusion

EUR/USD remains on the front foot, though the dollar has managed to claw back some ground as the US-Iran truce shows signs of strain. Reports of continued restrictions on tanker movements through the Strait of Hormuz and alleged ceasefire violations have reintroduced caution into markets. The Fed minutes revealed a divided committee, with some members open to rate hikes while others lean towards eventual easing, adding to the uncertainty. With key US inflation and consumer data on the horizon, the pair’s direction remains uncertain. Technically, near-term downside appears likely, but the broader trend will depend on whether the fragile truce holds or geopolitical tensions reignite.


Disclaimer

Any forecasts contained herein are based on the author’s particular opinion. This analysis may not be treated as trading advice. RoboForex bears no responsibility for trading results based on trading recommendations and reviews contained herein.

EUR/USD Soars on Middle East Pause

By Analytical Department RoboForex

EUR/USD rose sharply midweek to 1.1675, reaching a four-week high. Pressure on the US dollar came after President Donald Trump postponed the threat of strikes on Iranian civilian infrastructure for two weeks. The politician described this as a “bilateral ceasefire” conditional upon the reopening of the Strait of Hormuz.

According to Trump, the US has received a 10-point proposal from Iran, which is being viewed as a working basis for negotiations. The two-week window could be used to reach a resolution. Iran has reportedly agreed to temporarily open the strait, provided that attacks cease. Israel has also supported the ceasefire.

At the same time, macroeconomic data point to rising inflation expectations in the US. In March, these increased, with transport costs in logistics rising markedly.

Investor attention is now focused on the release of March inflation data (CPI), which could clarify the degree of price pressure amid the ongoing conflict.

Technical Analysis

On the H4 chart of EUR/USD, the market is forming a consolidation range around the 1.1700 level. A downward wave to 1.1566 is expected as a local target. Subsequently, a move higher to 1.1717 is anticipated. Technically, this scenario is confirmed by the MACD indicator, with its signal line above zero and pointing firmly upwards, indicating continued bullish momentum and the potential for the uptrend to continue.

On the H1 chart, the market is forming the structure of the next downward wave to the 1.1566 level. After reaching this level, an increase to 1.1717 is expected, with the potential for the move higher to extend to 1.1730. Technically, this scenario is confirmed by the Stochastic oscillator, with its signal line below 80 and pointing firmly downwards towards 20.

Conclusion

EUR/USD has surged on news of a potential breakthrough in Middle East tensions, with Trump postponing strikes on Iranian infrastructure and a two-week “bilateral ceasefire” taking effect, conditional on the reopening of the Strait of Hormuz. Iran’s reported 10-point proposal and agreement to temporarily open the strait have provided a significant boost to risk appetite, weighing on the safe-haven dollar. However, rising US inflation expectations and the upcoming CPI release remind markets that domestic price pressures remain a concern. While technical indicators suggest some near-term consolidation or pullback, the pair’s direction will ultimately depend on whether diplomatic efforts hold and whether the ceasefire translates into a more lasting de-escalation.


Disclaimer

Any forecasts contained herein are based on the author’s particular opinion. This analysis may not be treated as trading advice. RoboForex bears no responsibility for trading results based on trading recommendations and reviews contained herein.

Pound Stays at Six-Month Low as Risks Weigh Ever Harder

By Analytical Department RoboForex

GBP/USD is consolidating at 1.3232 on Tuesday. The pound remains near its lowest levels globally since late November, with growing pressure stemming from uncertainty over the Iran conflict and rising oil prices.

At the same time, the US dollar continues to draw support from strong US labour market data, which has reduced expectations of Federal Reserve easing.

US President Donald Trump has warned Iran of severe consequences if it refuses to reopen the Strait of Hormuz. However, according to US intelligence estimates, the likelihood of Tehran meeting these demands remains low.

Meanwhile, the possibility of a 45-day truce involving the US, Iran, and regional mediators is being discussed, which could partially reduce tensions.

Amid high oil prices, investors have effectively ruled out a Fed rate cut this year. In the UK, by contrast, the market is now pricing in two Bank of England rate hikes for 2026. However, BoE Governor Andrew Bailey has cautioned that such expectations may be excessive.

Technical Analysis

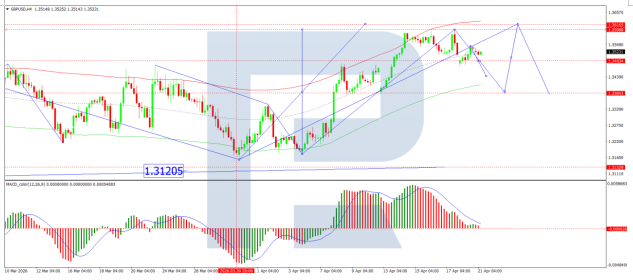
On the H4 GBP/USD chart, the market is forming a broad consolidation range around the 1.3262 level, currently extending down to 1.3180. A move towards 1.3262 is expected in the near term. Following the completion of this correction, a new consolidation range is likely to form. An upside breakout would open the way for a continuation move to 1.3411, while a downside breakout would suggest further movement to 1.3120. Technically, this scenario is confirmed by the MACD indicator, whose signal line is below zero and pointing downwards.

On the H1 chart, the market has formed a compact consolidation range around the 1.3222 level. A downside breakout has initiated a wave structure extending to 1.3120. Should this level be breached, further downside potential towards 1.3050 would emerge. Conversely, an upside breakout from the range could trigger a rebound to 1.3286. Technically, this scenario is confirmed by the Stochastic oscillator, with its signal line below 50 and pointing downwards towards 20.

Conclusion

GBP/USD remains pinned near six-month lows as a perfect storm of geopolitical uncertainty, rising oil prices, and diverging central bank expectations weighs heavily on sterling. While strong US labour data has bolstered the dollar by pushing Fed rate cut expectations further out, the UK market’s pricing of two BoE rate hikes for 2026 appears increasingly optimistic, especially given Governor Bailey’s own caution. The possibility of a 45-day truce offers a glimmer of hope for de-escalation, but US intelligence suggests Iranian compliance remains unlikely. Technical indicators point firmly lower, and unless geopolitical tensions ease substantially, the pound faces continued headwinds.


Disclaimer

Any forecasts contained herein are based on the author’s particular opinion. This analysis may not be treated as trading advice. RoboForex bears no responsibility for trading results based on trading recommendations and reviews contained herein.

Large Currency Speculators sharply add to Canadian Dollar Bearish Bets

By InvestMacro

Speculators OI FX Futures COT Chart

Open Interest (OI) is the amount of contracts that are currently live in the marketplace. OI Strength shows the current strength compared to the past 3-years.

Here are the latest charts and statistics for the Commitment of Traders (COT) data published by the Commodities Futures Trading Commission (CFTC).

The latest COT data is updated through Tuesday March 31st and shows a quick view of how large market participants (for-profit speculators and commercial traders) were positioned in the futures markets. All currency positions are in direct relation to the US dollar where, for example, a bet for the euro is a bet that the euro will rise versus the dollar while a bet against the euro will be a bet that the euro will decline versus the dollar.

Weekly Speculator Changes led by Australian Dollar & British Pound

Speculators Nets FX Futures COT Chart
The COT currency market speculator bets were lower this week as five out of the eleven currency markets we cover had higher positioning while the other six markets had lower speculator contracts.

Leading the gains for the currency markets was the Australian Dollar (10,634 contracts) with the British Pound (5,757 contracts), the Brazilian Real (3,463 contracts), Bitcoin (147 contracts),  and the US Dollar Index (64 contracts) also showing positive weeks.

The currencies seeing declines in speculator bets on the week were the Canadian Dollar (-31,082 contracts), the Mexican Peso (-16,392 contracts), the Japanese Yen (-10,066 contracts), the EuroFX (-8,772 contracts), the Swiss Franc (-2,774 contracts) and the New Zealand Dollar (-1,582 contracts) also registering lower bets on the week.

Speculators sharply add to Canadian Dollar Bearish Bets

The Canadian Dollar weakness highlights the currencies markets speculator positions for the week. The large speculative Canadian Dollar position fell by over 31,000 contracts this week, marking its third consecutive week in decline and the fourth time out of the past five weeks. In just the past three weeks alone, the Canadian Dollar has shed -68,843 contracts from its overall standing, going from a net position of +36,159 contracts on March 10 to this week’s new total of -32,684 net contracts. The Canadian Dollar had been in bullish territory for a seven-week span from the end of January until the middle of March before speculators started adding bearish positions. In the Foreign Exchange markets this week, the Canadian Dollar fell modestly but has now fallen for four consecutive weeks. Previously, the Canadian Dollar had reached six-month highs in January and February, just above the 0.7415 levels. However, since the beginning of March, the Canadian Dollar has been in a downtrend which has seen its exchange rate fall to 0.7207 at the close of this week. Where the currency goes from here could be determined at its current level around 0.7200, which has been a source of major support numerous times over the past three years.

The Japanese Yen position continues to also go more bearish and fell this week for the fifth time out of the past six weeks. The cumulative total of the past six weeks has now fallen by -85,827 contracts, bringing the Japanese Yen position from a bullish level of +12,955 contracts on February 17 to this week’s new total of -72,872 contracts. This week’s net position is now the most bearish since July 2024. The Japanese Yen against the US Dollar closed this week right near the 160.00 major significant level. The Yen is seeing weakness around the lowest levels of the past 30 years. Further upside will run into the 161.00 resistance area, followed by the 161.75 – 162.00 resistance that was challenged in July 2024.

Mexican Peso positions dropped sharply this week by over -16,000 contracts. Peso positioning has been sliding since late January when it was at the end of a seven-week streak where positions were over 100,000 contracts. Since then, Peso speculative positions have cooled off by a total of -45,430 contracts. That has brought the overall position down to this week’s total of 57,684 net positions. The Peso, meanwhile, has been in a nice uptrend over the past year, with prices gaining by approximately 19% since the beginning of February 2025. The Peso has run into weakness over the past six weeks. However, the currency rebounded this week strongly by approximately +1.50%, breaking a previous five-week losing streak.

The Mexican Peso and Brazilian Real lead the Currency market price performances this week

In the Currency markets, the price performance leaders were the Mexican Peso with a 1.46% rise on the week and the Brazilian Real, which increased by 1.30%. Bitcoin was modestly higher by 0.69%, while the Australian Dollar increased by 0.43%. The Japanese Yen ticked up by 0.32%, followed by the Euro, which was higher by 0.26%. Rounding out the gainers was the US Dollar Index, which edged higher by 0.03% on the week. The Swiss Franc was slightly lower by -0.02% and followed by the Canadian Dollar, which was lower by -0.34%. The British Pound was modestly lower by -0.40%, while the New Zealand Dollar rounds out the decliners on the week with a -0.84% decrease in the Currency markets.

Over the past 30 days, the only Currency that has a positive return is the US Dollar Index, which has risen by 2.48% in the past 30 days. While on the downside, Bitcoin has fallen by -5.77%, the New Zealand Dollar has dropped by -5.34%, and the Swiss Franc is down by approximately -4%.


Currencies Data:

Speculators FX Futures COT Data Table
Legend: Open Interest | Speculators Current Net Position | Weekly Specs Change | Specs Strength Score compared to last 3-Years (0-100 range)


Strength Scores led by Australian Dollar & Bitcoin

Speculators Strength Scores FX Futures COT Chart
COT Strength Scores (a normalized measure of Speculator positions over a 3-Year range, from 0 to 100 where above 80 is Extreme-Bullish and below 20 is Extreme-Bearish) showed that the Australian Dollar (100 percent) and the Bitcoin (100 percent) lead the currency markets this week. The Brazilian Real (78 percent), Canadian Dollar (70 percent) and the US Dollar Index (54 percent) come in as the next highest in the weekly strength scores.

On the downside, the British Pound (17 percent) comes in at the lowest strength levels currently and is in Extreme-Bearish territory (below 20 percent). The next lowest strength scores are the EuroFX (29 percent), the Japanese Yen (31 percent) and the New Zealand Dollar (32 percent).

3-Year Strength Statistics:
US Dollar Index (54.1 percent) vs US Dollar Index previous week (53.9 percent)
EuroFX (29.0 percent) vs EuroFX previous week (32.3 percent)
British Pound Sterling (17.2 percent) vs British Pound Sterling previous week (14.8 percent)
Japanese Yen (30.6 percent) vs Japanese Yen previous week (33.4 percent)
Swiss Franc (40.4 percent) vs Swiss Franc previous week (46.0 percent)
Canadian Dollar (70.4 percent) vs Canadian Dollar previous week (83.8 percent)
Australian Dollar (100.0 percent) vs Australian Dollar previous week (94.4 percent)
New Zealand Dollar (32.2 percent) vs New Zealand Dollar previous week (34.0 percent)
Mexican Peso (41.9 percent) vs Mexican Peso previous week (53.5 percent)
Brazilian Real (78.3 percent) vs Brazilian Real previous week (75.8 percent)
Bitcoin (100.0 percent) vs Bitcoin previous week (96.9 percent)


Swiss Franc & Australian Dollar top the 6-Week Strength Trends

Speculators Trends FX Futures COT Chart
COT Strength Score Trends (or move index, calculates the 6-week changes in strength scores) showed that the Swiss Franc (22 percent) and the Australian Dollar (19 percent) lead the past six weeks trends for the currencies. The Brazilian Real (13 percent), Bitcoin (13 percent) and the US Dollar Index (9 percent) are the next highest positive movers in the 3-Year trends data.

The EuroFX (-66 percent) leads the downside trend scores currently with the Canadian Dollar (-25 percent), Japanese Yen (-24 percent) and the Mexican Peso (-19 percent) following next with lower trend scores.

3-Year Strength Trends:
US Dollar Index (9.1 percent) vs US Dollar Index previous week (11.7 percent)
EuroFX (-66.2 percent) vs EuroFX previous week (-65.1 percent)
British Pound Sterling (-4.4 percent) vs British Pound Sterling previous week (-13.9 percent)
Japanese Yen (-23.6 percent) vs Japanese Yen previous week (-12.0 percent)
Swiss Franc (22.3 percent) vs Swiss Franc previous week (30.7 percent)
Canadian Dollar (-25.2 percent) vs Canadian Dollar previous week (-6.4 percent)
Australian Dollar (18.8 percent) vs Australian Dollar previous week (19.9 percent)
New Zealand Dollar (7.3 percent) vs New Zealand Dollar previous week (9.0 percent)
Mexican Peso (-18.7 percent) vs Mexican Peso previous week (-7.7 percent)
Brazilian Real (13.1 percent) vs Brazilian Real previous week (12.8 percent)
Bitcoin (13.0 percent) vs Bitcoin previous week (23.0 percent)


Individual COT Forex Markets:

US Dollar Index Futures:

US Dollar Index Forex Futures COT ChartThe US Dollar Index large speculator standing this week was a net position of 3,681 contracts in the data reported through Tuesday. This was a weekly rise of 64 contracts from the previous week which had a total of 3,617 net contracts.

This week’s current strength score (the trader positioning range over the past three years, measured from 0 to 100) shows the speculators are currently Bullish with a score of 54.1 percent. The commercials are Bearish with a score of 43.2 percent and the small traders (not shown in chart) are Bullish with a score of 60.8 percent.

Price Trend-Following Model: Strong Uptrend

Our weekly trend-following model classifies the current market price position as: Strong Uptrend.

US DOLLAR INDEX StatisticsSPECULATORSCOMMERCIALSSMALL TRADERS
– Percent of Open Interest Longs:56.029.28.7
– Percent of Open Interest Shorts:46.541.95.5
– Net Position:3,681-4,9301,249
– Gross Longs:21,70811,3193,389
– Gross Shorts:18,02716,2492,140
– Long to Short Ratio:1.2 to 10.7 to 11.6 to 1
NET POSITION TREND:
– Strength Index Score (3 Year Range Pct):54.143.260.8
– Strength Index Reading (3 Year Range):BullishBearishBullish
NET POSITION MOVEMENT INDEX:
– 6-Week Change in Strength Index:9.1-15.339.7


Euro Currency Futures:

Euro Currency Futures COT ChartThe Euro Currency large speculator standing this week was a net position of 507 contracts in the data reported through Tuesday. This was a weekly decrease of -8,772 contracts from the previous week which had a total of 9,279 net contracts.

This week’s current strength score (the trader positioning range over the past three years, measured from 0 to 100) shows the speculators are currently Bearish with a score of 29.0 percent. The commercials are Bullish with a score of 68.6 percent and the small traders (not shown in chart) are Bullish with a score of 51.5 percent.

Price Trend-Following Model: Strong Downtrend

Our weekly trend-following model classifies the current market price position as: Strong Downtrend.

EURO Currency StatisticsSPECULATORSCOMMERCIALSSMALL TRADERS
– Percent of Open Interest Longs:25.959.710.8
– Percent of Open Interest Shorts:25.864.56.0
– Net Position:507-36,99136,484
– Gross Longs:200,168462,33783,289
– Gross Shorts:199,661499,32846,805
– Long to Short Ratio:1.0 to 10.9 to 11.8 to 1
NET POSITION TREND:
– Strength Index Score (3 Year Range Pct):29.068.651.5
– Strength Index Reading (3 Year Range):BearishBullishBullish
NET POSITION MOVEMENT INDEX:
– 6-Week Change in Strength Index:-66.265.0-35.3


British Pound Sterling Futures:

British Pound Sterling Futures COT ChartThe British Pound Sterling large speculator standing this week was a net position of -52,665 contracts in the data reported through Tuesday. This was a weekly boost of 5,757 contracts from the previous week which had a total of -58,422 net contracts.

This week’s current strength score (the trader positioning range over the past three years, measured from 0 to 100) shows the speculators are currently Bearish-Extreme with a score of 17.2 percent. The commercials are Bullish-Extreme with a score of 84.2 percent and the small traders (not shown in chart) are Bearish with a score of 30.5 percent.

Price Trend-Following Model: Uptrend

Our weekly trend-following model classifies the current market price position as: Uptrend.

BRITISH POUND StatisticsSPECULATORSCOMMERCIALSSMALL TRADERS
– Percent of Open Interest Longs:21.168.98.7
– Percent of Open Interest Shorts:42.743.612.3
– Net Position:-52,66561,408-8,743
– Gross Longs:51,304167,65221,248
– Gross Shorts:103,969106,24429,991
– Long to Short Ratio:0.5 to 11.6 to 10.7 to 1
NET POSITION TREND:
– Strength Index Score (3 Year Range Pct):17.284.230.5
– Strength Index Reading (3 Year Range):Bearish-ExtremeBullish-ExtremeBearish
NET POSITION MOVEMENT INDEX:
– 6-Week Change in Strength Index:-4.49.3-35.1


Japanese Yen Futures:

Japanese Yen Forex Futures COT ChartThe Japanese Yen large speculator standing this week was a net position of -72,872 contracts in the data reported through Tuesday. This was a weekly decrease of -10,066 contracts from the previous week which had a total of -62,806 net contracts.

This week’s current strength score (the trader positioning range over the past three years, measured from 0 to 100) shows the speculators are currently Bearish with a score of 30.6 percent. The commercials are Bullish with a score of 68.8 percent and the small traders (not shown in chart) are Bearish with a score of 42.3 percent.

Price Trend-Following Model: Strong Downtrend

Our weekly trend-following model classifies the current market price position as: Strong Downtrend.

JAPANESE YEN StatisticsSPECULATORSCOMMERCIALSSMALL TRADERS
– Percent of Open Interest Longs:27.653.911.8
– Percent of Open Interest Shorts:48.733.411.2
– Net Position:-72,87270,7072,165
– Gross Longs:95,356185,94440,898
– Gross Shorts:168,228115,23738,733
– Long to Short Ratio:0.6 to 11.6 to 11.1 to 1
NET POSITION TREND:
– Strength Index Score (3 Year Range Pct):30.668.842.3
– Strength Index Reading (3 Year Range):BearishBullishBearish
NET POSITION MOVEMENT INDEX:
– 6-Week Change in Strength Index:-23.621.9-2.7


Swiss Franc Futures:

Swiss Franc Forex Futures COT ChartThe Swiss Franc large speculator standing this week was a net position of -29,871 contracts in the data reported through Tuesday. This was a weekly reduction of -2,774 contracts from the previous week which had a total of -27,097 net contracts.

This week’s current strength score (the trader positioning range over the past three years, measured from 0 to 100) shows the speculators are currently Bearish with a score of 40.4 percent. The commercials are Bullish with a score of 57.8 percent and the small traders (not shown in chart) are Bullish with a score of 53.9 percent.

Price Trend-Following Model: Weak Uptrend

Our weekly trend-following model classifies the current market price position as: Weak Uptrend.

SWISS FRANC StatisticsSPECULATORSCOMMERCIALSSMALL TRADERS
– Percent of Open Interest Longs:11.773.015.0
– Percent of Open Interest Shorts:49.128.222.3
– Net Position:-29,87135,735-5,864
– Gross Longs:9,31558,24311,957
– Gross Shorts:39,18622,50817,821
– Long to Short Ratio:0.2 to 12.6 to 10.7 to 1
NET POSITION TREND:
– Strength Index Score (3 Year Range Pct):40.457.853.9
– Strength Index Reading (3 Year Range):BearishBullishBullish
NET POSITION MOVEMENT INDEX:
– 6-Week Change in Strength Index:22.3-4.7-34.5


Canadian Dollar Futures:

Canadian Dollar Forex Futures COT ChartThe Canadian Dollar large speculator standing this week was a net position of -32,684 contracts in the data reported through Tuesday. This was a weekly decline of -31,082 contracts from the previous week which had a total of -1,602 net contracts.

This week’s current strength score (the trader positioning range over the past three years, measured from 0 to 100) shows the speculators are currently Bullish with a score of 70.4 percent. The commercials are Bearish with a score of 31.6 percent and the small traders (not shown in chart) are Bearish with a score of 41.7 percent.

Price Trend-Following Model: Weak Uptrend

Our weekly trend-following model classifies the current market price position as: Weak Uptrend.

CANADIAN DOLLAR StatisticsSPECULATORSCOMMERCIALSSMALL TRADERS
– Percent of Open Interest Longs:26.055.814.6
– Percent of Open Interest Shorts:41.040.215.2
– Net Position:-32,68433,986-1,302
– Gross Longs:56,421121,22731,625
– Gross Shorts:89,10587,24132,927
– Long to Short Ratio:0.6 to 11.4 to 11.0 to 1
NET POSITION TREND:
– Strength Index Score (3 Year Range Pct):70.431.641.7
– Strength Index Reading (3 Year Range):BullishBearishBearish
NET POSITION MOVEMENT INDEX:
– 6-Week Change in Strength Index:-25.225.9-16.3


Australian Dollar Futures:

Australian Dollar Forex Futures COT ChartThe Australian Dollar large speculator standing this week was a net position of 81,506 contracts in the data reported through Tuesday. This was a weekly rise of 10,634 contracts from the previous week which had a total of 70,872 net contracts.

This week’s current strength score (the trader positioning range over the past three years, measured from 0 to 100) shows the speculators are currently Bullish-Extreme with a score of 100.0 percent. The commercials are Bearish-Extreme with a score of 0.0 percent and the small traders (not shown in chart) are Bullish-Extreme with a score of 98.9 percent.

Price Trend-Following Model: Weak Uptrend

Our weekly trend-following model classifies the current market price position as: Weak Uptrend.

AUSTRALIAN DOLLAR StatisticsSPECULATORSCOMMERCIALSSMALL TRADERS
– Percent of Open Interest Longs:53.730.015.9
– Percent of Open Interest Shorts:22.871.35.5
– Net Position:81,506-109,04127,535
– Gross Longs:141,77579,25142,040
– Gross Shorts:60,269188,29214,505
– Long to Short Ratio:2.4 to 10.4 to 12.9 to 1
NET POSITION TREND:
– Strength Index Score (3 Year Range Pct):100.00.098.9
– Strength Index Reading (3 Year Range):Bullish-ExtremeBearish-ExtremeBullish-Extreme
NET POSITION MOVEMENT INDEX:
– 6-Week Change in Strength Index:18.8-15.5-1.1


New Zealand Dollar Futures:

New Zealand Dollar Forex Futures COT ChartThe New Zealand Dollar large speculator standing this week was a net position of -28,588 contracts in the data reported through Tuesday. This was a weekly fall of -1,582 contracts from the previous week which had a total of -27,006 net contracts.

This week’s current strength score (the trader positioning range over the past three years, measured from 0 to 100) shows the speculators are currently Bearish with a score of 32.2 percent. The commercials are Bullish with a score of 67.2 percent and the small traders (not shown in chart) are Bearish with a score of 41.2 percent.

Price Trend-Following Model: Weak Uptrend

Our weekly trend-following model classifies the current market price position as: Weak Uptrend.

NEW ZEALAND DOLLAR StatisticsSPECULATORSCOMMERCIALSSMALL TRADERS
– Percent of Open Interest Longs:15.179.05.3
– Percent of Open Interest Shorts:55.437.46.5
– Net Position:-28,58829,446-858
– Gross Longs:10,66355,9193,735
– Gross Shorts:39,25126,4734,593
– Long to Short Ratio:0.3 to 12.1 to 10.8 to 1
NET POSITION TREND:
– Strength Index Score (3 Year Range Pct):32.267.241.2
– Strength Index Reading (3 Year Range):BearishBullishBearish
NET POSITION MOVEMENT INDEX:
– 6-Week Change in Strength Index:7.3-4.8-28.1


Mexican Peso Futures:

Mexican Peso Futures COT ChartThe Mexican Peso large speculator standing this week was a net position of 57,684 contracts in the data reported through Tuesday. This was a weekly lowering of -16,392 contracts from the previous week which had a total of 74,076 net contracts.

This week’s current strength score (the trader positioning range over the past three years, measured from 0 to 100) shows the speculators are currently Bearish with a score of 41.9 percent. The commercials are Bullish with a score of 57.1 percent and the small traders (not shown in chart) are Bearish with a score of 38.8 percent.

Price Trend-Following Model: Weak Uptrend

Our weekly trend-following model classifies the current market price position as: Weak Uptrend.

MEXICAN PESO StatisticsSPECULATORSCOMMERCIALSSMALL TRADERS
– Percent of Open Interest Longs:51.245.23.0
– Percent of Open Interest Shorts:19.878.21.4
– Net Position:57,684-60,5762,892
– Gross Longs:94,18383,2845,529
– Gross Shorts:36,499143,8602,637
– Long to Short Ratio:2.6 to 10.6 to 12.1 to 1
NET POSITION TREND:
– Strength Index Score (3 Year Range Pct):41.957.138.8
– Strength Index Reading (3 Year Range):BearishBullishBearish
NET POSITION MOVEMENT INDEX:
– 6-Week Change in Strength Index:-18.719.1-9.2


Brazilian Real Futures:

Brazil Real Futures COT ChartThe Brazilian Real large speculator standing this week was a net position of 52,711 contracts in the data reported through Tuesday. This was a weekly lift of 3,463 contracts from the previous week which had a total of 49,248 net contracts.

This week’s current strength score (the trader positioning range over the past three years, measured from 0 to 100) shows the speculators are currently Bullish with a score of 78.3 percent. The commercials are Bearish with a score of 20.9 percent and the small traders (not shown in chart) are Bearish with a score of 42.1 percent.

Price Trend-Following Model: Strong Uptrend

Our weekly trend-following model classifies the current market price position as: Strong Uptrend.

BRAZIL REAL StatisticsSPECULATORSCOMMERCIALSSMALL TRADERS
– Percent of Open Interest Longs:59.828.83.4
– Percent of Open Interest Shorts:21.769.60.7
– Net Position:52,711-56,4813,770
– Gross Longs:82,78739,9204,727
– Gross Shorts:30,07696,401957
– Long to Short Ratio:2.8 to 10.4 to 14.9 to 1
NET POSITION TREND:
– Strength Index Score (3 Year Range Pct):78.320.942.1
– Strength Index Reading (3 Year Range):BullishBearishBearish
NET POSITION MOVEMENT INDEX:
– 6-Week Change in Strength Index:13.1-12.3-4.3


Bitcoin Futures:

Bitcoin Crypto Futures COT ChartThe Bitcoin large speculator standing this week was a net position of 2,253 contracts in the data reported through Tuesday. This was a weekly rise of 147 contracts from the previous week which had a total of 2,106 net contracts.

This week’s current strength score (the trader positioning range over the past three years, measured from 0 to 100) shows the speculators are currently Bullish-Extreme with a score of 100.0 percent. The commercials are Bearish-Extreme with a score of 16.3 percent and the small traders (not shown in chart) are Bearish-Extreme with a score of 14.3 percent.

Price Trend-Following Model: Downtrend

Our weekly trend-following model classifies the current market price position as: Downtrend.

BITCOIN StatisticsSPECULATORSCOMMERCIALSSMALL TRADERS
– Percent of Open Interest Longs:72.30.83.9
– Percent of Open Interest Shorts:61.49.66.1
– Net Position:2,253-1,809-444
– Gross Longs:14,914168805
– Gross Shorts:12,6611,9771,249
– Long to Short Ratio:1.2 to 10.1 to 10.6 to 1
NET POSITION TREND:
– Strength Index Score (3 Year Range Pct):100.016.314.3
– Strength Index Reading (3 Year Range):Bullish-ExtremeBearish-ExtremeBearish-Extreme
NET POSITION MOVEMENT INDEX:
– 6-Week Change in Strength Index:13.0-2.3-26.6


Article By InvestMacroReceive our weekly COT Reports by Email

*COT Report: The COT data, released weekly to the public each Friday, is updated through the most recent Tuesday (data is 3 days old) and shows a quick view of how large speculators or non-commercials (for-profit traders) were positioned in the futures markets.

The CFTC categorizes trader positions according to commercial hedgers (traders who use futures contracts for hedging as part of the business), non-commercials (large traders who speculate to realize trading profits) and nonreportable traders (usually small traders/speculators) as well as their open interest (contracts open in the market at time of reporting).See CFTC criteria here.
All information and opinions on this website and contained in this article are for general informational purposes only and do not constitute investment advice.

GBP/USD: Geopolitical Tensions Drive Pound Selling

By Analytical Department RoboForex

GBP/USD stabilised around 1.3227 on Friday following a sharp decline the previous day. Rising geopolitical tensions have weighed on the pound following fresh statements from US President Donald Trump. Increased military rhetoric towards Iran and the lack of clarity regarding the reopening of the Strait of Hormuz have led to a jump in oil prices and heightened demand for the US dollar as a safe-haven asset.

Additional pressure on the pound stems from the UK’s heavy reliance on energy imports and concerns about public finances. Yields on British government bonds have risen in tandem with energy prices, adding further strain on the currency.

Overall, market dynamics are unfolding in accordance with a classic risk-off scenario. Rising oil prices and heightened geopolitical risks are weighing on most assets, while the US dollar remains the key safe-haven currency.

Sterling had already fallen approximately 1.9% against the dollar in March amid fears of an energy shock.

Technical Analysis

On the H4 GBP/USD chart, the market is forming a broad consolidation range around the 1.3250 level, currently extending down to 1.3180. A short-term move towards 1.3250 is expected. Following the completion of this correction, a new consolidation range is likely to form. An upside breakout would open the way for a continuation move to 1.3300, while a downside breakout would suggest further movement to 1.3100. Technically, this scenario is confirmed by the MACD indicator, with its signal line below zero and pointing firmly downwards.

On the H1 chart, the market has formed a compact consolidation range around 1.3254. A downside breakout has initiated a wave structure extending to 1.3100. Should this level be breached, further downside potential towards 1.3050 would emerge. Conversely, an upside breakout from the range may trigger a rebound to 1.3300. Technically, this scenario is confirmed by the Stochastic oscillator, with its signal line below 50 and pointing downwards.

Conclusion

GBP/USD remains under sustained pressure as President Trump’s escalated military rhetoric towards Iran and the unresolved status of the Strait of Hormuz drive oil prices higher, bolstering safe-haven demand for the US dollar. The UK’s energy import dependence and fragile public finances leave sterling particularly vulnerable in this risk-off environment. Having already lost nearly 2% in March, the pound faces continued headwinds, with technical indicators pointing to further downside potential. Near-term stabilisation is possible, but any sustained recovery would likely require a tangible de-escalation in geopolitical tensions or a shift in broader risk sentiment.


Disclaimer

Any forecasts contained herein are based on the author’s particular opinion. This analysis may not be treated as trading advice. RoboForex bears no responsibility for trading results based on trading recommendations and reviews contained herein.

USD/JPY – Yen Weakens Amid Geopolitical Uncertainty

By Analytical Department RoboForex

USD/JPY rose to 159.39 on Thursday, as the yen weakened amid conflicting signals from Donald Trump on a possible de-escalation of the Middle East conflict. The situation continues to support the US dollar while weighing on the yen.

The US currency strengthened following reports that the operation in Iran is “close to completion” and could achieve its goals in the coming weeks. However, these statements were accompanied by warnings of a potential escalation in hostilities. At the same time, Trump emphasised that diplomatic contacts are ongoing, keeping investors cautious and maintaining heightened attention to geopolitical risks.

For Japan, the situation remains sensitive: the country relies heavily on oil imports from the Middle East, and fuel prices reached record levels in March, although they have since eased slightly supported by government subsidies.

New Bank of Japan board member Toichiro Asada has signalled a preference for a cautious, data-driven approach. He joins the council ahead of the 27–28 April meeting, where markets currently price in a probability of a rate hike at approximately 70%.

Technical Analysis

On the H4 chart, USD/JPY is forming a consolidation range around 159.10. The range is expected to expand to 159.50 today, followed by a decline to 157.70. An upside breakout could lead to a correction to 160.40, after which a new downward impulse to 157.70 is anticipated, with the prospect of a continued move towards 156.00. The MACD indicator confirms this scenario, with its signal line below zero and pointing firmly downwards, supporting the potential for the downtrend to continue.

On the H1 chart, the market is forming an advance towards 159.50 and is likely to reach the target today. Following this, a downward wave to 157.70 (testing from below) is possible. The Stochastic oscillator confirms this structure, with its signal line above 80 and pointing firmly downwards, indicating continued short-term downside potential.

Conclusion

USD/JPY remains in positive territory, with conflicting signals from the US over Middle East de-escalation creating an uncertain backdrop that favours the dollar over the yen. While reports of progress in the Iran operation have supported the greenback, ongoing diplomatic contacts and warnings of escalation keep markets on edge. Japan’s sensitivity to oil price fluctuations adds to yen pressure, although government subsidies provide partial relief. With a new BoJ board member advocating a cautious approach and markets pricing in a 70% probability of a rate hike at the April meeting, the yen’s near-term trajectory will likely depend on both geopolitical developments and upcoming policy signals from Tokyo. Technical indicators point to a possible short-term correction lower.


Disclaimer

Any forecasts contained herein are based on the author’s particular opinion. This analysis may not be treated as trading advice. RoboForex bears no responsibility for trading results based on trading recommendations and reviews contained herein.

A Major Currency Event is Unfolding

Source: Barry Dawes (3/31/26) 

With Operation Epic Fury still on everyone’s minds, Barry Dawes of Martin Place Securities shares his thoughts on the market and where currencies are headed.

Epic Fury is still the focus and the implications are that a long war with boots on the ground will be endless and energy prices will strangle the world economy.

But it probably won’t run that way.

There is another government working in Iran that let 10 tankers through the Strait of Hormuz.

In addition, the UAE is moving to reclaim three islands after the November 1971 Seizure (or Occupation) of Abu Musa and the Greater and Lesser Tunbs.

Change in control here could also change the control of the flow of tankers in the Strait.

The IRGC is now severely weakened and as an invading Terrorist government it is soon likely to be overthrown by the 55m Persians (60% of a 90million population).

Rear guard actions from an ever-dwindling IRGC are likely to just fizzle out.

No boots on the ground for this one.

Treasury Secretary Bessent says >400m bbls of oil are available in floating and other storage to ease pressures.

Oil was looking toppy in Friday’s US markets, and although it is higher today in Asian trading, let’s see where it settles overnight.

Gold

Still doesn’t look like time for a reversal.

Oversold, but the technicals for a reversal are not quite there.

Did gold complete a `C’ Wave as the end of the correction to mark the end of Wave 4?

The gold bulls think so.

So now off to wave 5 and a new high.

This is now the most widely accepted view in the market.

But if it does, it WILL then mark the end of this bull market.

So that is probably not the most likely outcome.

Do keep in mind it is just possible every rally will be sold into because so many late entrants in gold are underwater.

So just let the markets tell us what the next move is.

But also watch the currencies as well as noted below.

Silver

The silver squeeze doesn’t seem to have eventuated.

Silver and silver stocks are just having spike highs.

Gold Stocks

Spike highs here, too, in the long-term charts.

It’s hard to imagine new surges with the long-term so strongly overbought.

These indices need to turn up quickly, or they will become continuation patterns and not reversal patterns.

Individual stocks aren’t showing constructive reversal patterns.

No high volume in the right places.

ASX Gold Index

The ASX Gold Index has 55 stocks again.

Last time it had this many was in 2011.

Was down to sub 20 in 2014.

There was a big volume and value on March 20, but less in the low of March 23, and steadily lower each day since.

Peak volume was on March 20, but the low was on March 23.

Even more concerning is that transactions from October 1, 2025, to February 28, 2026, totalling AU$91.6bn and 33.3bn shares are all in losing positions at today’s price level.

This is a major overhang.

Volume needs to pick up soon.

Except TOK, of course.

Currencies

European currencies and the Yen are heading much lower.

These falling currencies won’t help the gold bull case.

Energy importers are going to suffer.

The Yen is very close to the mid-2024 low, and after that, it is just a 25% fall in a short time.

The Euro failed to break above its 50 year uptrend and has turned down to fall below parity and probably thereafter to its demise.

NATO is indeed a paper tiger, and Western Europe will be left defenceless.

High taxes, big debts, no oil or gas, mass immigration, and tyrannical bureaucrats in charge.

The EU can’t possibly hold together for much longer.

The GB Pound failed to break long-term resistance and is now heading down.

The SF also failed to break higher and regain strength above its 50-year uptrend.

Upsloping wedge says heading back to parity.

Stupidity and arrogance are leaving Western Europe increasingly irrelevant to the world economy of the decades ahead.

And there are some other currencies to watch.

This one does not look good either. It could break US$0.70.

The Chinese Yuan looks vulnerable to a downdraft as well.

US Dollar

The Australian Dollar

The AU$ has made important breakouts many other currencies.

These are very positive factors in the outlook for the next decade.

Head the markets.


Important Disclosures:

  1. As of the date of this article, officers, contractors, shareholders, and/or employees of Streetwise Reports LLC (including members of their household) own securities of Pan American Silver Corp., Barrick Mining Corp., and Agnico Eagle Mines Ltd.
  2. Barry Dawes: I, or members of my immediate household or family, own securities of: TOK. My company has a financial relationship with: None. My company has purchased stocks mentioned in this article for my management clients: None. I determined which companies would be included in this article based on my research and understanding of the sector.
  3. Statements and opinions expressed are the opinions of the author and not of Streetwise Reports, Street Smart, or their officers. The author is wholly responsible for the accuracy of the statements. Streetwise Reports was not paid by the author to publish or syndicate this article. Streetwise Reports requires contributing authors to disclose any shareholdings in, or economic relationships with, companies that they write about. Any disclosures from the author can be found  below. Streetwise Reports relies upon the authors to accurately provide this information and Streetwise Reports has no means of verifying its accuracy.
  4.  This article does not constitute investment advice and is not a solicitation for any investment. Streetwise Reports does not render general or specific investment advice and the information on Streetwise Reports should not be considered a recommendation to buy or sell any security. Each reader is encouraged to consult with his or her personal financial adviser and perform their own comprehensive investment research. By opening this page, each reader accepts and agrees to Streetwise Reports’ terms of use and full legal disclaimer. Streetwise Reports does not endorse or recommend the business, products, services or securities of any company.

For additional disclosures, please click here.
GBP/USD – pause for recovery needed after five-day sell-off

By Analytical Department RoboForex

GBP/USD is attempting to recover on Tuesday following earlier declines, bouncing from 1.3198 after five consecutive sessions of selling. Sterling remains under pressure as investors assess the impact of the Iran conflict on the British economy.

Despite this, since the beginning of March, the pound has remained one of the most stable currencies against the dollar.

However, sterling remains vulnerable. Britain’s high reliance on gas imports, persistently high inflation, and pressure on public finances are heightening risks. The yield on 10-year government bonds is holding around 4.98%, near highs not seen since 2008, following recent increases.

Additional attention is focused on the debt market: after the government bond sale, some pension funds were required to increase collateral to hedge positions, although the scale remains far from the 2022 crisis levels.

Macroeconomic data also point to a slowing economy. Business activity is growing at its slowest pace in six months, producer costs are accelerating, and retail sales are declining.

The Bank of England is likely to remain cautious about changing rates – this remains the prevailing expectation.

Technical Analysis

On the H4 GBP/USD chart, the market is forming a broad consolidation range around 1.3297, currently extending up to 1.3434. A decline to 1.3156 is likely in the near term, followed by the formation of a new consolidation range. An upside breakout would open the way for a continuation move to 1.3300, while a downside breakout would suggest further movement to 1.3100. Technically, this scenario is confirmed by the MACD indicator, whose signal line is below zero and pointing downwards.

On the H1 chart, the market has formed a compact consolidation range around 1.3322. A downside breakout has initiated a wave structure extending to 1.3100. Should this level be breached, further downside potential towards 1.3050 would emerge. Conversely, an upside breakout from the range could trigger a rebound towards 1.3300. Technically, this scenario is confirmed by the Stochastic oscillator, with its signal line below 50 and pointing downwards.

Conclusion

GBP/USD is attempting to stabilise after five consecutive days of selling, though the broader outlook remains fragile. While sterling has shown relative resilience compared to other currencies since March, mounting headwinds – including the UK’s energy import dependence, stubborn inflation, debt market pressures, and slowing economic activity – continue to weigh on the pound. The Bank of England’s cautious stance offers little immediate support, and technical indicators point to further downside potential. A recovery pause may materialise, but sustained upside appears unlikely without a tangible shift in either geopolitical tensions or domestic economic data.


Disclaimer

Any forecasts contained herein are based on the author’s particular opinion. This analysis may not be treated as trading advice. RoboForex bears no responsibility for trading results based on trading recommendations and reviews contained herein.