
By InvestMacro
Here are the latest charts and statistics for the Commitment of Traders (COT) data published by the Commodities Futures Trading Commission (CFTC).
The latest COT data is updated through Tuesday April 21st and shows a quick view of how large market participants (for-profit speculators and commercial traders) were positioned in the futures markets. All currency positions are in direct relation to the US Dollar where, for example, a bet for the Euro is a bet that the Euro will rise versus the Dollar while a bet against the Euro will be a bet that the Euro will decline versus the Dollar.
Weekly Speculator Changes led by Canadian Dollar & Euro
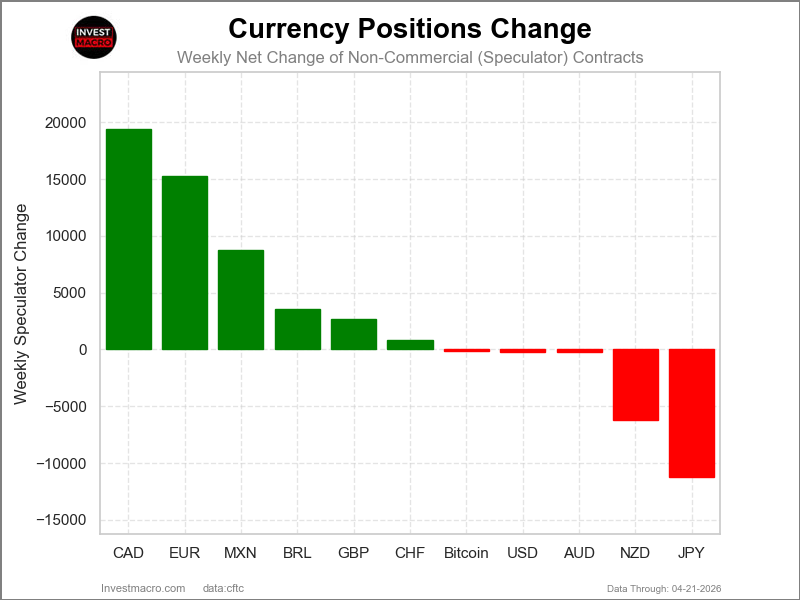
The COT currency market speculator bets were overall higher this week as six out of the eleven currency markets we cover had higher positioning while the other five markets had lower speculator contracts.
Leading the gains for the currency markets was the Canadian Dollar (19,438 contracts) with the EuroFX (15,306 contracts), Mexican Peso (8,747 contracts), Brazilian Real (3,558 contracts), British Pound (2,685 contracts) and the Swiss Franc (824 contracts) also showing positive weeks.
Free Reports:
 Sign Up for Our Stock Market Newsletter – Get updated on News, Charts & Rankings of Public Companies when you join our Stocks Newsletter
 Get our Weekly Commitment of Traders Reports - See where the biggest traders (Hedge Funds and Commercial Hedgers) are positioned in the futures markets on a weekly basis.
The currencies seeing declines in speculator bets on the week were the Japanese Yen (-11,252 contracts) and the New Zealand Dollar (-6,178 contracts), the Australian Dollar (-258 contracts), the US Dollar Index (-187 contracts) and Bitcoin (-122 contracts) also registering lower bets on the week.
Canadian Dollar and Euro Bets Rebound This Week
Leading the Currency market speculator positioning this week were strong bets for the Euro and the Canadian Dollar.
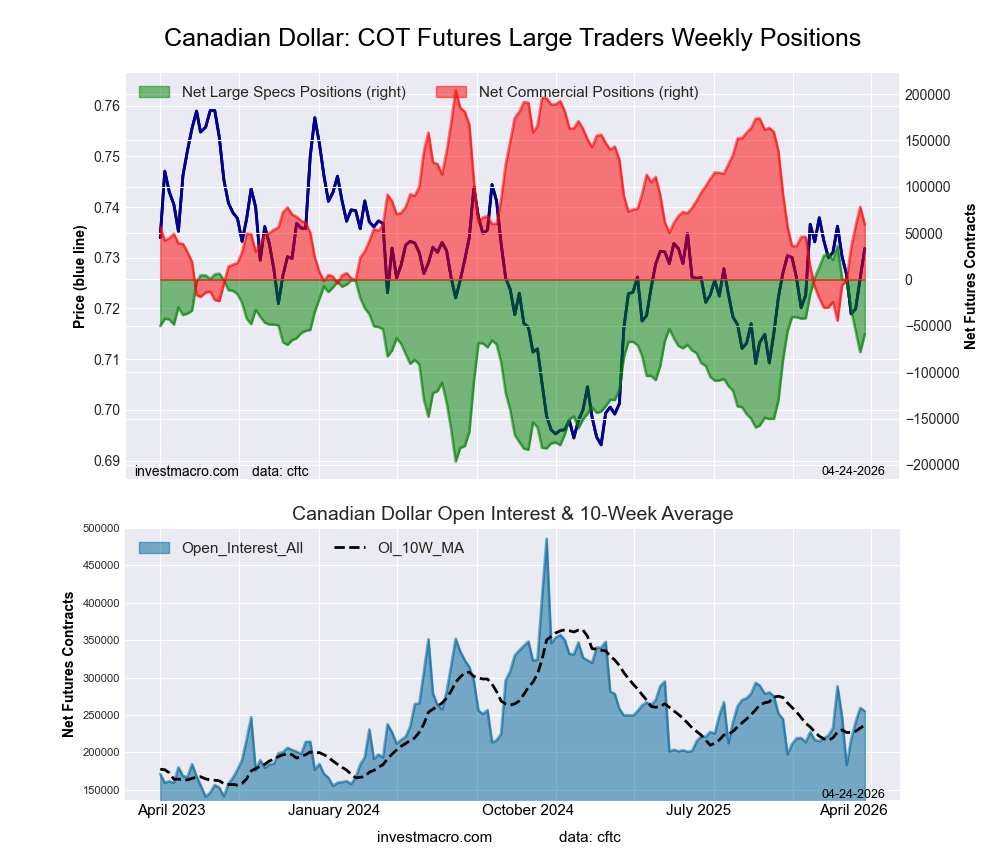
First up, the Canadian Dollar positions jumped by 19,438 contracts this week following five consecutive weeks of strong declines. The recent weakness had brought the Canadian Dollar position from a bullish level on March 10 to the most bearish position of the past 18 weeks last week. This week’s rebound halts the slide in net positioning, but the Canadian Dollar position remains in an overall bearish standing at -58,834 net contracts. The Canadian Dollar exchange rate in the Currency markets has risen for three consecutive weeks and closed out this week around the 0.7332 exchange level. The CAD is trading right up against the 200-week moving average currently, and further movement above could see the Canadian Dollar test the 0.7400 major resistance that has capped prices many times dating back to June 2025.
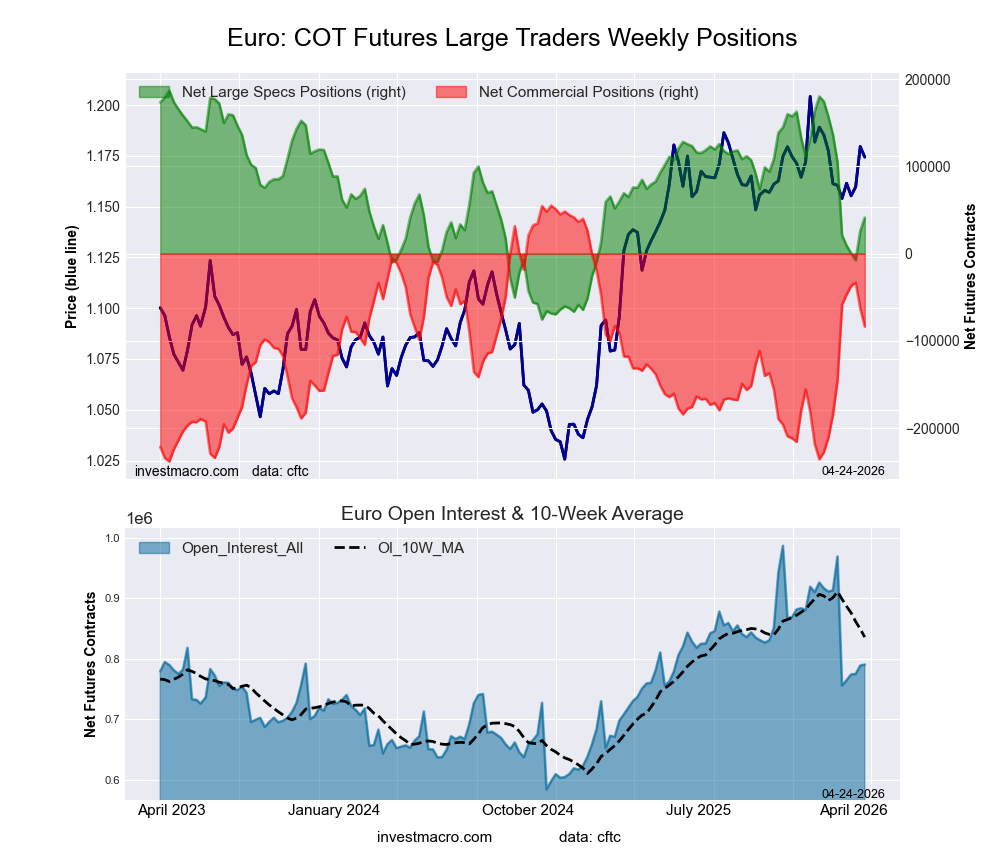
The Euro speculator positioning this week jumped by over 15,000 contracts and follows up last week’s strong gain of over 33,000 contracts. These two weeks of strong gains have brought the overall net standing for the Euro back into bullish territory after spending one week (on April 7) in bearish territory. Previously, the Euro was consistently sitting in strong bullish territory for a time-frame from March 2025 until March 2026, with most weeks above +100,000 contracts. Since March 10th, the Euro positioning took a deep dive and culminated in a negative position on April 7 at -7,541 contracts. With a couple of strong weeks, the position is back above +41,324 contracts this week. In the Foreign Exchange market, the Euro continues to trade within its band of recent action between 1.1500 on the downside for support and 1.1900 on the upside, providing resistance. This week, the Euro fell modestly after three straight weeks of gains and closed out the week at 1.1745 against the US Dollar.
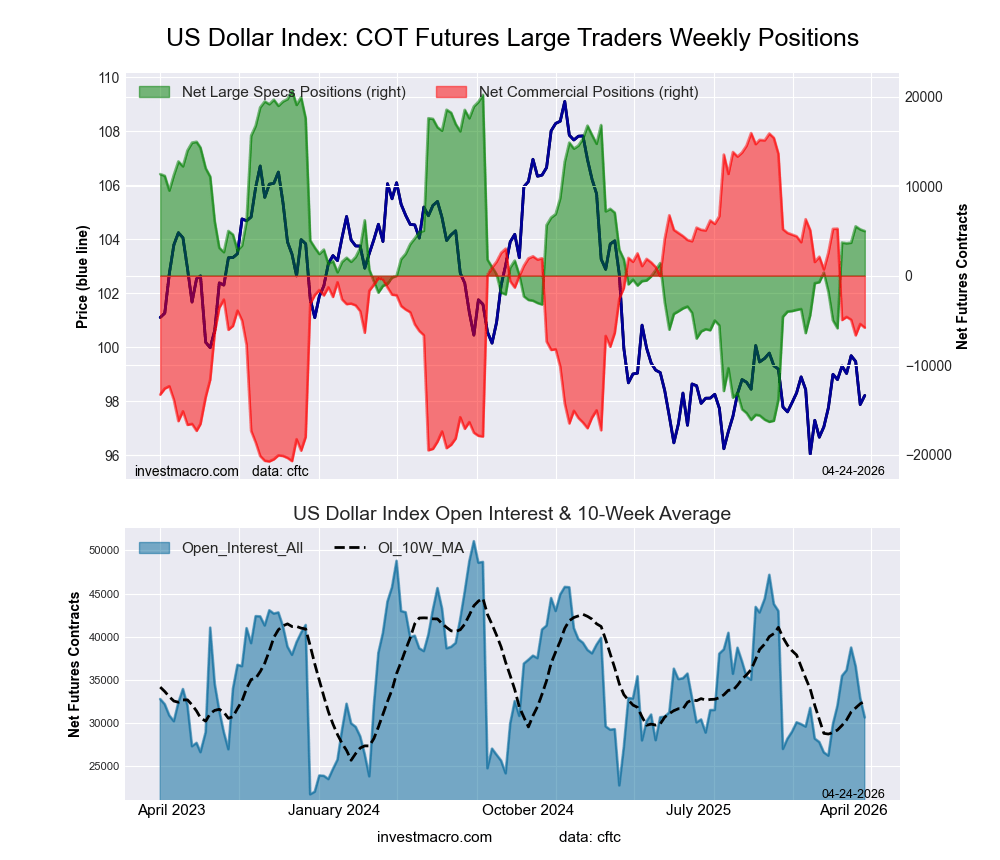
The US Dollar Index speculator position continues to be in a small bullish level. The Dollar Index speculator bets have fallen by very small amounts over the past two weeks with declines of -341 contracts and this week’s -187 contracts shortfall. The net position is currently at 4,983 net contracts, and the US Dollar overall positioning has now been in bullish territory for six consecutive weeks. In the Foreign Exchange markets, the US Dollar Index has remained within a band of support and resistance levels recently with support below at 96.75 and resistance above at 100.00. Currently, US Dollar Index price is trading around 98.36.
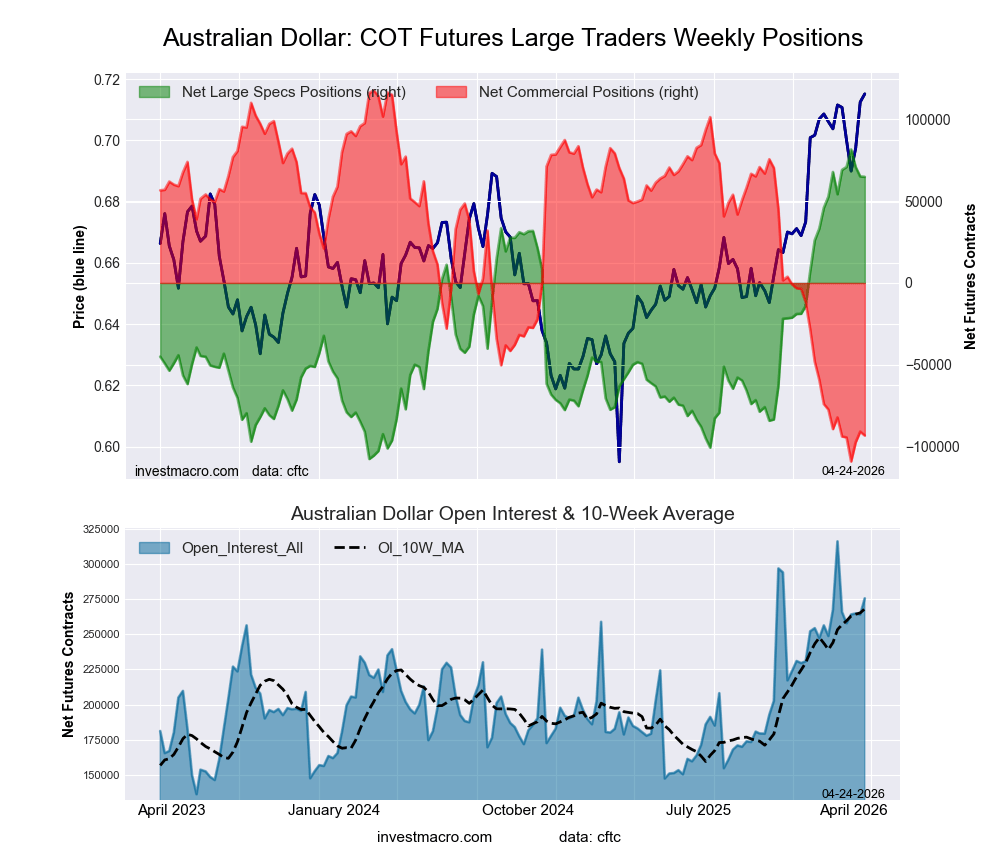
The Australian Dollar remains the most bullish of the speculator positioning of the Currencies currently. The AUD strength score (which is a score of today’s position compared to the past 3-years range) sits at an Extreme-Bullish reading at 91.2%. However, the Australian Dollar speculator position has been weakening a bit recently and this week fell for a third consecutive week. The overall net position is at its lowest level of the past six weeks at a total net position of 64,817 contracts but remains above the 2026 (so far) weekly average of 41,083 contracts. In the Foreign Exchange markets, the Australian Dollar has continued to show its strength as it trades currently at 0.7146. The Aussie has gained for four consecutive weeks and remains near the top of its range and best trading levels since June 2022 (vs the USD).
Bitcoin leads the price gains in Currency performances this week
Bitcoin was the biggest winner on the week for currency price performance returns with a 5.13% increase. The Brazilian Real came in second with a 0.53% rise while the New Zealand Dollar came in next with a 0.33% gain. The British Pound was higher by 0.28%. The Canadian Dollar was up by 0.25%, and the US Dollar Index was higher by 0.23%. The Australian Dollar capped off the gainers this week with a 0.22% rise.
On the downside, the Swiss Franc edged lower by -0.15% followed by the Japanese Yen which fell by -0.16%. The Mexican Peso saw lower levels by -0.17%, and the Euro saw a modest shortfall by -0.19% on the week.
Currencies Data:
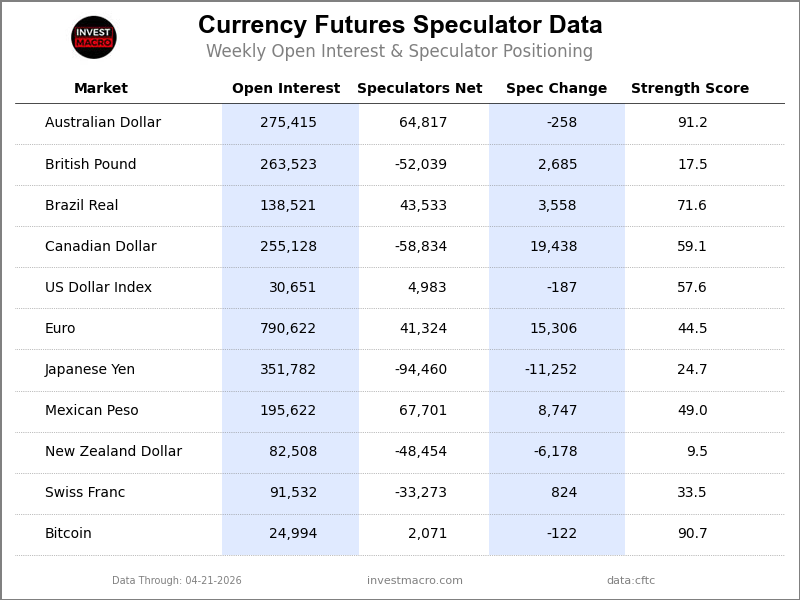
Legend: Open Interest | Speculators Current Net Position | Weekly Specs Change | Specs Strength Score compared to last 3-Years (0-100 range)
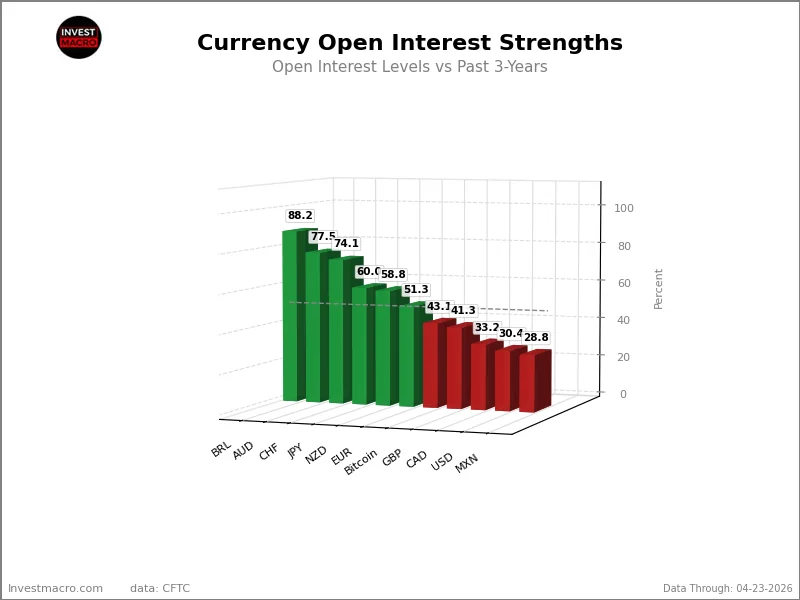
Strength Scores led by Australian Dollar & Bitcoin
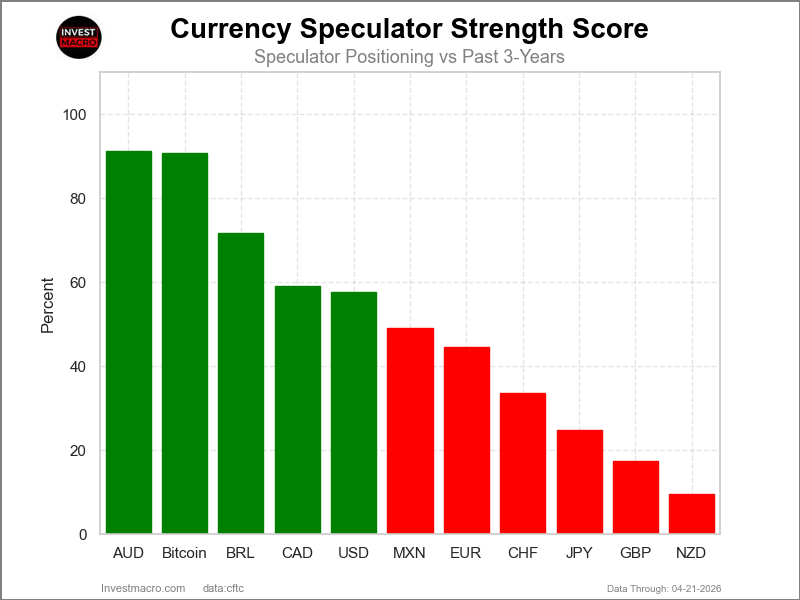
COT Strength Scores (a normalized measure of Speculator positions over a 3-Year range, from 0 to 100 where above 80 is Extreme-Bullish and below 20 is Extreme-Bearish) showed that the Australian Dollar (91 percent) and Bitcoin (91 percent) lead the currency markets this week. The Brazilian Real (72 percent), Canadian Dollar (59 percent) and the US Dollar Index (58 percent) come in as the next highest in the weekly strength scores.
On the downside, the New Zealand Dollar (10 percent) and the British Pound (17 percent) come in at the lowest strength levels currently and are in Extreme-Bearish territory (below 20 percent). The next lowest strength scores are the Japanese Yen (25 percent) and the Swiss Franc (33 percent).
3-Year Strength Statistics:
US Dollar Index (57.6 percent) vs US Dollar Index previous week (58.1 percent)
EuroFX (44.5 percent) vs EuroFX previous week (38.7 percent)
British Pound Sterling (17.5 percent) vs British Pound Sterling previous week (16.4 percent)
Japanese Yen (24.7 percent) vs Japanese Yen previous week (27.8 percent)
Swiss Franc (33.5 percent) vs Swiss Franc previous week (31.8 percent)
Canadian Dollar (59.1 percent) vs Canadian Dollar previous week (50.8 percent)
Australian Dollar (91.2 percent) vs Australian Dollar previous week (91.3 percent)
New Zealand Dollar (9.5 percent) vs New Zealand Dollar previous week (16.6 percent)
Mexican Peso (49.0 percent) vs Mexican Peso previous week (42.8 percent)
Brazilian Real (71.6 percent) vs Brazilian Real previous week (69.0 percent)
Bitcoin (90.7 percent) vs Bitcoin previous week (93.1 percent)
US Dollar Index & Swiss Franc top the 6-Week Strength Trends
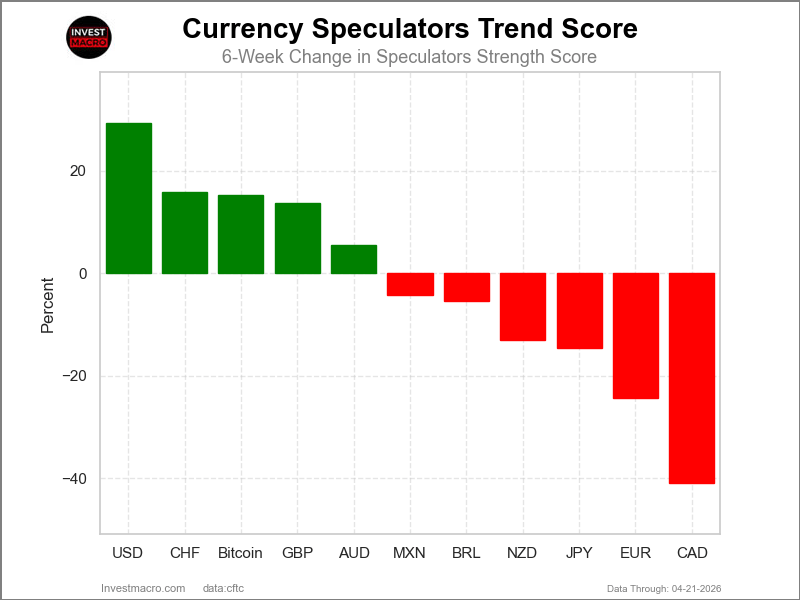
COT Strength Score Trends (or move index, calculates the 6-week changes in strength scores) showed that the US Dollar Index (29 percent) and the Swiss Franc (16 percent) lead the past six weeks trends for the currencies. The Bitcoin (15 percent), the British Pound (14 percent) and the Australian Dollar (6 percent) are the next highest positive movers in the 3-Year trends data.
The Canadian Dollar (-41 percent) leads the downside trend scores currently with the EuroFX (-24 percent), Japanese Yen (-15 percent) and the New Zealand Dollar (-13 percent) following next with lower trend scores.
3-Year Strength Trends:
US Dollar Index (29.3 percent) vs US Dollar Index previous week (27.4 percent)
EuroFX (-24.3 percent) vs EuroFX previous week (-42.1 percent)
British Pound Sterling (13.7 percent) vs British Pound Sterling previous week (7.6 percent)
Japanese Yen (-14.6 percent) vs Japanese Yen previous week (-18.3 percent)
Swiss Franc (15.8 percent) vs Swiss Franc previous week (14.6 percent)
Canadian Dollar (-40.9 percent) vs Canadian Dollar previous week (-42.7 percent)
Australian Dollar (5.6 percent) vs Australian Dollar previous week (-1.4 percent)
New Zealand Dollar (-13.0 percent) vs New Zealand Dollar previous week (-9.1 percent)
Mexican Peso (-4.3 percent) vs Mexican Peso previous week (-12.8 percent)
Brazilian Real (-5.5 percent) vs Brazilian Real previous week (-3.6 percent)
Bitcoin (15.3 percent) vs Bitcoin previous week (23.5 percent)
Individual COT Forex Markets:
US Dollar Index Futures:
 Positioning Notes:
- US Dollar Index large speculator standing this week reached a net position of 4,983 contracts in the data reported through Tuesday.
- Weekly Speculator position decrease of -187 contracts from the previous week which had a total of 5,170 net contracts.
- This week’s current strength score (range over the past 3 years, measured from 0 to 100) shows the speculators are currently Bullish with a score of 57.6 percent.
- The Commercials are Bearish with a score of 40.7 percent.
- The Small Traders (not shown in chart) are Bullish with a score of 53.5 percent.
Price Trend-Following Model: Weak Uptrend
Our weekly trend-following model classifies the current market price position as: Weak Uptrend.
| US DOLLAR INDEX Statistics | SPECULATORS | COMMERCIALS | SMALL TRADERS |
| – Percent of Open Interest Longs: | 57.5 | 26.4 | 9.0 |
| – Percent of Open Interest Shorts: | 41.2 | 45.4 | 6.3 |
| – Net Position: | 4,983 | -5,814 | 831 |
| – Gross Longs: | 17,617 | 8,093 | 2,750 |
| – Gross Shorts: | 12,634 | 13,907 | 1,919 |
| – Long to Short Ratio: | 1.4 to 1 | 0.6 to 1 | 1.4 to 1 |
| NET POSITION TREND: | |||
| – Strength Index Score (3 Year Range Pct): | 57.6 | 40.7 | 53.5 |
| – Strength Index Reading (3 Year Range): | Bullish | Bearish | Bullish |
| NET POSITION MOVEMENT INDEX: | |||
| – 6-Week Change in Strength Index: | 29.3 | -30.1 | 3.5 |
Euro Currency Futures:
 Positioning Notes:
- Euro Currency large speculator standing this week reached a net position of 41,324 contracts in the data reported through Tuesday.
- Weekly Speculator position lift of 15,306 contracts from the previous week which had a total of 26,018 net contracts.
- This week’s current strength score (range over the past 3 years, measured from 0 to 100) shows the speculators are currently Bearish with a score of 44.5 percent.
- The Commercials are Bullish with a score of 52.7 percent.
- The Small Traders (not shown in chart) are Bullish with a score of 63.9 percent.
Price Trend-Following Model: Weak Downtrend
Our weekly trend-following model classifies the current market price position as: Weak Downtrend.
| EURO Currency Statistics | SPECULATORS | COMMERCIALS | SMALL TRADERS |
| – Percent of Open Interest Longs: | 27.5 | 58.2 | 11.0 |
| – Percent of Open Interest Shorts: | 22.3 | 68.7 | 5.6 |
| – Net Position: | 41,324 | -83,663 | 42,339 |
| – Gross Longs: | 217,407 | 459,844 | 86,804 |
| – Gross Shorts: | 176,083 | 543,507 | 44,465 |
| – Long to Short Ratio: | 1.2 to 1 | 0.8 to 1 | 2.0 to 1 |
| NET POSITION TREND: | |||
| – Strength Index Score (3 Year Range Pct): | 44.5 | 52.7 | 63.9 |
| – Strength Index Reading (3 Year Range): | Bearish | Bullish | Bullish |
| NET POSITION MOVEMENT INDEX: | |||
| – 6-Week Change in Strength Index: | -24.3 | 21.0 | 4.4 |
British Pound Sterling Futures:
 Positioning Notes:
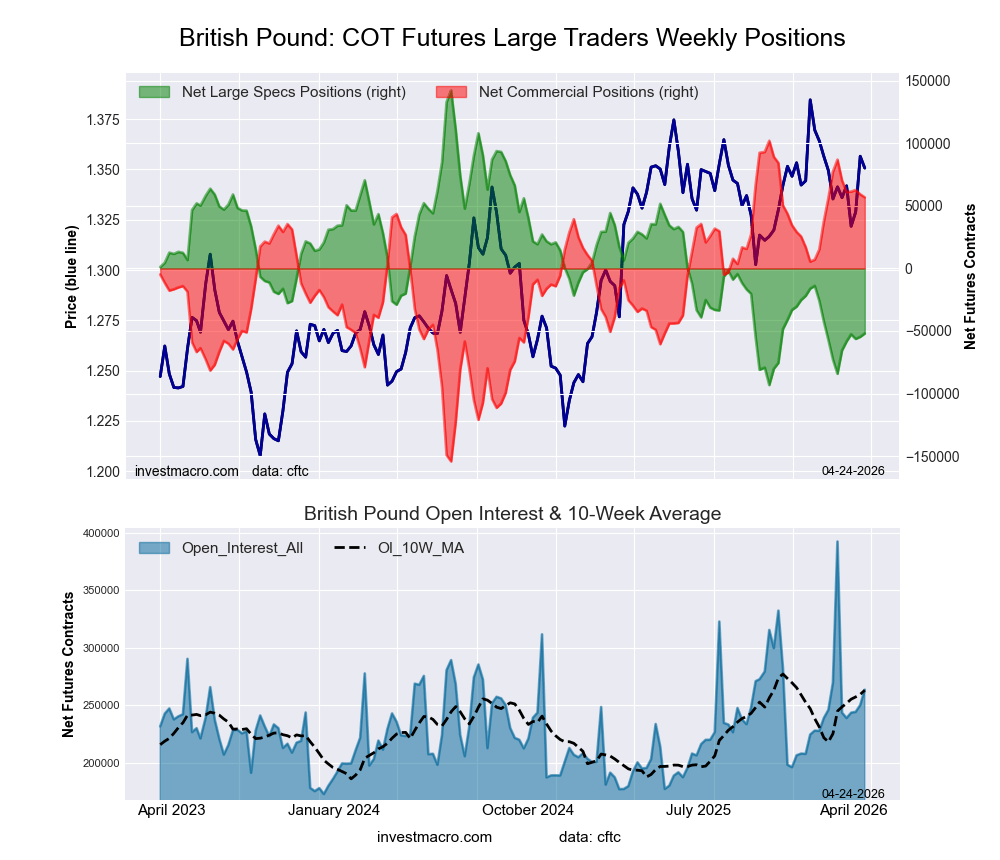
- British Pound Sterling large speculator standing this week reached a net position of -52,039 contracts in the data reported through Tuesday.
- Weekly Speculator position boost of 2,685 contracts from the previous week which had a total of -54,724 net contracts.
- This week’s current strength score (range over the past 3 years, measured from 0 to 100) shows the speculators are currently Bearish-Extreme with a score of 17.5 percent.
- The Commercials are Bullish-Extreme with a score of 82.4 percent.
- The Small Traders (not shown in chart) are Bearish with a score of 40.8 percent.
Price Trend-Following Model: Weak Downtrend
Our weekly trend-following model classifies the current market price position as: Weak Downtrend.
| BRITISH POUND Statistics | SPECULATORS | COMMERCIALS | SMALL TRADERS |
| – Percent of Open Interest Longs: | 23.9 | 65.6 | 9.2 |
| – Percent of Open Interest Shorts: | 43.7 | 44.0 | 11.1 |
| – Net Position: | -52,039 | 56,839 | -4,800 |
| – Gross Longs: | 63,086 | 172,752 | 24,374 |
| – Gross Shorts: | 115,125 | 115,913 | 29,174 |
| – Long to Short Ratio: | 0.5 to 1 | 1.5 to 1 | 0.8 to 1 |
| NET POSITION TREND: | |||
| – Strength Index Score (3 Year Range Pct): | 17.5 | 82.4 | 40.8 |
| – Strength Index Reading (3 Year Range): | Bearish-Extreme | Bullish-Extreme | Bearish |
| NET POSITION MOVEMENT INDEX: | |||
| – 6-Week Change in Strength Index: | 13.7 | -11.7 | -5.4 |
Japanese Yen Futures:
 Positioning Notes:
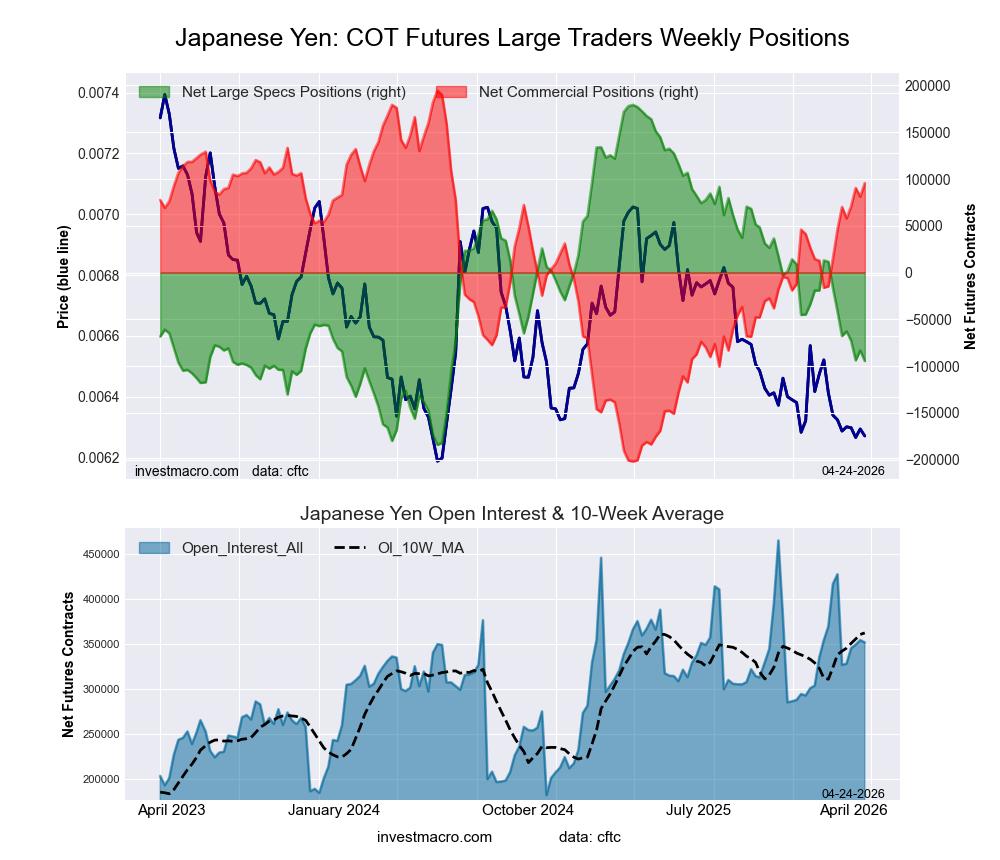
- Japanese Yen large speculator standing this week reached a net position of -94,460 contracts in the data reported through Tuesday.
- Weekly Speculator position decline of -11,252 contracts from the previous week which had a total of -83,208 net contracts.
- This week’s current strength score (range over the past 3 years, measured from 0 to 100) shows the speculators are currently Bearish with a score of 24.7 percent.
- The Commercials are Bullish with a score of 75.0 percent.
- The Small Traders (not shown in chart) are Bearish with a score of 34.1 percent.
Price Trend-Following Model: Downtrend
Our weekly trend-following model classifies the current market price position as: Downtrend.
| JAPANESE YEN Statistics | SPECULATORS | COMMERCIALS | SMALL TRADERS |
| – Percent of Open Interest Longs: | 28.8 | 53.6 | 11.3 |
| – Percent of Open Interest Shorts: | 55.7 | 26.5 | 11.6 |
| – Net Position: | -94,460 | 95,467 | -1,007 |
| – Gross Longs: | 101,386 | 188,723 | 39,688 |
| – Gross Shorts: | 195,846 | 93,256 | 40,695 |
| – Long to Short Ratio: | 0.5 to 1 | 2.0 to 1 | 1.0 to 1 |
| NET POSITION TREND: | |||
| – Strength Index Score (3 Year Range Pct): | 24.7 | 75.0 | 34.1 |
| – Strength Index Reading (3 Year Range): | Bearish | Bullish | Bearish |
| NET POSITION MOVEMENT INDEX: | |||
| – 6-Week Change in Strength Index: | -14.6 | 12.5 | 9.2 |
Swiss Franc Futures:
 Positioning Notes:
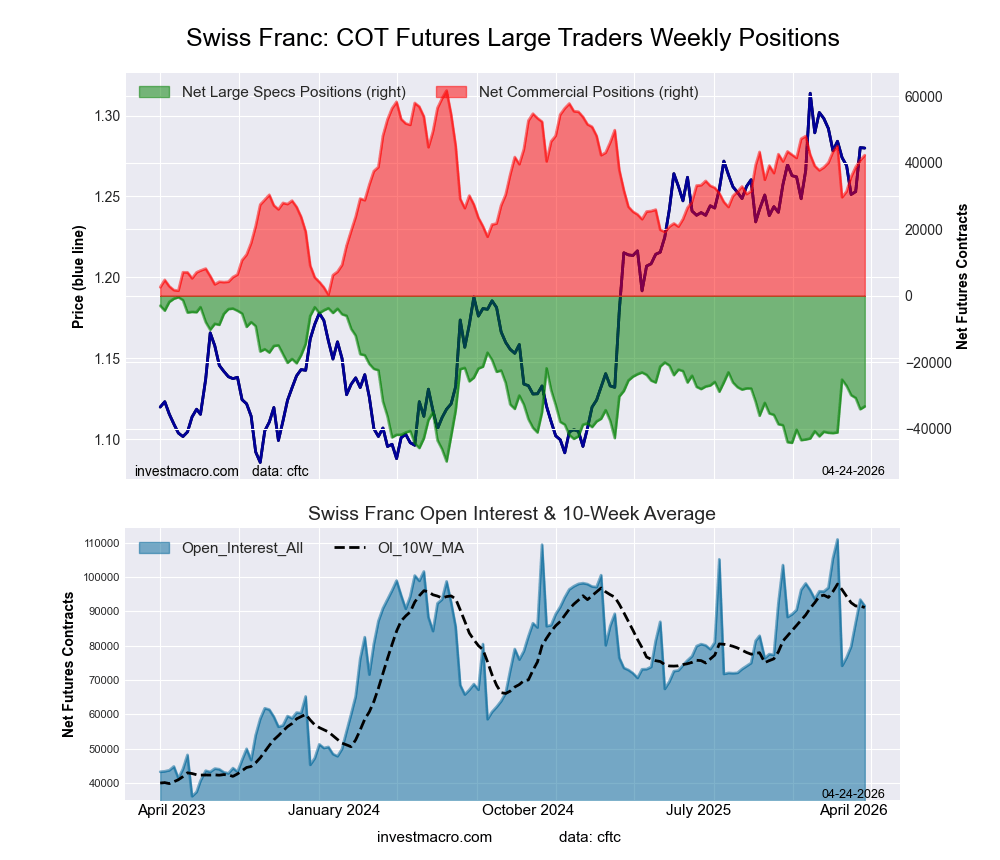
- Swiss Franc large speculator standing this week reached a net position of -33,273 contracts in the data reported through Tuesday.
- Weekly Speculator position gain of 824 contracts from the previous week which had a total of -34,097 net contracts.
- This week’s current strength score (range over the past 3 years, measured from 0 to 100) shows the speculators are currently Bearish with a score of 33.5 percent.
- The Commercials are Bullish with a score of 68.4 percent.
- The Small Traders (not shown in chart) are Bearish with a score of 40.7 percent.
Price Trend-Following Model: Uptrend
Our weekly trend-following model classifies the current market price position as: Uptrend.
| SWISS FRANC Statistics | SPECULATORS | COMMERCIALS | SMALL TRADERS |
| – Percent of Open Interest Longs: | 9.1 | 78.4 | 12.2 |
| – Percent of Open Interest Shorts: | 45.5 | 32.2 | 22.0 |
| – Net Position: | -33,273 | 42,255 | -8,982 |
| – Gross Longs: | 8,372 | 71,762 | 11,159 |
| – Gross Shorts: | 41,645 | 29,507 | 20,141 |
| – Long to Short Ratio: | 0.2 to 1 | 2.4 to 1 | 0.6 to 1 |
| NET POSITION TREND: | |||
| – Strength Index Score (3 Year Range Pct): | 33.5 | 68.4 | 40.7 |
| – Strength Index Reading (3 Year Range): | Bearish | Bullish | Bearish |
| NET POSITION MOVEMENT INDEX: | |||
| – 6-Week Change in Strength Index: | 15.8 | -4.4 | -21.6 |
Canadian Dollar Futures:
 Positioning Notes:
- Canadian Dollar large speculator standing this week reached a net position of -58,834 contracts in the data reported through Tuesday.
- Weekly Speculator position increase of 19,438 contracts from the previous week which had a total of -78,272 net contracts.
- This week’s current strength score (range over the past 3 years, measured from 0 to 100) shows the speculators are currently Bullish with a score of 59.1 percent.
- The Commercials are Bearish with a score of 41.7 percent.
- The Small Traders (not shown in chart) are Bearish with a score of 44.3 percent.
Price Trend-Following Model: Uptrend
Our weekly trend-following model classifies the current market price position as: Uptrend.
| CANADIAN DOLLAR Statistics | SPECULATORS | COMMERCIALS | SMALL TRADERS |
| – Percent of Open Interest Longs: | 23.9 | 62.2 | 11.4 |
| – Percent of Open Interest Shorts: | 46.9 | 39.0 | 11.5 |
| – Net Position: | -58,834 | 59,221 | -387 |
| – Gross Longs: | 60,889 | 158,814 | 28,975 |
| – Gross Shorts: | 119,723 | 99,593 | 29,362 |
| – Long to Short Ratio: | 0.5 to 1 | 1.6 to 1 | 1.0 to 1 |
| NET POSITION TREND: | |||
| – Strength Index Score (3 Year Range Pct): | 59.1 | 41.7 | 44.3 |
| – Strength Index Reading (3 Year Range): | Bullish | Bearish | Bearish |
| NET POSITION MOVEMENT INDEX: | |||
| – 6-Week Change in Strength Index: | -40.9 | 41.7 | -24.0 |
Australian Dollar Futures:
 Positioning Notes:
- Australian Dollar large speculator standing this week reached a net position of 64,817 contracts in the data reported through Tuesday.
- Weekly Speculator position fall of -258 contracts from the previous week which had a total of 65,075 net contracts.
- This week’s current strength score (range over the past 3 years, measured from 0 to 100) shows the speculators are currently Bullish-Extreme with a score of 91.2 percent.
- The Commercials are Bearish-Extreme with a score of 7.0 percent.
- The Small Traders (not shown in chart) are Bullish-Extreme with a score of 100.0 percent.
Price Trend-Following Model: Strong Uptrend
Our weekly trend-following model classifies the current market price position as: Strong Uptrend.
| AUSTRALIAN DOLLAR Statistics | SPECULATORS | COMMERCIALS | SMALL TRADERS |
| – Percent of Open Interest Longs: | 46.8 | 36.4 | 16.5 |
| – Percent of Open Interest Shorts: | 23.2 | 70.2 | 6.2 |
| – Net Position: | 64,817 | -93,198 | 28,381 |
| – Gross Longs: | 128,811 | 100,168 | 45,525 |
| – Gross Shorts: | 63,994 | 193,366 | 17,144 |
| – Long to Short Ratio: | 2.0 to 1 | 0.5 to 1 | 2.7 to 1 |
| NET POSITION TREND: | |||
| – Strength Index Score (3 Year Range Pct): | 91.2 | 7.0 | 100.0 |
| – Strength Index Reading (3 Year Range): | Bullish-Extreme | Bearish-Extreme | Bullish-Extreme |
| NET POSITION MOVEMENT INDEX: | |||
| – 6-Week Change in Strength Index: | 5.6 | -4.9 | 0.8 |
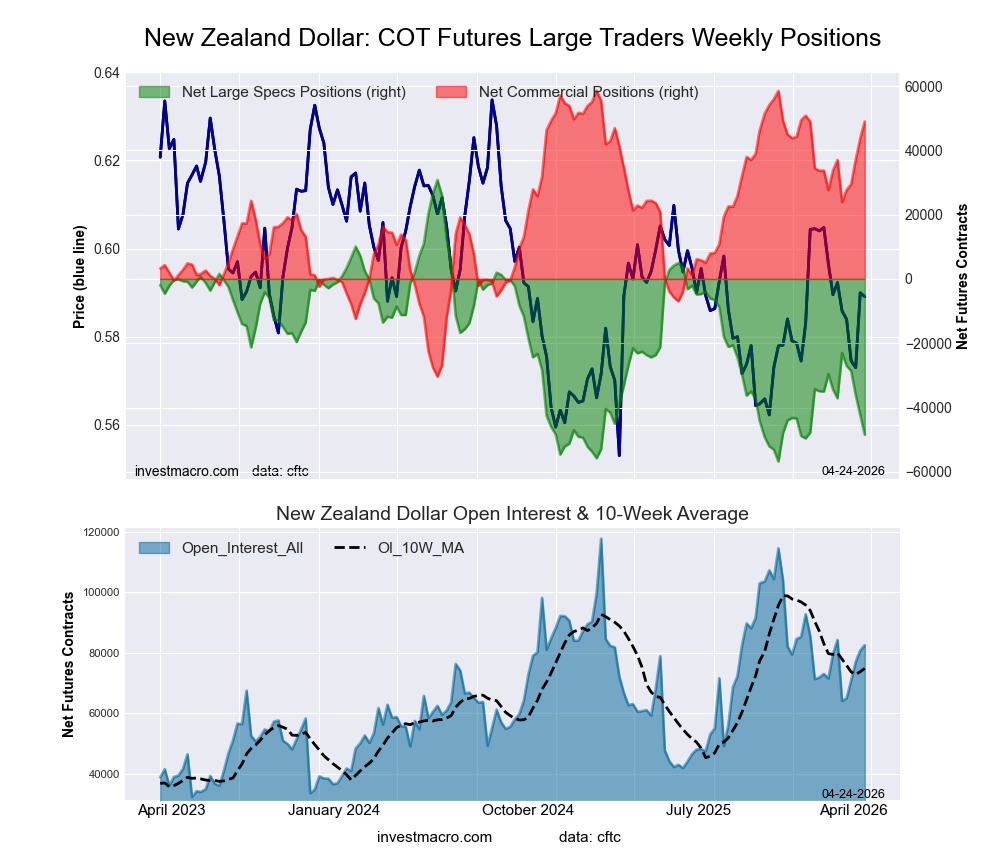
New Zealand Dollar Futures:
 Positioning Notes:
- New Zealand Dollar large speculator standing this week reached a net position of -48,454 contracts in the data reported through Tuesday.
- Weekly Speculator position reduction of -6,178 contracts from the previous week which had a total of -42,276 net contracts.
- This week’s current strength score (range over the past 3 years, measured from 0 to 100) shows the speculators are currently Bearish-Extreme with a score of 9.5 percent.
- The Commercials are Bullish-Extreme with a score of 89.2 percent.
- The Small Traders (not shown in chart) are Bearish with a score of 45.5 percent.
Price Trend-Following Model: Uptrend
Our weekly trend-following model classifies the current market price position as: Uptrend.
| NEW ZEALAND DOLLAR Statistics | SPECULATORS | COMMERCIALS | SMALL TRADERS |
| – Percent of Open Interest Longs: | 9.6 | 84.9 | 4.7 |
| – Percent of Open Interest Shorts: | 68.3 | 25.5 | 5.4 |
| – Net Position: | -48,454 | 48,983 | -529 |
| – Gross Longs: | 7,917 | 70,056 | 3,915 |
| – Gross Shorts: | 56,371 | 21,073 | 4,444 |
| – Long to Short Ratio: | 0.1 to 1 | 3.3 to 1 | 0.9 to 1 |
| NET POSITION TREND: | |||
| – Strength Index Score (3 Year Range Pct): | 9.5 | 89.2 | 45.5 |
| – Strength Index Reading (3 Year Range): | Bearish-Extreme | Bullish-Extreme | Bearish |
| NET POSITION MOVEMENT INDEX: | |||
| – 6-Week Change in Strength Index: | -13.0 | 13.5 | -8.2 |
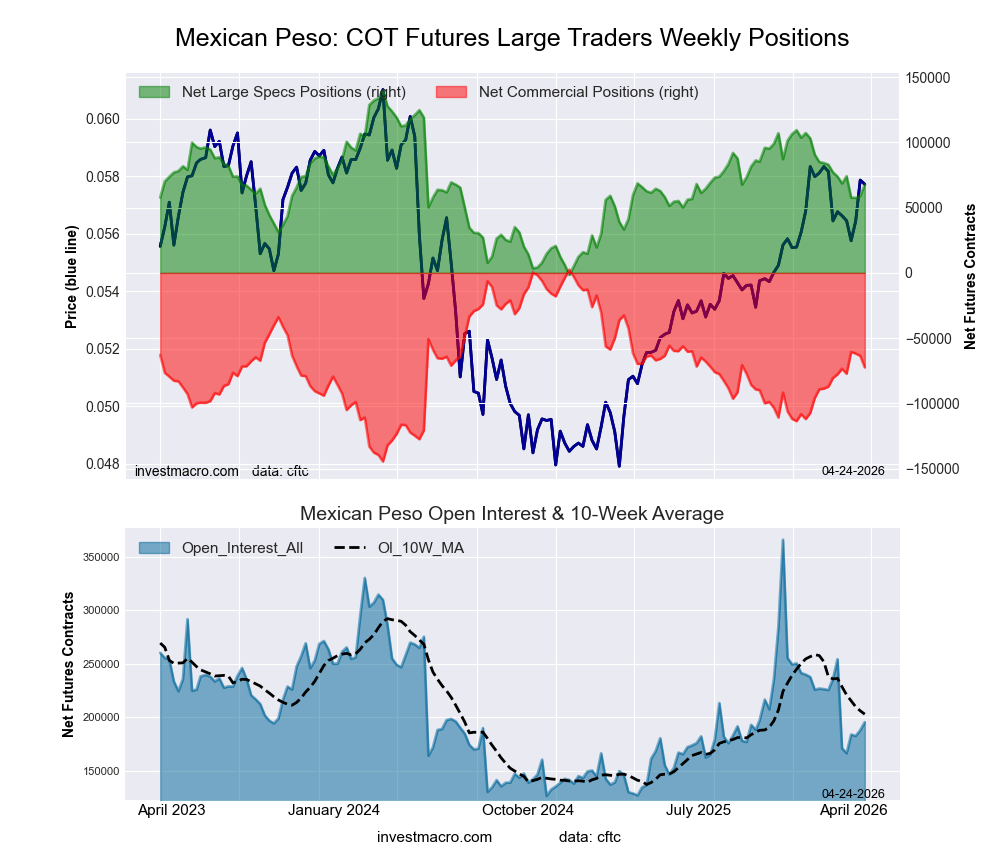
Mexican Peso Futures:
 Positioning Notes:
- Mexican Peso large speculator standing this week reached a net position of 67,701 contracts in the data reported through Tuesday.
- Weekly Speculator position rise of 8,747 contracts from the previous week which had a total of 58,954 net contracts.
- This week’s current strength score (range over the past 3 years, measured from 0 to 100) shows the speculators are currently Bearish with a score of 49.0 percent.
- The Commercials are Bearish with a score of 49.0 percent.
- The Small Traders (not shown in chart) are Bearish with a score of 48.9 percent.
Price Trend-Following Model: Strong Uptrend
Our weekly trend-following model classifies the current market price position as: Strong Uptrend.
| MEXICAN PESO Statistics | SPECULATORS | COMMERCIALS | SMALL TRADERS |
| – Percent of Open Interest Longs: | 51.8 | 43.9 | 3.4 |
| – Percent of Open Interest Shorts: | 17.2 | 80.9 | 1.0 |
| – Net Position: | 67,701 | -72,415 | 4,714 |
| – Gross Longs: | 101,306 | 85,802 | 6,695 |
| – Gross Shorts: | 33,605 | 158,217 | 1,981 |
| – Long to Short Ratio: | 3.0 to 1 | 0.5 to 1 | 3.4 to 1 |
| NET POSITION TREND: | |||
| – Strength Index Score (3 Year Range Pct): | 49.0 | 49.0 | 48.9 |
| – Strength Index Reading (3 Year Range): | Bearish | Bearish | Bearish |
| NET POSITION MOVEMENT INDEX: | |||
| – 6-Week Change in Strength Index: | -4.3 | 3.6 | 4.4 |
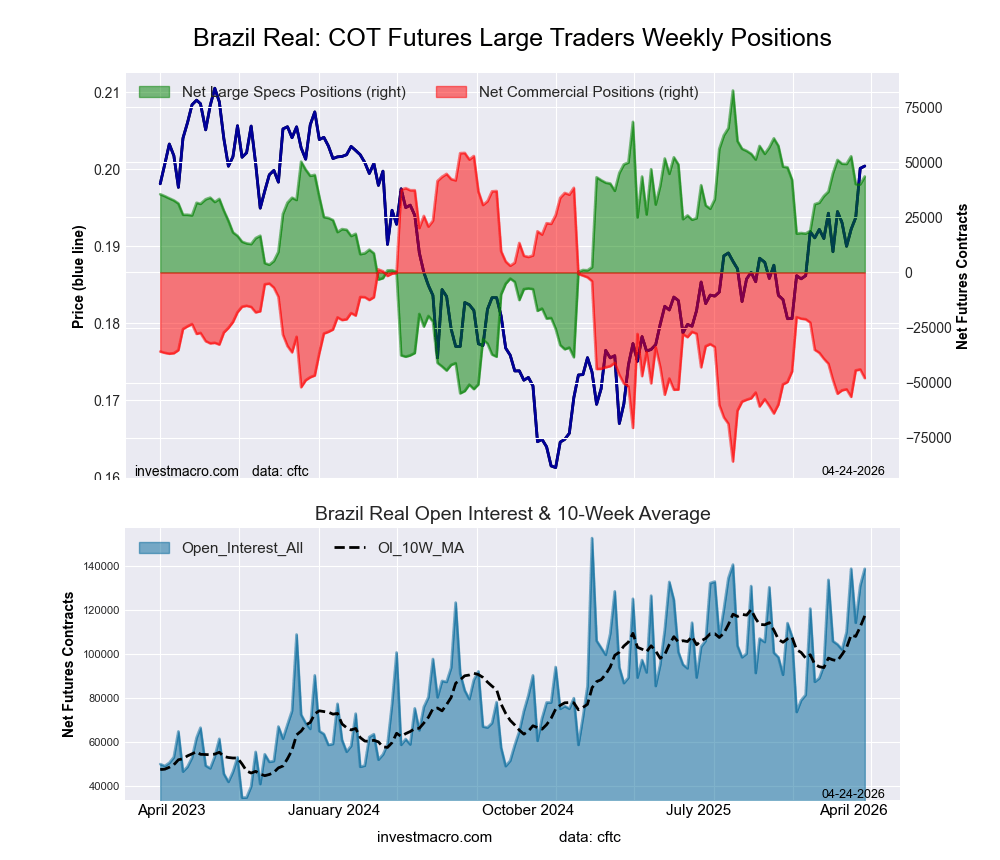
Brazilian Real Futures:
 Positioning Notes:
- Brazilian Real large speculator standing this week reached a net position of 43,533 contracts in the data reported through Tuesday.
- Weekly Speculator position gain of 3,558 contracts from the previous week which had a total of 39,975 net contracts.
- This week’s current strength score (range over the past 3 years, measured from 0 to 100) shows the speculators are currently Bullish with a score of 71.6 percent.
- The Commercials are Bearish with a score of 27.0 percent.
- The Small Traders (not shown in chart) are Bearish with a score of 45.9 percent.
Price Trend-Following Model: Strong Uptrend
Our weekly trend-following model classifies the current market price position as: Strong Uptrend.
| BRAZIL REAL Statistics | SPECULATORS | COMMERCIALS | SMALL TRADERS |
| – Percent of Open Interest Longs: | 64.9 | 24.4 | 4.2 |
| – Percent of Open Interest Shorts: | 33.5 | 59.0 | 1.0 |
| – Net Position: | 43,533 | -47,979 | 4,446 |
| – Gross Longs: | 89,922 | 33,798 | 5,849 |
| – Gross Shorts: | 46,389 | 81,777 | 1,403 |
| – Long to Short Ratio: | 1.9 to 1 | 0.4 to 1 | 4.2 to 1 |
| NET POSITION TREND: | |||
| – Strength Index Score (3 Year Range Pct): | 71.6 | 27.0 | 45.9 |
| – Strength Index Reading (3 Year Range): | Bullish | Bearish | Bearish |
| NET POSITION MOVEMENT INDEX: | |||
| – 6-Week Change in Strength Index: | -5.5 | 5.0 | 2.4 |
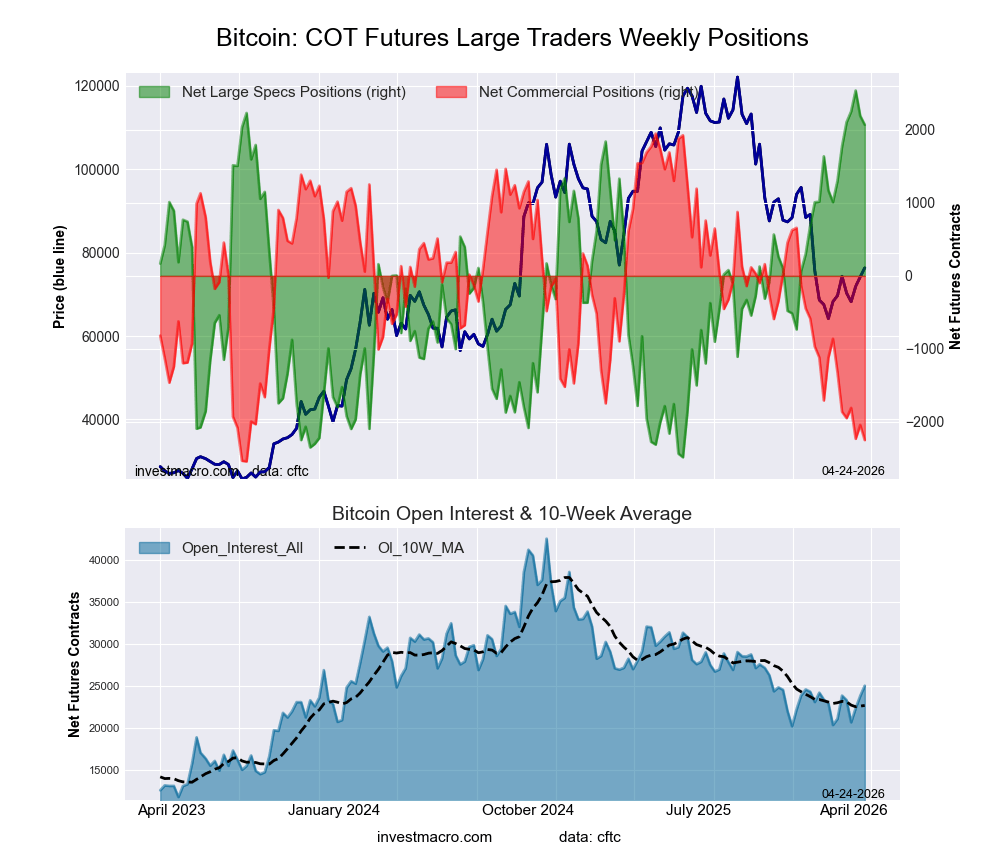
Bitcoin Futures:
 Positioning Notes:
- Bitcoin large speculator standing this week reached a net position of 2,071 contracts in the data reported through Tuesday.
- Weekly Speculator position fall of -122 contracts from the previous week which had a total of 2,193 net contracts.
- This week’s current strength score (range over the past 3 years, measured from 0 to 100) shows the speculators are currently Bullish-Extreme with a score of 90.7 percent.
- The Commercials are Bearish-Extreme with a score of 6.5 percent.
- The Small Traders (not shown in chart) are Bearish with a score of 46.6 percent.
Price Trend-Following Model: Weak Downtrend
Our weekly trend-following model classifies the current market price position as: Weak Downtrend.
| BITCOIN Statistics | SPECULATORS | COMMERCIALS | SMALL TRADERS |
| – Percent of Open Interest Longs: | 68.4 | 0.8 | 4.9 |
| – Percent of Open Interest Shorts: | 60.1 | 9.8 | 4.2 |
| – Net Position: | 2,071 | -2,250 | 179 |
| – Gross Longs: | 17,097 | 194 | 1,233 |
| – Gross Shorts: | 15,026 | 2,444 | 1,054 |
| – Long to Short Ratio: | 1.1 to 1 | 0.1 to 1 | 1.2 to 1 |
| NET POSITION TREND: | |||
| – Strength Index Score (3 Year Range Pct): | 90.7 | 6.5 | 46.6 |
| – Strength Index Reading (3 Year Range): | Bullish-Extreme | Bearish-Extreme | Bearish |
| NET POSITION MOVEMENT INDEX: | |||
| – 6-Week Change in Strength Index: | 15.3 | -20.7 | 8.2 |
Article By InvestMacro – Receive our weekly COT Newsletter
*COT Report: The COT data, released weekly to the public each Friday, is updated through the most recent Tuesday (data is 3 days old) and shows a quick view of how large speculators or non-commercials (for-profit traders) were positioned in the futures markets.
The CFTC categorizes trader positions according to commercial hedgers (traders who use futures contracts for hedging as part of the business), non-commercials (large traders who speculate to realize trading profits) and nonreportable traders (usually small traders/speculators) as well as their open interest (contracts open in the market at time of reporting). See CFTC criteria here.

- COT Metals Charts: Weekly Speculator Bets led by Copper & Steel Jul 18, 2026
- COT Bonds Charts: Weekly Speculator Bets led by 2-Year, SOFR 3M & 5-Year Bonds Jul 18, 2026
- COT Energy Charts: Weekly Speculator Bets led by Brent Oil & Heating Oil Jul 18, 2026
- COT Soft Commodities Charts: Weekly Speculator Bets led by Wheat, Corn & Soybean Meal Jul 18, 2026
- The Bank of Canada kept its interest rate unchanged. Platinum prices reached a three‑week high Jul 16, 2026
- Stock indices rose after the release of US inflation data. China’s GDP slowed sharply Jul 15, 2026
- GBP/USD Awaits Political News: What Will Happen Next Jul 15, 2026
- USD/JPY Holds at Highs: Pressure Lingers on Yen Jul 14, 2026
- Oil prices jumped 4% amid a new wave of escalation between the US and Iran Jul 13, 2026
- EUR/USD: US Inflation Will Determine Everything Jul 13, 2026