
By InvestMacro

Here are the latest charts and statistics for the Commitment of Traders (COT) data published by the Commodities Futures Trading Commission (CFTC).
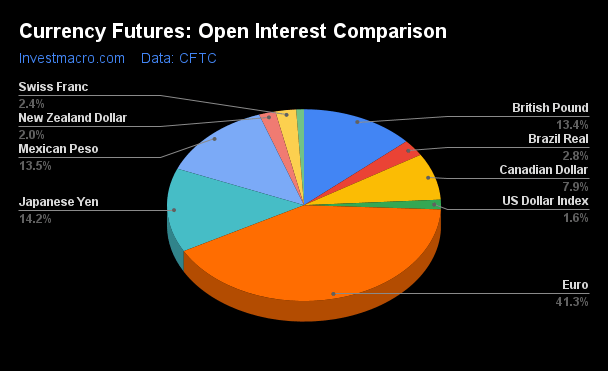
The latest COT data is updated through Tuesday July 25th and shows a quick view of how large market participants (for-profit speculators and commercial traders) were positioned in the futures markets. All currency positions are in direct relation to the US dollar where, for example, a bet for the euro is a bet that the euro will rise versus the dollar while a bet against the euro will be a bet that the euro will decline versus the dollar.
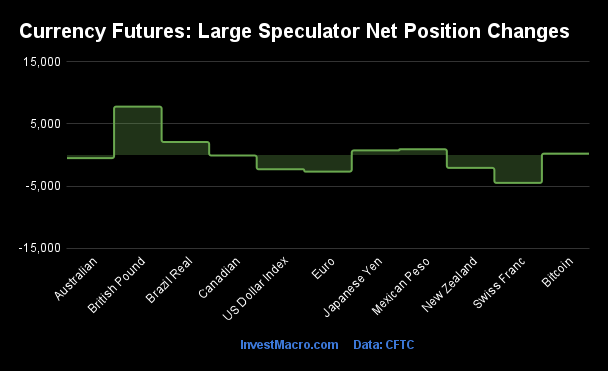
Weekly Speculator Changes led by Japanese Yen & Canadian Dollar
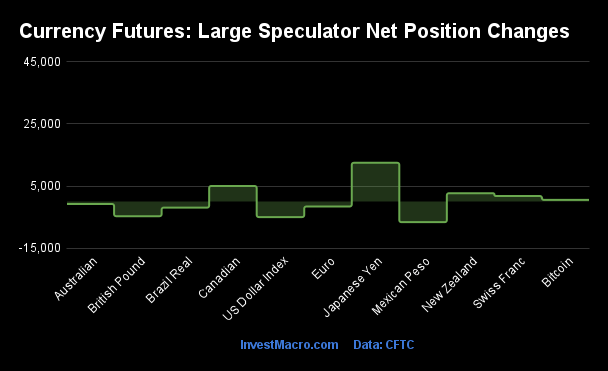
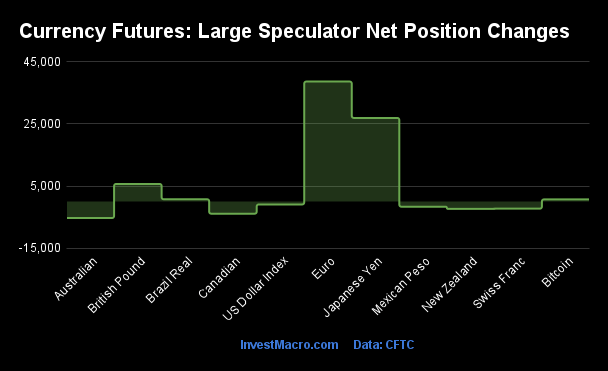
The COT currency market speculator bets were lower this week as five out of the eleven currency markets we cover had higher positioning while the other six markets had lower speculator contracts.
Leading the gains for the currency markets was the Japanese Yen (12,487 contracts) with the Canadian Dollar (5,009 contracts), New Zealand Dollar (2,677 contracts), Swiss Franc (1,780 contracts) and Bitcoin (516 contracts) also showing positive weeks.
The currencies seeing declines in speculator bets on the week were the Mexican Peso (-6,651 contracts) with the US Dollar Index (-5,013 contracts), the British Pound (-4,734 contracts), EuroFX (-1,602 contracts), the Brazilian Real (-1,962 contracts) and the Australian Dollar (-800 contracts)also registering lower bets on the week.
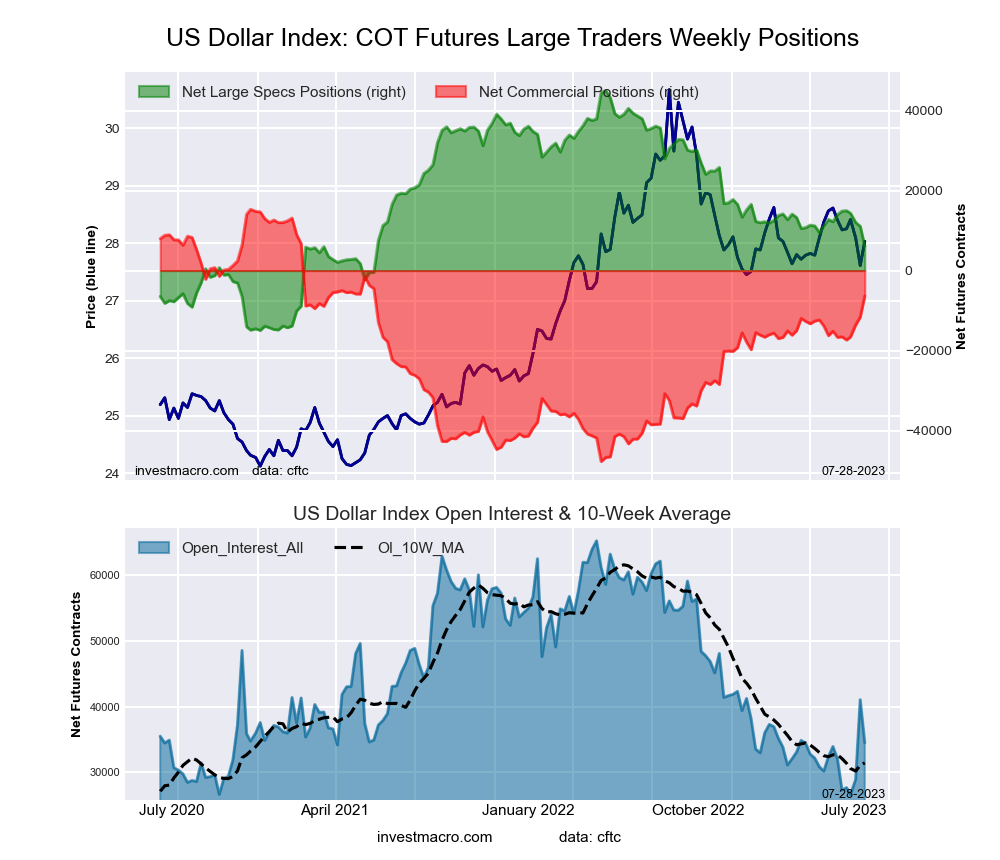
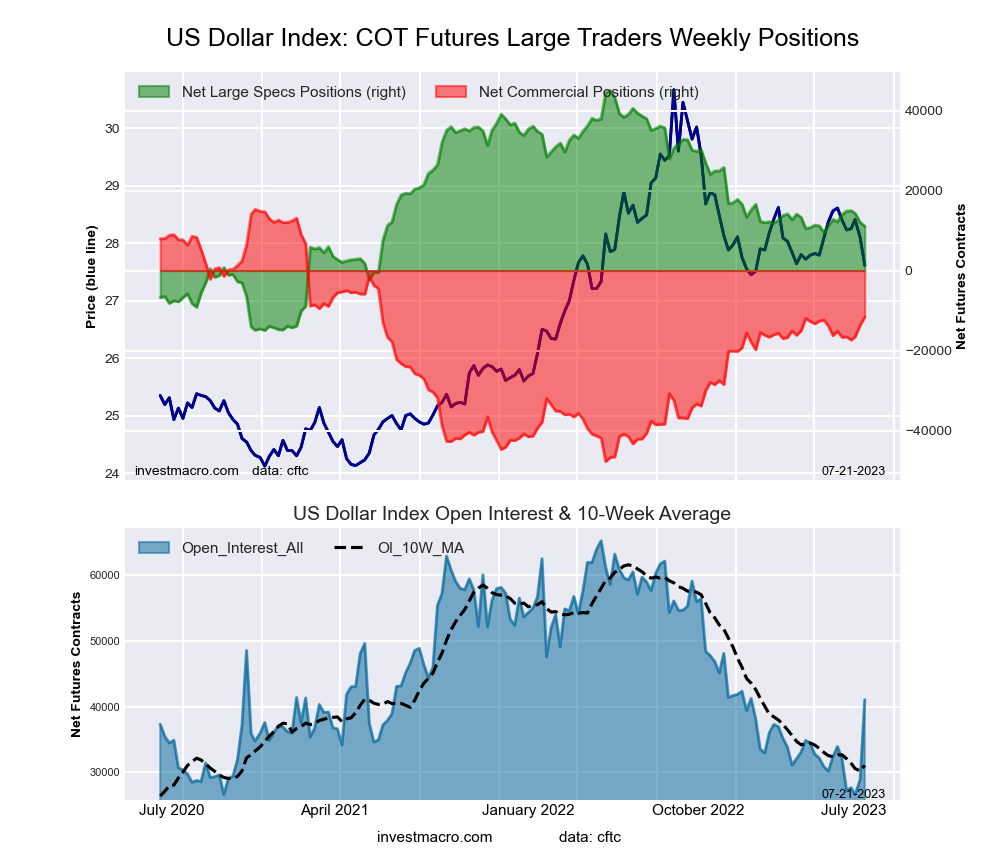
US Dollar Index Bullish Bets fall to 2-Year Low
Highlighting the COT currency’s data this week is the decline of the speculator’s positioning in the US Dollar Index. The large speculative US Dollar Index positions decreased for a fourth consecutive week this week and the speculators have now subtracted a total of -8,914 net contracts from the overall position in just the last four weeks.
This week’s reduction by -5,013 contracts marked the largest one-week shortfall since December 20th of 2022 (which recorded a decline by -9,021 contracts). This bearishness has dropped the US Dollar Index speculator net position (currently at +6,054 contracts) to its lowest level of the past 108 weeks, dating back to June 29th of 2021.
Overall, the US Dollar speculator position has been weakening since hitting a cycle high on June 21st of 2022 with a total of +45,010 contracts. Since then, the steady and slow erosion of bullish bets has brought the net position to under the +10,000 contract level for just the second time in the past two years. This latest data is through Tuesday and before the US Federal Reserve’s latest rate increase by 25 basis points that took place on Wednesday. Speculators and market watchers are eyeing the end of the Fed’s interest rate hiking campaign as inflation has been falling across most measures in the US economy.
The US Dollar Index futures price closed higher this week for a second straight week and ended the week right around the 101.40 level. The USD Index had ascended to a multi-decade high of 114.74 in September 2022 and has been on the downtrend since with a current decline (from top to latest price) of approximately 12 percent. The USD Index price fell to a 14-month low on July 18th at 99.22 before staging a comeback over the past two weeks and making it back over the 100 level.
| Jul-25-2023 | OI | OI-Index | Spec-Net | Spec-Index | Com-Net | COM-Index | Smalls-Net | Smalls-Index |
|---|---|---|---|---|---|---|---|---|
| USD Index | 34,514 | 20 | 6,054 | 35 | -6,339 | 66 | 285 | 20 |
| EUR | 772,408 | 75 | 177,230 | 87 | -234,269 | 11 | 57,039 | 70 |
| GBP | 237,340 | 60 | 58,995 | 97 | -76,984 | 3 | 17,989 | 93 |
| JPY | 223,760 | 57 | -77,752 | 24 | 86,555 | 78 | -8,803 | 36 |
| CHF | 44,180 | 50 | -8,431 | 32 | 3,421 | 51 | 5,010 | 74 |
| CAD | 156,395 | 31 | 5,530 | 60 | -22,096 | 41 | 16,566 | 60 |
| AUD | 146,423 | 28 | -51,201 | 37 | 49,561 | 56 | 1,640 | 56 |
| NZD | 36,820 | 25 | -949 | 51 | 32 | 47 | 917 | 61 |
| MXN | 233,549 | 49 | 87,841 | 93 | -92,058 | 7 | 4,217 | 38 |
| RUB | 20,930 | 4 | 7,543 | 31 | -7,150 | 69 | -393 | 24 |
| BRL | 53,443 | 44 | 31,971 | 76 | -31,957 | 25 | -14 | 44 |
| Bitcoin | 16,017 | 77 | -645 | 66 | -178 | 0 | 823 | 32 |
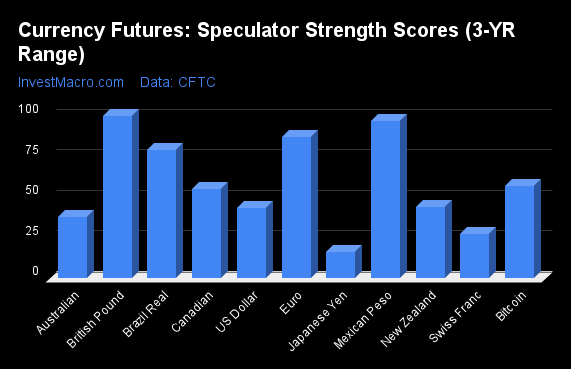
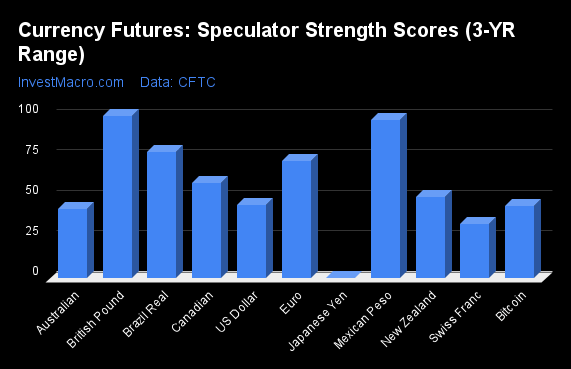
Strength Scores led by British Pound & Mexican Peso
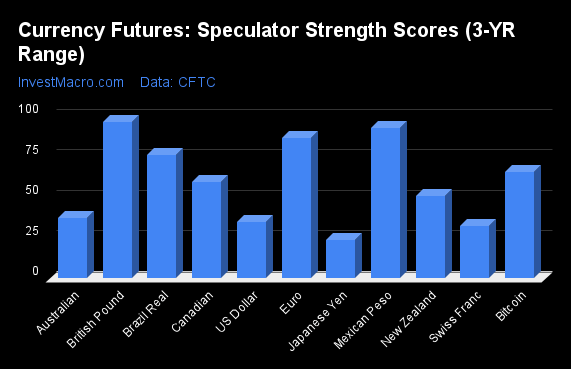
COT Strength Scores (a normalized measure of Speculator positions over a 3-Year range, from 0 to 100 where above 80 is Extreme-Bullish and below 20 is Extreme-Bearish) showed that the British Pound (97 percent) and the Mexican Peso (93 percent) lead the currency markets this week. The EuroFX (87 percent), Brazilian Real (76 percent) and the Bitcoin (66 percent) come in as the next highest in the weekly strength scores.
On the downside, the Japanese Yen (24 percent) and the Swiss Franc (32 percent) come in at the lowest strength levels currently. The next lowest strength scores are the US Dollar Index (35 percent) and the Australian Dollar (37 percent).
Strength Statistics:
US Dollar Index (35.0 percent) vs US Dollar Index previous week (43.4 percent)
EuroFX (86.7 percent) vs EuroFX previous week (87.3 percent)
British Pound Sterling (96.7 percent) vs British Pound Sterling previous week (100.0 percent)
Japanese Yen (23.8 percent) vs Japanese Yen previous week (16.4 percent)
Swiss Franc (32.3 percent) vs Swiss Franc previous week (27.6 percent)
Canadian Dollar (59.7 percent) vs Canadian Dollar previous week (55.0 percent)
Australian Dollar (37.4 percent) vs Australian Dollar previous week (38.1 percent)
New Zealand Dollar (51.0 percent) vs New Zealand Dollar previous week (43.8 percent)
Mexican Peso (92.8 percent) vs Mexican Peso previous week (96.8 percent)
Brazilian Real (76.4 percent) vs Brazilian Real previous week (78.9 percent)
Bitcoin (65.7 percent) vs Bitcoin previous week (56.7 percent)
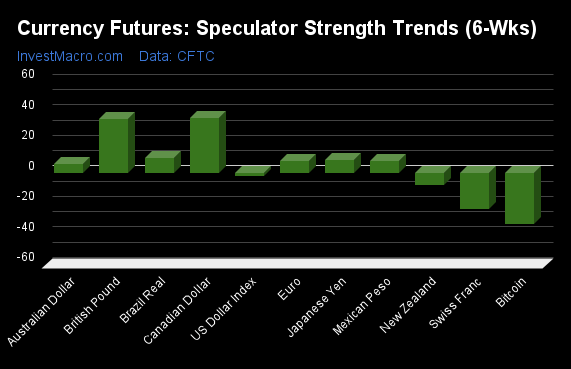
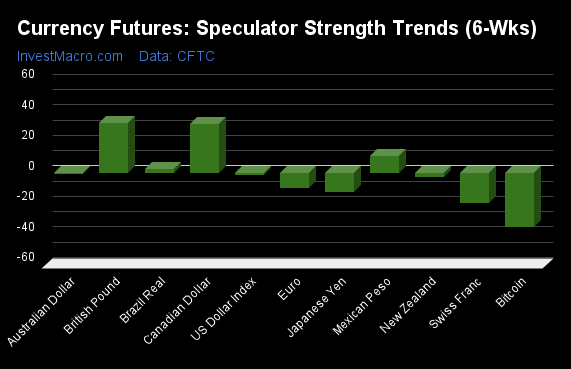
Canadian Dollar & British Pound top the 6-Week Strength Trends
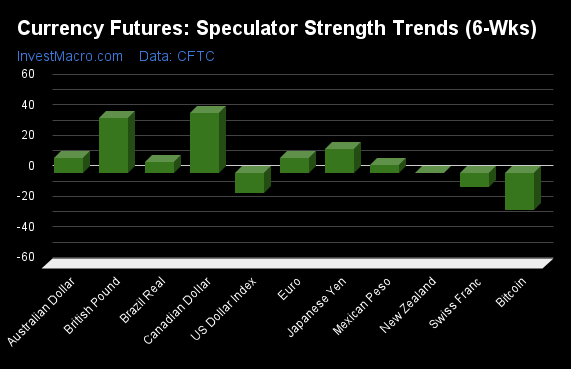
COT Strength Score Trends (or move index, calculates the 6-week changes in strength scores) showed that the Canadian Dollar (39 percent) and the British Pound (36 percent) lead the past six weeks trends for the currencies. The Japanese Yen (16 percent), the EuroFX (10 percent) and the Australian Dollar (10 percent) are the next highest positive movers in the latest trends data.
The Bitcoin (-24 percent) leads the downside trend scores currently with the US Dollar Index (-13 percent), Swiss Franc (-9 percent) and the New Zealand Dollar (0 percent) following next with lower trend scores.
Strength Trend Statistics:
US Dollar Index (-13.2 percent) vs US Dollar Index previous week (-1.9 percent)
EuroFX (9.8 percent) vs EuroFX previous week (7.9 percent)
British Pound Sterling (36.3 percent) vs British Pound Sterling previous week (35.6 percent)
Japanese Yen (15.6 percent) vs Japanese Yen previous week (8.7 percent)
Swiss Franc (-9.0 percent) vs Swiss Franc previous week (-23.5 percent)
Canadian Dollar (39.3 percent) vs Canadian Dollar previous week (36.2 percent)
Australian Dollar (9.8 percent) vs Australian Dollar previous week (5.6 percent)
New Zealand Dollar (-0.3 percent) vs New Zealand Dollar previous week (-7.9 percent)
Mexican Peso (5.5 percent) vs Mexican Peso previous week (7.8 percent)
Brazilian Real (7.4 percent) vs Brazilian Real previous week (9.9 percent)
Bitcoin (-24.2 percent) vs Bitcoin previous week (-33.7 percent)
Individual COT Forex Markets:
US Dollar Index Futures:
 The US Dollar Index large speculator standing this week totaled a net position of 6,054 contracts in the data reported through Tuesday. This was a weekly decrease of -5,013 contracts from the previous week which had a total of 11,067 net contracts.
This week’s current strength score (the trader positioning range over the past three years, measured from 0 to 100) shows the speculators are currently Bearish with a score of 35.0 percent. The commercials are Bullish with a score of 65.7 percent and the small traders (not shown in chart) are Bearish-Extreme with a score of 19.6 percent.
Price Trend-Following Model: Weak Uptrend
Our weekly trend-following model classifies the current market price position as: Weak Uptrend. The current action for the model is considered to be: Hold – Maintain Long Position.
| US DOLLAR INDEX Statistics | SPECULATORS | COMMERCIALS | SMALL TRADERS |
| – Percent of Open Interest Longs: | 61.6 | 22.6 | 10.8 |
| – Percent of Open Interest Shorts: | 44.1 | 41.0 | 10.0 |
| – Net Position: | 6,054 | -6,339 | 285 |
| – Gross Longs: | 21,258 | 7,796 | 3,735 |
| – Gross Shorts: | 15,204 | 14,135 | 3,450 |
| – Long to Short Ratio: | 1.4 to 1 | 0.6 to 1 | 1.1 to 1 |
| NET POSITION TREND: | |||
| – Strength Index Score (3 Year Range Pct): | 35.0 | 65.7 | 19.6 |
| – Strength Index Reading (3 Year Range): | Bearish | Bullish | Bearish-Extreme |
| NET POSITION MOVEMENT INDEX: | |||
| – 6-Week Change in Strength Index: | -13.2 | 16.4 | -26.3 |
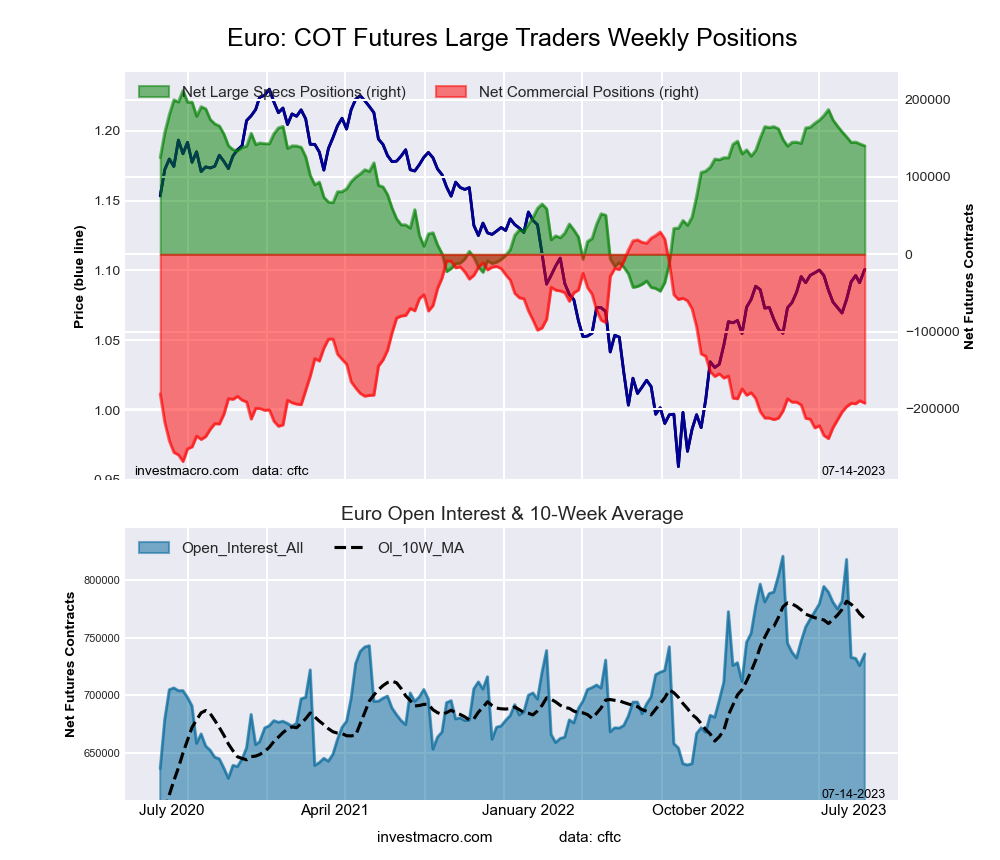
Euro Currency Futures:
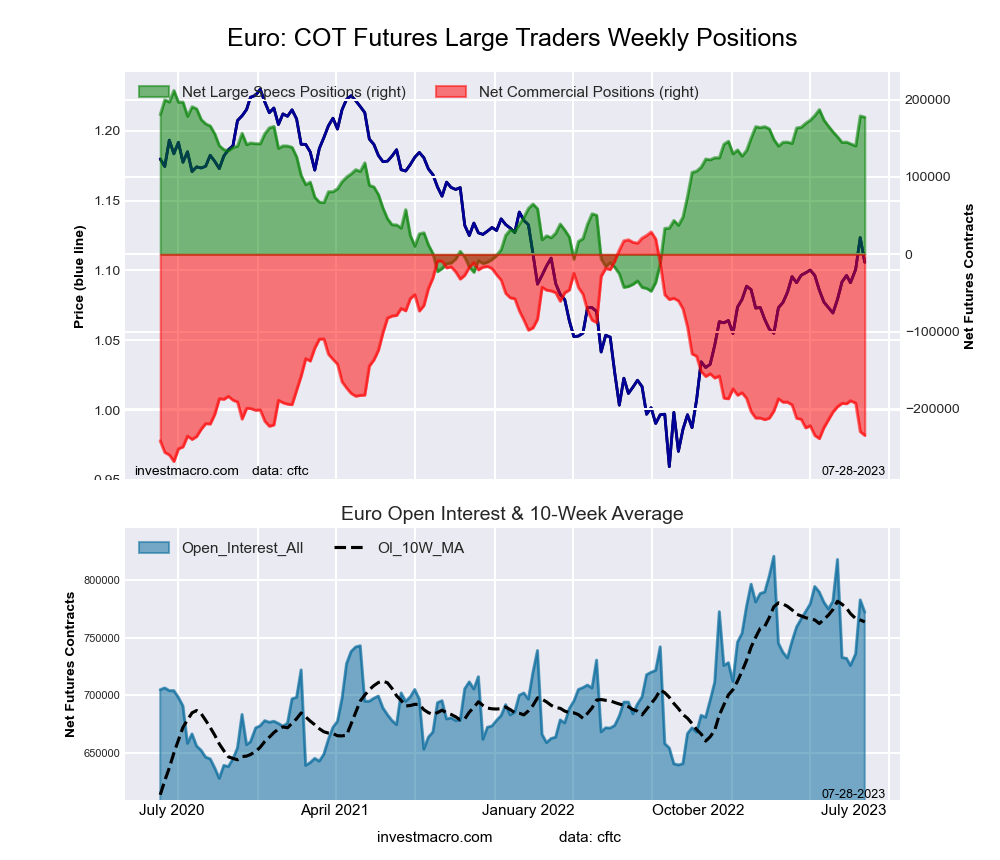 The Euro Currency large speculator standing this week totaled a net position of 177,230 contracts in the data reported through Tuesday. This was a weekly lowering of -1,602 contracts from the previous week which had a total of 178,832 net contracts.
This week’s current strength score (the trader positioning range over the past three years, measured from 0 to 100) shows the speculators are currently Bullish-Extreme with a score of 86.7 percent. The commercials are Bearish-Extreme with a score of 11.4 percent and the small traders (not shown in chart) are Bullish with a score of 70.0 percent.
Price Trend-Following Model: Uptrend
Our weekly trend-following model classifies the current market price position as: Uptrend. The current action for the model is considered to be: Hold – Maintain Long Position.
| EURO Currency Statistics | SPECULATORS | COMMERCIALS | SMALL TRADERS |
| – Percent of Open Interest Longs: | 32.5 | 52.1 | 12.6 |
| – Percent of Open Interest Shorts: | 9.5 | 82.5 | 5.2 |
| – Net Position: | 177,230 | -234,269 | 57,039 |
| – Gross Longs: | 250,647 | 402,626 | 97,545 |
| – Gross Shorts: | 73,417 | 636,895 | 40,506 |
| – Long to Short Ratio: | 3.4 to 1 | 0.6 to 1 | 2.4 to 1 |
| NET POSITION TREND: | |||
| – Strength Index Score (3 Year Range Pct): | 86.7 | 11.4 | 70.0 |
| – Strength Index Reading (3 Year Range): | Bullish-Extreme | Bearish-Extreme | Bullish |
| NET POSITION MOVEMENT INDEX: | |||
| – 6-Week Change in Strength Index: | 9.8 | -12.5 | 18.8 |
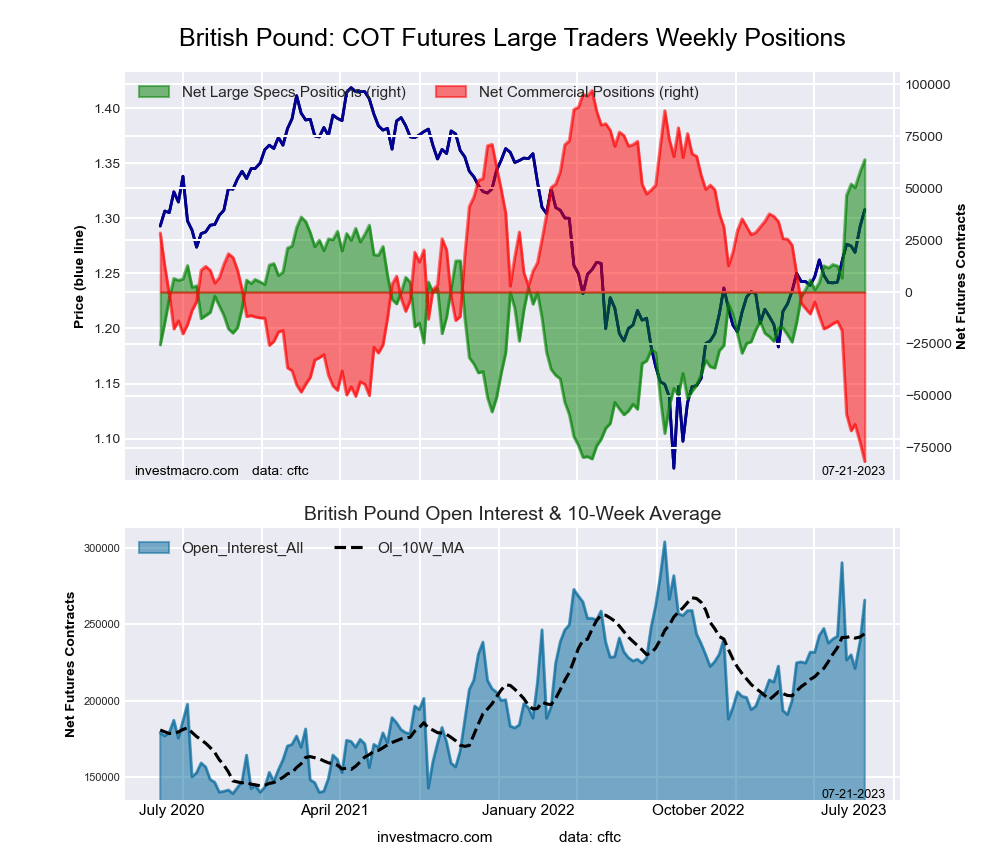
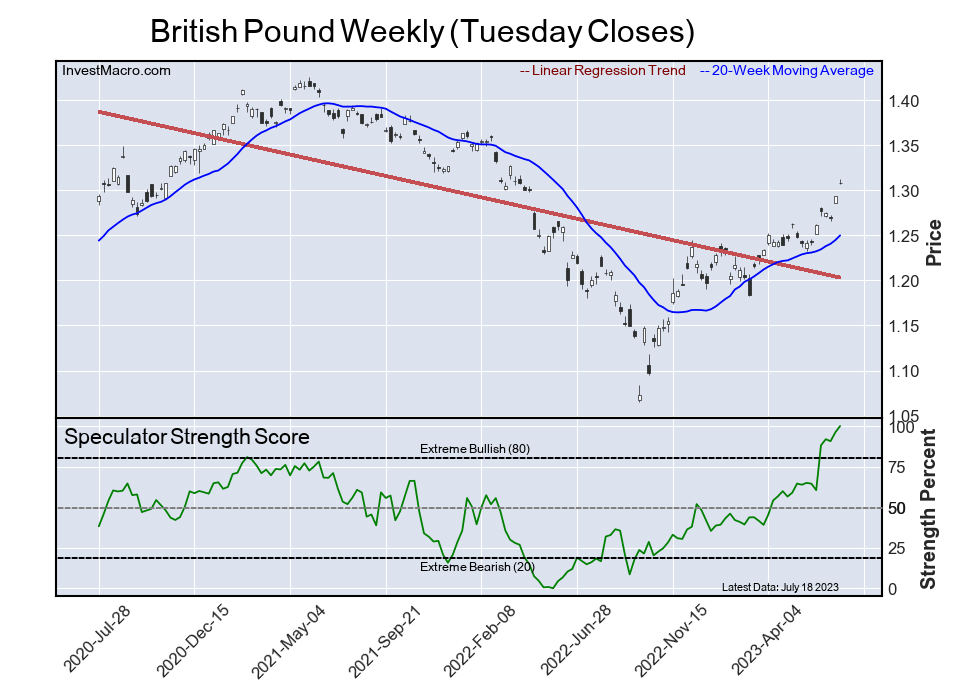
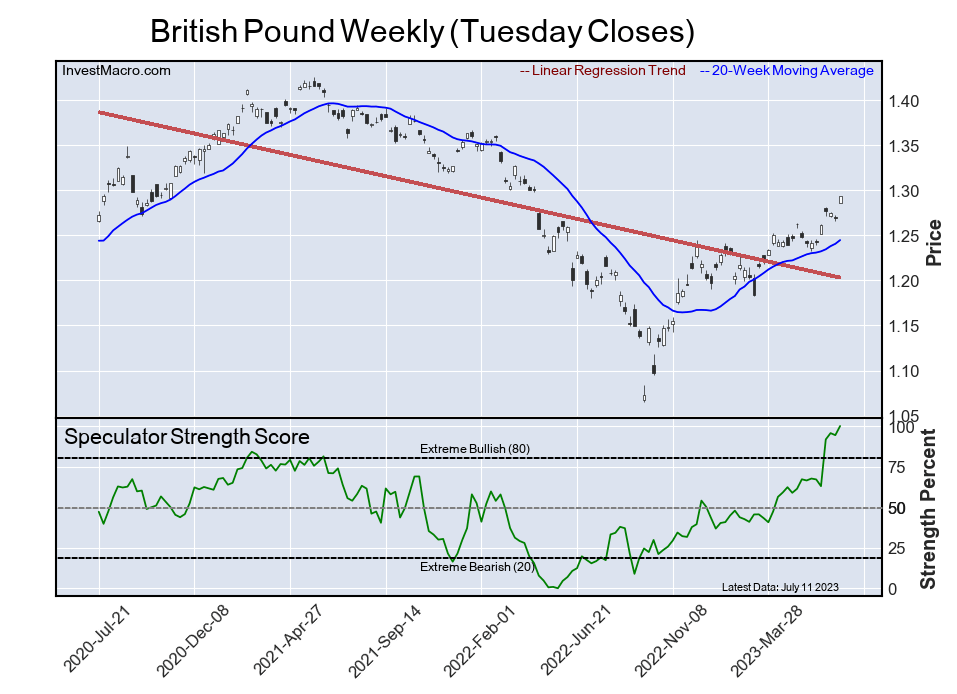
British Pound Sterling Futures:
 The British Pound Sterling large speculator standing this week totaled a net position of 58,995 contracts in the data reported through Tuesday. This was a weekly decrease of -4,734 contracts from the previous week which had a total of 63,729 net contracts.
This week’s current strength score (the trader positioning range over the past three years, measured from 0 to 100) shows the speculators are currently Bullish-Extreme with a score of 96.7 percent. The commercials are Bearish-Extreme with a score of 2.6 percent and the small traders (not shown in chart) are Bullish-Extreme with a score of 93.3 percent.
Price Trend-Following Model: Uptrend
Our weekly trend-following model classifies the current market price position as: Uptrend. The current action for the model is considered to be: Hold – Maintain Long Position.
| BRITISH POUND Statistics | SPECULATORS | COMMERCIALS | SMALL TRADERS |
| – Percent of Open Interest Longs: | 44.5 | 31.9 | 17.6 |
| – Percent of Open Interest Shorts: | 19.6 | 64.3 | 10.0 |
| – Net Position: | 58,995 | -76,984 | 17,989 |
| – Gross Longs: | 105,498 | 75,737 | 41,762 |
| – Gross Shorts: | 46,503 | 152,721 | 23,773 |
| – Long to Short Ratio: | 2.3 to 1 | 0.5 to 1 | 1.8 to 1 |
| NET POSITION TREND: | |||
| – Strength Index Score (3 Year Range Pct): | 96.7 | 2.6 | 93.3 |
| – Strength Index Reading (3 Year Range): | Bullish-Extreme | Bearish-Extreme | Bullish-Extreme |
| NET POSITION MOVEMENT INDEX: | |||
| – 6-Week Change in Strength Index: | 36.3 | -32.7 | 12.0 |
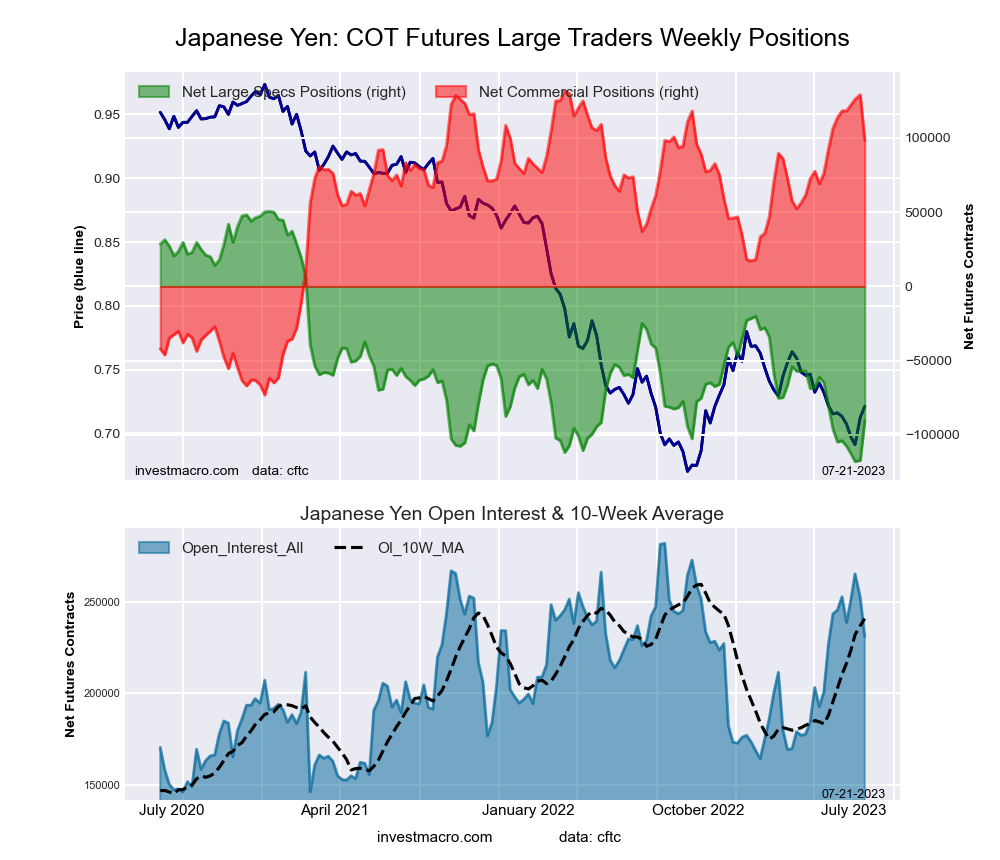
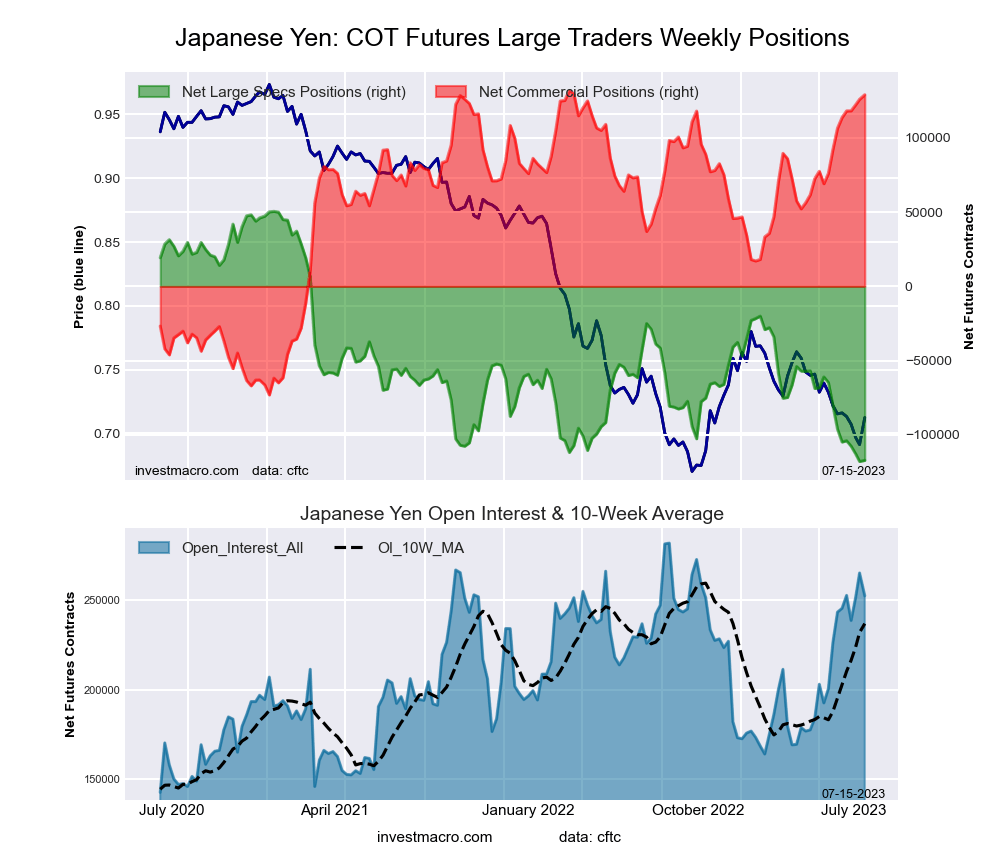
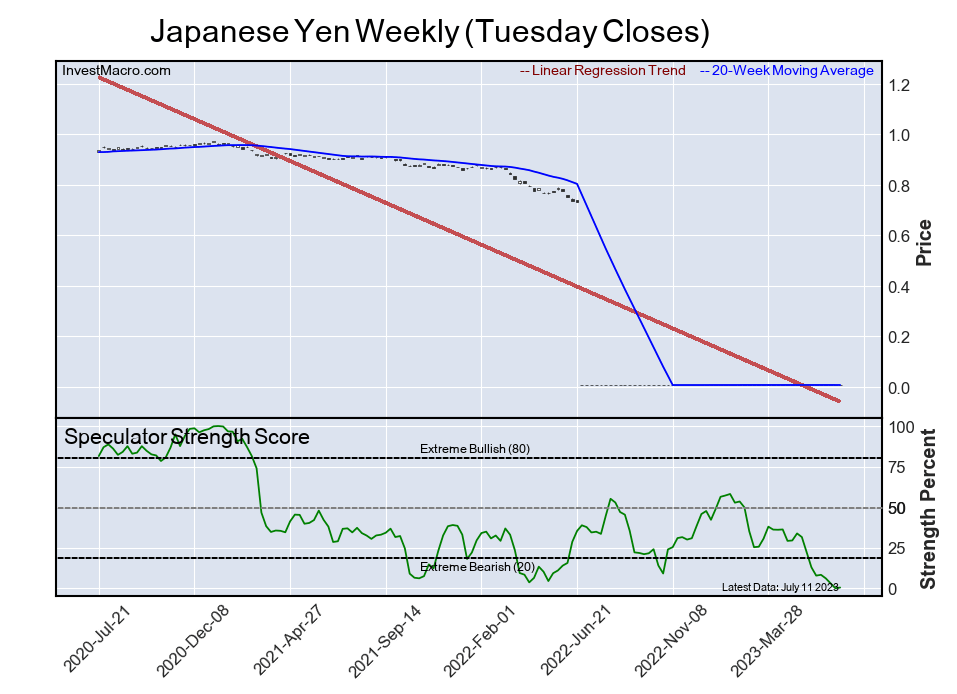
Japanese Yen Futures:
 The Japanese Yen large speculator standing this week totaled a net position of -77,752 contracts in the data reported through Tuesday. This was a weekly increase of 12,487 contracts from the previous week which had a total of -90,239 net contracts.
This week’s current strength score (the trader positioning range over the past three years, measured from 0 to 100) shows the speculators are currently Bearish with a score of 23.8 percent. The commercials are Bullish with a score of 77.9 percent and the small traders (not shown in chart) are Bearish with a score of 35.6 percent.
Price Trend-Following Model: Downtrend
Our weekly trend-following model classifies the current market price position as: Downtrend. The current action for the model is considered to be: Hold – Maintain Short Position.
| JAPANESE YEN Statistics | SPECULATORS | COMMERCIALS | SMALL TRADERS |
| – Percent of Open Interest Longs: | 13.6 | 72.0 | 13.4 |
| – Percent of Open Interest Shorts: | 48.3 | 33.3 | 17.4 |
| – Net Position: | -77,752 | 86,555 | -8,803 |
| – Gross Longs: | 30,358 | 161,166 | 30,040 |
| – Gross Shorts: | 108,110 | 74,611 | 38,843 |
| – Long to Short Ratio: | 0.3 to 1 | 2.2 to 1 | 0.8 to 1 |
| NET POSITION TREND: | |||
| – Strength Index Score (3 Year Range Pct): | 23.8 | 77.9 | 35.6 |
| – Strength Index Reading (3 Year Range): | Bearish | Bullish | Bearish |
| NET POSITION MOVEMENT INDEX: | |||
| – 6-Week Change in Strength Index: | 15.6 | -15.4 | 11.0 |
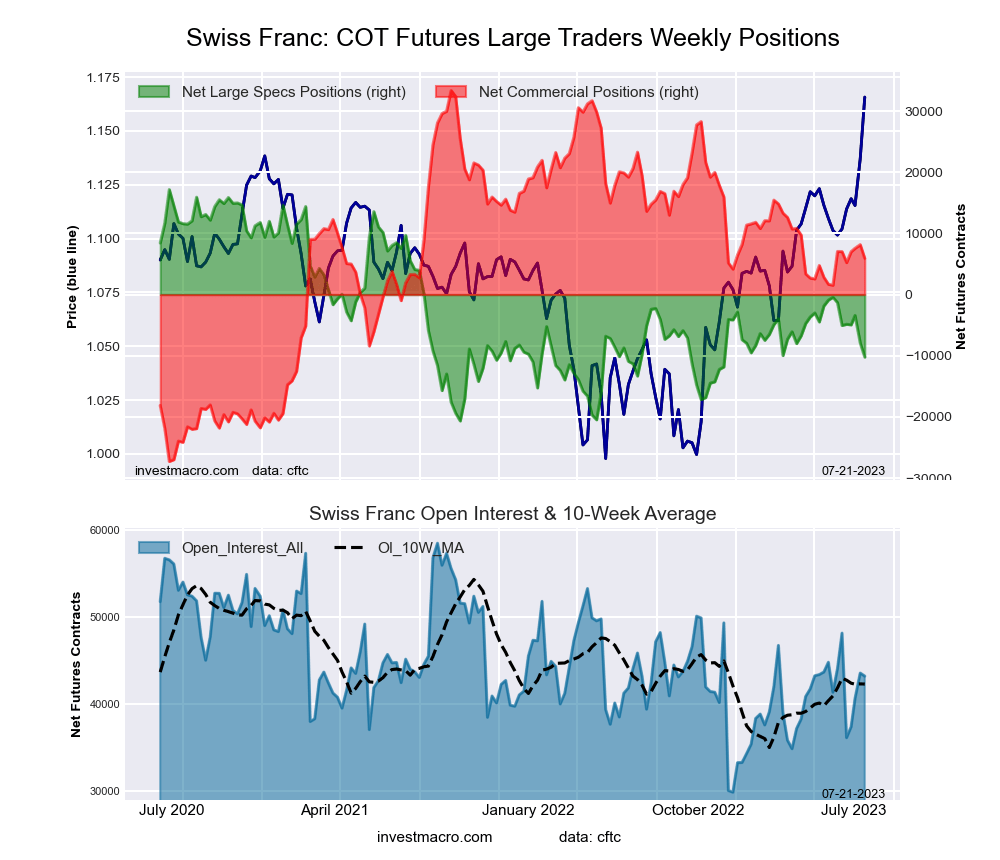
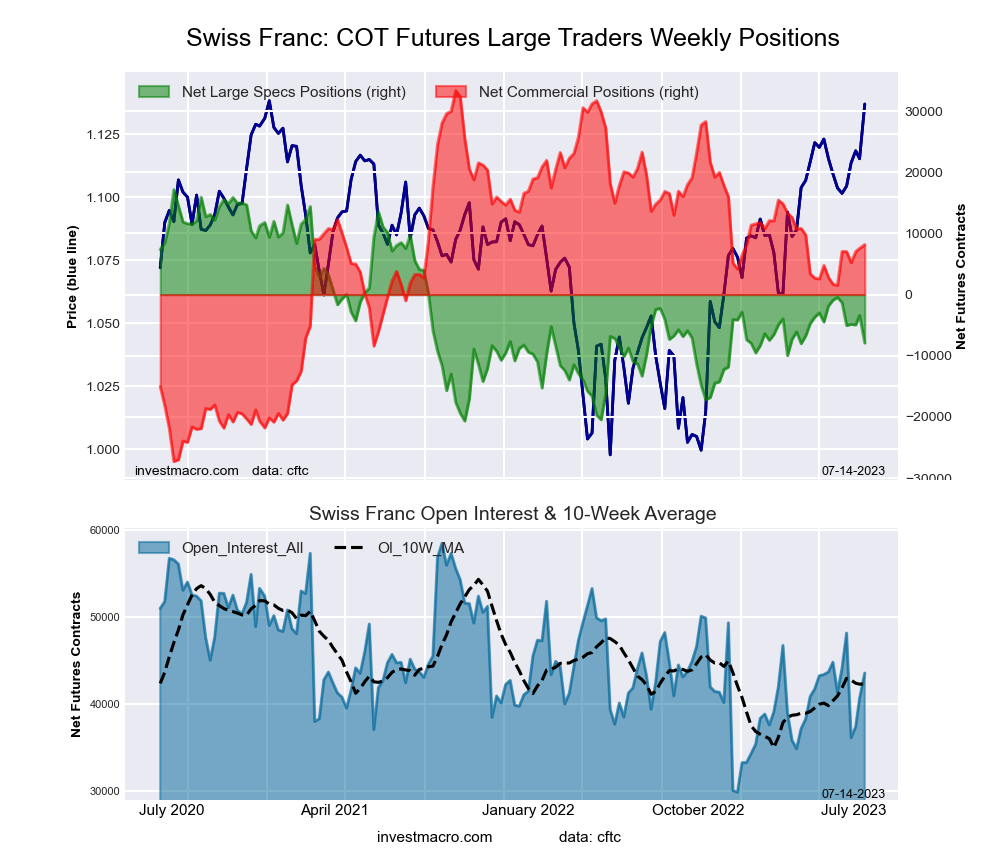
Swiss Franc Futures:
 The Swiss Franc large speculator standing this week totaled a net position of -8,431 contracts in the data reported through Tuesday. This was a weekly gain of 1,780 contracts from the previous week which had a total of -10,211 net contracts.
This week’s current strength score (the trader positioning range over the past three years, measured from 0 to 100) shows the speculators are currently Bearish with a score of 32.3 percent. The commercials are Bullish with a score of 50.6 percent and the small traders (not shown in chart) are Bullish with a score of 74.5 percent.
Price Trend-Following Model: Strong Uptrend
Our weekly trend-following model classifies the current market price position as: Strong Uptrend. The current action for the model is considered to be: Hold – Maintain Long Position.
| SWISS FRANC Statistics | SPECULATORS | COMMERCIALS | SMALL TRADERS |
| – Percent of Open Interest Longs: | 17.7 | 38.0 | 43.1 |
| – Percent of Open Interest Shorts: | 36.7 | 30.3 | 31.8 |
| – Net Position: | -8,431 | 3,421 | 5,010 |
| – Gross Longs: | 7,804 | 16,787 | 19,044 |
| – Gross Shorts: | 16,235 | 13,366 | 14,034 |
| – Long to Short Ratio: | 0.5 to 1 | 1.3 to 1 | 1.4 to 1 |
| NET POSITION TREND: | |||
| – Strength Index Score (3 Year Range Pct): | 32.3 | 50.6 | 74.5 |
| – Strength Index Reading (3 Year Range): | Bearish | Bullish | Bullish |
| NET POSITION MOVEMENT INDEX: | |||
| – 6-Week Change in Strength Index: | -9.0 | -6.0 | 23.7 |
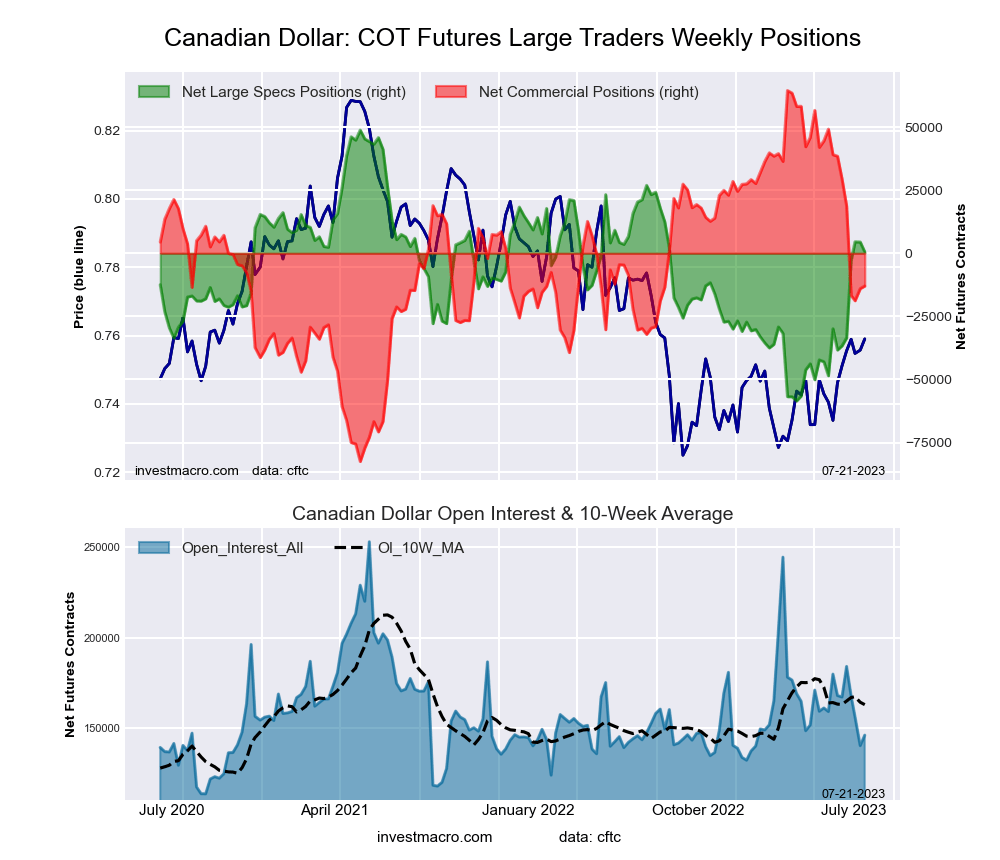
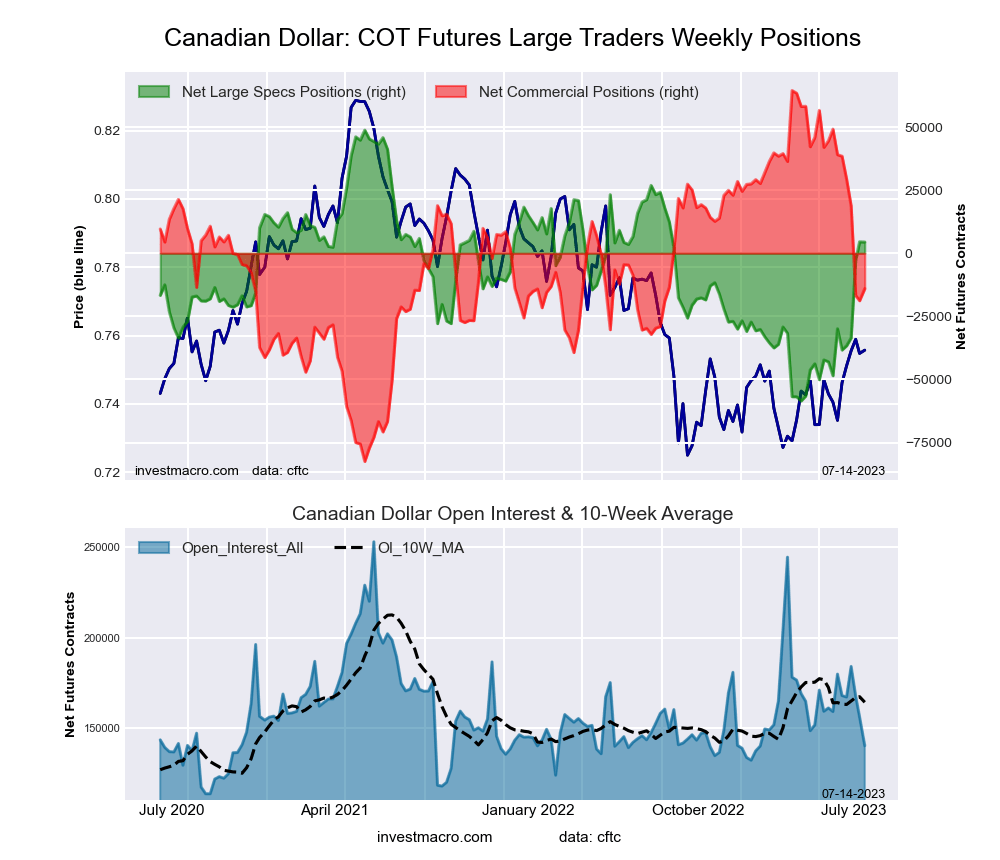
Canadian Dollar Futures:
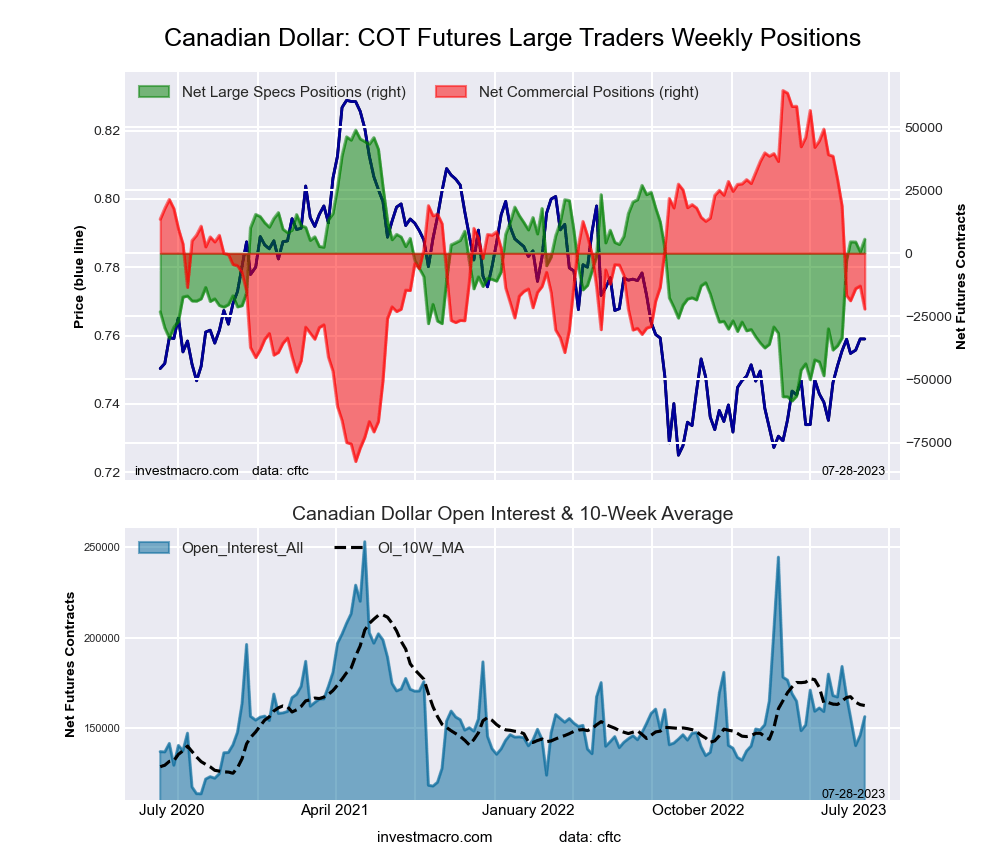 The Canadian Dollar large speculator standing this week totaled a net position of 5,530 contracts in the data reported through Tuesday. This was a weekly rise of 5,009 contracts from the previous week which had a total of 521 net contracts.
This week’s current strength score (the trader positioning range over the past three years, measured from 0 to 100) shows the speculators are currently Bullish with a score of 59.7 percent. The commercials are Bearish with a score of 41.1 percent and the small traders (not shown in chart) are Bullish with a score of 59.6 percent.
Price Trend-Following Model: Uptrend
Our weekly trend-following model classifies the current market price position as: Uptrend. The current action for the model is considered to be: Hold – Maintain Long Position.
| CANADIAN DOLLAR Statistics | SPECULATORS | COMMERCIALS | SMALL TRADERS |
| – Percent of Open Interest Longs: | 27.3 | 47.0 | 25.2 |
| – Percent of Open Interest Shorts: | 23.8 | 61.1 | 14.6 |
| – Net Position: | 5,530 | -22,096 | 16,566 |
| – Gross Longs: | 42,759 | 73,539 | 39,413 |
| – Gross Shorts: | 37,229 | 95,635 | 22,847 |
| – Long to Short Ratio: | 1.1 to 1 | 0.8 to 1 | 1.7 to 1 |
| NET POSITION TREND: | |||
| – Strength Index Score (3 Year Range Pct): | 59.7 | 41.1 | 59.6 |
| – Strength Index Reading (3 Year Range): | Bullish | Bearish | Bullish |
| NET POSITION MOVEMENT INDEX: | |||
| – 6-Week Change in Strength Index: | 39.3 | -35.0 | 20.6 |
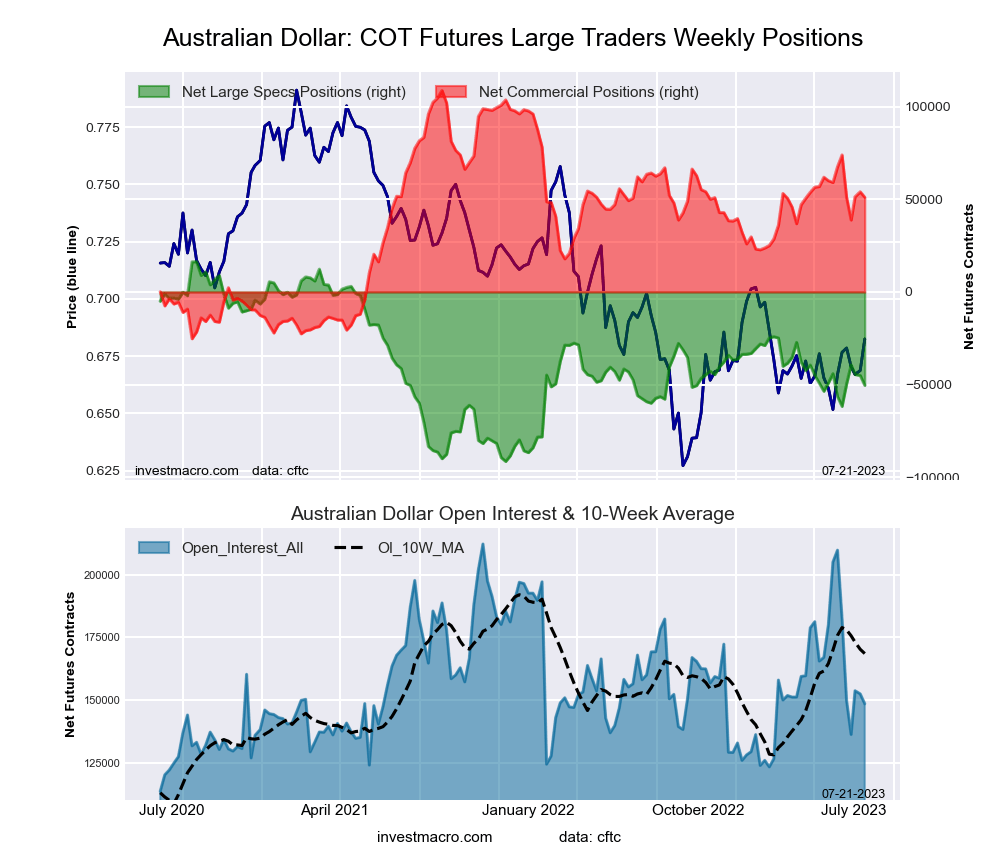
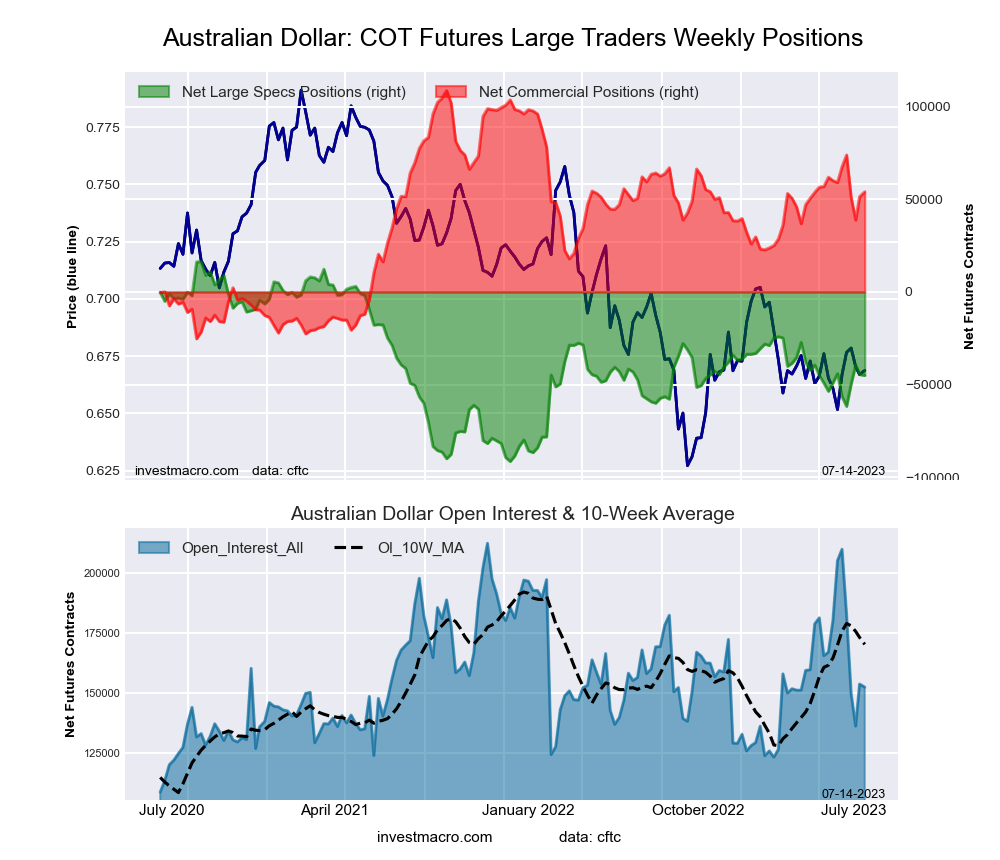
Australian Dollar Futures:
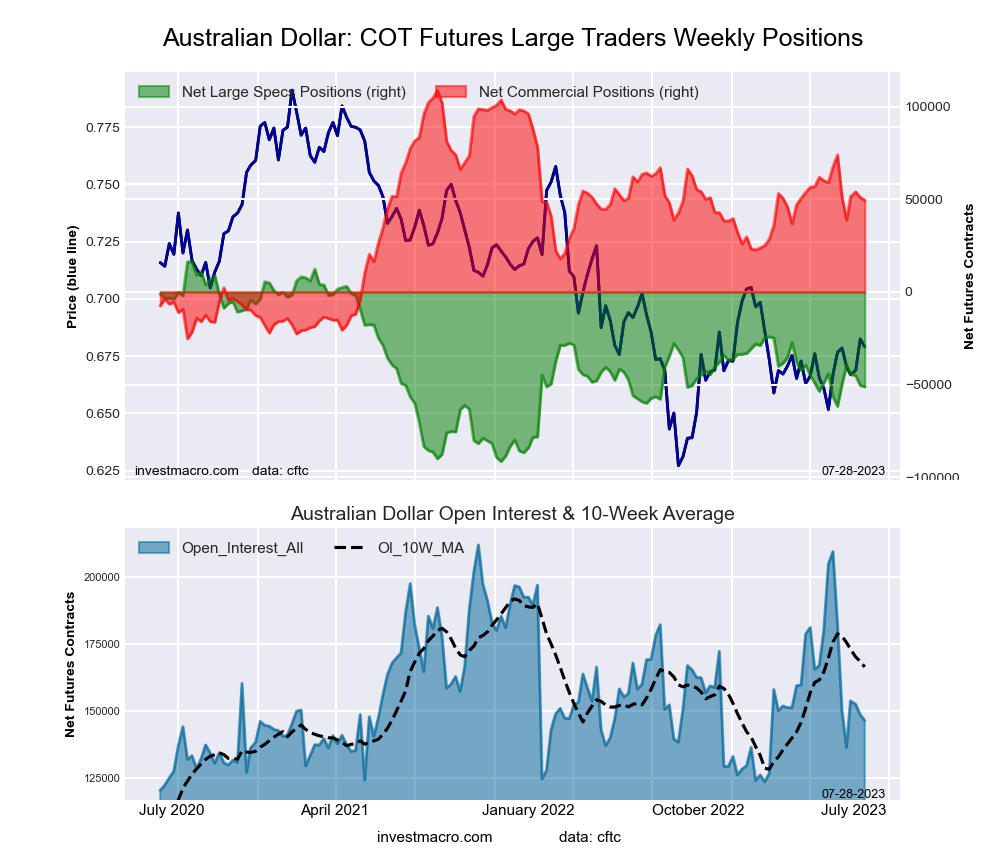 The Australian Dollar large speculator standing this week totaled a net position of -51,201 contracts in the data reported through Tuesday. This was a weekly reduction of -800 contracts from the previous week which had a total of -50,401 net contracts.
This week’s current strength score (the trader positioning range over the past three years, measured from 0 to 100) shows the speculators are currently Bearish with a score of 37.4 percent. The commercials are Bullish with a score of 55.9 percent and the small traders (not shown in chart) are Bullish with a score of 56.4 percent.
Price Trend-Following Model: Uptrend
Our weekly trend-following model classifies the current market price position as: Uptrend. The current action for the model is considered to be: Hold – Maintain Long Position.
| AUSTRALIAN DOLLAR Statistics | SPECULATORS | COMMERCIALS | SMALL TRADERS |
| – Percent of Open Interest Longs: | 26.7 | 54.8 | 16.2 |
| – Percent of Open Interest Shorts: | 61.7 | 21.0 | 15.1 |
| – Net Position: | -51,201 | 49,561 | 1,640 |
| – Gross Longs: | 39,108 | 80,237 | 23,735 |
| – Gross Shorts: | 90,309 | 30,676 | 22,095 |
| – Long to Short Ratio: | 0.4 to 1 | 2.6 to 1 | 1.1 to 1 |
| NET POSITION TREND: | |||
| – Strength Index Score (3 Year Range Pct): | 37.4 | 55.9 | 56.4 |
| – Strength Index Reading (3 Year Range): | Bearish | Bullish | Bullish |
| NET POSITION MOVEMENT INDEX: | |||
| – 6-Week Change in Strength Index: | 9.8 | -18.2 | 33.7 |
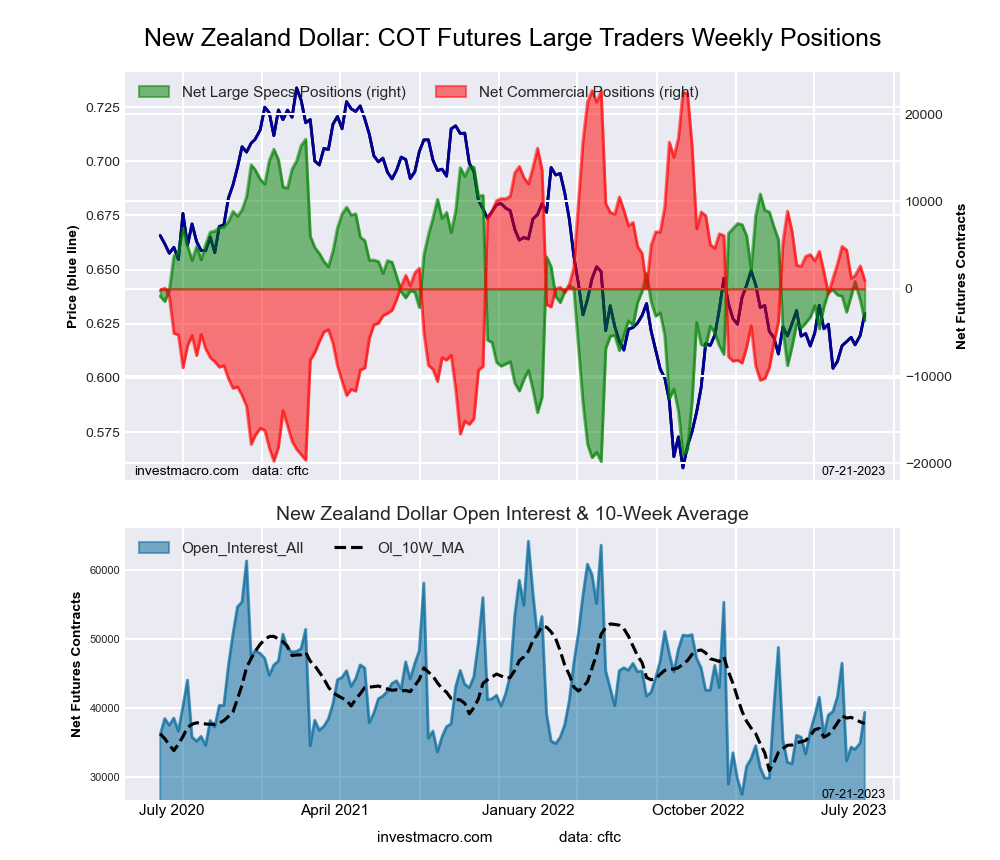
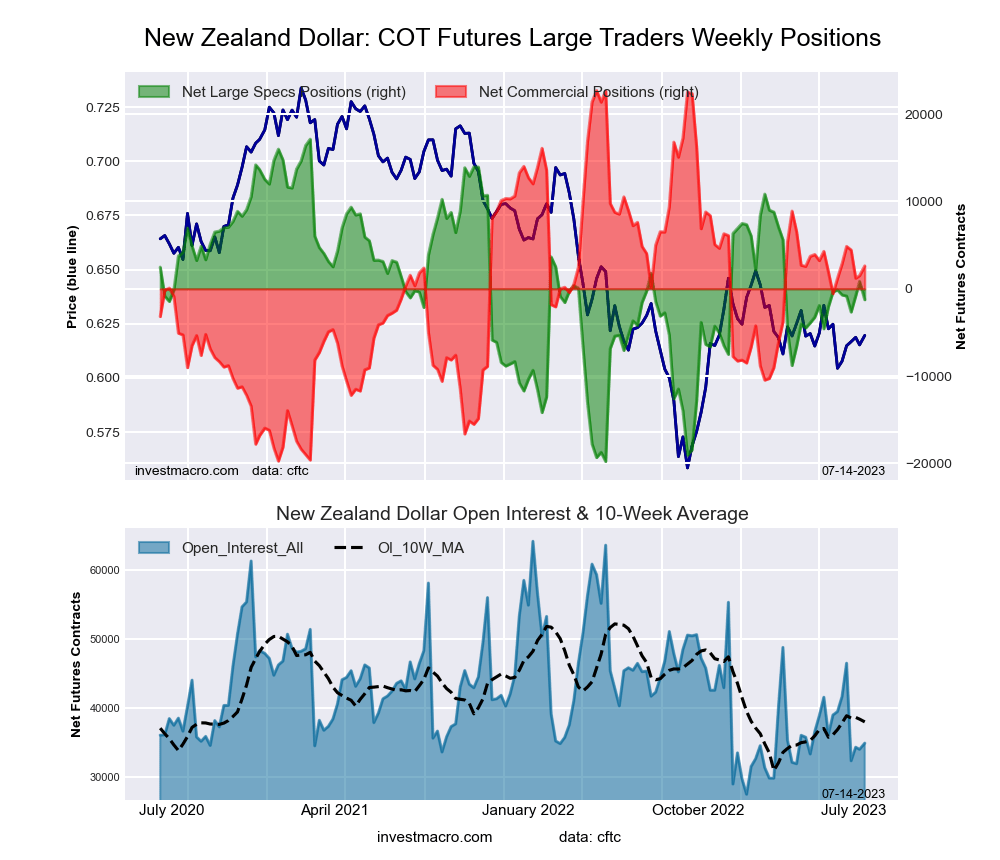
New Zealand Dollar Futures:
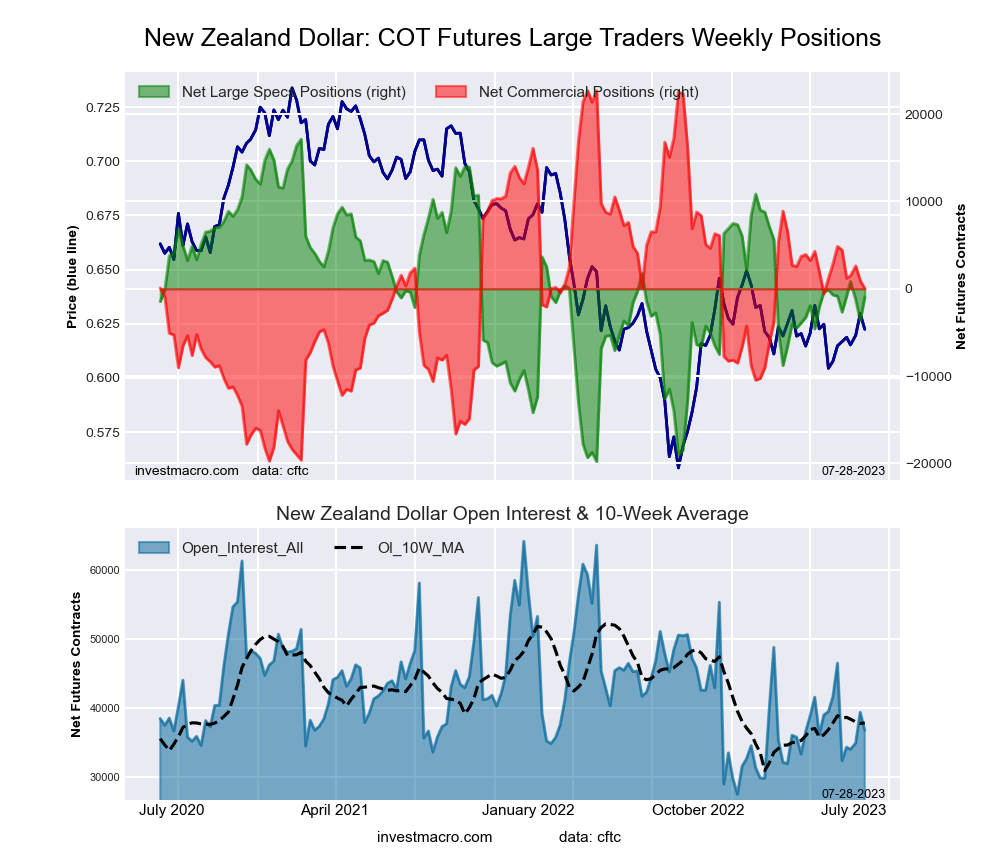 The New Zealand Dollar large speculator standing this week totaled a net position of -949 contracts in the data reported through Tuesday. This was a weekly boost of 2,677 contracts from the previous week which had a total of -3,626 net contracts.
This week’s current strength score (the trader positioning range over the past three years, measured from 0 to 100) shows the speculators are currently Bullish with a score of 51.0 percent. The commercials are Bearish with a score of 46.6 percent and the small traders (not shown in chart) are Bullish with a score of 60.9 percent.
Price Trend-Following Model: Downtrend
Our weekly trend-following model classifies the current market price position as: Downtrend. The current action for the model is considered to be: Hold – Maintain Short Position.
| NEW ZEALAND DOLLAR Statistics | SPECULATORS | COMMERCIALS | SMALL TRADERS |
| – Percent of Open Interest Longs: | 35.1 | 53.4 | 11.1 |
| – Percent of Open Interest Shorts: | 37.7 | 53.3 | 8.6 |
| – Net Position: | -949 | 32 | 917 |
| – Gross Longs: | 12,933 | 19,664 | 4,080 |
| – Gross Shorts: | 13,882 | 19,632 | 3,163 |
| – Long to Short Ratio: | 0.9 to 1 | 1.0 to 1 | 1.3 to 1 |
| NET POSITION TREND: | |||
| – Strength Index Score (3 Year Range Pct): | 51.0 | 46.6 | 60.9 |
| – Strength Index Reading (3 Year Range): | Bullish | Bearish | Bullish |
| NET POSITION MOVEMENT INDEX: | |||
| – 6-Week Change in Strength Index: | -0.3 | -11.4 | 58.8 |
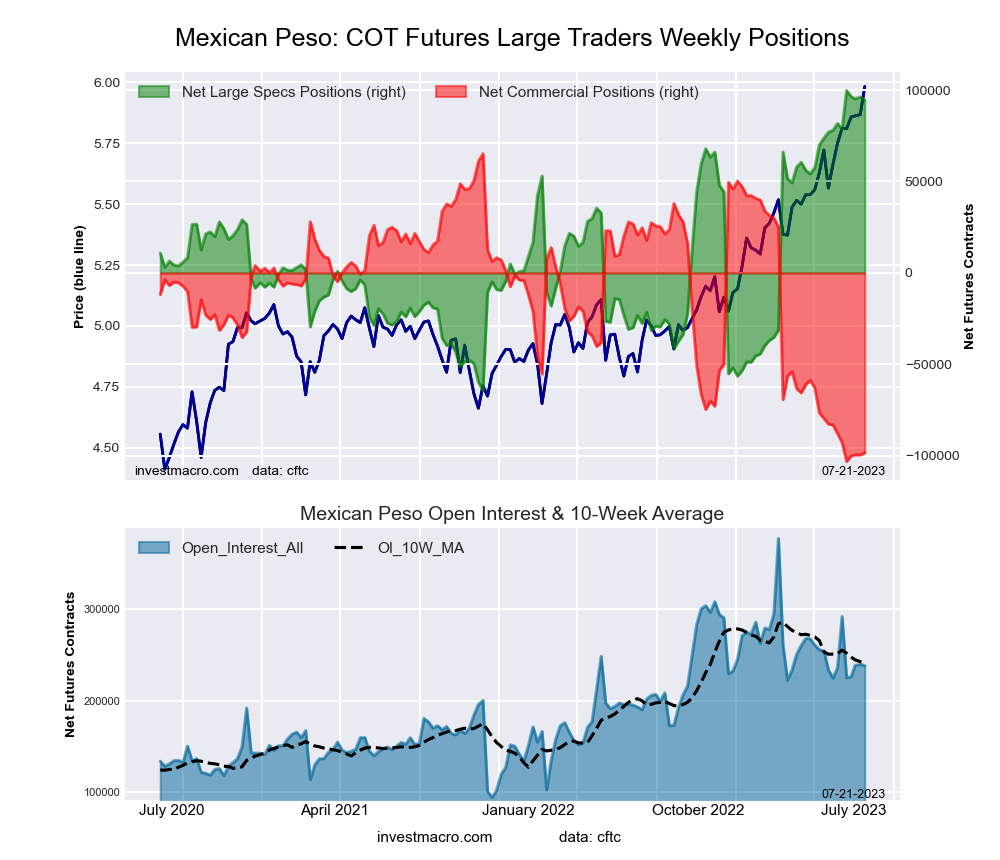
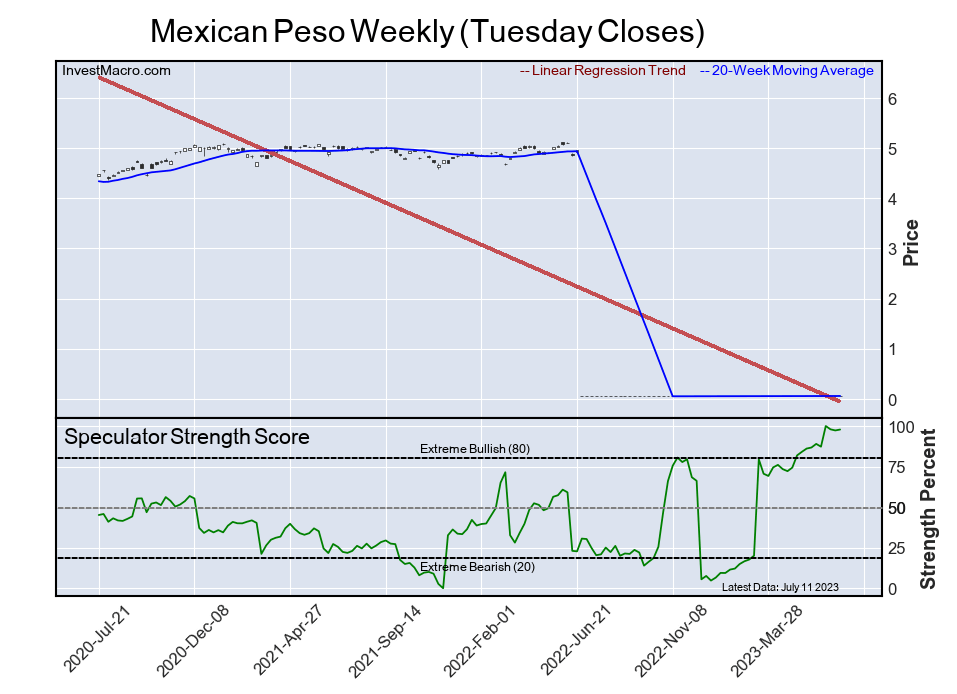
Mexican Peso Futures:
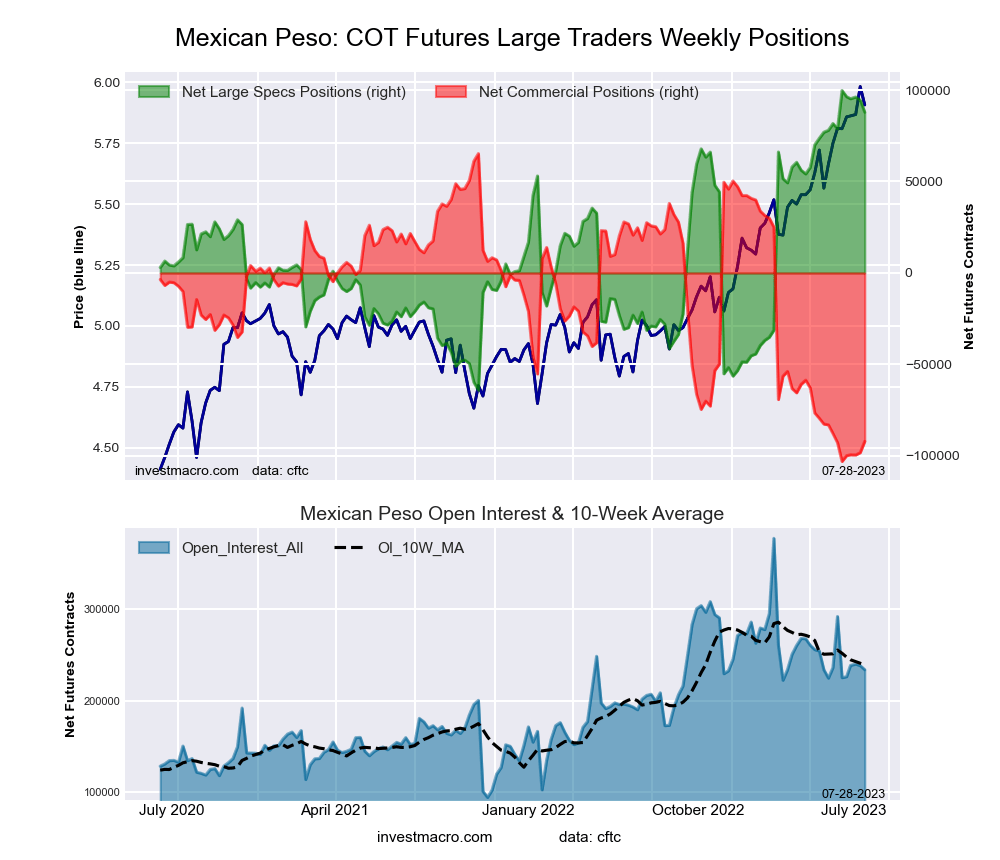 The Mexican Peso large speculator standing this week totaled a net position of 87,841 contracts in the data reported through Tuesday. This was a weekly decrease of -6,651 contracts from the previous week which had a total of 94,492 net contracts.
This week’s current strength score (the trader positioning range over the past three years, measured from 0 to 100) shows the speculators are currently Bullish-Extreme with a score of 92.8 percent. The commercials are Bearish-Extreme with a score of 6.5 percent and the small traders (not shown in chart) are Bearish with a score of 38.1 percent.
Price Trend-Following Model: Uptrend
Our weekly trend-following model classifies the current market price position as: Uptrend. The current action for the model is considered to be: Hold – Maintain Long Position.
| MEXICAN PESO Statistics | SPECULATORS | COMMERCIALS | SMALL TRADERS |
| – Percent of Open Interest Longs: | 50.4 | 45.4 | 3.7 |
| – Percent of Open Interest Shorts: | 12.8 | 84.8 | 1.9 |
| – Net Position: | 87,841 | -92,058 | 4,217 |
| – Gross Longs: | 117,732 | 106,061 | 8,608 |
| – Gross Shorts: | 29,891 | 198,119 | 4,391 |
| – Long to Short Ratio: | 3.9 to 1 | 0.5 to 1 | 2.0 to 1 |
| NET POSITION TREND: | |||
| – Strength Index Score (3 Year Range Pct): | 92.8 | 6.5 | 38.1 |
| – Strength Index Reading (3 Year Range): | Bullish-Extreme | Bearish-Extreme | Bearish |
| NET POSITION MOVEMENT INDEX: | |||
| – 6-Week Change in Strength Index: | 5.5 | 0.4 | -61.9 |
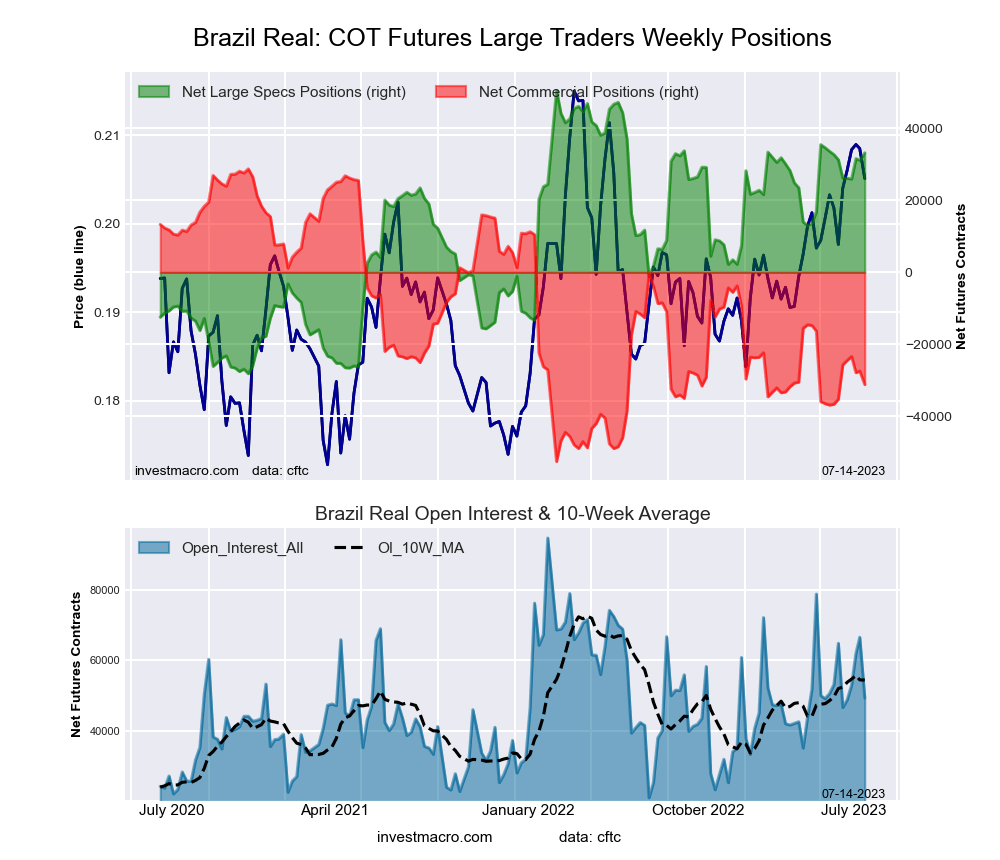
Brazilian Real Futures:
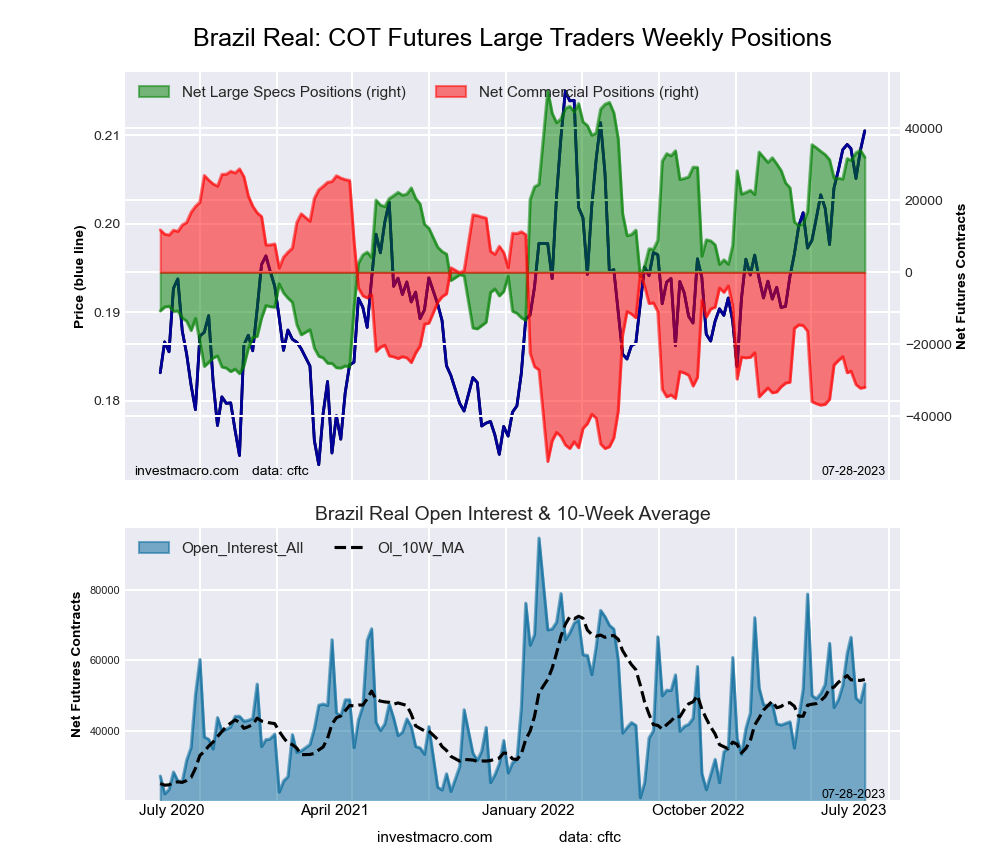 The Brazilian Real large speculator standing this week totaled a net position of 31,971 contracts in the data reported through Tuesday. This was a weekly reduction of -1,962 contracts from the previous week which had a total of 33,933 net contracts.
This week’s current strength score (the trader positioning range over the past three years, measured from 0 to 100) shows the speculators are currently Bullish with a score of 76.4 percent. The commercials are Bearish with a score of 25.3 percent and the small traders (not shown in chart) are Bearish with a score of 43.9 percent.
Price Trend-Following Model: Strong Uptrend
Our weekly trend-following model classifies the current market price position as: Strong Uptrend. The current action for the model is considered to be: Hold – Maintain Long Position.
| BRAZIL REAL Statistics | SPECULATORS | COMMERCIALS | SMALL TRADERS |
| – Percent of Open Interest Longs: | 68.0 | 20.7 | 9.5 |
| – Percent of Open Interest Shorts: | 8.2 | 80.5 | 9.5 |
| – Net Position: | 31,971 | -31,957 | -14 |
| – Gross Longs: | 36,345 | 11,073 | 5,084 |
| – Gross Shorts: | 4,374 | 43,030 | 5,098 |
| – Long to Short Ratio: | 8.3 to 1 | 0.3 to 1 | 1.0 to 1 |
| NET POSITION TREND: | |||
| – Strength Index Score (3 Year Range Pct): | 76.4 | 25.3 | 43.9 |
| – Strength Index Reading (3 Year Range): | Bullish | Bearish | Bearish |
| NET POSITION MOVEMENT INDEX: | |||
| – 6-Week Change in Strength Index: | 7.4 | -9.2 | 13.2 |
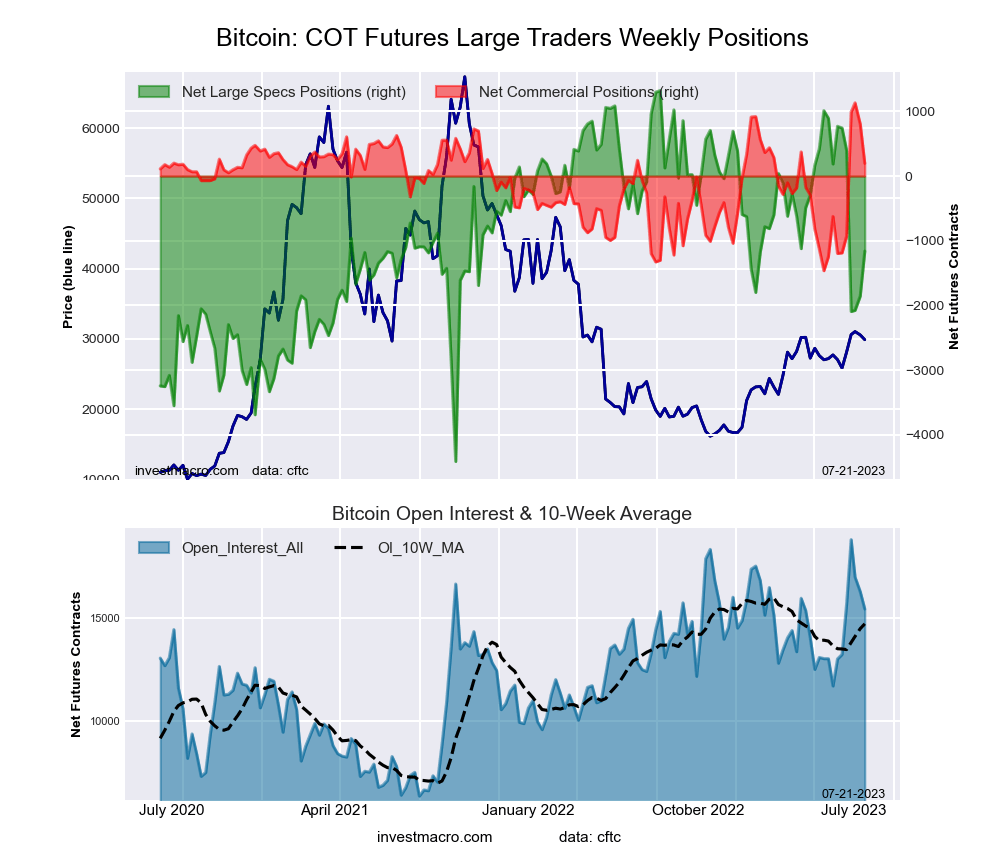
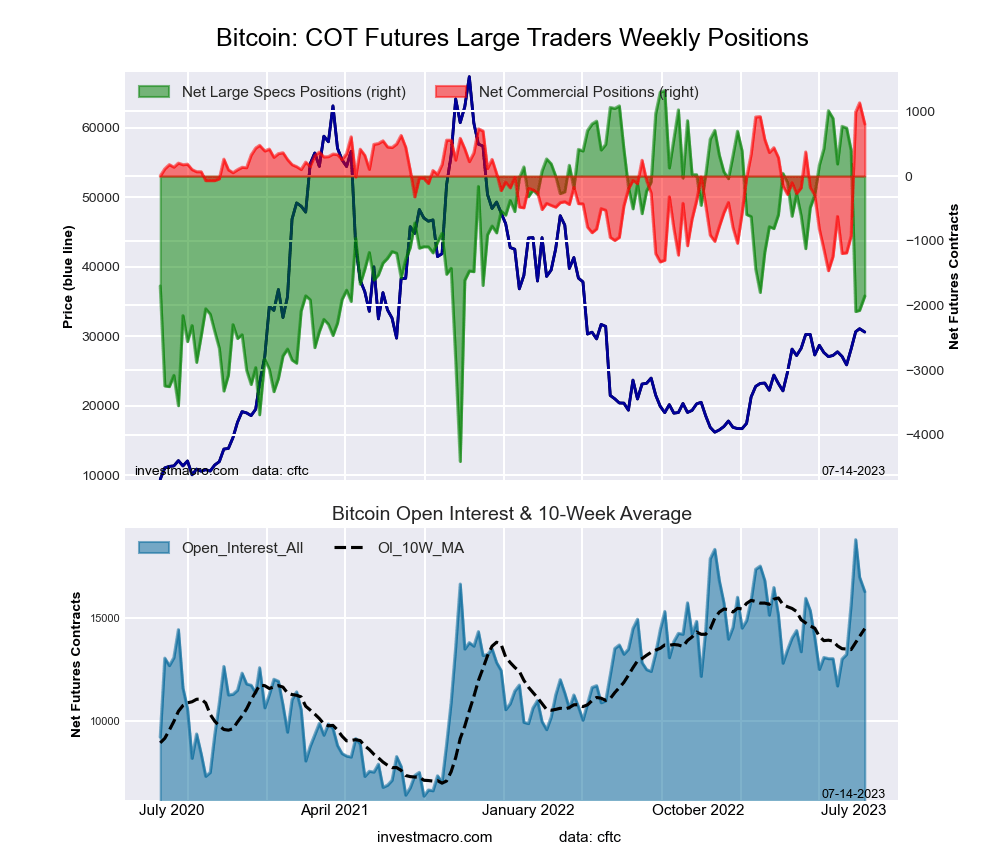
Bitcoin Futures:
 The Bitcoin large speculator standing this week totaled a net position of -645 contracts in the data reported through Tuesday. This was a weekly rise of 516 contracts from the previous week which had a total of -1,161 net contracts.
This week’s current strength score (the trader positioning range over the past three years, measured from 0 to 100) shows the speculators are currently Bullish with a score of 65.7 percent. The commercials are Bearish with a score of 49.5 percent and the small traders (not shown in chart) are Bearish with a score of 31.7 percent.
Price Trend-Following Model: Uptrend
Our weekly trend-following model classifies the current market price position as: Uptrend. The current action for the model is considered to be: Hold – Maintain Long Position.
| BITCOIN Statistics | SPECULATORS | COMMERCIALS | SMALL TRADERS |
| – Percent of Open Interest Longs: | 74.6 | 2.6 | 9.4 |
| – Percent of Open Interest Shorts: | 78.6 | 3.7 | 4.2 |
| – Net Position: | -645 | -178 | 823 |
| – Gross Longs: | 11,941 | 422 | 1,503 |
| – Gross Shorts: | 12,586 | 600 | 680 |
| – Long to Short Ratio: | 0.9 to 1 | 0.7 to 1 | 2.2 to 1 |
| NET POSITION TREND: | |||
| – Strength Index Score (3 Year Range Pct): | 65.7 | 49.5 | 31.7 |
| – Strength Index Reading (3 Year Range): | Bullish | Bearish | Bearish |
| NET POSITION MOVEMENT INDEX: | |||
| – 6-Week Change in Strength Index: | -24.2 | 38.9 | 8.6 |
Article By InvestMacro – Receive our weekly COT Newsletter
*COT Report: The COT data, released weekly to the public each Friday, is updated through the most recent Tuesday (data is 3 days old) and shows a quick view of how large speculators or non-commercials (for-profit traders) were positioned in the futures markets.
The CFTC categorizes trader positions according to commercial hedgers (traders who use futures contracts for hedging as part of the business), non-commercials (large traders who speculate to realize trading profits) and nonreportable traders (usually small traders/speculators) as well as their open interest (contracts open in the market at time of reporting). See CFTC criteria here.


