Archive for Forex and Currency News – Page 5

USD/JPY Stalls Near One-Year High

By RoboForex Analytical Department

The USD/JPY pair paused on Monday after a sharp rally to around 157.95, with the yen holding near its lowest levels of the year. Trading activity was subdued as Japanese markets were closed for a public holiday.

Political uncertainty increased after Prime Minister Sanae Takaichi, a key coalition partner, raised the possibility of early elections on 8 or 15 February, adding another layer of caution to the market.

The yen also faced pressure from recent mixed macroeconomic data, which have clouded the outlook for the Bank of Japan’s future rate-hike trajectory.

Last week, BoJ Governor Kazuo Ueda reiterated that the central bank would continue to raise interest rates if economic momentum and inflation align with forecasts, while also emphasising a flexible approach to policy adjustments.

Over the coming week, traders will focus on a series of key Japanese economic indicators, including current account figures, machine tool orders, manufacturing PMI, and business sentiment data. Any surprises could prompt a shift in the yen’s direction.

Technical Analysis: USD/JPY

H4 Chart:

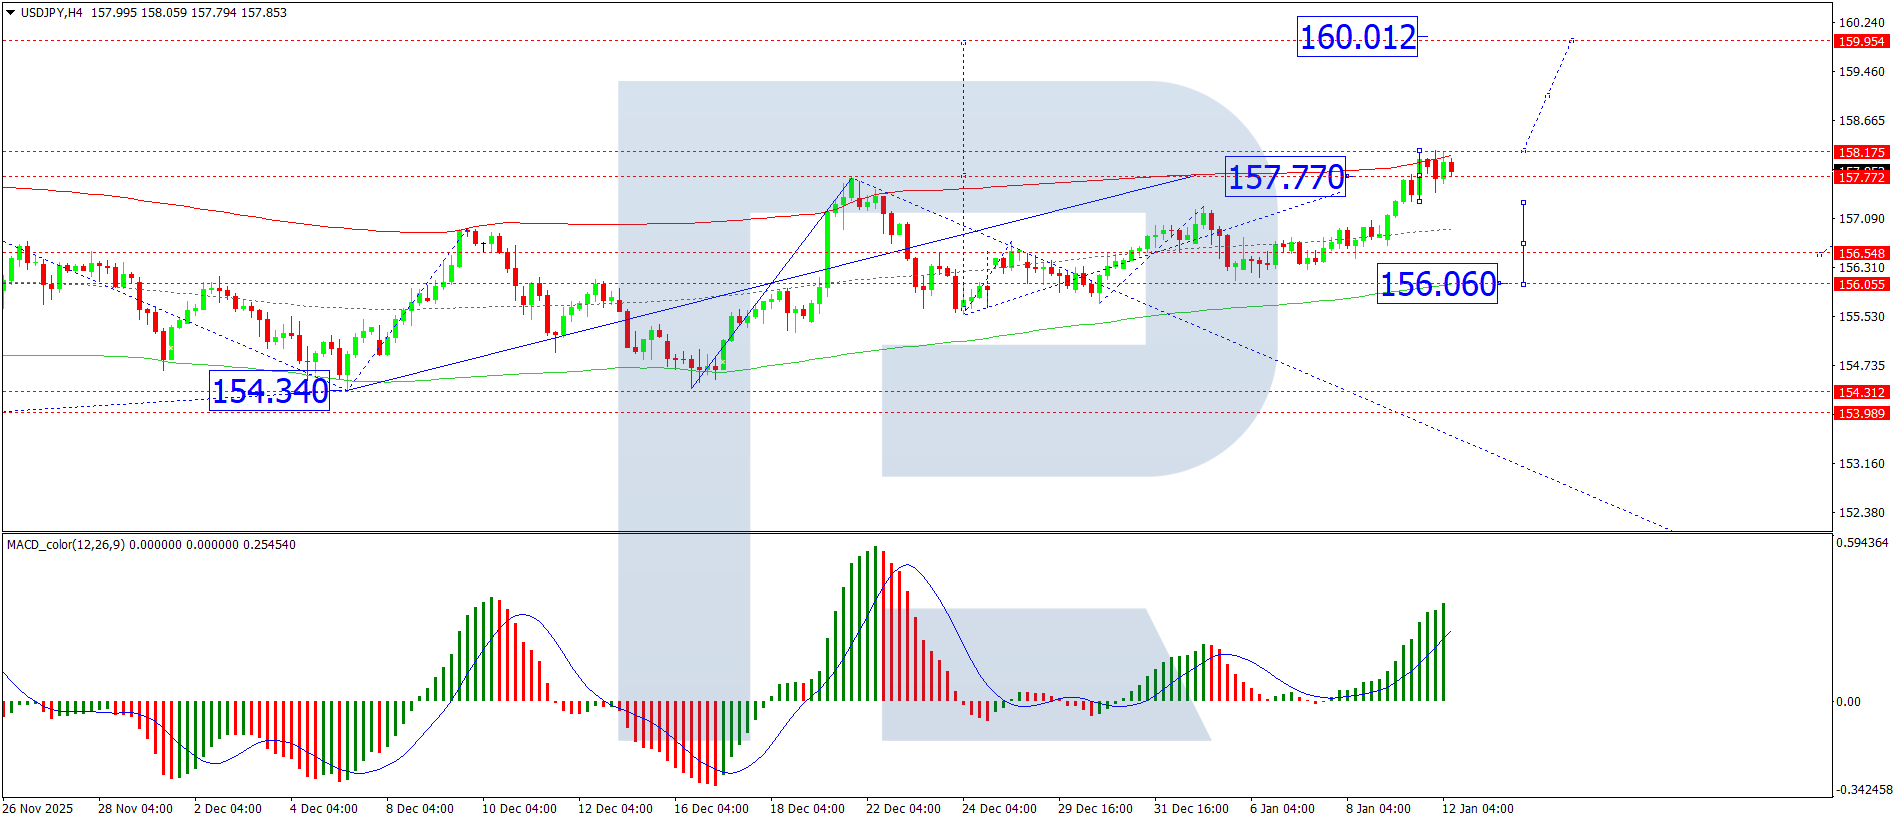
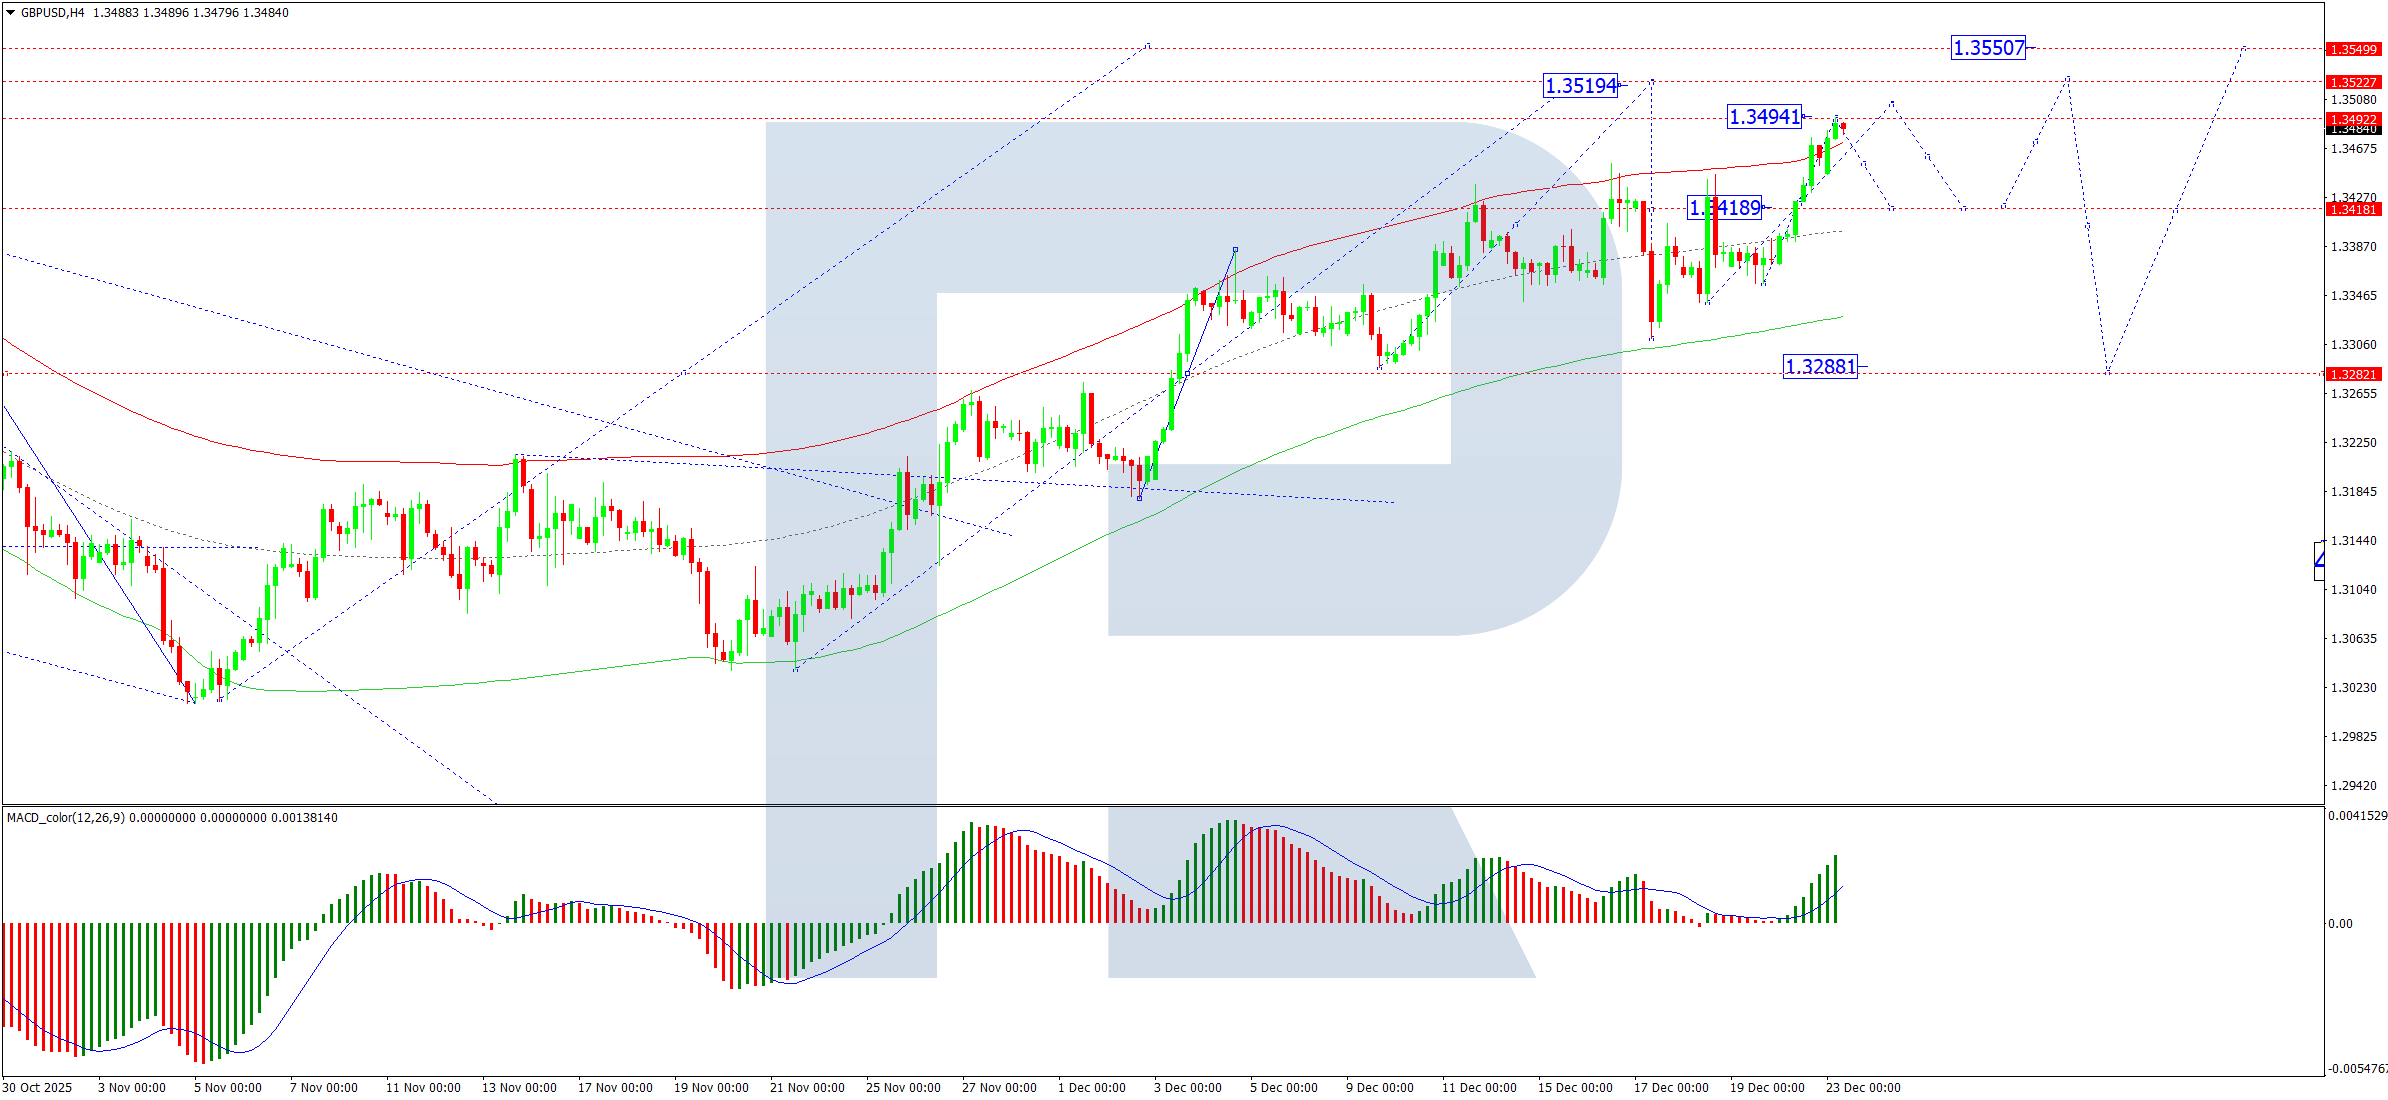
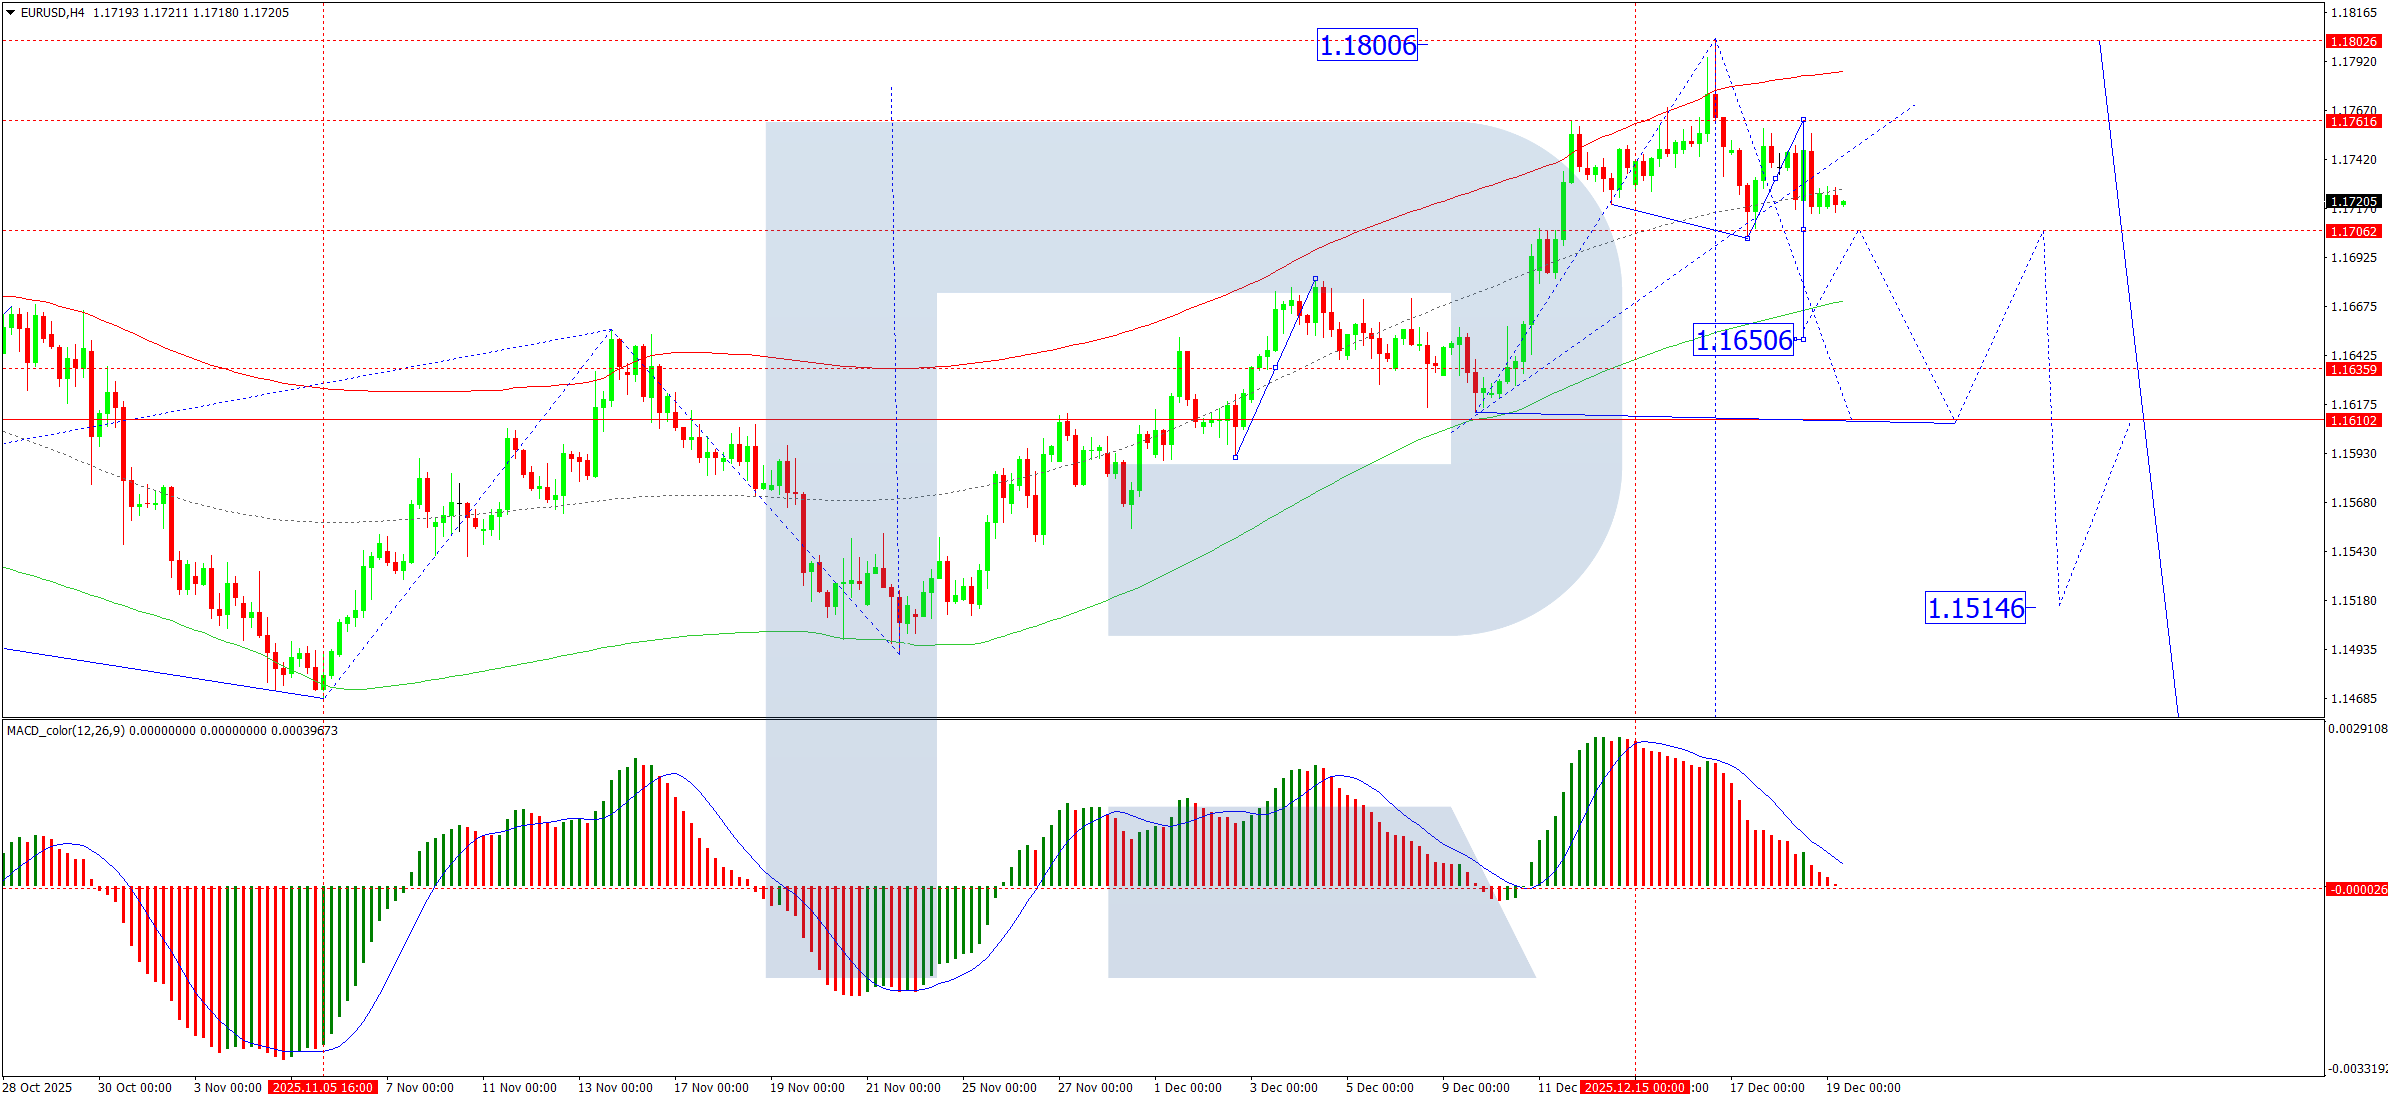
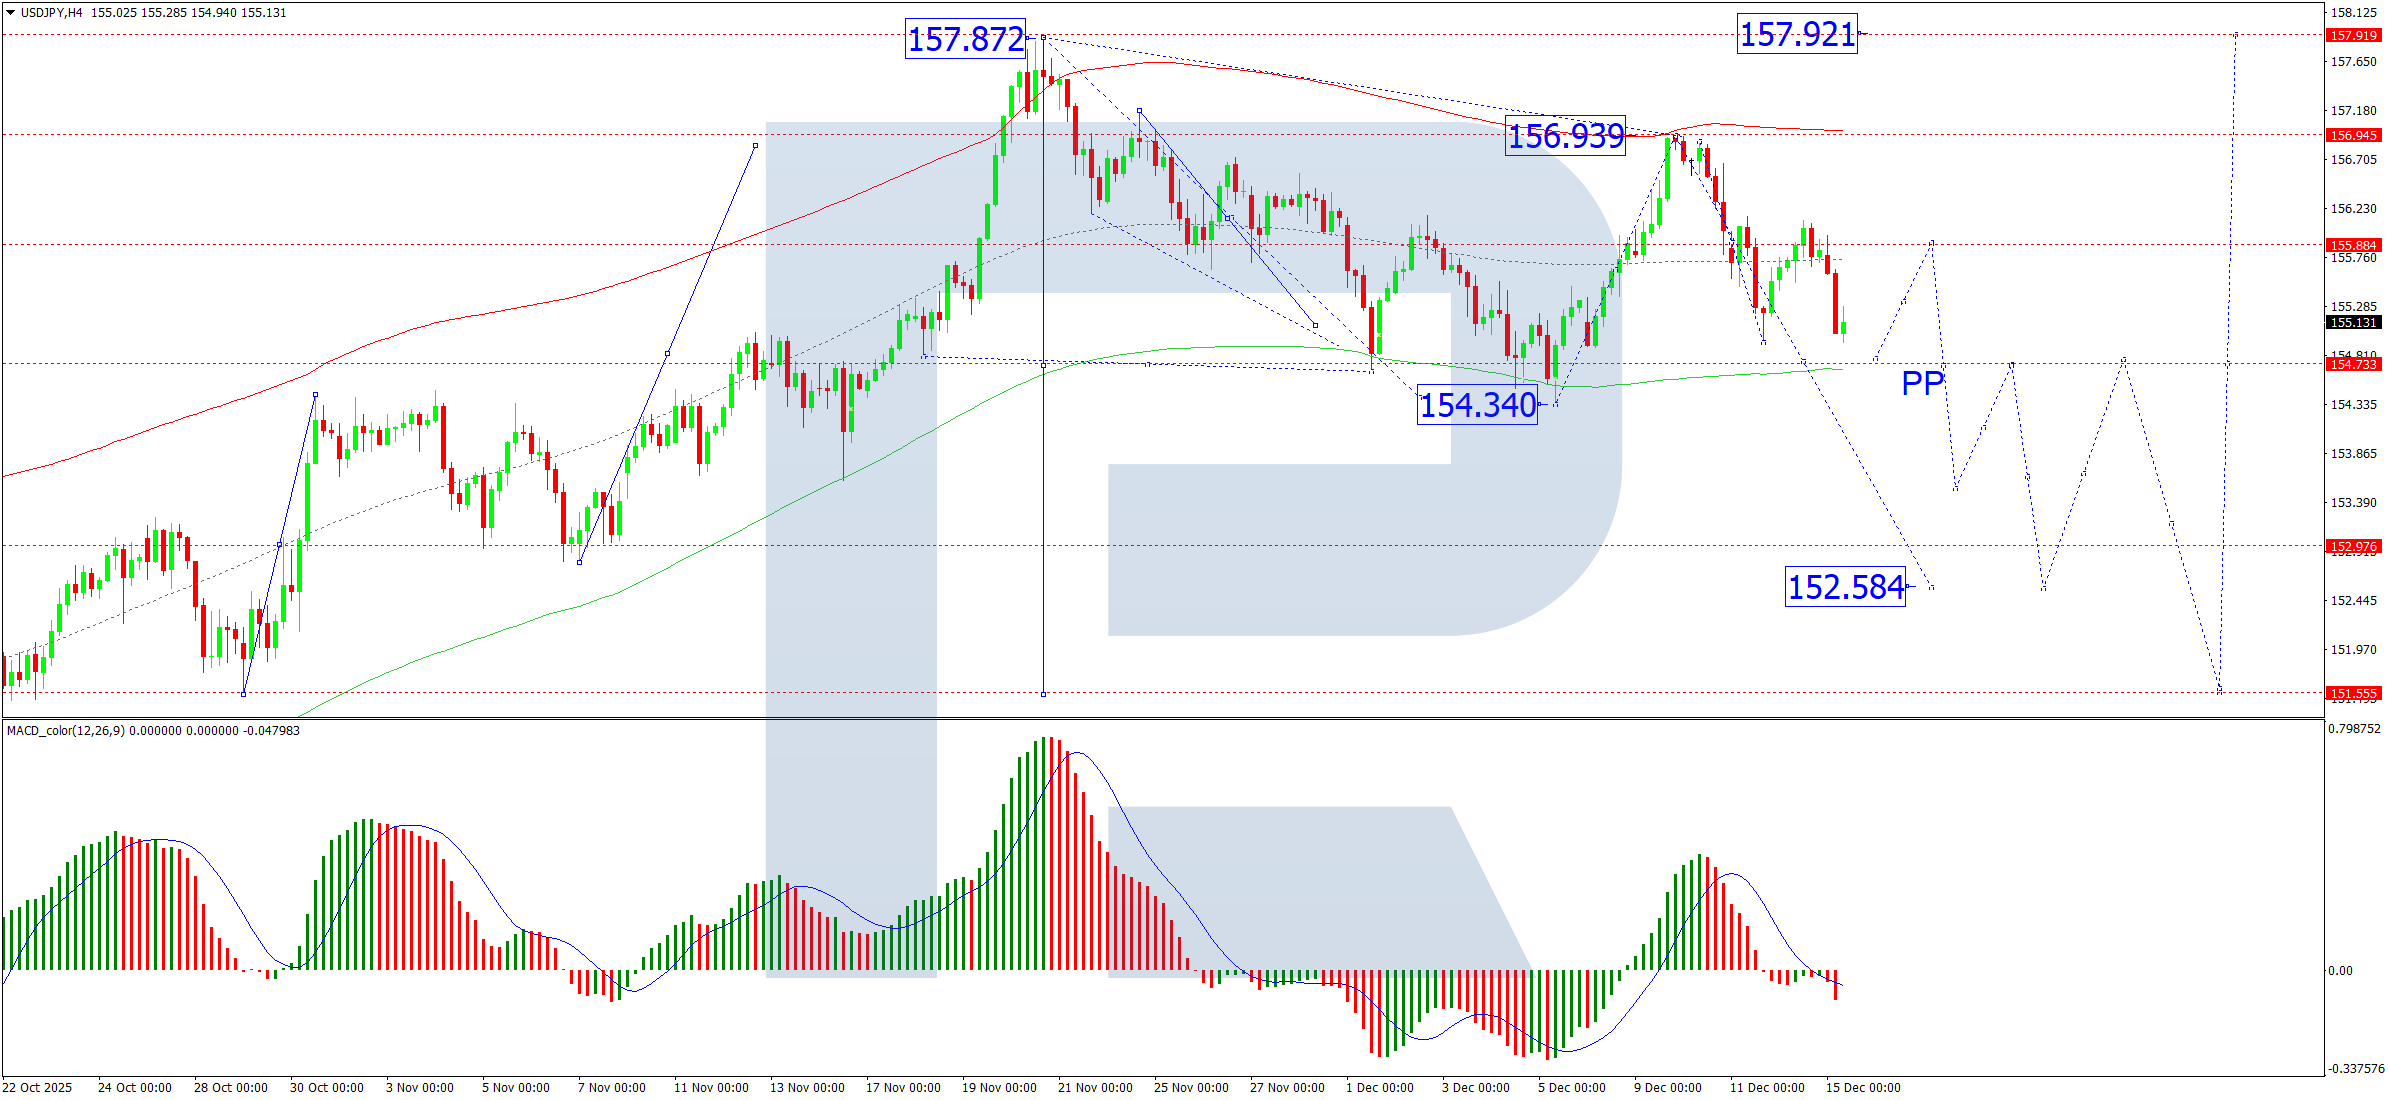
On the H4 chart, the pair has completed a local advance to 157.77 and is likely to enter a period of consolidation around this level. A break below this range could trigger a corrective move towards 156.60. Conversely, an upward break would open the potential for the rally to extend towards 159.33. This outlook is supported by the MACD indicator, with its signal line positioned above zero and pointing firmly upward, indicating ongoing bullish momentum.
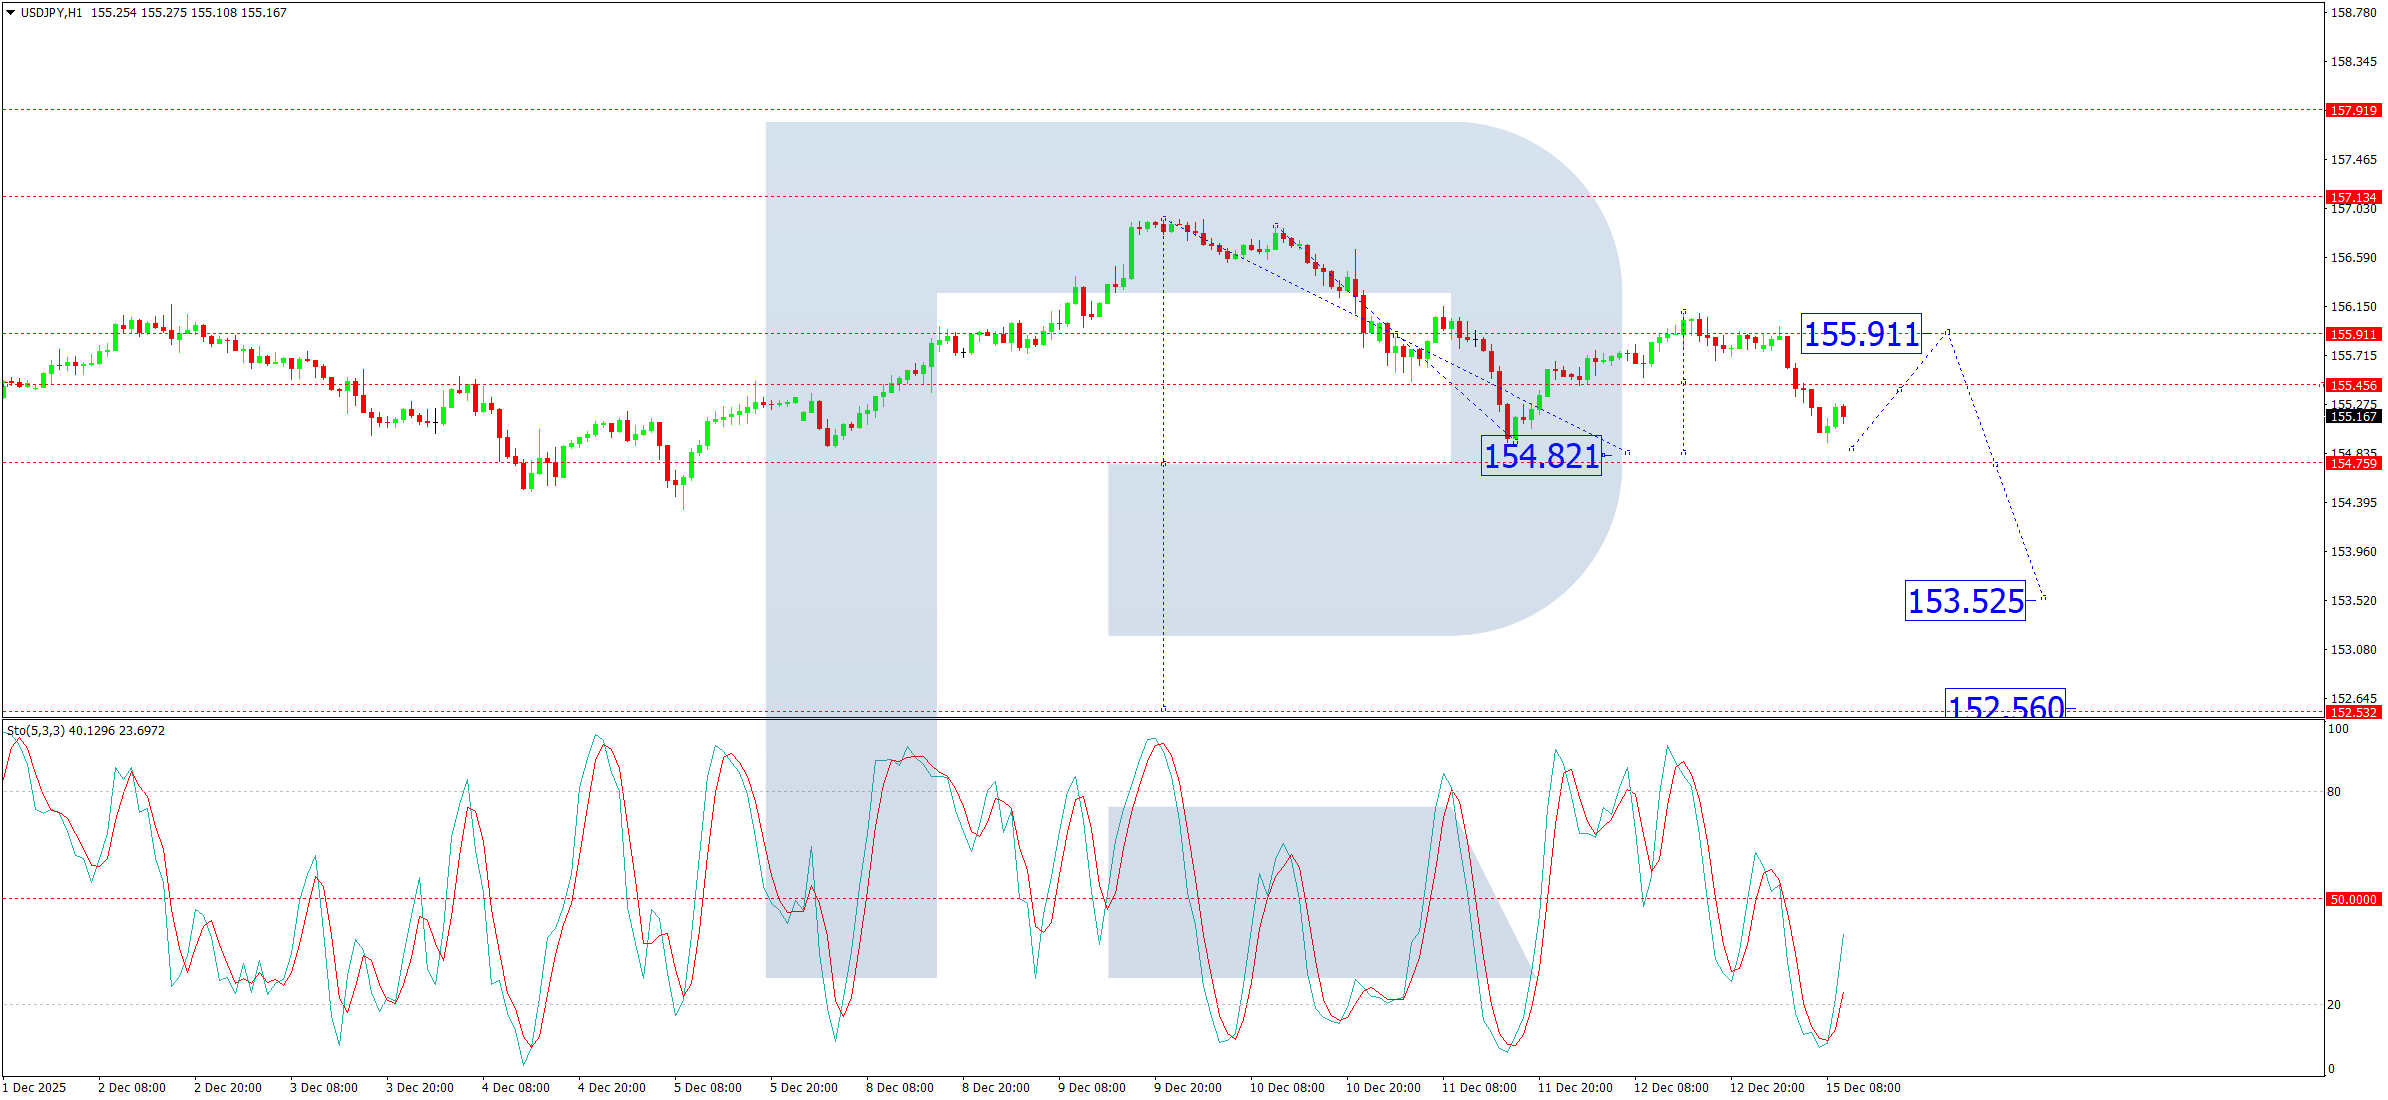
H1 Chart:

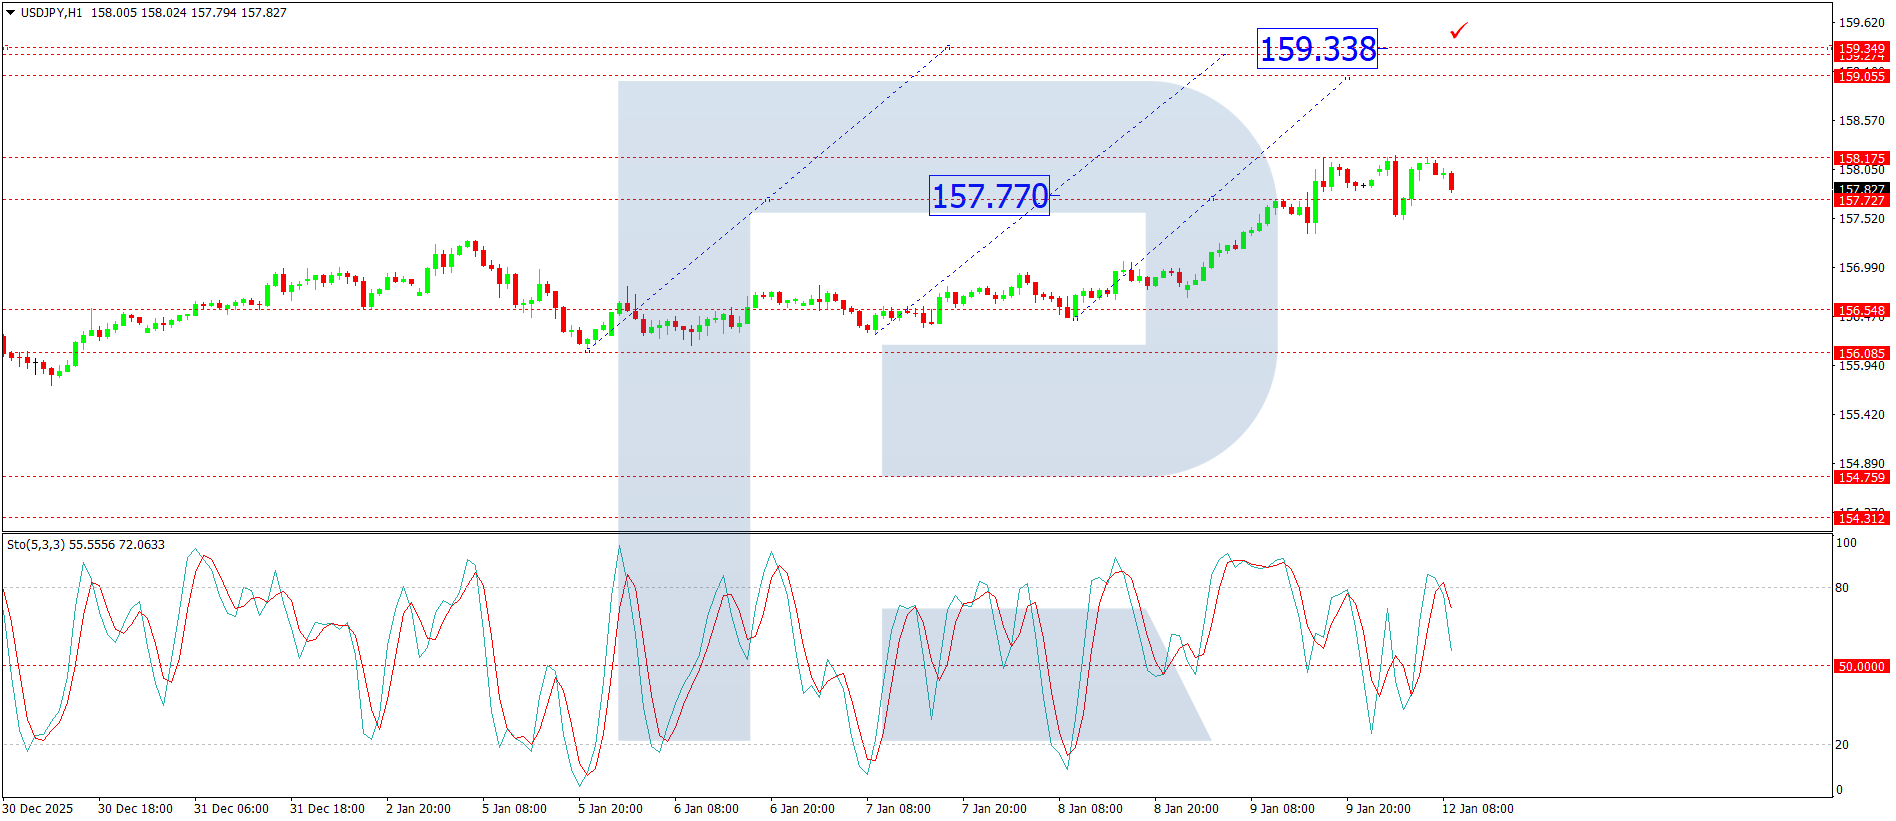
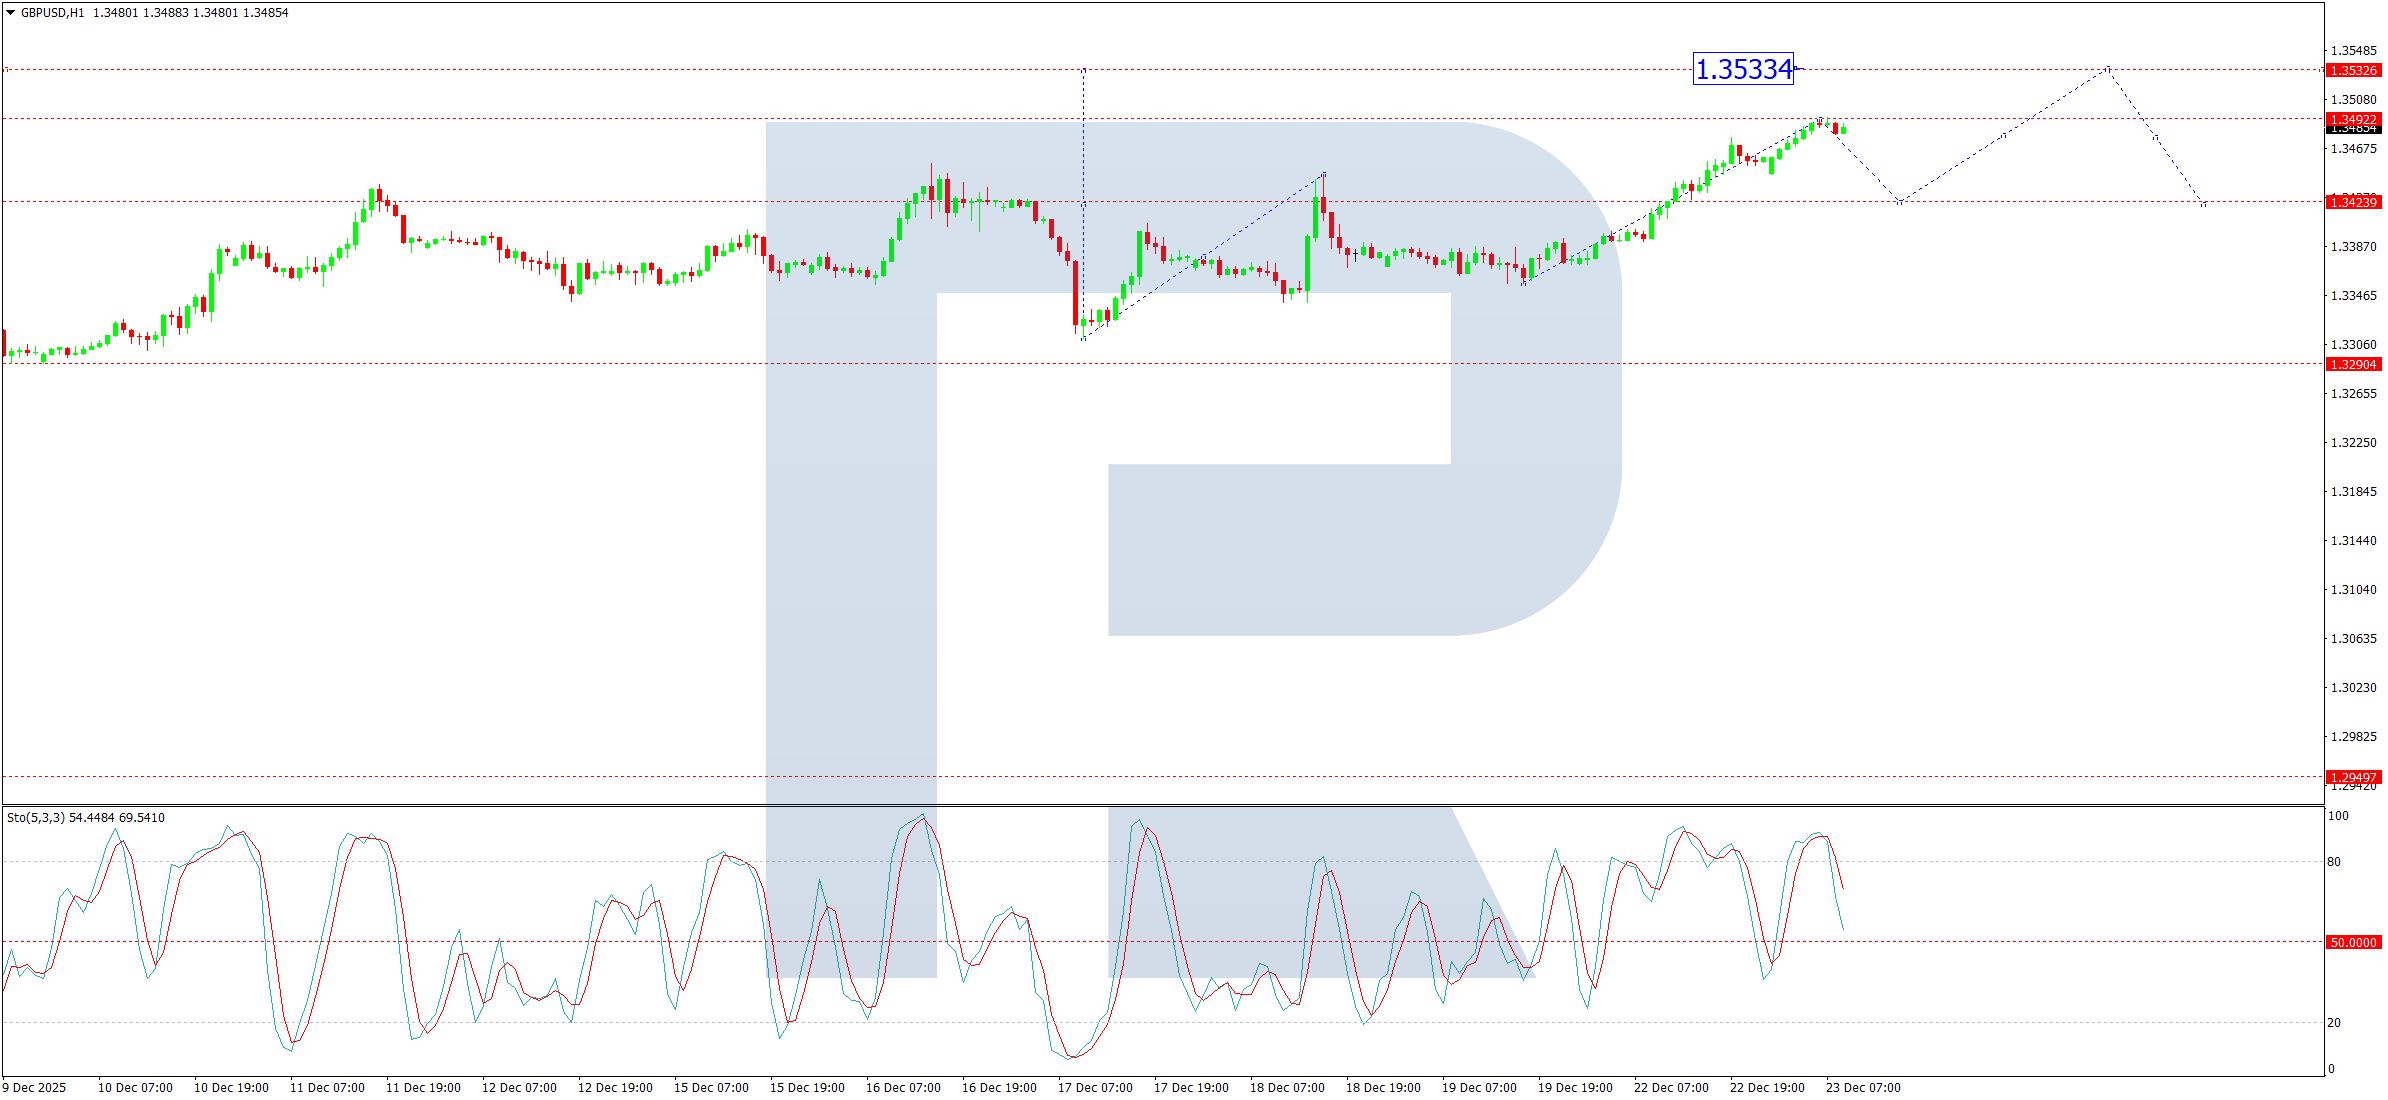
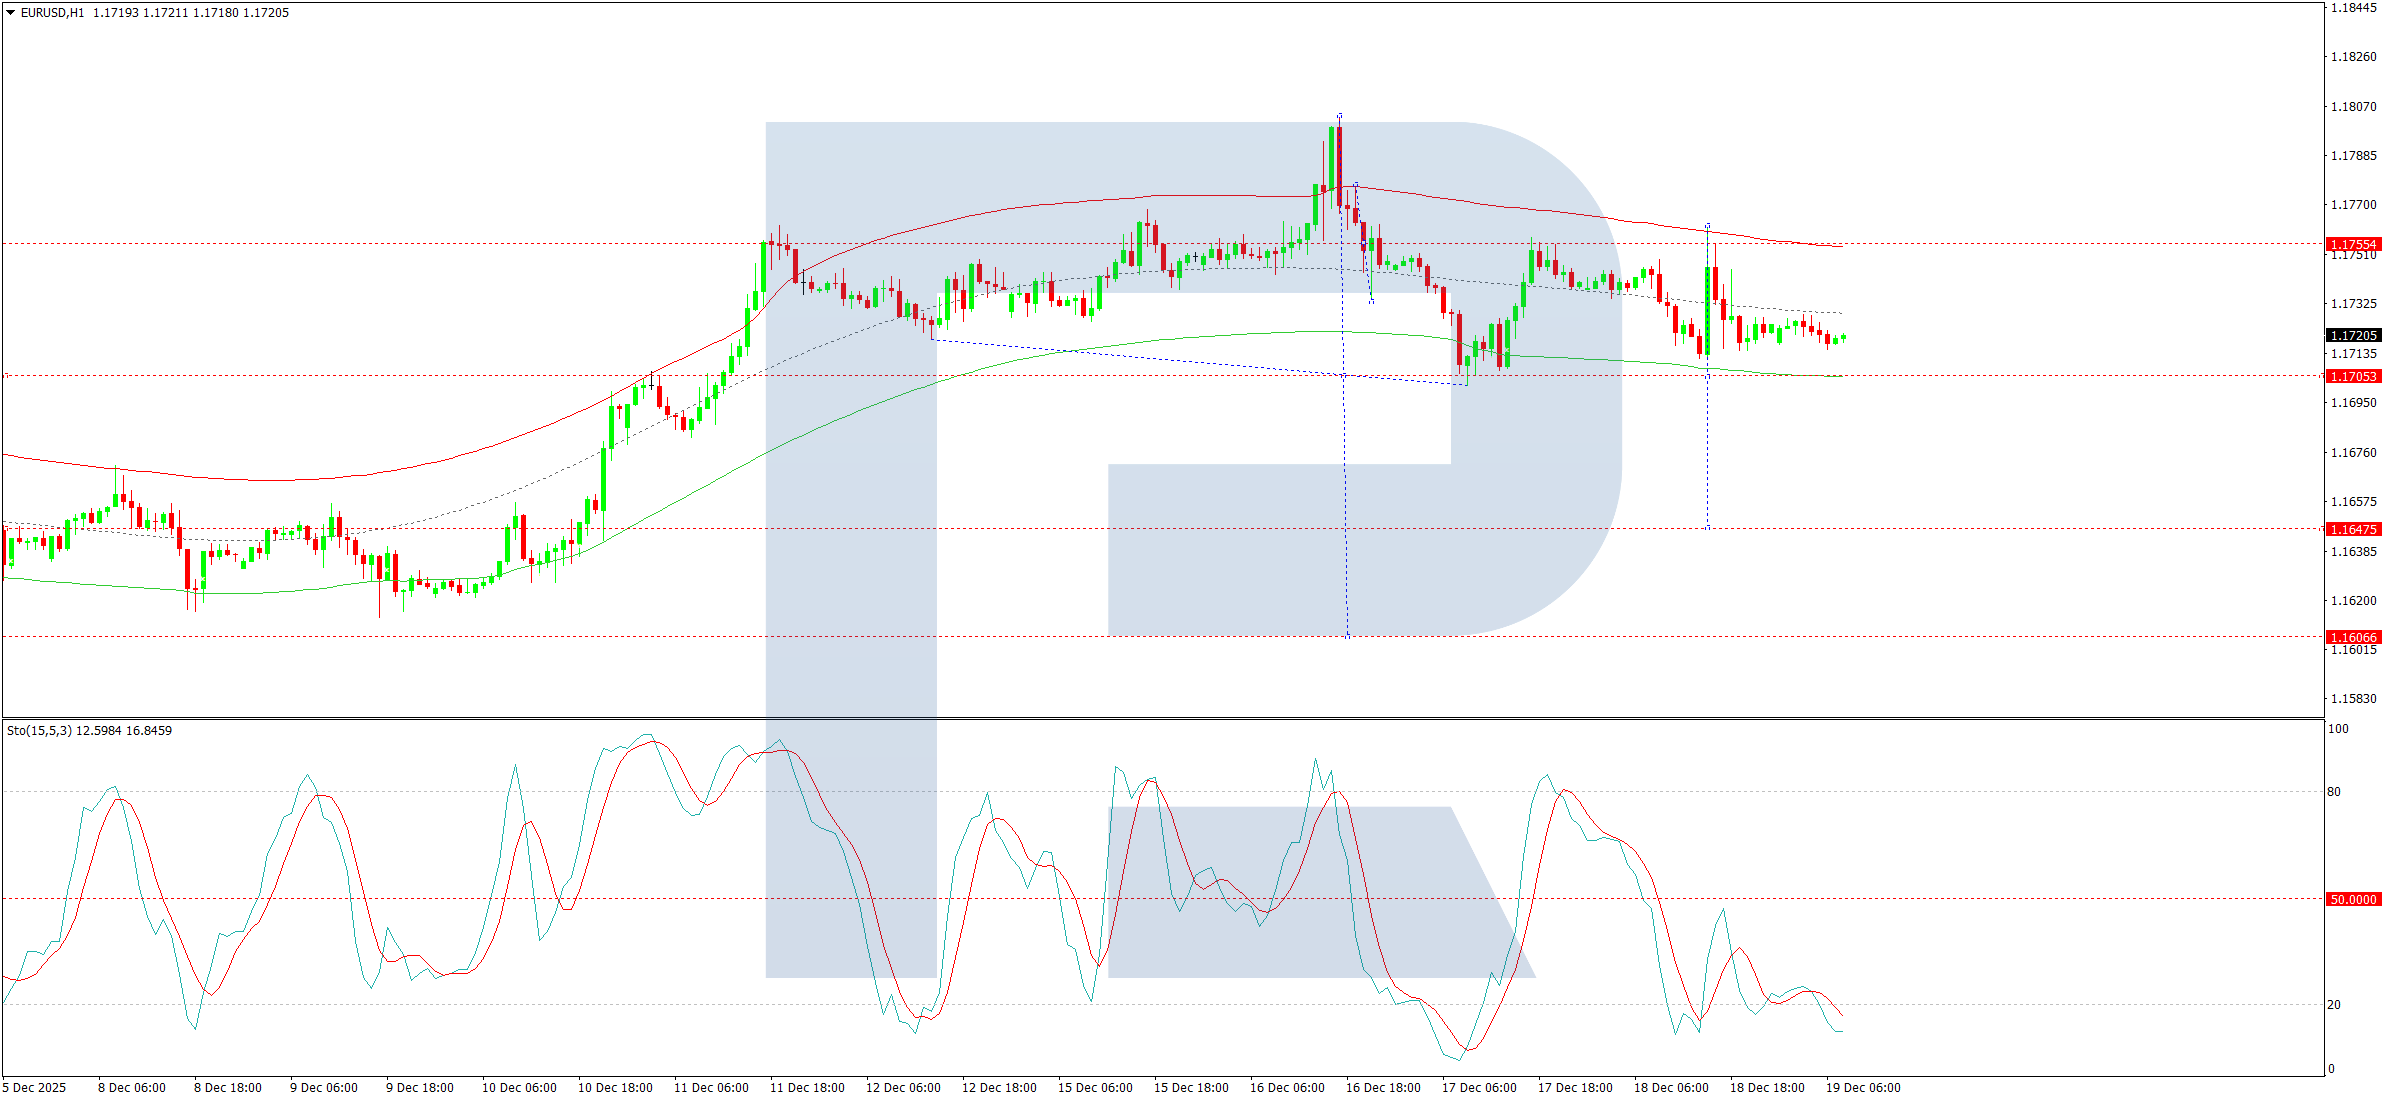
On the H1 chart, the market is forming a consolidation range centred around 157.77, with interim boundaries at 158.18 to the upside and 157.50 to the downside. A downward exit from this range could see a decline towards 156.60, while an upward resolution would signal potential for a further move towards 159.33. The Stochastic oscillator aligns with this view, as its signal line is above 50 and rising towards 80, suggesting continued near-term upward momentum.

Conclusion

USD/JPY has entered a period of consolidation near annual highs, with direction likely to be determined by upcoming Japanese data and political developments. While the broader technical bias remains bullish, a break below 157.50 could signal the start of a short-term correction.


Disclaimer:

Any forecasts contained herein are based on the author’s particular opinion. This analysis may not be treated as trading advice. RoboForex bears no responsibility for trading results based on trading recommendations and reviews contained herein.

Week Ahead: dollar faces first key test

By ForexTime 

  • USDInd ends 2025 ↓ 9.4% lower, biggest drop since 2017 
  • December NFP report may shape Fed cut bets for Q1 2026 
  • Ongoing Ukraine peace talks = heightened volatility? 
  • Over past year NFP triggered moves of ↑ 0.6% & ↓ 0.4% 
  • Technical levels: 100.00, 99.00 & 98.00 

The first full trading week of 2026 is packed with high-risk events!

Another round of Ukraine peace talks, a speech by Nvidia’s CEO and December’s US jobs report could spark fresh levels of volatility:


Sunday, 4th January

  • OIL: OPEC+ meeting on production levels


Monday, 5th January

  • CNY: China RatingDog services PMI
  • JPY: Japan S&P Global manufacturing PMI
  • USDInd: US ISM manufacturing, vehicle sales
  • Nvidia CEO Jensen Huang speech on innovation & productivity


Tuesday, 6th January

  • EUR: Eurozone HCOB services PMI
  • FRA40: France CPI, HCOB services PMI
  • GER40: Germany CPI, HCOB services PMI
  • USDInd: Richmond Fed President Tom Barkin


Wednesday, 7th January

  • AUD: Australia building approvals, CPI
  • EUR: Eurozone CPI
  • GER40: Germany unemployment
  • USDInd: ISM services index, ADP employment change, JOLTS job openings, Fed Michelle Bowman speech


Thursday, 8th January

  • AUD: Australia trade
  • EUR: ECB publishes 1-year and 3-year CPI expectations
  • EU50: Eurozone PPI, consumer confidence, economic confidence, unemployment
  • GER40: Germany factory orders
  • USDInd: US wholesale inventories, initial jobless claims, trade


Friday, 9th January

  • CAD: Canada unemployment
  • CNY: China PPI, CPI
  • SP35: Spain industrial production
  • EUR: Eurozone retail sales
  • USDInd: US unemployment, nonfarm payrolls, University of Michigan consumer sentiment, housing starts

The spotlight shines on FXTM’s USDInd which ended last year 9.4% lower, its biggest drop in eight years.

A screenshot of a video game  AI-generated content may be incorrect.

Note: The USD Index tracks how the dollar is performing against a basket of six different G10 currencies, including the Euro, British Pound, Japanese Yen, and Canadian dollar.

2025 was rough and rocky for the dollar thanks to worries about the US fiscal deficit, while Trump’s global trade war and lower US interest rates fuelled the downside.

With the USD entering 2026 on a shaky note, could more pain be on the horizon?

Here are three factors to watch out for:


1) December NFP – Friday 9th January

Markets expect the US economy to have created only 55,000 jobs in December while the unemployment rate is expected to drop to 4.5% from 4.6% in the previous month. The low numbers may be a result of the government shutdown as the negative knock-on effects hit labour markets.

  • A stronger-than-expected US jobs report could cool rate cut bets, boosting the USDInd higher as a result.
  • However, further evidence of a cooling US jobs market could reinforce expectations around lower US rates – pulling the USDInd lower.

USDInd is forecast to move 0.6% up or 0.4% down in a 6-hour window after the US NFP report.

Note: Before the key US NFP report, the dollar is likely to be rocked by Fed speeches and other key data including ISM Manufacturing, ADP employment and initial jobless claims.


Traders are currently pricing in a 47% chance that the Fed cuts interest rates by March 2026.

A screen shot of a price list  AI-generated content may be incorrect.


2) Ongoing Ukraine peace talks

According to Ukrainian President Volodymyr Zelensky, the peace agreement to end the war with Russia is “90% ready”.

However, recent drone strikes in Russia have rekindled tensions between the two nations despite diplomats expressing optimism over peace talks.

  • Should tensions intensify, this may weaken the Euro and spark fresh risk aversion – boosting the USDInd as a result.
  • Any signs of cooling tensions could boost the Euro and support overall risk sentiment – weighing on the USDInd.

Note: The Euro accounts for almost 60% of the USDInd weight. A weaker euro tends to push the index higher and vice versa.


3) Technical forces

FXTM’s USDInd remains under pressure on the daily charts.

  • A solid breakout and daily close above the 200-day SMA at 99.00 could trigger an incline toward 100-day SMA.
  • Should prices break below 98.00, bears could be encouraged to hit 97.20 and 96.50.


Forex-Time-LogoArticle by ForexTime


ForexTime Ltd (FXTM) is an award winning international online forex broker regulated by CySEC 185/12 www.forextime.com

USDJPY Bank of Japan Hike Boosts Yen

By RoboForex Analytical Department

The Bank of Japan’s decision to raise its policy rate to 0.75% (from 0.50%), while in line with market forecasts, marks a clear step towards monetary tightening and has pushed yields higher on Japanese assets. For the USD/JPY pair, this typically exerts downward pressure – supporting the yen’s appreciation and weighing on the exchange rate.

The underlying mechanism is straightforward: a higher interest rate in Japan boosts the relative appeal of yen-denominated investments and narrows the yield differential with the US. This, in turn, reduces the incentive for the classic carry trade – borrowing in low-yielding yen to purchase higher-yielding assets abroad – thereby increasing structural demand for the yen.

As the decision was widely anticipated, the immediate market reaction may be relatively contained. However, beyond the rate itself, the tone of the BoJ’s forward guidance will be critical. Should the central bank signal that further hikes are on the table, sustained pressure on USD/JPY is likely. Conversely, an emphasis on caution and the gradual pace of policy normalisation could limit the move to a more short-term correction.

Technical Analysis: USD/JPY

H4 Chart:

On the H4 chart, the market reached a local bullish target at 157.72 before correcting to 155.55. We expect this corrective phase to conclude around the 155.50 level, with the potential for a consolidation range to form thereafter. A break below this range would open the path towards 155.12, while an upward exit could see a renewed advance towards 157.92.

This outlook is supported by the MACD indicator, whose signal line is currently above zero but pointing firmly lower, suggesting a loss of bullish momentum in the near term.

H1 Chart:

On the H1 chart, the pair is trading within a consolidation range around 156.06. A downside break would target a decline towards 155.12, whereas an upside resolution could initiate a move towards 157.92.

This view is further validated by the Stochastic oscillator, whose signal line is below 50 and trending downward towards the 20 level, indicating continued near-term selling pressure.

Conclusion

The BoJ’s rate hike has shifted the fundamental backdrop towards yen strength, though the extent of the move will hinge on the central bank’s future signalling. Technically, USD/JPY is entering a critical consolidation phase, with a break below 155.50 likely to accelerate the correction, while a hold above could see the pair attempt to retest recent highs.


Disclaimer:

Any forecasts contained herein are based on the author’s particular opinion. This analysis may not be treated as trading advice. RoboForex bears no responsibility for trading results based on trading recommendations and reviews contained herein.

GBP/USD: UK GDP Growth Matches Forecasts

By RoboForex Analytical Department

The latest UK GDP data showed annualised growth of 1.3%, in line with market expectations and slightly below the previous reading of 1.4%. The report had a broadly neutral impact on sterling, as it confirms the UK economy continues to expand, albeit at a moderate pace, without signs of acceleration.

For the GBP/USD pair, the lack of surprise is the key takeaway. With the data matching consensus forecasts, investors have little reason to reassess their current macroeconomic outlook. In such cases, the pound tends not to attract fresh buying momentum but also avoids sharp selling pressure.

Nevertheless, the slight deceleration in growth from the prior period creates a modestly cautious backdrop for sterling. The softer figure may signal that the economy remains sensitive to elevated interest rates and subdued domestic demand. This interpretation could temper expectations of further monetary tightening from the Bank of England and limit the scope for more hawkish communication.

In the near term, the direct market impact of this GDP release is assessed as largely neutral, albeit with a mild downside bias for the pound. Subsequent direction will likely depend on upcoming UK inflation and labour market reports, alongside evolving US rate expectations and broader global risk sentiment.

Technical Analysis: GBP/USD

H4 Chart:

On the H4 chart, the pair has entered a broad consolidation zone around 1.3418. We anticipate a possible extension of the range towards 1.3500 in the near term, followed by a corrective pullback to 1.3418. Upon completion of this retracement, the broader upward trend is expected to resume, targeting 1.3520, with potential for further extension towards 1.3550.

This outlook is supported by the MACD indicator, with its signal line positioned above zero and pointing firmly upward.

H1 Chart:

On the H1 chart, price action formed a tight consolidation around 1.3424 before breaking higher and advancing to 1.3492 (a local target). We now expect a corrective decline to retest the 1.3424 level from above. Once this correction concludes, the focus will shift to the potential for a subsequent growth wave toward 1.3533.

This scenario is validated by the Stochastic oscillator, whose signal line is above 80 and has begun to turn lower towards the 20 level, indicating near-term corrective momentum.

Conclusion

The GBP/USD pair is likely to remain range-bound in the wake of in-line GDP data, which neither strengthens nor weakens the sterling narrative decisively. While the technical structure favours further upside in the medium term, near-term price action suggests a period of consolidation or mild correction may precede any renewed bullish impulse.


Disclaimer:

Any forecasts contained herein are based on the author’s particular opinion. This analysis may not be treated as trading advice. RoboForex bears no responsibility for trading results based on trading recommendations and reviews contained herein.

EUR/USD: ECB Policy Stance Fails to Surprise Markets

By RoboForex Analytical Department

At its meeting on 18 December, the European Central Bank (ECB) left all key interest rates unchanged, maintaining the deposit facility rate at 2.0%. The decision was widely anticipated, offering no fresh catalyst for meaningful euro movement. While headline inflation for the eurozone remained close to target at 2.15% in November, the ECB’s updated projections saw a slight upward revision for the coming years, primarily driven by persistent price growth in the services sector.

Concurrently, the ECB improved its GDP growth forecast for 2025–2027. However, with the decision fully priced in, it provided neither additional support nor pressure to the single currency.

The primary driver for EUR/USD now stems from US monetary policy. The recent Federal Reserve rate cut from 4.00% to 3.75% has narrowed the yield differential between the dollar and the euro. This reduces the dollar’s interest rate advantage and makes euro-denominated assets relatively more attractive, providing a moderate tailwind for the euro.

Looking ahead, medium-term dynamics will hinge on relative expectations for central bank policy. Should markets continue to price in a more aggressive easing cycle from the Fed compared to the ECB, the euro is likely to find further support. Conversely, any signs that the ECB is preparing to proactively ease policy in response to eurozone economic weakness would limit the euro’s upside potential.

Technical Analysis: EUR/USD

H4 Chart:

On the H4 chart, the pair is consolidating near the breakdown level of the previous growth channel’s lower boundary. We anticipate a downside breakout from this range and a resumption of the third decline wave, with an initial target at 1.1650.

The MACD indicator technically confirms this bearish outlook. Its signal line is below zero and pointing decisively downward, reflecting sustained bearish momentum and potential for further downside.

H1 Chart:

On the H1 chart, the market completed another decline wave to 1.1702, followed by a correction to 1.1737. A new downward impulse towards 1.1650 is currently forming. A sustained break below this level would signal the potential for an extended third wave, targeting the 1.1645 area as a local objective.

This scenario is supported by the Stochastic oscillator, with its signal line below the 50 level and trending firmly downwards.

Conclusion

The euro’s trajectory remains more sensitive to shifting US policy expectations than to the ECB’s predictable stance. While the narrowed interest rate differential offers near-term support, the technical structure appears bearish. A decisive break below the current consolidation range could trigger a renewed move towards the 1.1650–1.1645 support zone.


Disclaimer:

Any forecasts contained herein are based on the author’s particular opinion. This analysis may not be treated as trading advice. RoboForex bears no responsibility for trading results based on trading recommendations and reviews contained herein.

Euro Holds Near 1.1700 Following ECB Policy Stance

By RoboForex Analytical Department

The EUR/USD pair declined to around 1.1700 after the European Central Bank (ECB) left key interest rates unchanged, a widely anticipated decision that provided little fresh directional impetus for the single currency.

As expected, the main refinancing rate was held at 2.15%, with the deposit facility rate unchanged at 2.0%. ECB officials reiterated their commitment to a meeting-by-meeting, data-dependent approach.

During the subsequent press conference, President Christine Lagarde stated that policymakers did not discuss either a rate hike or a cut at this juncture. She emphasised that the ECB does not have a pre-set path for interest rates and, given the prevailing high uncertainty, cannot provide forward guidance on future policy moves.

In parallel, the central bank released its latest quarterly economic projections. Growth forecasts were revised upwards to 1.4% for 2025, 1.2% for 2026, and 1.4% for 2027. The inflation outlook for 2026 was also adjusted higher, primarily driven by persistent price pressures in the services sector.

Technical Analysis: EUR/USD

H4 Chart:

On the H4 chart, the pair completed a corrective rebound to 1.1760 and is now forming a downward impulse targeting 1.1706. A break below this level is anticipated, which would set the next local bearish target at 1.1640.

This scenario is technically confirmed by the MACD indicator. Its signal line is positioned above zero but is pointing sharply downwards, reflecting sustained bearish momentum and the potential for a further extension of the downtrend.

H1 Chart:

On the H1 chart, the market has finished a first decline to 1.1705, followed by a correction to 1.1755. A second downward impulse towards 1.1705 is currently developing. A clear break below this support would signal the potential for a third wave of decline, targeting the 1.1645 level as a local objective.

This outlook is supported by the Stochastic oscillator, whose signal line is below the 50 level and trending firmly downwards.

Conclusion

The euro remains range-bound following a largely uneventful ECB meeting, with the central bank’s cautious, data-dependent stance offering little support. The technical structure points to further downside risk, with a break below immediate support at 1.1705 likely to trigger a move towards the 1.1640 area.


Disclaimer:

Any forecasts contained herein are based on the author’s particular opinion. This analysis may not be treated as trading advice. RoboForex bears no responsibility for trading results based on trading recommendations and reviews contained herein.

Pound Holds Its Breath Ahead of Bank of England Decision

By RoboForex Analytical Department

The British pound declined to around $1.3300 against the US dollar on Wednesday, as UK inflation undershot expectations and reinforced market convictions that the Bank of England (BoE) will cut interest rates on Thursday.

The annual Consumer Prices Index (CPI) inflation rate slowed to 3.2% in November, missing forecasts of 3.5% and falling below the central bank’s projection of 3.4%. This followed labour market data earlier in the week, which revealed unemployment rose to its highest level since 2021, while wage growth eased – albeit less sharply than anticipated.

The economic backdrop has weakened further following last week’s Gross Domestic Product (GDP) data, which confirmed the UK economy contracted for a second consecutive month in October. Given this deteriorating picture, the BoE is now widely expected to resume its monetary easing cycle, cutting the Bank Rate by 25 basis points to 3.75% – its lowest level since 2022. The central bank has held rates steady at its last two meetings in September and November.

Money markets have adjusted their expectations in response, now pricing in approximately 66 basis points of total easing by the end of 2026, up from around 58 basis points before the latest inflation report.

Technical Analysis: GBP/USD

H4 Chart:

On the H4 chart, the pair is developing a downward wave structure with a target at 1.3300. We expect this level to be tested today. Subsequently, a corrective rebound towards 1.3370 is likely. Once this correction is complete, the primary downtrend is anticipated to resume, targeting 1.3240, with potential for an extension towards 1.3175.

This bearish scenario is technically confirmed by the MACD indicator. Its signal line has exited the histogram zone and is near the zero mark, suggesting it will decline to new lows.

H1 Chart:

On the H1 chart, the market is forming a downward impulse targeting 1.3290 as its initial objective. Following this, a correction towards 1.3370 is likely. Upon completion of this corrective phase, the focus will shift to the potential continuation of the downtrend.

This outlook is supported by the Stochastic oscillator. Its signal line is below the 50 level and is pointing firmly downwards towards 20.

Conclusion

The pound remains under clear pressure ahead of Thursday’s pivotal BoE meeting, with soft inflation and growth data significantly raising the odds of a rate cut. The technical posture is bearish across timeframes, suggesting any near-term corrective bounce is likely to be sold into, paving the way for a test of lower support levels.


Disclaimer:

Any forecasts contained herein are based on the author’s particular opinion. This analysis may not be treated as trading advice. RoboForex bears no responsibility for trading results based on trading recommendations and reviews contained herein.

Yen Gains Strength Ahead of Crucial Bank of Japan Meeting

By RoboForex Analytical Department

The Japanese yen strengthened on Monday, approaching 155 per dollar to reach its highest level in over a week. This appreciation reflects heightened investor anticipation ahead of the Bank of Japan’s (BoJ) pivotal monetary policy meeting on Friday.

Markets widely expect the central bank to raise its benchmark interest rate by 25 basis points, bringing it to 0.75%. However, the primary focus will be on the forward guidance provided by Governor Kazuo Ueda in his post-meeting commentary. His remarks will be scrutinized for signals regarding the pace and extent of monetary tightening expected throughout 2025.

Analysts now project the BoJ’s policy rate could reach 1.0% by July 2026. This hawkish outlook is underpinned by resilient domestic economic data, particularly consumer inflation, which remains stubbornly above the BoJ’s historical targets.

Notably, political resistance to tightening appears to be fading. Prime Minister Sanae Takaichi’s administration is unlikely to oppose a rate hike, as the prolonged weakness of the yen – partly a consequence of delayed policy normalization – has exacerbated import costs and contributed to inflationary pressures.

Technical Analysis: USD/JPY

H4 Chart:

On the H4 chart, USD/JPY has completed the first leg of a decline to 154.34, followed by a corrective rebound to 156.93. We now anticipate the development of a new wave of decline targeting 154.73. Following this, the pair is likely to form a consolidation range around this level. A subsequent downward breakout from this range would signal a continuation of the broader downtrend, opening the path towards 152.58. This bearish view is supported by the MACD indicator, whose signal line is positioned below zero and pointing decisively downward.

H1 Chart:

On the H1 chart, the pair is forming a declining wave with an immediate target at 154.82. Upon reaching this level, a corrective upward move towards 155.45 is anticipated. A further extension of this correction to 155.91 cannot be ruled out. However, following this relief rally, we expect the primary downtrend to resume, driving the pair lower towards 153.52. The Stochastic Oscillator aligns with this near-term corrective view, as its signal line has turned up from the 20 level and is rising towards 50, indicating that a temporary bounce is likely before selling pressure reasserts itself.

Conclusion

The yen is firming as markets position for a landmark BoJ rate hike and a shift away from its long-held ultra-loose policy stance. Technically, USD/JPY is exhibiting a clear bearish structure across multiple timeframes. While a short-term corrective bounce is possible, the overall trajectory points towards further weakness, with key downside targets at 154.73 on H4 and 153.52 on H1. Governor Ueda’s guidance on Friday will be the ultimate determinant of whether this technical correction evolves into a sustained trend reversal.


Disclaimer:

Any forecasts contained herein are based on the author’s particular opinion. This analysis may not be treated as trading advice. RoboForex bears no responsibility for trading results based on trading recommendations and reviews contained herein.

EUR/USD Surges on Dovish Fed Signals and Shifting Expectations

By RoboForex Analytical Department

The EUR/USD pair rallied sharply to 1.1735 on Friday, propelled by a sustained sell-off in the US dollar. The move followed a widely anticipated Federal Reserve rate cut, which was accompanied by guidance that proved more accommodative than markets had expected.

Chair Jerome Powell explicitly ruled out further rate hikes, and the Fed’s updated “dot plot” projections now indicate only one additional cut for 2026 – a more measured path of easing than previously anticipated.

Adding to dollar weakness, the Fed announced it would begin purchasing short-term Treasury bills to bolster banking system liquidity – a measure that pushed Treasury yields lower. This was compounded by economic data showing initial jobless claims rose last week at their fastest pace in nearly four and a half years, reinforcing the case for a more supportive policy stance.

The broader external environment is turning increasingly unfavourable for the greenback. While the Fed signals a slower pace of easing, markets are concurrently pricing in a relatively tighter policy trajectory for central banks in Australia, Canada, and the Eurozone. This divergence has driven the dollar lower against most major currencies this week, with its most pronounced decline coming against the euro.

Technical Analysis: EUR/USD

H4 Chart:

On the H4 chart, EUR/USD exhibits a robust bullish trend, trading near a key resistance zone at 1.1760–1.1780. The pair is holding firmly above the middle Bollinger Band, confirming buyer dominance. The upward slope and gradual widening of the upper band signal rising volatility and sustained momentum following a breakout to new highs.

Provided the price remains above the 1.1709 support, the market retains strong potential to challenge the 1.1780 ceiling. A decisive breakout and close above this zone would open a clear path towards 1.1850. Should a pullback materialise, the nearest significant support lies at 1.1650, the previous breakout point. A break below 1.1547 would be required to signal a deeper correction towards the lower Bollinger Band.

H1 Chart:

On the H1 chart, the pair is consolidating after a powerful impulse wave that targeted the 1.1760–1.1780 resistance area. The current correction is finding initial support at 1.1709, a level from which the latest acceleration originated.

The Stochastic oscillator is declining from overbought territory, increasing the probability of a near-term pause or shallow pullback. Nevertheless, the underlying structure remains bullish, with the price trading above the middle Bollinger Band, which now serves as dynamic support.

A confirmed breakout above 1.1780 would signal a continuation of the uptrend, with subsequent targets at 1.1820 and 1.1850. Conversely, a sustained move below 1.1709 would provide the first technical indication of fading bullish momentum, potentially triggering a correction towards the next demand zone in the 1.1650–1.1620 range.

Conclusion

EUR/USD has broken out decisively on the back of a dovish Fed pivot and a shifting global rate differential. The technical picture is firmly bullish, with the pair now testing a major resistance cluster near 1.1780. A successful breakout above this level would likely accelerate gains towards 1.1850. In the near term, the 1.1709 support is critical; holding above it keeps the immediate upward bias intact, while a break below would suggest a period of consolidation is needed before the next directional move.


Disclaimer:

Any forecasts contained herein are based on the author’s particular opinion. This analysis may not be treated as trading advice. RoboForex bears no responsibility for trading results based on trading recommendations and reviews contained herein.

GBP/USD Approaches Local High, Bolstered by BoE Stance

By RoboForex Analytical Department

The GBP/USD pair advanced to 1.3367 on Thursday, stabilising near its highest level since 22 October. Sterling is drawing support from a confluence of factors: a broadly weaker US dollar and a market reassessment that has scaled back expectations for additional Bank of England (BoE) monetary easing in 2026.

This follows yesterday’s Federal Reserve meeting, where the US central bank delivered a widely anticipated 25-basis-point rate cut. Crucially, the Fed signalled a potential pause in its easing cycle as early as January, emphasising the need for more economic data before determining the next steps.

Expectations for the BoE’s meeting next week remain firmly anchored. The market continues to price in an 84% probability of a 25-basis-point cut, largely overlooking recent data showing accelerating wage growth and persistent inflationary pressures. Furthermore, investors are almost fully pricing in a second rate cut by June, with a 75% chance assigned to an initial move as soon as April.

Market focus now shifts to the UK’s monthly GDP report, due on Friday, which could prompt a final adjustment to monetary policy expectations ahead of the BoE decision.

Technical Analysis: GBP/USD

H4 Chart:

On the H4 chart, GBP/USD exhibits a strong upward bias, trading just below the key technical resistance at 1.3392. The pair’s position firmly above the middle Bollinger Band confirms the dominance of buyers. The expansion of the upper band signals rising volatility and suggests the market is building momentum for another attempt to breach this barrier.

A decisive breakout and close above 1.3392 would be a significant bullish development, opening the path towards the next resistance zone of 1.3420–1.3452. Should a reversal occur, the nearest notable support is at 1.3280. A breach of this level would indicate a deeper corrective phase, likely targeting the lower Bollinger Band.

H1 Chart:

On the H1 chart, the pair is undergoing a near-term correction following its impulsive rise to the 1.3390–1.3392 resistance zone. It is currently finding support above 1.3360, a level from which a prior recovery originated.

The upper Bollinger Band has flattened after a period of sharp expansion, indicating short-term overbought conditions and increasing the likelihood of a consolidation or shallow pullback. Despite this, the overall H1 structure remains bullish, with the price above the middle band and the lower band providing dynamic support.

A sustained break above 1.3392 would signal a resumption of the uptrend, targeting 1.3420 and potentially 1.3450. Conversely, a loss of the 1.3360 support would be the first technical sign of weakening bullish momentum, potentially triggering a correction towards the next demand zone in the 1.3300–1.3280 range.

Conclusion

GBP/USD is trading with conviction, supported by shifting central-bank dynamics that have turned modestly in sterling’s favour. The technical setup is bullish but faces a critical test at the 1.3392 resistance level. A successful breakout would validate the strength of the current move, while a rejection could see the pair retreat to consolidate recent gains. The upcoming UK GDP data will provide the final fundamental cue before the highly anticipated BoE meeting next week.


Disclaimer:

Any forecasts contained herein are based on the author’s particular opinion. This analysis may not be treated as trading advice. RoboForex bears no responsibility for trading results based on trading recommendations and reviews contained herein.