By InvestMacro | COT | Data Tables | COT Leaders | Downloads | COT Newsletter
The latest update for the weekly Commitment of Traders (COT) report was released by the Commodity Futures Trading Commission (CFTC) on Monday (holiday delay release) for data ending on November 9th 2021.
The weekly Extreme Positions report highlights the Top 5 Most Bullish and Top 5 Most Bearish Positions for the speculator category. Extreme positioning in these markets can foreshadow strong moves in the underlying market.
To signify an extreme position, we use the Strength Index (also known as the COT Index) of each instrument, a common method of measuring COT data. The Strength Index is simply a comparison of current trader positions against the range of positions over the previous 3 years. We use over 80 percent as extremely bullish and under 20 percent as extremely bearish. (Compare Strength Index scores across all markets in the data table or cot leaders table)
Speculators or Non-Commercials Notes:
Speculators, classified as non-commercial traders by the CFTC, are made up of large commodity funds, hedge funds and other significant for-profit participants. The Specs are generally regarded as trend-followers in their behavior towards price action – net speculator bets and prices tend to go in the same directions. These traders often look to buy when prices are rising and sell when prices are falling. To illustrate this point, many times speculator contracts can be found at their most extremes (bullish or bearish) when prices are also close to their highest or lowest levels.
These extreme levels can be dangerous for the large speculators as the trade is most crowded, there is less trading ammunition still sitting on the sidelines to push the trend further and prices have moved a significant distance. When the trend becomes exhausted, some speculators take profits while others look to also exit positions when prices fail to continue in the same direction. This process usually plays out over many months to years and can ultimately create a reverse effect where prices start to fall and speculators start a process of selling when prices are falling.
Here Are This Week’s Most Bullish Speculator Positions:
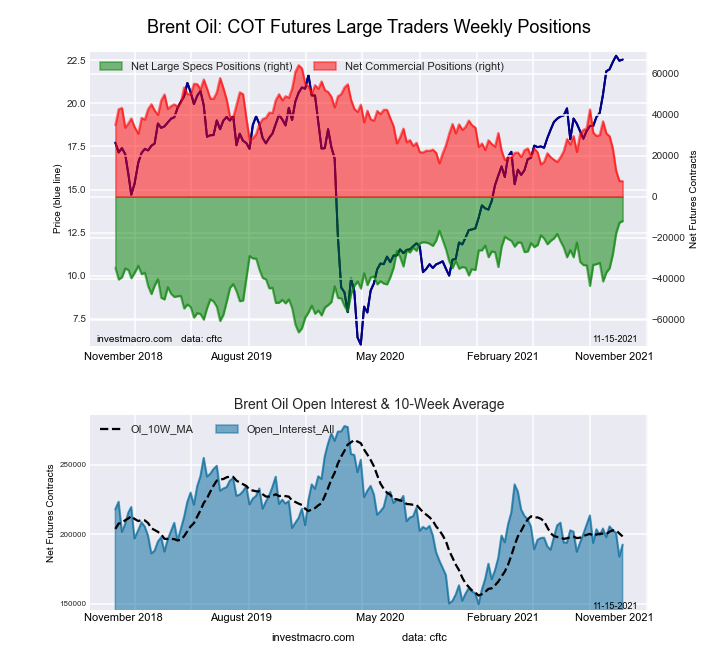
Brent Oil
The Brent Oil speculator trader’s futures position comes in as the most bullish extreme standing this week. The Brent speculator level is currently at a 100 percent score of its 3-year range.
The speculator position totaled -11,851 net contracts this week which was a change by 863 contracts from last week. The speculator long position was a total of 47,922 contracts compared to the total spec short position of 59,773 contracts.
Coffee Futures
The Coffee Futures speculator trader’s futures position comes next in the extreme standings this week. The Coffee speculator level is now at a 93 percent score of its 3-year range.
The speculator position was 60,820 net contracts this week, a change by -3,533 contracts from last week. The speculator long position was a total of 78,364 contracts versus the total speculator short position of 17,544 contracts.
New Zealand Dollar
The New Zealand Dollar speculator trader’s futures position comes in third this week in the extreme standings. The NZD speculator level resides at a 93 percent score of its 3-year range.
The speculator position was 12,882 net contracts this week which marked a change by -979 contracts from last week. The speculator long position was a total of 25,312 contracts versus the total speculator short position of 12,430 contracts.
2-Year Bond
The 2-Year Bond speculator trader’s futures position comes up number four in the extreme standings this week. The 2-Year speculator level is at a 89 percent score of its 3-year range.
The speculator position was -16,737 net contracts this week and changed by 46,371 contracts from last week. The speculator long position was a total of 345,187 contracts against the total spec short position of 361,924 contracts.
US Dollar Index
The US Dollar Index speculator trader’s futures position rounds out the top five in this week’s bullish extreme standings. The USD Index speculator level sits at a 87 percent score of its 3-year range.
The speculator position was 35,448 net contracts this week which was a move of 466 contracts from last week. The speculator long position was a total of 46,521 contracts in comparison to the total speculator short position of 11,073 contracts.
This Week’s Most Bearish Speculator Positions:

Mexican Peso
The Mexican Peso speculator trader’s futures position comes in as the most bearish extreme standing this week. The MXN speculator level is at a 1 percent score of its 3-year range.
The speculator position was -48,407 net contracts this week, a weekly change of 2,611 contracts from last week. The speculator long position was a total of 61,791 contracts versus the total spec short position of 110,198 contracts.
Palladium
The Palladium speculator trader’s futures position comes in next for the most bearish extreme standing on the week. The Palladium speculator level is at a 2 percent score of its 3-year range.
The speculator position was -2,954 net contracts this week which was a change by 437 contracts from last week. The speculator long position was a total of 2,701 contracts compared to the total speculator short position of 5,655 contracts.
Japanese Yen
The Japanese Yen speculator trader’s futures position comes in as third most bearish extreme standing of the week. The JPY speculator level resides at a 3 percent score of its 3-year range.
The speculator position was -105,351 net contracts this week saw movement by 2,273 contracts from last week. The speculator long position was a total of 16,440 contracts against the total spec short position of 121,791 contracts.
5-Year Bond
The 5-Year Bond speculator trader’s futures position comes in as this week’s fourth most bearish extreme standing. The 5-Year speculator level is at a 8 percent score of its 3-year range.
The speculator position was -407,485 net contracts this week which was a change by -31,132 contracts on the week. The speculator long position was a total of 258,018 contracts versus the total speculator short position of 665,503 contracts.
Nikkei 225 Yen
Finally, the Nikkei 225 Yen speculator trader’s futures position comes in as the fifth most bearish extreme standing for this week. The Nikkei 225 Yen speculator level is at a 21 percent score of its 3-year range.
The speculator position was -303 net contracts this week and changed by -2,188 contracts from last week. The speculator long position was a total of 9,198 contracts compared to the total spec short position of 9,501 contracts.
Article By InvestMacro – Receive our weekly COT Reports by Email
*COT Report: The COT data, released weekly to the public each Friday, is updated through the most recent Tuesday (data is 3 days old) and shows a quick view of how large speculators or non-commercials (for-profit traders) were positioned in the futures markets.
The CFTC categorizes trader positions according to commercial hedgers (traders who use futures contracts for hedging as part of the business), non-commercials (large traders who speculate to realize trading profits) and nonreportable traders (usually small traders/speculators) as well as their open interest (contracts open in the market at time of reporting).See CFTC criteria here.