By InvestMacro | COT | Data Tables | COT Leaders | Downloads | COT Newsletter
Here are the latest charts and statistics for the Commitment of Traders (COT) data published by the Commodities Futures Trading Commission (CFTC). This week’s reports are delayed due to last week’s Veteran’s Day holiday.
The latest COT data is updated through Tuesday November 9th 2021 and shows a quick view of how large traders (for-profit speculators and commercial entities) were positioned in the futures markets. All currency positions are in direct relation to the US dollar where, for example, a bet for the euro is a bet that the euro will rise versus the dollar while a bet against the euro will be a bet that the euro will decline versus the dollar.
Highlighting the COT Currency data this week is the US Dollar Index which continued to creep up a little higher in the past few weeks. The dollar index speculative positions edged up higher by 466 contracts this week following an increase by just 525 contracts the previous week on November 2nd. The speculator positioning had fallen for the first time in ten weeks on October 26th before these past two small bullish increases. The USD positions have been on such a roll that bullish bets have gained in nineteen out of the past twenty-one weeks (net total gains of +37,751 contracts) and reached an approximately two-year high-point on October 19th. Currently, the USD Index maintains a bullish-extreme strength index level.
| Nov-09-2021 | OI | OI-Index | Spec-Net | Spec-Index | Com-Net | COM-Index | Smalls-Net | Smalls-Index |
|---|
| USD Index | 57,713 | 84 | 35,448 | 87 | -41,095 | 6 | 5,647 | 78 |
| EUR | 678,368 | 75 | 3,773 | 36 | -32,041 | 67 | 28,268 | 21 |
| GBP | 186,898 | 30 | -12,093 | 65 | 17,548 | 40 | -5,455 | 44 |
| JPY | 243,087 | 84 | -105,351 | 3 | 123,199 | 97 | -17,848 | 11 |
| CHF | 51,546 | 30 | -17,043 | 40 | 20,534 | 54 | -3,491 | 53 |
| CAD | 154,720 | 33 | 5,104 | 59 | -26,608 | 35 | 21,504 | 79 |
| AUD | 157,269 | 50 | -63,424 | 25 | 66,185 | 68 | -2,761 | 46 |
| NZD | 43,461 | 31 | 12,882 | 93 | -15,139 | 7 | 2,257 | 78 |
| MXN | 164,152 | 31 | -48,407 | 1 | 45,684 | 99 | 2,723 | 55 |
| RUB | 58,349 | 67 | 20,703 | 62 | -22,797 | 33 | 2,094 | 91 |
| BRL | 33,808 | 36 | -15,458 | 48 | 15,945 | 55 | -487 | 61 |
| Bitcoin | 13,821 | 79 | -1,467 | 69 | 223 | 0 | 1,244 | 26 |
US Dollar Index Futures:
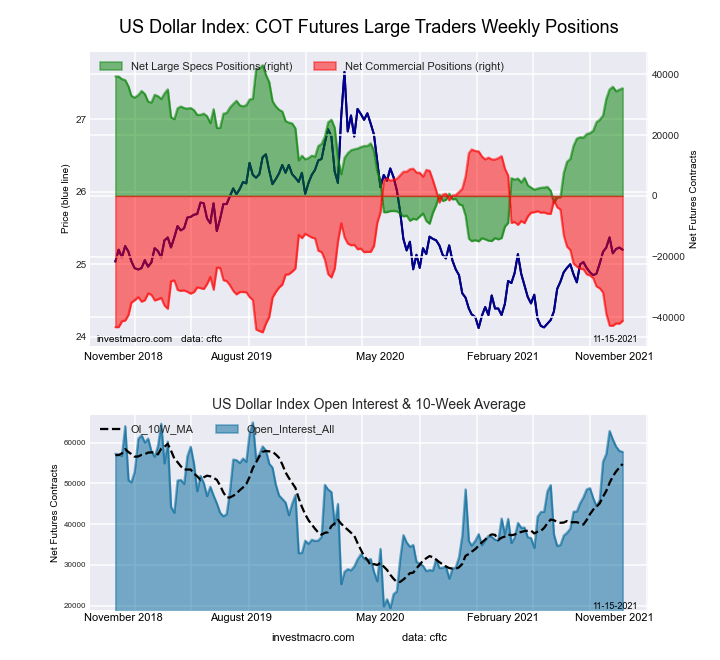 The US Dollar Index large speculator standing this week reached a net position of 35,448 contracts in the data reported through Tuesday. This was a weekly rise of 466 contracts from the previous week which had a total of 34,982 net contracts.
This week’s current strength score (the trader positioning range over the past three years, measured from 0 to 100) shows the speculators are currently Bullish-Extreme with a score of 86.9 percent. The commercials are Bearish-Extreme with a score of 6.3 percent and the small traders (not shown in chart) are Bullish with a score of 78.3 percent.
| US DOLLAR INDEX Statistics | SPECULATORS | COMMERCIALS | SMALL TRADERS |
| – Percent of Open Interest Longs: | 80.6 | 3.7 | 13.0 |
| – Percent of Open Interest Shorts: | 19.2 | 74.9 | 3.2 |
| – Net Position: | 35,448 | -41,095 | 5,647 |
| – Gross Longs: | 46,521 | 2,130 | 7,516 |
| – Gross Shorts: | 11,073 | 43,225 | 1,869 |
| – Long to Short Ratio: | 4.2 to 1 | 0.0 to 1 | 4.0 to 1 |
| NET POSITION TREND: | | | |
| – COT Index Score (3 Year Range Pct): | 86.9 | 6.3 | 78.3 |
| – COT Index Reading (3 Year Range): | Bullish-Extreme | Bearish-Extreme | Bullish |
| NET POSITION MOVEMENT INDEX: | | | |
| – 6-Week Change in Strength Index: | 15.5 | -15.5 | 3.7 |
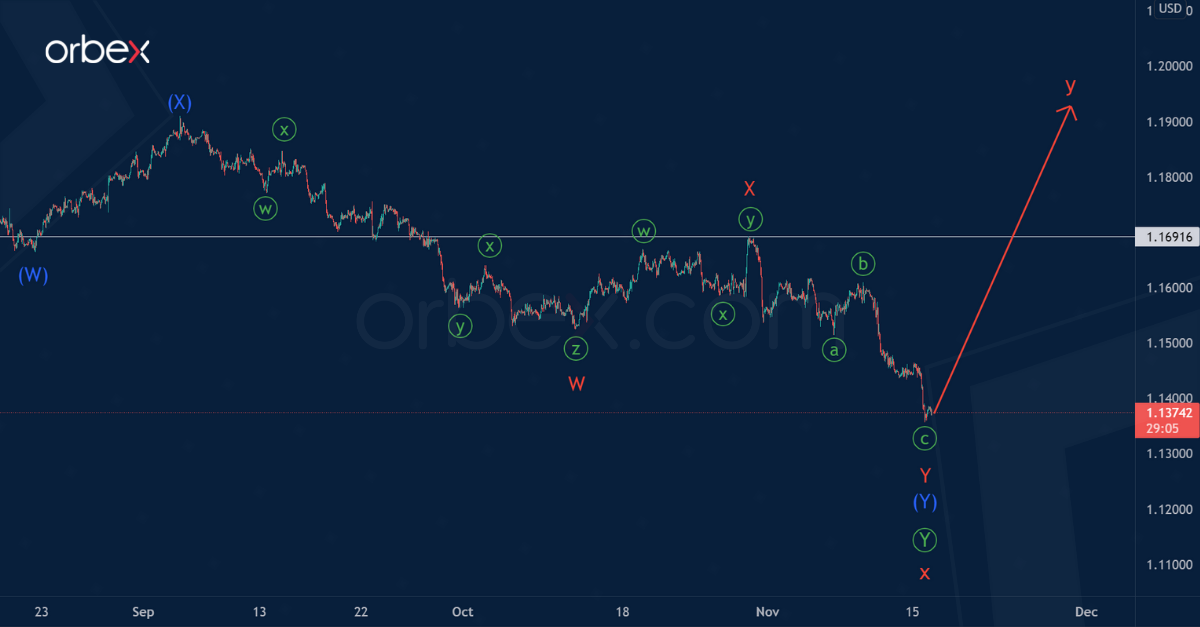
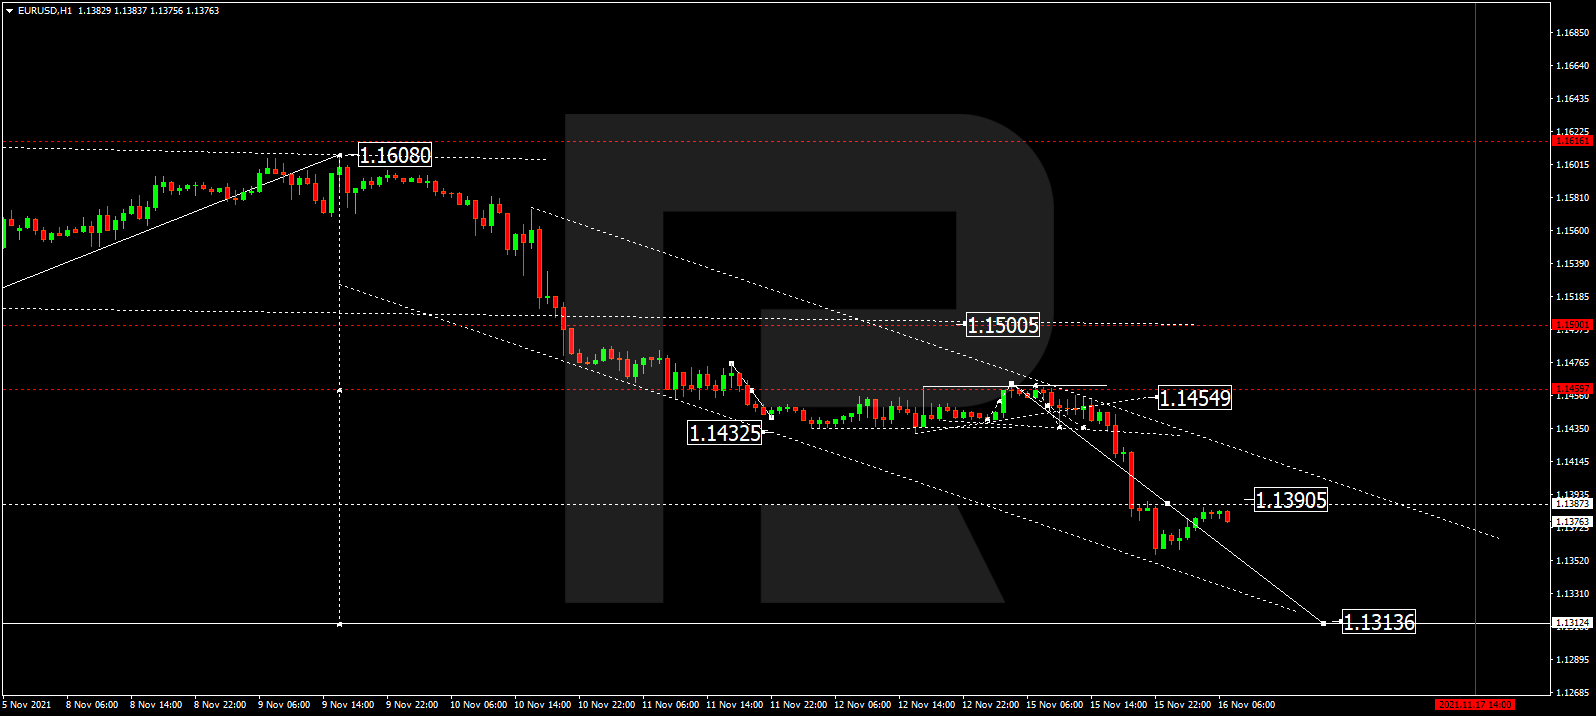
Euro Currency Futures:
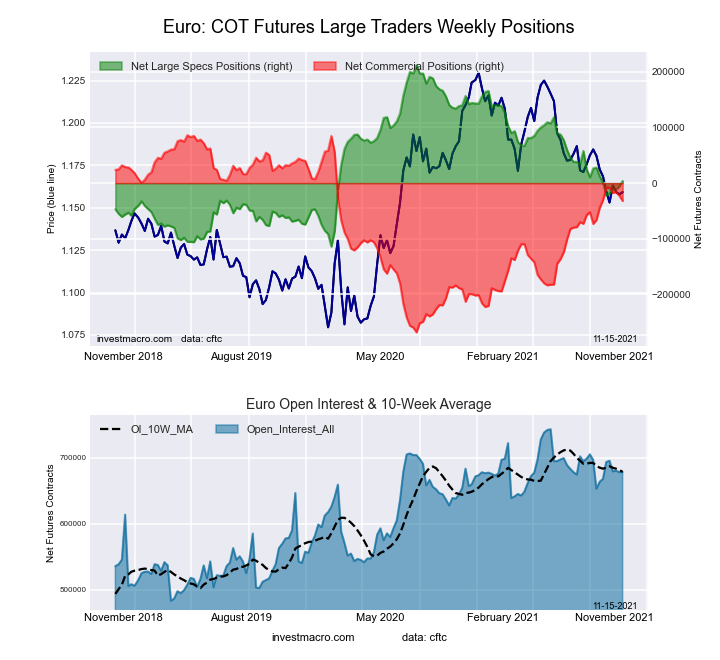 The Euro Currency large speculator standing this week reached a net position of 3,773 contracts in the data reported through Tuesday. This was a weekly rise of 9,911 contracts from the previous week which had a total of -6,138 net contracts.
This week’s current strength score (the trader positioning range over the past three years, measured from 0 to 100) shows the speculators are currently Bearish with a score of 36.2 percent. The commercials are Bullish with a score of 66.7 percent and the small traders (not shown in chart) are Bearish with a score of 21.2 percent.
| EURO Currency Statistics | SPECULATORS | COMMERCIALS | SMALL TRADERS |
| – Percent of Open Interest Longs: | 28.4 | 57.5 | 12.4 |
| – Percent of Open Interest Shorts: | 27.8 | 62.2 | 8.2 |
| – Net Position: | 3,773 | -32,041 | 28,268 |
| – Gross Longs: | 192,544 | 389,822 | 83,827 |
| – Gross Shorts: | 188,771 | 421,863 | 55,559 |
| – Long to Short Ratio: | 1.0 to 1 | 0.9 to 1 | 1.5 to 1 |
| NET POSITION TREND: | | | |
| – COT Index Score (3 Year Range Pct): | 36.2 | 66.7 | 21.2 |
| – COT Index Reading (3 Year Range): | Bearish | Bullish | Bearish |
| NET POSITION MOVEMENT INDEX: | | | |
| – 6-Week Change in Strength Index: | 0.9 | -0.5 | -2.1 |
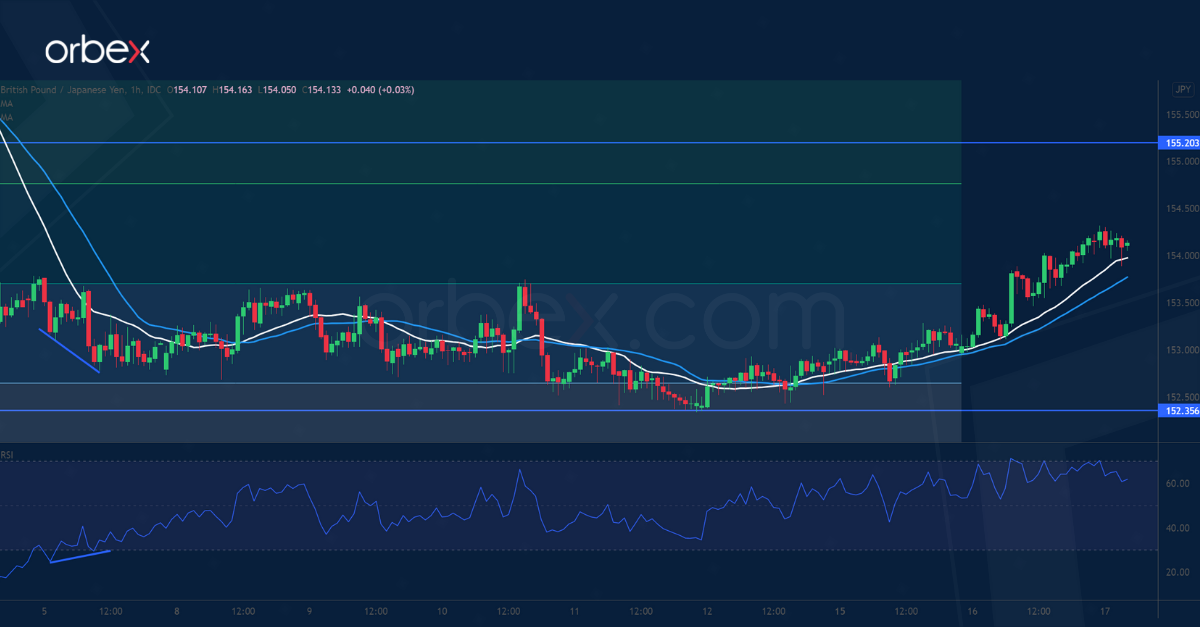
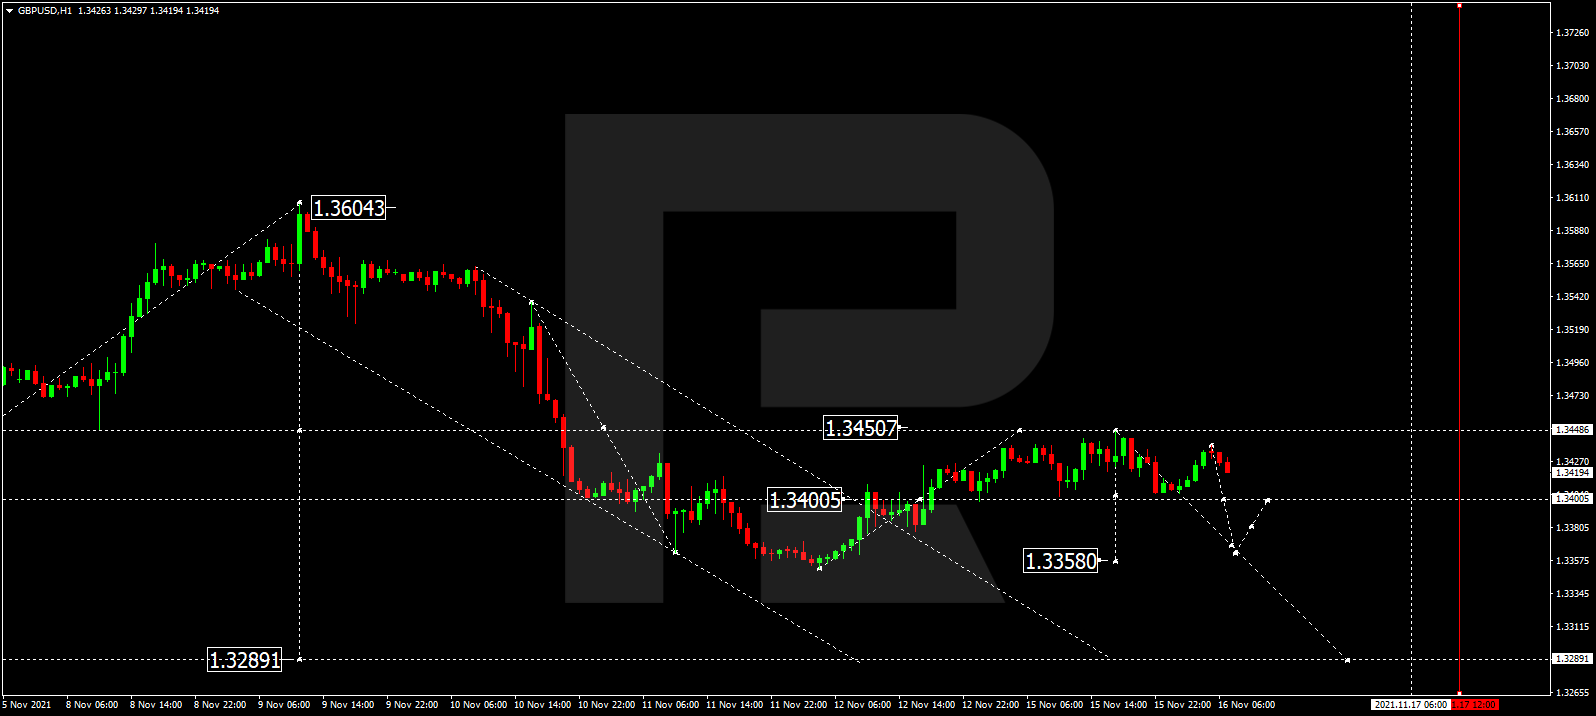
British Pound Sterling Futures:
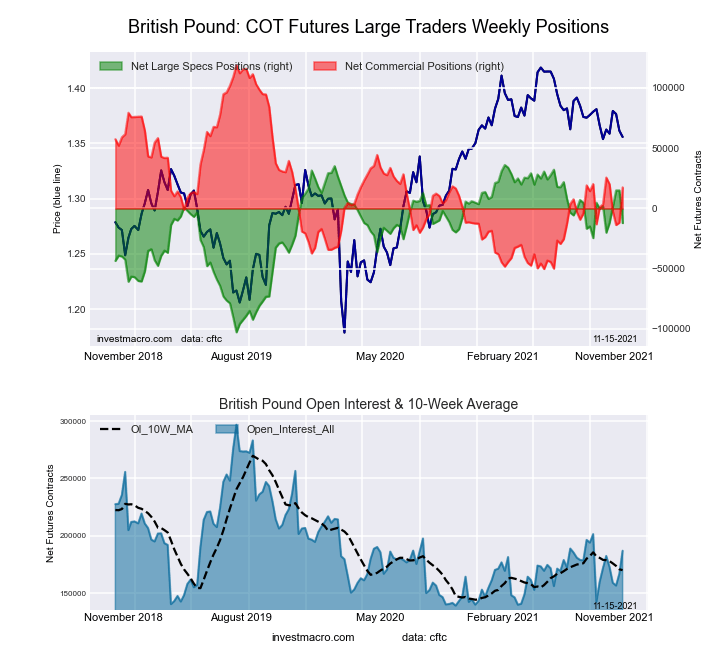 The British Pound Sterling large speculator standing this week reached a net position of -12,093 contracts in the data reported through Tuesday. This was a weekly lowering of -27,140 contracts from the previous week which had a total of 15,047 net contracts.
This week’s current strength score (the trader positioning range over the past three years, measured from 0 to 100) shows the speculators are currently Bullish with a score of 65.3 percent. The commercials are Bearish with a score of 40.1 percent and the small traders (not shown in chart) are Bearish with a score of 44.3 percent.
| BRITISH POUND Statistics | SPECULATORS | COMMERCIALS | SMALL TRADERS |
| – Percent of Open Interest Longs: | 28.9 | 54.3 | 13.1 |
| – Percent of Open Interest Shorts: | 35.4 | 44.9 | 16.0 |
| – Net Position: | -12,093 | 17,548 | -5,455 |
| – Gross Longs: | 54,004 | 101,492 | 24,510 |
| – Gross Shorts: | 66,097 | 83,944 | 29,965 |
| – Long to Short Ratio: | 0.8 to 1 | 1.2 to 1 | 0.8 to 1 |
| NET POSITION TREND: | | | |
| – COT Index Score (3 Year Range Pct): | 65.3 | 40.1 | 44.3 |
| – COT Index Reading (3 Year Range): | Bullish | Bearish | Bearish |
| NET POSITION MOVEMENT INDEX: | | | |
| – 6-Week Change in Strength Index: | -10.1 | 8.4 | -0.2 |
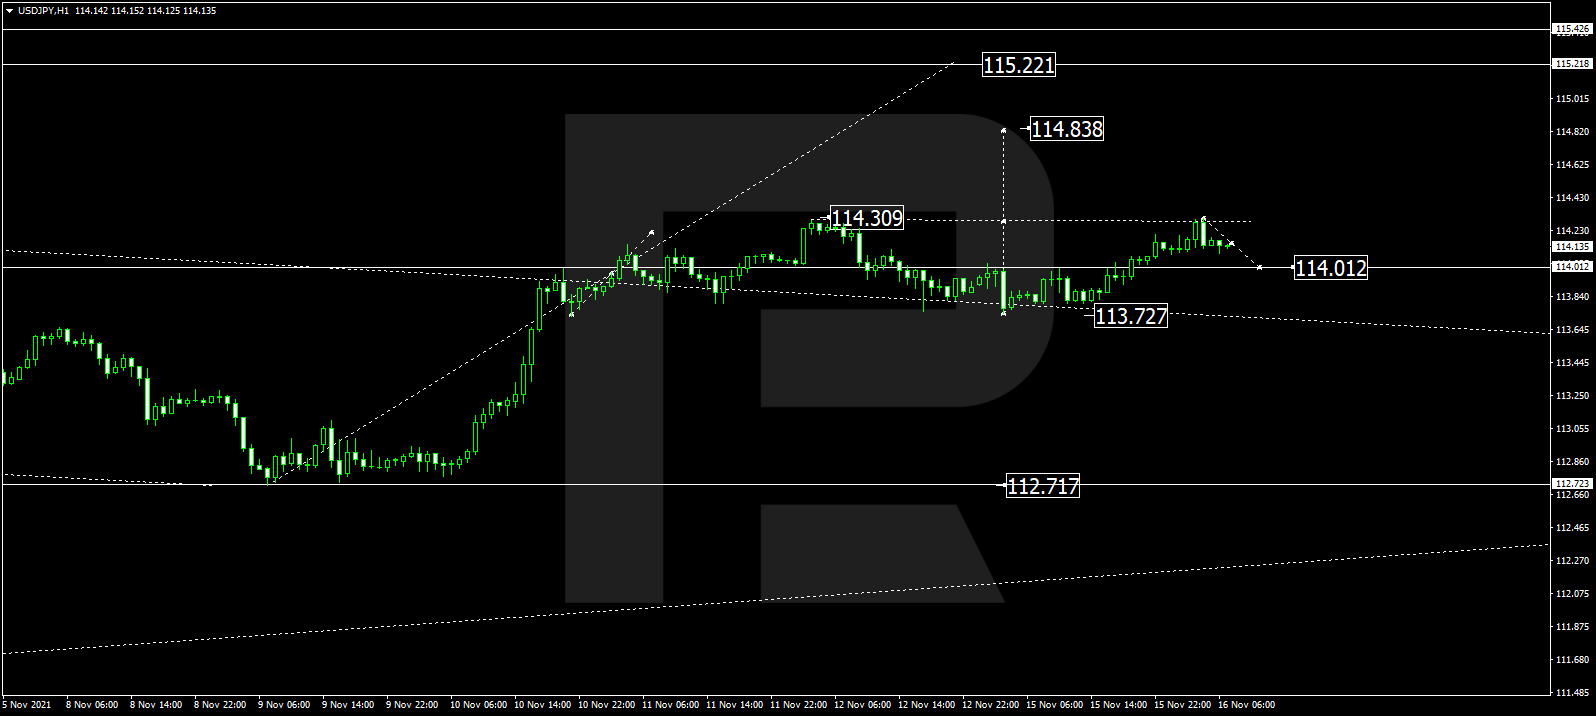
Japanese Yen Futures:
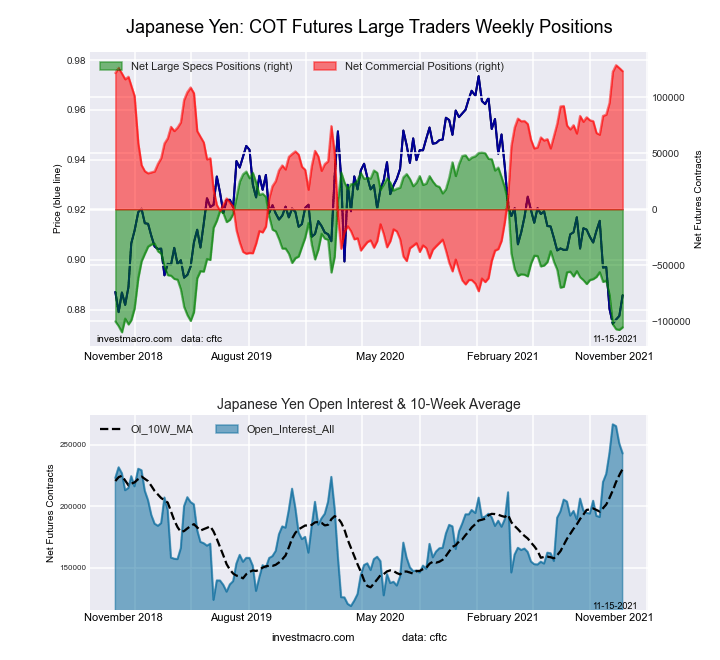 The Japanese Yen large speculator standing this week reached a net position of -105,351 contracts in the data reported through Tuesday. This was a weekly lift of 2,273 contracts from the previous week which had a total of -107,624 net contracts.
This week’s current strength score (the trader positioning range over the past three years, measured from 0 to 100) shows the speculators are currently Bearish-Extreme with a score of 2.8 percent. The commercials are Bullish-Extreme with a score of 97.3 percent and the small traders (not shown in chart) are Bearish-Extreme with a score of 11.2 percent.
| JAPANESE YEN Statistics | SPECULATORS | COMMERCIALS | SMALL TRADERS |
| – Percent of Open Interest Longs: | 6.8 | 83.5 | 8.8 |
| – Percent of Open Interest Shorts: | 50.1 | 32.8 | 16.1 |
| – Net Position: | -105,351 | 123,199 | -17,848 |
| – Gross Longs: | 16,440 | 203,044 | 21,297 |
| – Gross Shorts: | 121,791 | 79,845 | 39,145 |
| – Long to Short Ratio: | 0.1 to 1 | 2.5 to 1 | 0.5 to 1 |
| NET POSITION TREND: | | | |
| – COT Index Score (3 Year Range Pct): | 2.8 | 97.3 | 11.2 |
| – COT Index Reading (3 Year Range): | Bearish-Extreme | Bullish-Extreme | Bearish-Extreme |
| NET POSITION MOVEMENT INDEX: | | | |
| – 6-Week Change in Strength Index: | -25.3 | 19.8 | 1.5 |
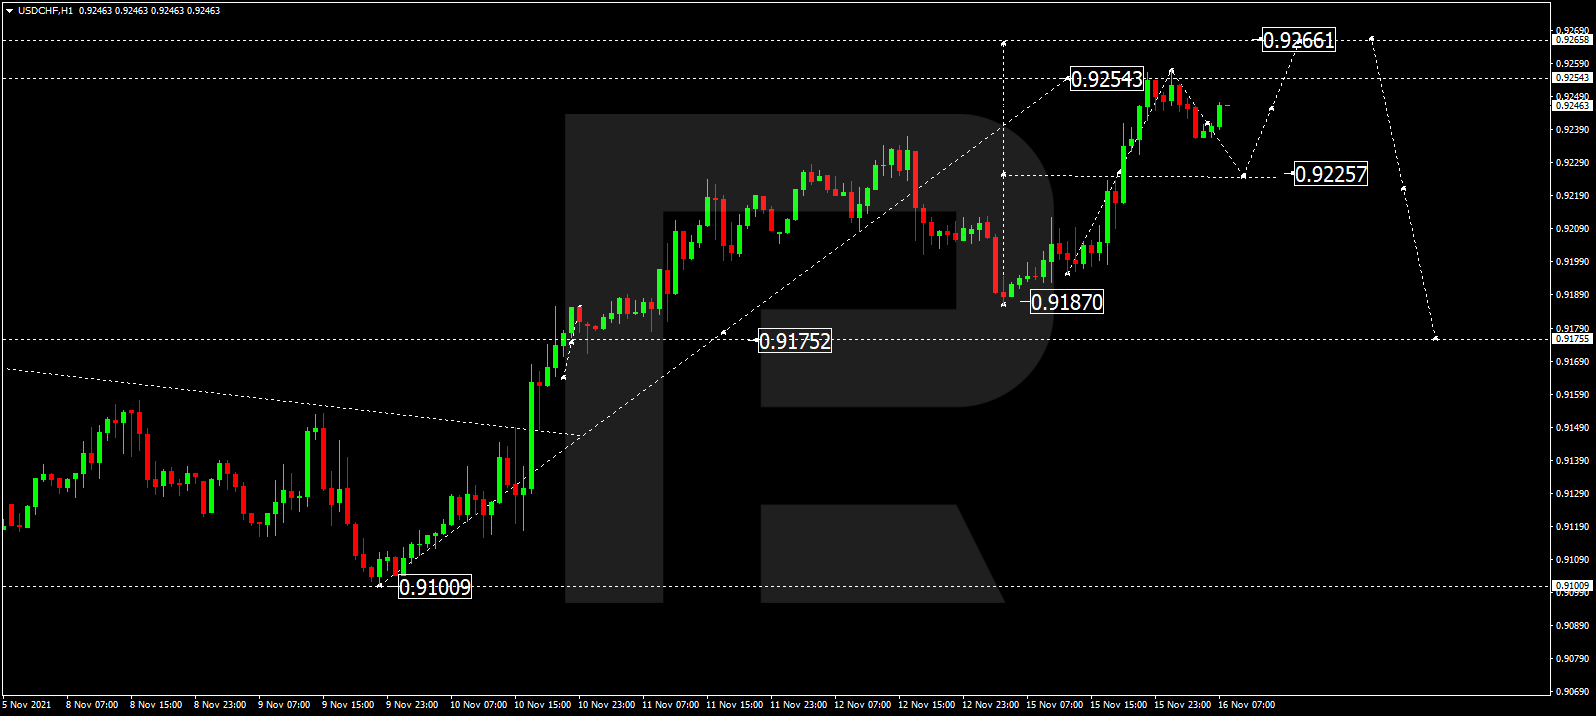
Swiss Franc Futures:
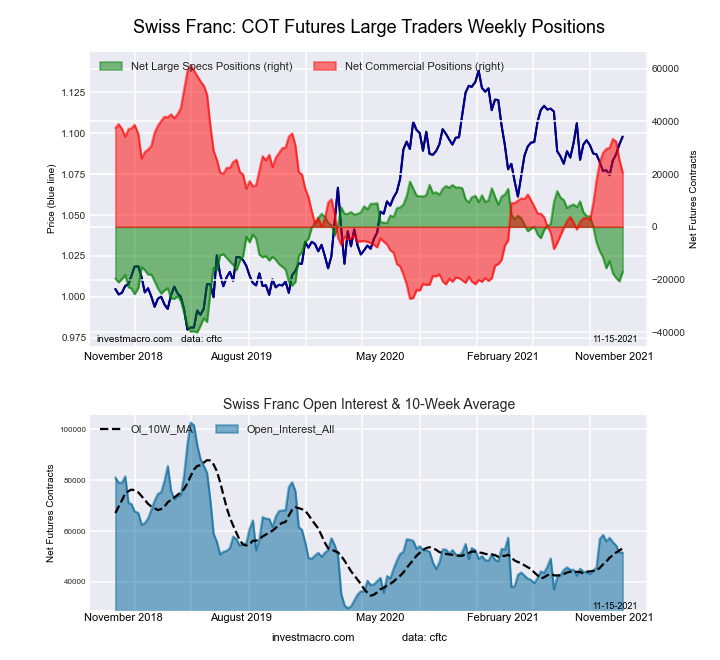 The Swiss Franc large speculator standing this week reached a net position of -17,043 contracts in the data reported through Tuesday. This was a weekly gain of 3,605 contracts from the previous week which had a total of -20,648 net contracts.
This week’s current strength score (the trader positioning range over the past three years, measured from 0 to 100) shows the speculators are currently Bearish with a score of 40.2 percent. The commercials are Bullish with a score of 54.0 percent and the small traders (not shown in chart) are Bullish with a score of 53.0 percent.
| SWISS FRANC Statistics | SPECULATORS | COMMERCIALS | SMALL TRADERS |
| – Percent of Open Interest Longs: | 9.1 | 63.0 | 27.3 |
| – Percent of Open Interest Shorts: | 42.2 | 23.2 | 34.1 |
| – Net Position: | -17,043 | 20,534 | -3,491 |
| – Gross Longs: | 4,690 | 32,499 | 14,095 |
| – Gross Shorts: | 21,733 | 11,965 | 17,586 |
| – Long to Short Ratio: | 0.2 to 1 | 2.7 to 1 | 0.8 to 1 |
| NET POSITION TREND: | | | |
| – COT Index Score (3 Year Range Pct): | 40.2 | 54.0 | 53.0 |
| – COT Index Reading (3 Year Range): | Bearish | Bullish | Bullish |
| NET POSITION MOVEMENT INDEX: | | | |
| – 6-Week Change in Strength Index: | -9.5 | -8.5 | 38.0 |
Canadian Dollar Futures:
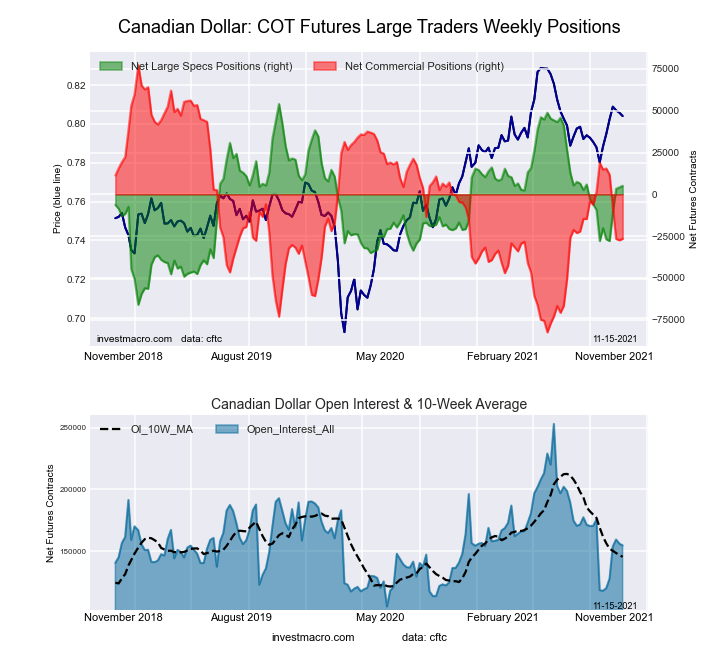 The Canadian Dollar large speculator standing this week reached a net position of 5,104 contracts in the data reported through Tuesday. This was a weekly gain of 942 contracts from the previous week which had a total of 4,162 net contracts.
This week’s current strength score (the trader positioning range over the past three years, measured from 0 to 100) shows the speculators are currently Bullish with a score of 59.3 percent. The commercials are Bearish with a score of 35.0 percent and the small traders (not shown in chart) are Bullish with a score of 79.2 percent.
| CANADIAN DOLLAR Statistics | SPECULATORS | COMMERCIALS | SMALL TRADERS |
| – Percent of Open Interest Longs: | 28.4 | 43.3 | 27.8 |
| – Percent of Open Interest Shorts: | 25.1 | 60.5 | 13.9 |
| – Net Position: | 5,104 | -26,608 | 21,504 |
| – Gross Longs: | 43,961 | 67,021 | 42,935 |
| – Gross Shorts: | 38,857 | 93,629 | 21,431 |
| – Long to Short Ratio: | 1.1 to 1 | 0.7 to 1 | 2.0 to 1 |
| NET POSITION TREND: | | | |
| – COT Index Score (3 Year Range Pct): | 59.3 | 35.0 | 79.2 |
| – COT Index Reading (3 Year Range): | Bullish | Bearish | Bullish |
| NET POSITION MOVEMENT INDEX: | | | |
| – 6-Week Change in Strength Index: | 21.1 | -26.0 | 24.3 |
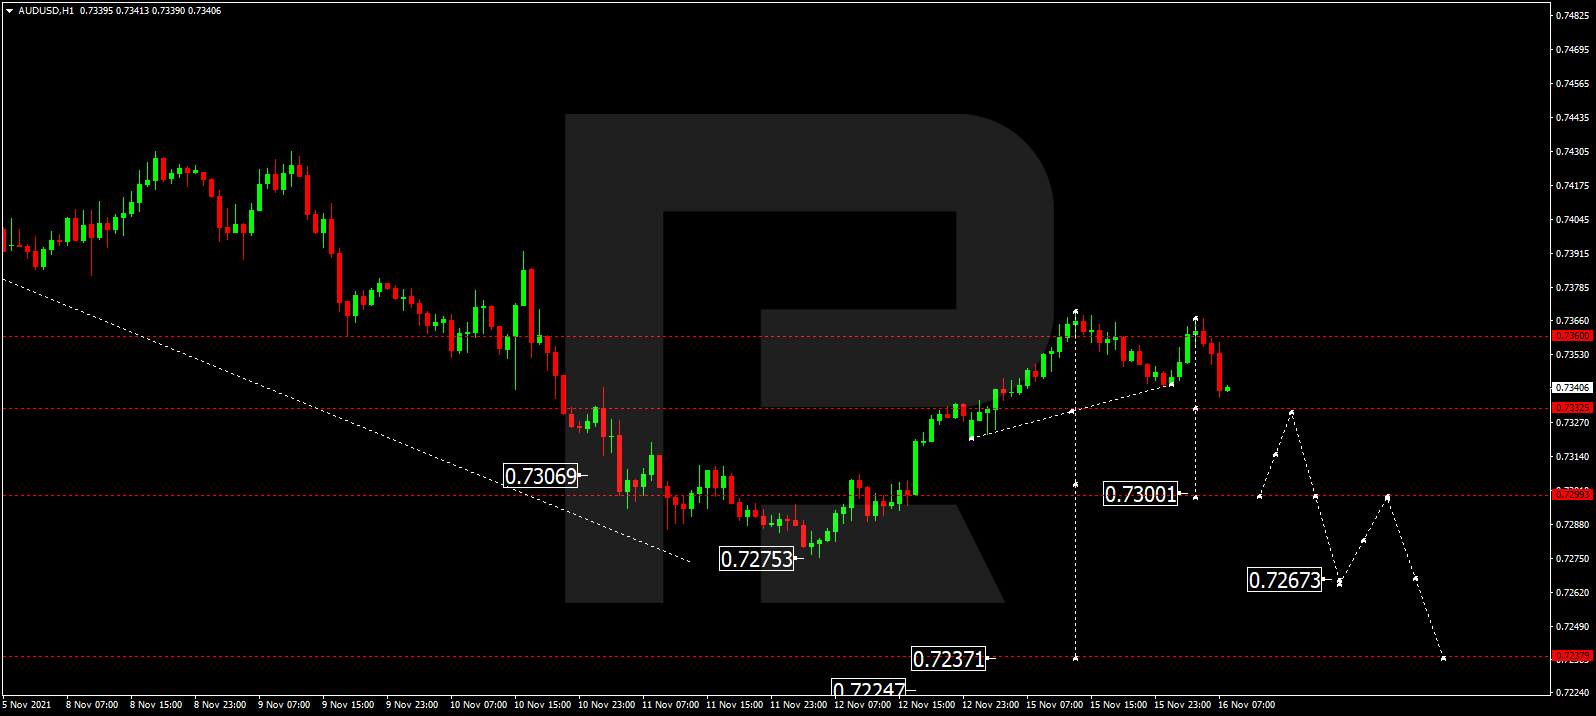
Australian Dollar Futures:
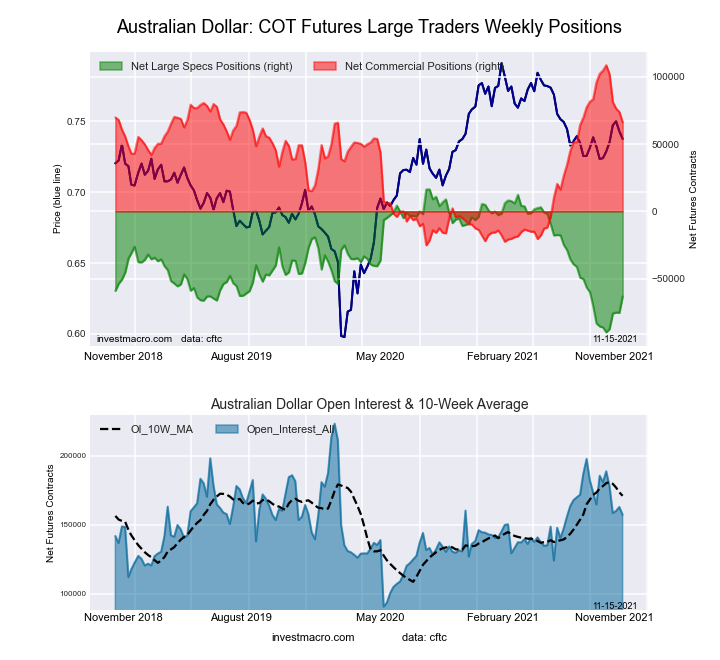 The Australian Dollar large speculator standing this week reached a net position of -63,424 contracts in the data reported through Tuesday. This was a weekly advance of 12,072 contracts from the previous week which had a total of -75,496 net contracts.
This week’s current strength score (the trader positioning range over the past three years, measured from 0 to 100) shows the speculators are currently Bearish with a score of 25.0 percent. The commercials are Bullish with a score of 68.3 percent and the small traders (not shown in chart) are Bearish with a score of 45.7 percent.
| AUSTRALIAN DOLLAR Statistics | SPECULATORS | COMMERCIALS | SMALL TRADERS |
| – Percent of Open Interest Longs: | 15.2 | 69.2 | 14.4 |
| – Percent of Open Interest Shorts: | 55.5 | 27.1 | 16.1 |
| – Net Position: | -63,424 | 66,185 | -2,761 |
| – Gross Longs: | 23,844 | 108,880 | 22,621 |
| – Gross Shorts: | 87,268 | 42,695 | 25,382 |
| – Long to Short Ratio: | 0.3 to 1 | 2.6 to 1 | 0.9 to 1 |
| NET POSITION TREND: | | | |
| – COT Index Score (3 Year Range Pct): | 25.0 | 68.3 | 45.7 |
| – COT Index Reading (3 Year Range): | Bearish | Bullish | Bearish |
| NET POSITION MOVEMENT INDEX: | | | |
| – 6-Week Change in Strength Index: | 21.6 | -28.8 | 37.9 |
New Zealand Dollar Futures:
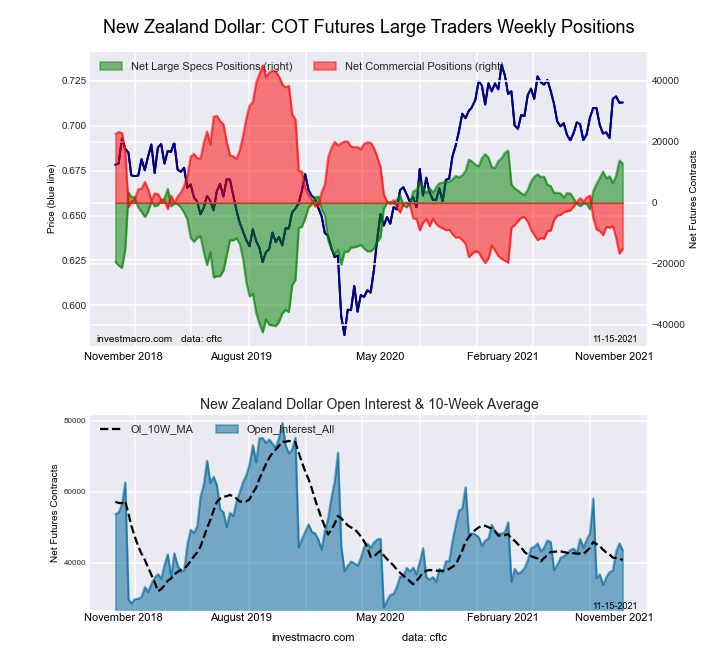 The New Zealand Dollar large speculator standing this week reached a net position of 12,882 contracts in the data reported through Tuesday. This was a weekly fall of -979 contracts from the previous week which had a total of 13,861 net contracts.
This week’s current strength score (the trader positioning range over the past three years, measured from 0 to 100) shows the speculators are currently Bullish-Extreme with a score of 92.9 percent. The commercials are Bearish-Extreme with a score of 7.1 percent and the small traders (not shown in chart) are Bullish with a score of 77.7 percent.
| NEW ZEALAND DOLLAR Statistics | SPECULATORS | COMMERCIALS | SMALL TRADERS |
| – Percent of Open Interest Longs: | 58.2 | 26.4 | 12.4 |
| – Percent of Open Interest Shorts: | 28.6 | 61.2 | 7.2 |
| – Net Position: | 12,882 | -15,139 | 2,257 |
| – Gross Longs: | 25,312 | 11,467 | 5,405 |
| – Gross Shorts: | 12,430 | 26,606 | 3,148 |
| – Long to Short Ratio: | 2.0 to 1 | 0.4 to 1 | 1.7 to 1 |
| NET POSITION TREND: | | | |
| – COT Index Score (3 Year Range Pct): | 92.9 | 7.1 | 77.7 |
| – COT Index Reading (3 Year Range): | Bullish-Extreme | Bearish-Extreme | Bullish |
| NET POSITION MOVEMENT INDEX: | | | |
| – 6-Week Change in Strength Index: | 4.4 | -7.0 | 21.8 |
Mexican Peso Futures:
 The Mexican Peso large speculator standing this week reached a net position of -48,407 contracts in the data reported through Tuesday. This was a weekly boost of 2,611 contracts from the previous week which had a total of -51,018 net contracts.
This week’s current strength score (the trader positioning range over the past three years, measured from 0 to 100) shows the speculators are currently Bearish-Extreme with a score of 1.2 percent. The commercials are Bullish-Extreme with a score of 98.6 percent and the small traders (not shown in chart) are Bullish with a score of 54.6 percent.
| MEXICAN PESO Statistics | SPECULATORS | COMMERCIALS | SMALL TRADERS |
| – Percent of Open Interest Longs: | 37.6 | 57.9 | 3.6 |
| – Percent of Open Interest Shorts: | 67.1 | 30.1 | 2.0 |
| – Net Position: | -48,407 | 45,684 | 2,723 |
| – Gross Longs: | 61,791 | 95,074 | 5,976 |
| – Gross Shorts: | 110,198 | 49,390 | 3,253 |
| – Long to Short Ratio: | 0.6 to 1 | 1.9 to 1 | 1.8 to 1 |
| NET POSITION TREND: | | | |
| – COT Index Score (3 Year Range Pct): | 1.2 | 98.6 | 54.6 |
| – COT Index Reading (3 Year Range): | Bearish-Extreme | Bullish-Extreme | Bullish |
| NET POSITION MOVEMENT INDEX: | | | |
| – 6-Week Change in Strength Index: | -13.0 | 12.6 | 2.6 |
Brazilian Real Futures:
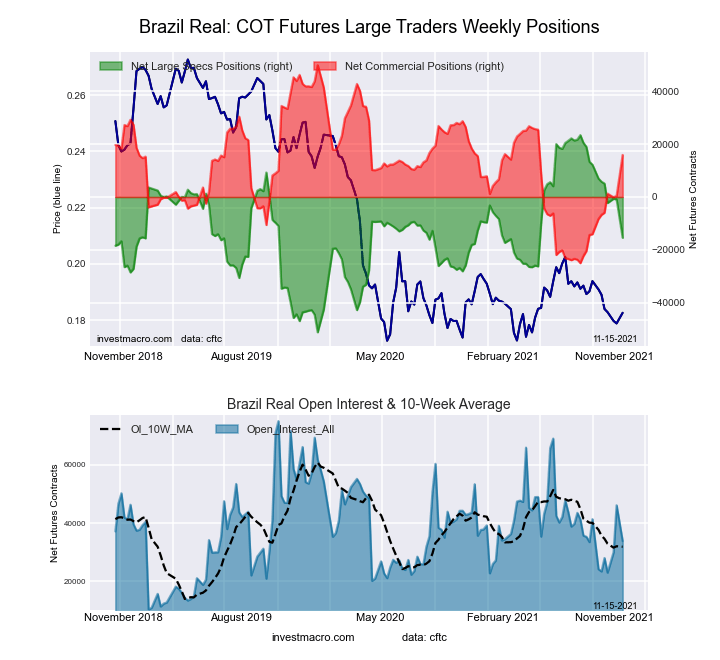 The Brazilian Real large speculator standing this week reached a net position of -15,458 contracts in the data reported through Tuesday. This was a weekly reduction of -1,186 contracts from the previous week which had a total of -942 net contracts.
This week’s current strength score (the trader positioning range over the past three years, measured from 0 to 100) shows the speculators are currently Bearish with a score of 47.9 percent. The commercials are Bullish with a score of 54.7 percent and the small traders (not shown in chart) are Bullish with a score of 60.9 percent.
| BRAZIL REAL Statistics | SPECULATORS | COMMERCIALS | SMALL TRADERS |
| – Percent of Open Interest Longs: | 31.5 | 60.0 | 7.9 |
| – Percent of Open Interest Shorts: | 77.2 | 12.8 | 9.4 |
| – Net Position: | -15,458 | 15,945 | -487 |
| – Gross Longs: | 10,644 | 20,275 | 2,676 |
| – Gross Shorts: | 26,102 | 4,330 | 3,163 |
| – Long to Short Ratio: | 0.4 to 1 | 4.7 to 1 | 0.8 to 1 |
| NET POSITION TREND: | | | |
| – COT Index Score (3 Year Range Pct): | 47.9 | 54.7 | 60.9 |
| – COT Index Reading (3 Year Range): | Bearish | Bullish | Bullish |
| NET POSITION MOVEMENT INDEX: | | | |
| – 6-Week Change in Strength Index: | -27.5 | 29.2 | -16.4 |
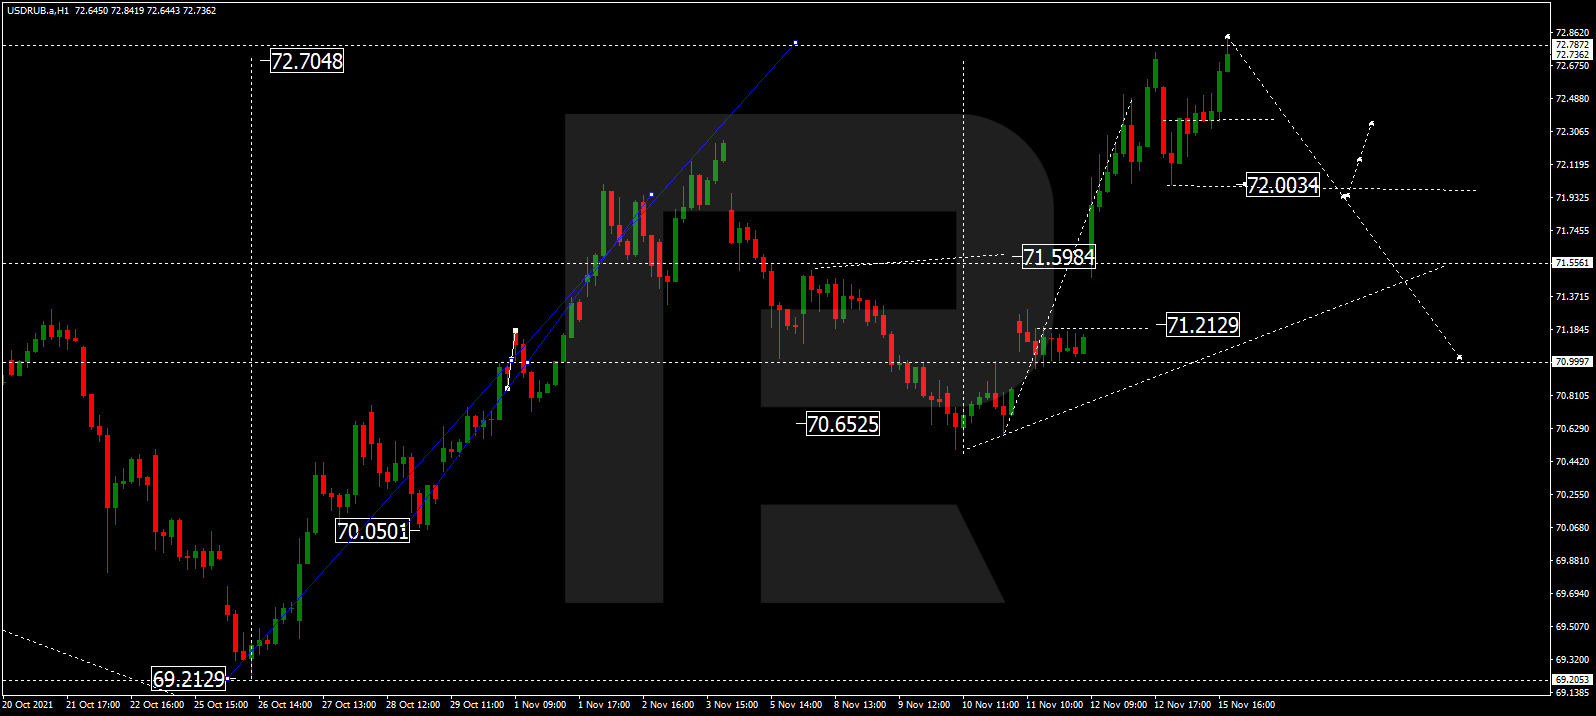
Russian Ruble Futures:
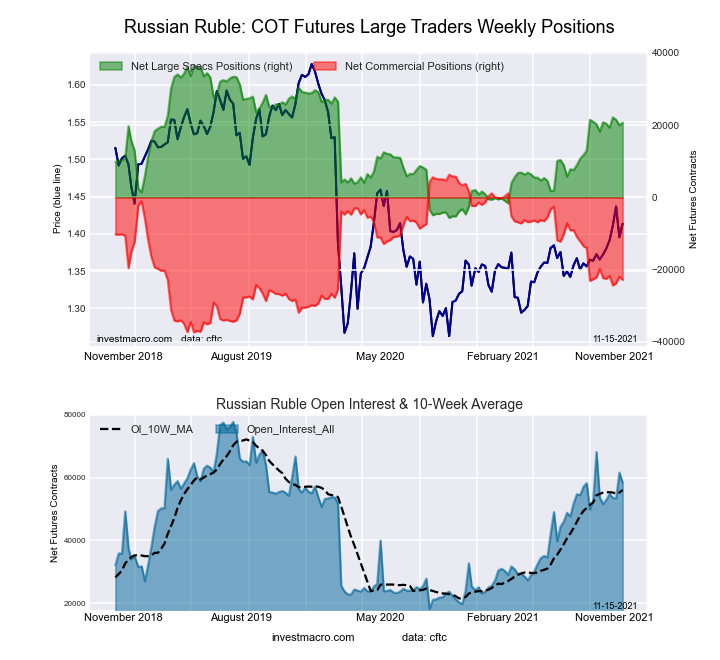 The Russian Ruble large speculator standing this week reached a net position of 20,703 contracts in the data reported through Tuesday. This was a weekly advance of 721 contracts from the previous week which had a total of 19,982 net contracts.
This week’s current strength score (the trader positioning range over the past three years, measured from 0 to 100) shows the speculators are currently Bullish with a score of 62.4 percent. The commercials are Bearish with a score of 33.3 percent and the small traders (not shown in chart) are Bullish-Extreme with a score of 91.4 percent.
| RUSSIAN RUBLE Statistics | SPECULATORS | COMMERCIALS | SMALL TRADERS |
| – Percent of Open Interest Longs: | 58.0 | 37.0 | 5.0 |
| – Percent of Open Interest Shorts: | 22.5 | 76.0 | 1.4 |
| – Net Position: | 20,703 | -22,797 | 2,094 |
| – Gross Longs: | 33,855 | 21,570 | 2,924 |
| – Gross Shorts: | 13,152 | 44,367 | 830 |
| – Long to Short Ratio: | 2.6 to 1 | 0.5 to 1 | 3.5 to 1 |
| NET POSITION TREND: | | | |
| – COT Index Score (3 Year Range Pct): | 62.4 | 33.3 | 91.4 |
| – COT Index Reading (3 Year Range): | Bullish | Bearish | Bullish-Extreme |
| NET POSITION MOVEMENT INDEX: | | | |
| – 6-Week Change in Strength Index: | -0.3 | -1.1 | 16.0 |
Bitcoin Futures:
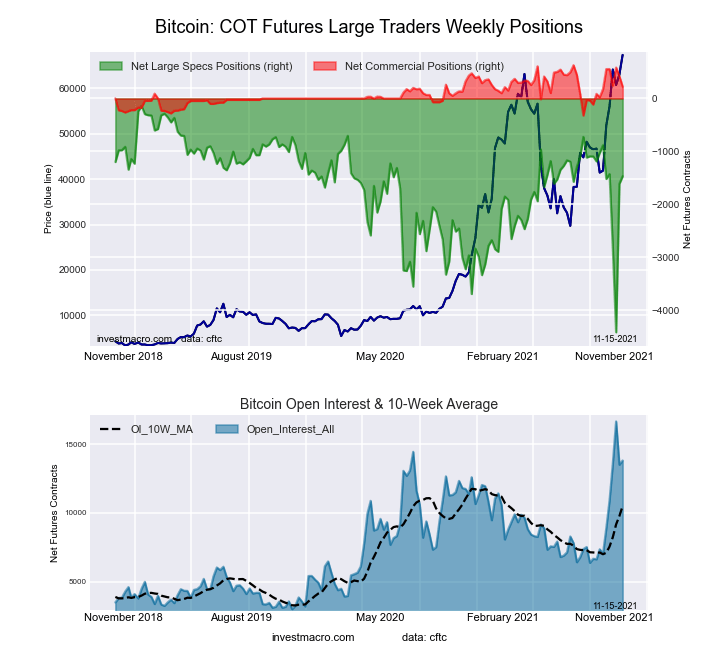 The Bitcoin large speculator standing this week reached a net position of -1,467 contracts in the data reported through Tuesday. This was a weekly lift of 145 contracts from the previous week which had a total of -1,612 net contracts.
This week’s current strength score (the trader positioning range over the past three years, measured from 0 to 100) shows the speculators are currently Bullish with a score of 69.0 percent. The commercials are Bullish with a score of 57.3 percent and the small traders (not shown in chart) are Bearish with a score of 26.4 percent.
| BITCOIN Statistics | SPECULATORS | COMMERCIALS | SMALL TRADERS |
| – Percent of Open Interest Longs: | 67.0 | 4.1 | 15.0 |
| – Percent of Open Interest Shorts: | 77.6 | 2.5 | 6.0 |
| – Net Position: | -1,467 | 223 | 1,244 |
| – Gross Longs: | 9,258 | 566 | 2,071 |
| – Gross Shorts: | 10,725 | 343 | 827 |
| – Long to Short Ratio: | 0.9 to 1 | 1.7 to 1 | 2.5 to 1 |
| NET POSITION TREND: | | | |
| – COT Index Score (3 Year Range Pct): | 69.0 | 57.3 | 26.4 |
| – COT Index Reading (3 Year Range): | Bullish | Bullish | Bearish |
| NET POSITION MOVEMENT INDEX: | | | |
| – 6-Week Change in Strength Index: | -13.7 | 4.7 | 15.3 |
Article By InvestMacro – Receive our weekly COT Reports by Email
*COT Report: The COT data, released weekly to the public each Friday, is updated through the most recent Tuesday (data is 3 days old) and shows a quick view of how large speculators or non-commercials (for-profit traders) were positioned in the futures markets.
The CFTC categorizes trader positions according to commercial hedgers (traders who use futures contracts for hedging as part of the business), non-commercials (large traders who speculate to realize trading profits) and nonreportable traders (usually small traders/speculators) as well as their open interest (contracts open in the market at time of reporting).See CFTC criteria here.


