by JustForex
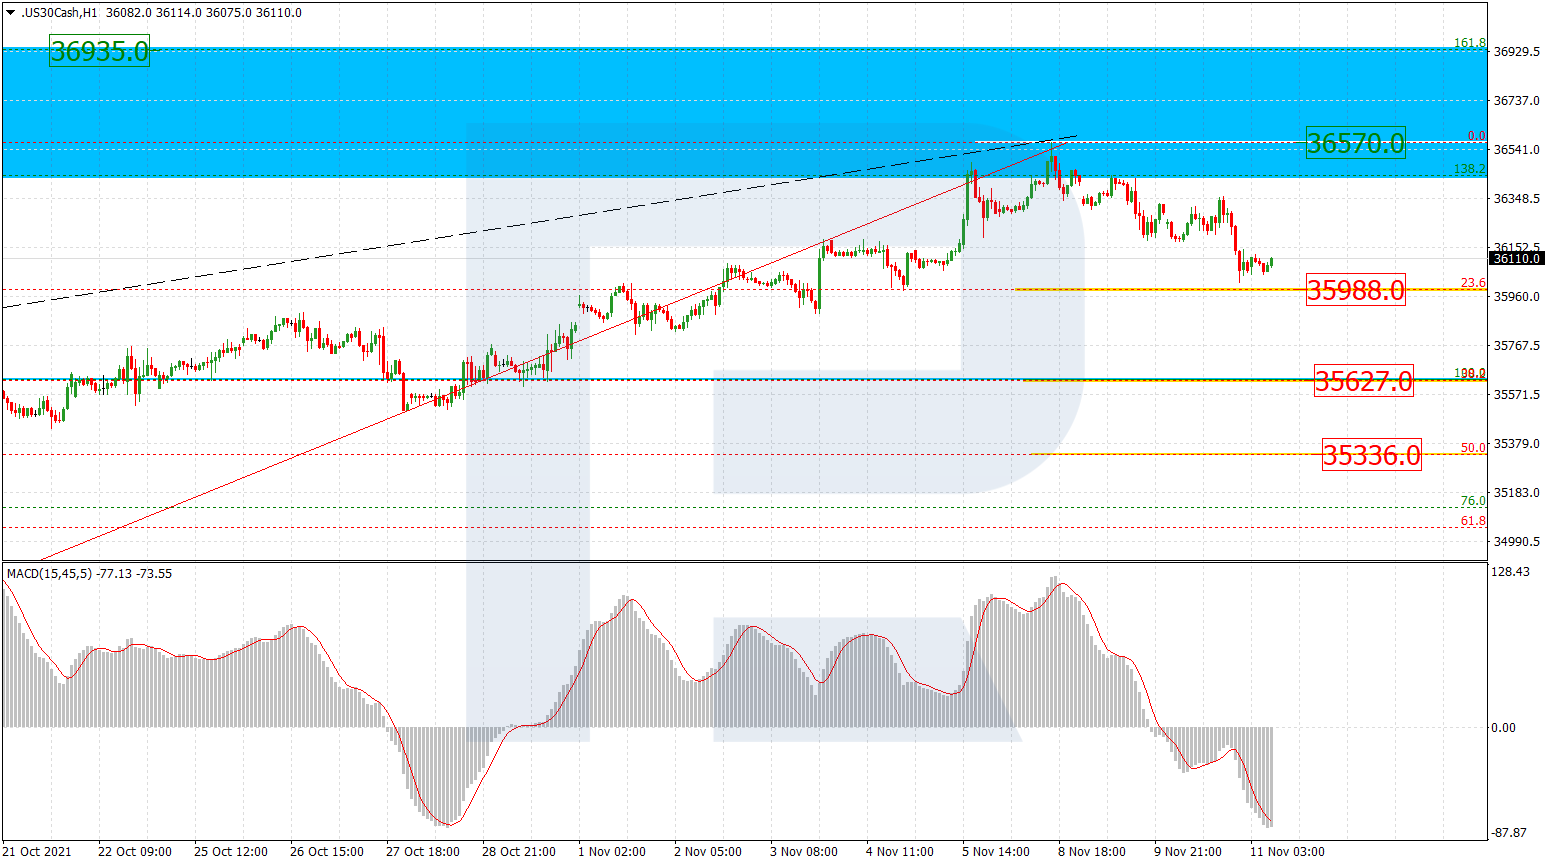
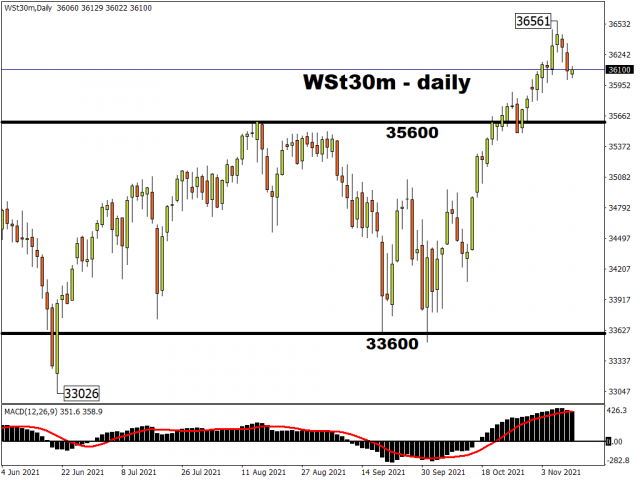
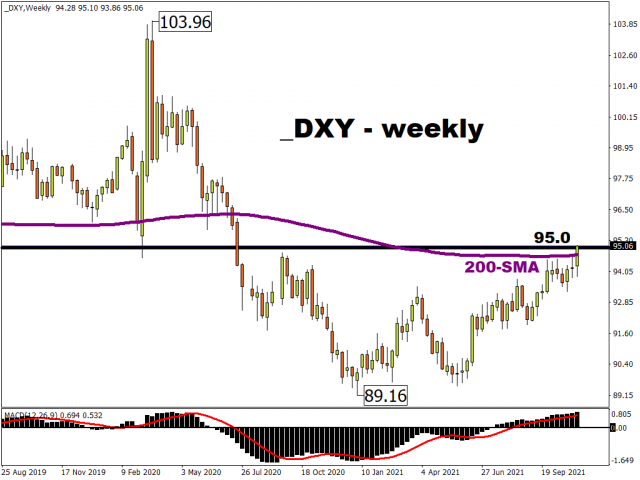
The US stock indices traded yesterday without a single trend. The Dow Jones index decreased by 0.44%, the S&P 500 added 0.06% and the Nasdaq technology increased by 0.52%. The dollar is strengthening due to the expectation of a rate hike soon after the Fed ends its stimulative bond buying cuts. This risks triggering capital outflows from emerging market assets, while negatively affecting stocks, bonds, and other currencies.
On Thursday, US President Joe Biden signed a law preventing companies such as Huawei Technologies Co and ZTE Corp, considered security threats, from getting licenses for their new equipment from US regulators.
Major European stock indexes mostly rose yesterday. The British FTSE 100 increased by 0.6%, Germany’s DAX and France’s CAC 40 added 0.1%, and 0.2%, Italy’s FTSE MIB increased by 0.3%, only Spain’s IBEX decreased by 0.5%.
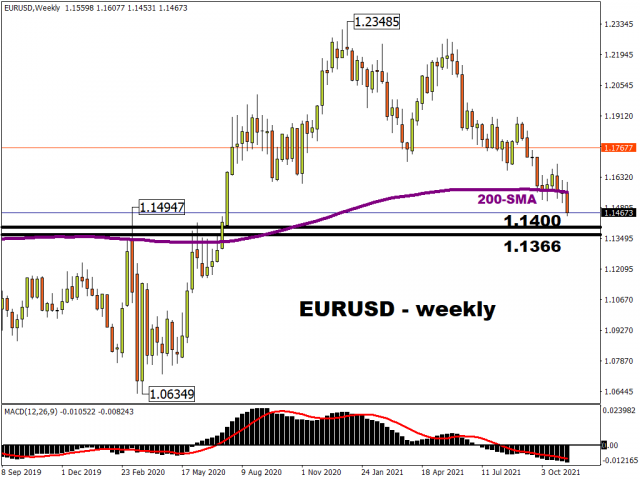
According to the survey of economists, the inflation rate in the Eurozone is expected to be 3.1% in the 1st quarter, 2.7% in the 2nd quarter, and 2.1% in the 3rd quarter of 2022 (against 2.5%, 2.2%, and 1.6% in the previous forecast, respectively). Inflation in the Eurozone may exceed forecasts if supply chain disruptions persist.
The European Union is discussing imposing sanctions against Russian Aeroflot because of the migration crisis on the Belarusian-Polish border. The United States and the United Kingdom may join the restrictive measures.
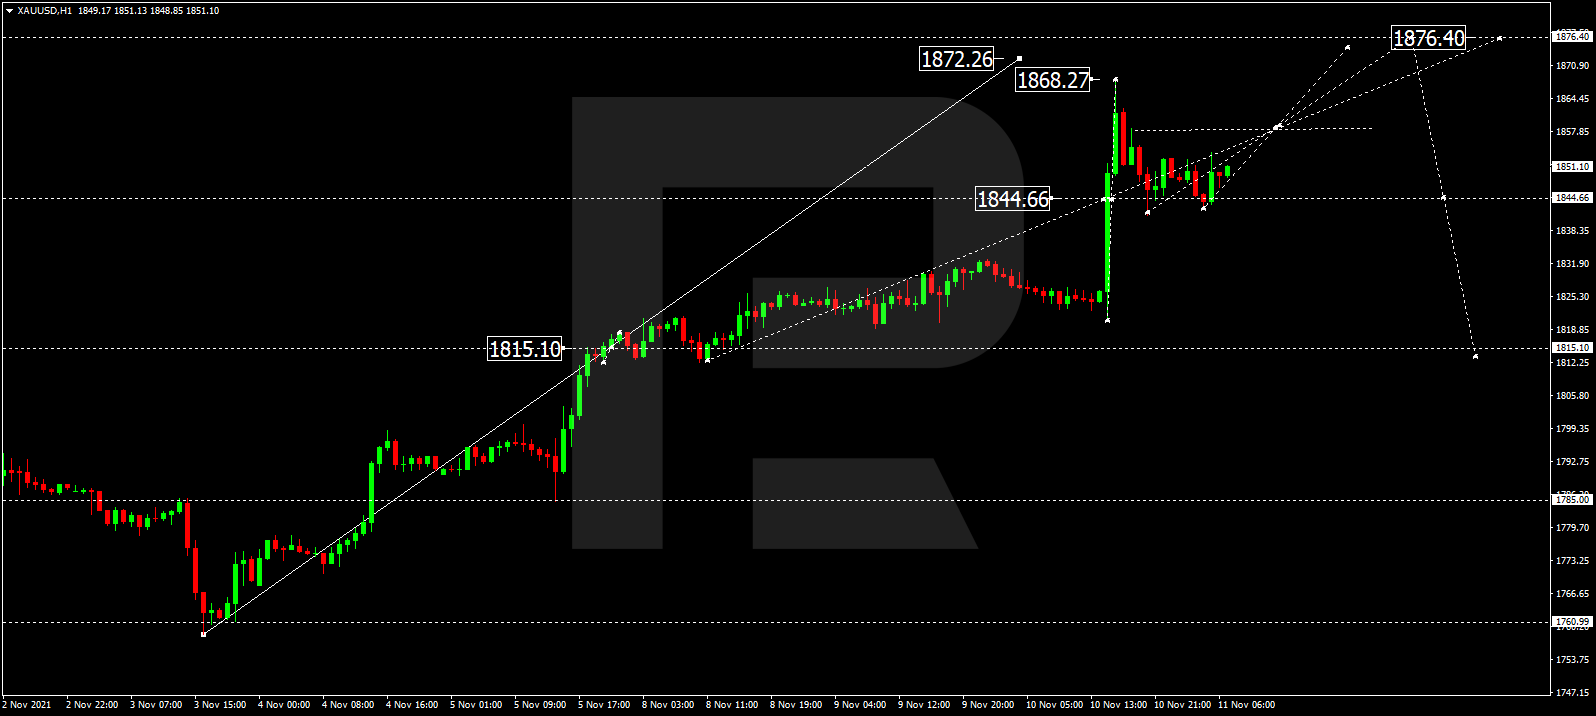
Gold increased to $1,865 an ounce Thursday, its highest since mid-June, as traders continue to buy gold actively as a hedge against inflation. But many analysts don’t see any further upside for gold as tighter monetary policy drives up government bond yields, which as a rule, tend to decrease precious metal prices.
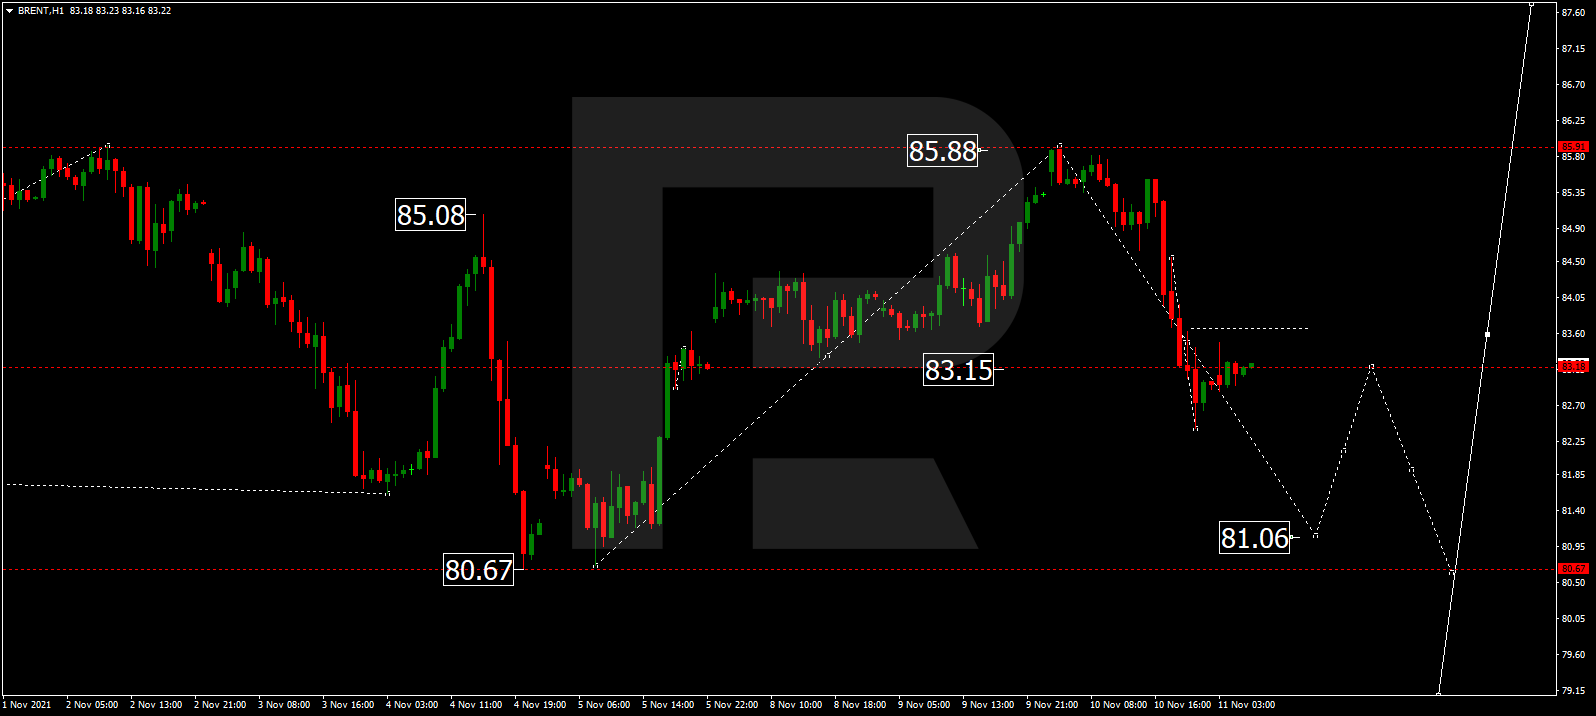
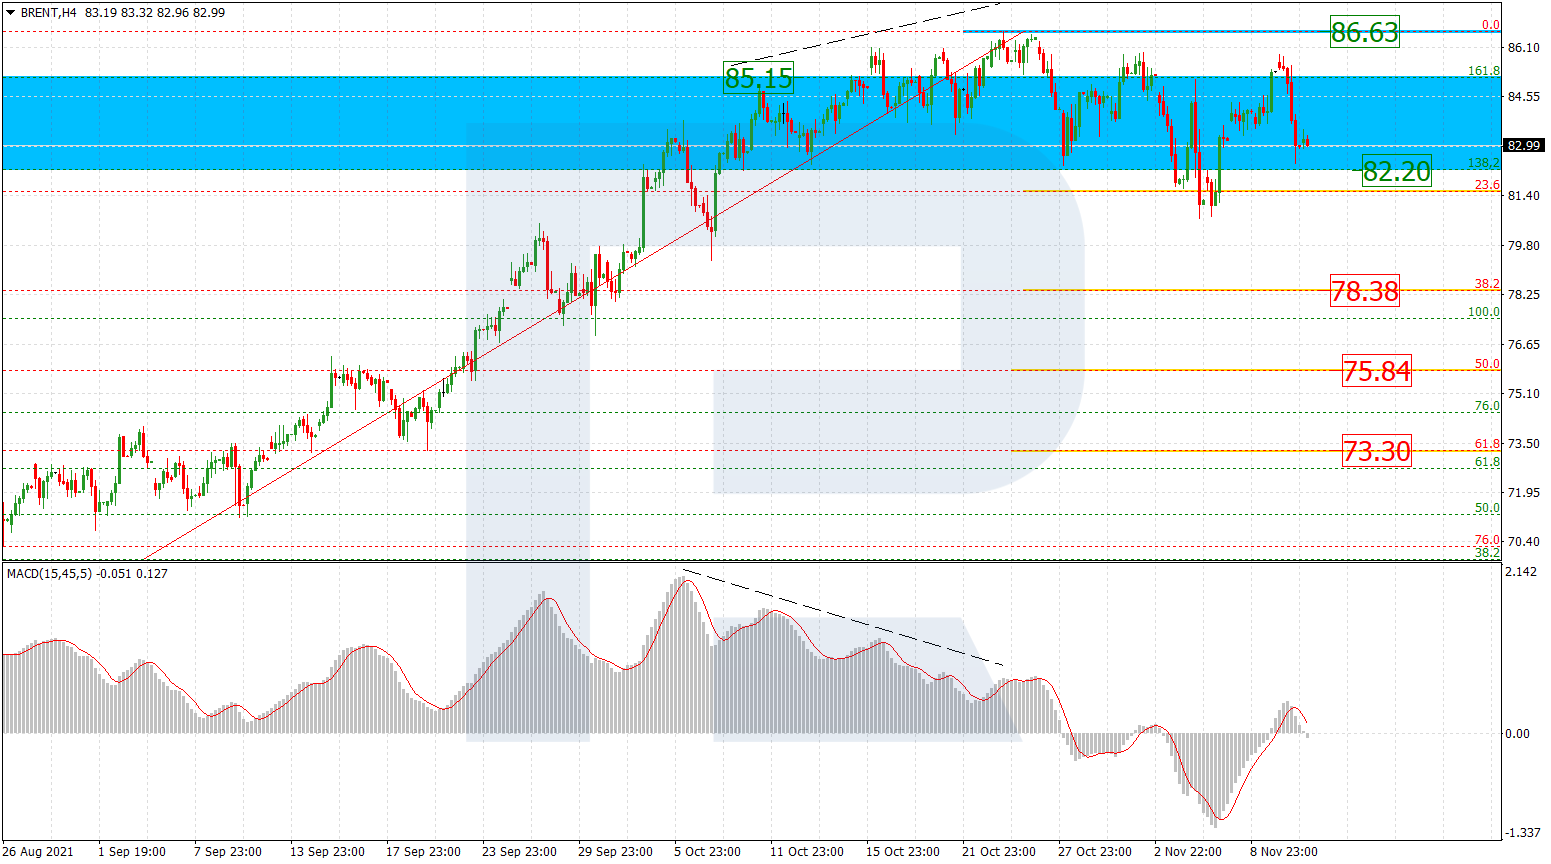
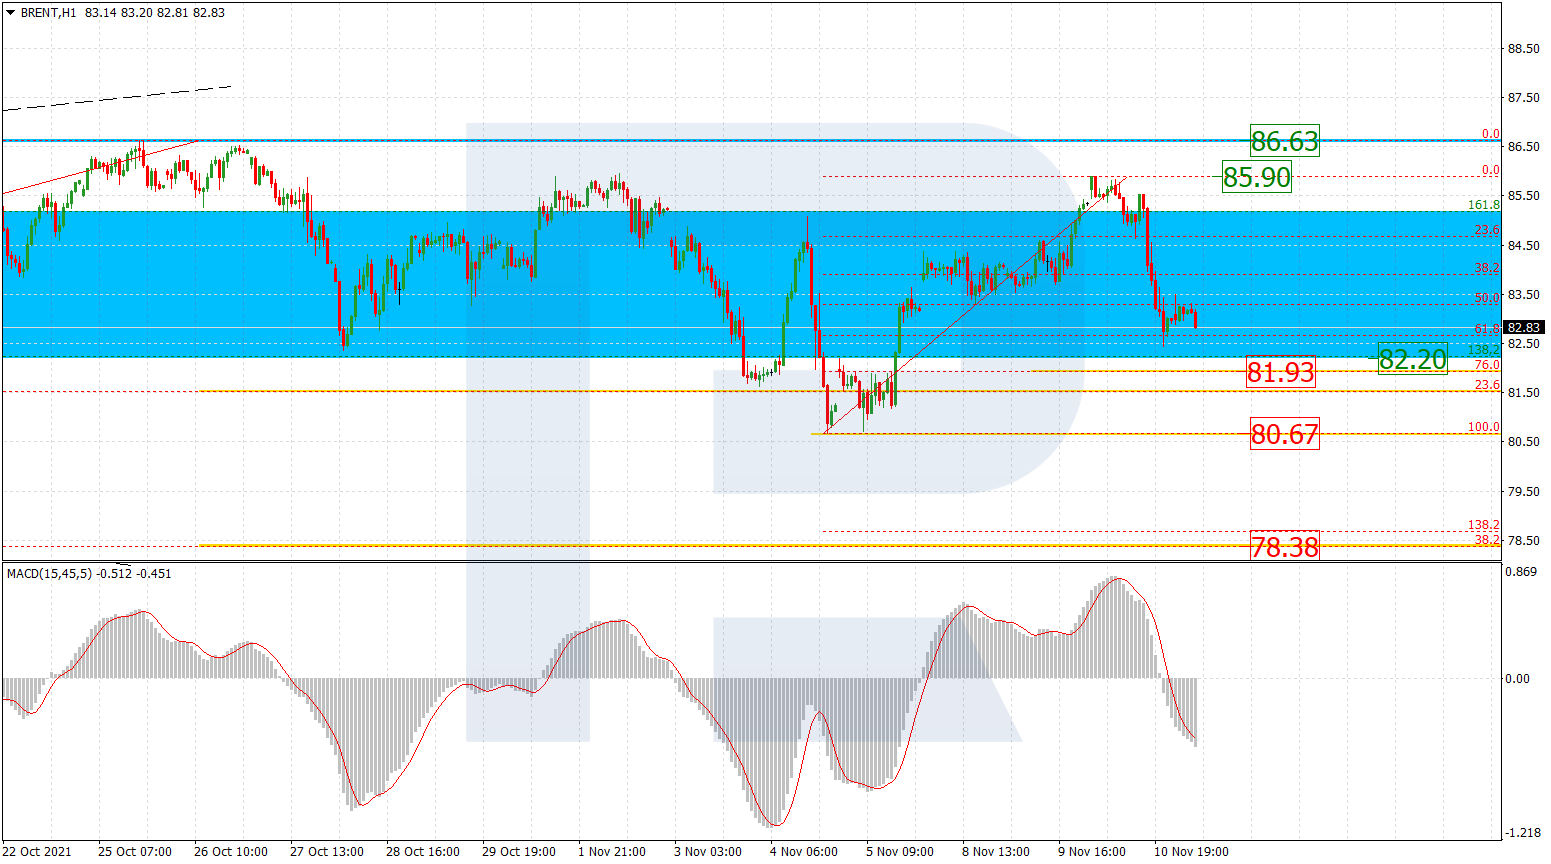
Commercial oil inventories increased by 18.5 million barrels in September but were still 163 million barrels lower than 2015-2019. According to Bloomberg analysts, Russia and the US will increase oil supplies in 2022.
Yesterday, Asian stock indexes traded flat after Chinese real estate developer Evergrande could avoid default. China Evergrande Group must pay another $366 million in interest payments on its obligations. Evergrande was able to prevent default with payments at the last minute overdue bonds on Wednesday. However, Evergrande is far from successful as it strives to sell its own assets to try to get ahead of its payment schedule. The company raised $144 million in recent days by selling its stake in the Internet company Hengten Networks Group.
Hong Kong’s Hang Seng technology index Increased by 2% in morning trading. Shares of Alibaba in Hong Kong added 0.74% after orders rose to $84.54 billion in the 11.11 sale as compared to 74 billion dollars a year ago.
Goldman Sachs has become more optimistic about Chinese stocks affected by a series of regulatory shocks and the debt crisis of the real estate sector this year, as Beijing is going to ease regulatory pressure on the economy.
Main market quotes:
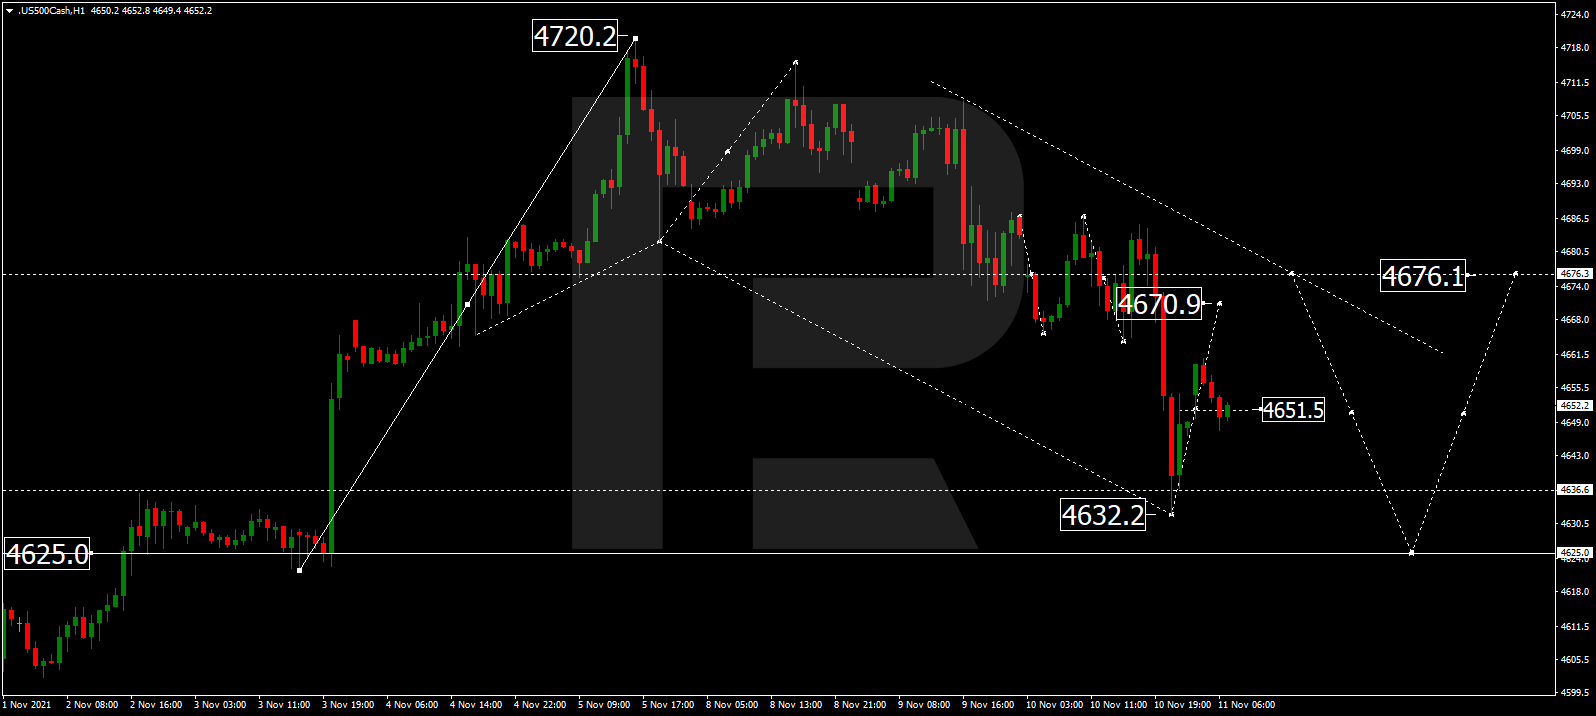
S&P 500 (F) 4,649.27 +2.56 (+0.055%)
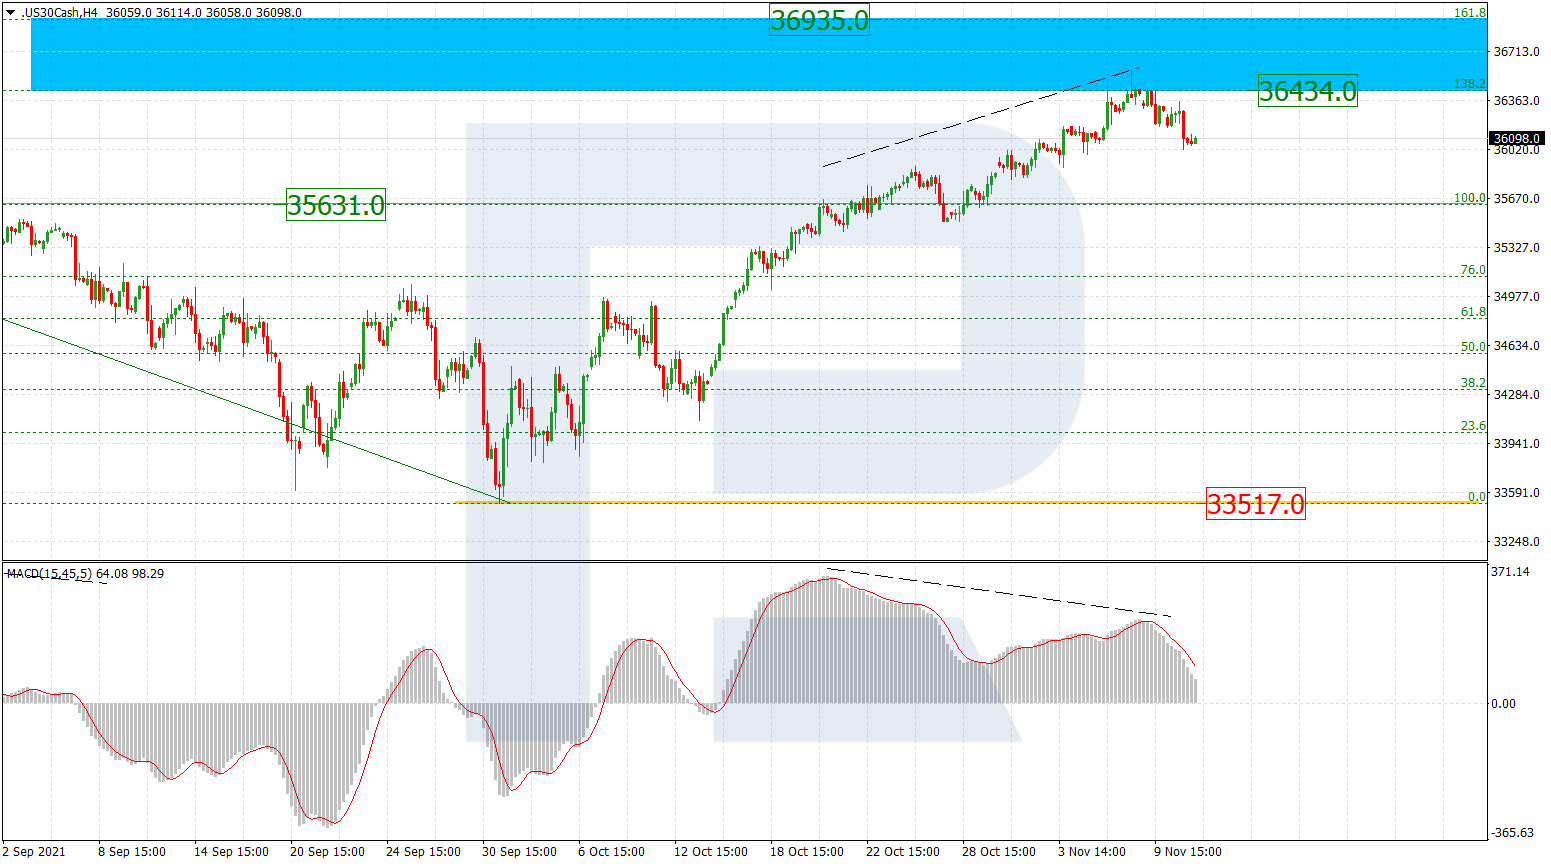
Dow Jones 35,921.23 −158.71 (−0.40%)
DAX 16,083.11 +15.28 (+0.095%)
FTSE 100 7,384.18 +44.03 (+0.60%)
USD Index 95.18 +0.33 (+0.34%)
- – China Unemployment Rate (m/m) at 04:30 (GMT+2);
- – Eurozone Industrial Production (m/m) at 12:00 (GMT+2);
- – US JOLTs Job Openings (m/m) at 17:00 (GMT+2);
- – US Michigan Consumer Sentiment (m/m) at 17:00 (GMT+2);
- – US FOMC Member Williams’s Speech at 19:10 (GMT+2).
by JustForex
This article reflects a personal opinion and should not be interpreted as an investment advice, and/or offer, and/or a persistent request for carrying out financial transactions, and/or a guarantee, and/or a forecast of future events.