Archive for Forex and Currency News – Page 189

US indices are going for records and oil is stable

by JustForex

Yesterday, the US stock market traded without a single trend. The S&P 500 index (US500) decreased by 0.1%, the Nasdaq technology index (US100) lost 0.56%, while the Dow Jones Industrial Average (US30) gained 0.26% and rose for the fifth straight trading session, the longest uninterrupted period of growth in two months. Since the beginning of the current year, the Dow Jones (US30) has gained nearly 19%, the S&P 500 (US500) added more than 27%, the Nasdaq (US100) increased by 22.5%. Meanwhile, the S&P 500 index showed a larger gain for 2021 than the Nasdaq index for the first time since 2016.

On Monday, the Centers for Disease Control and Prevention (CDC) reduced the recommended isolation time for Americans with asymptomatic cases of COVID-19 infection to five days from 10 days previously. The CDC has issued new recommendations, as well as the approval of new pills and vaccines against COVID-19. This helped investors not respond sharply to the cancellation of thousands of flights and the closure of Apple stores due to increased illness among employees.

European stock indices mostly rose yesterday. Germany’s DAX (DE30) increased by 0.81%, France’s CAC 40 (FR40) gained 0.57% and Spain’s IBEX (ES35) added 0.77%. Spain’s retail sales index jumped by 4.9% in November. The sales did not grow four months in a row. The ECB began to reduce the pace of buying assets. These are the first steps toward ending the PEPP program next year and raising the issue of an interest rate hike. But analysts agree that the ECB will not raise the rates before 2023.

On Tuesday, Asian stock indexes were mixed and are decreasing at the opening on Wednesday. Traders negatively weigh the economic growth risks associated with the Omicron virus outbreak and the latest regulatory tightening in China. In Asia, there are relatively few cases of infection with a strain Оmicron compared to European countries and the United States. Despite this fact, investors are growing concerned that the rise in the disease will lead to lockdowns and new problems in supply chains. But the Australian stock market, which opened on Wednesday for the first time since the Christmas holiday, saw strong gains. The Australian ASX 200 Index (AU200) jumped by 1.21% from the open.

The data from the American Petroleum Institute showed that US crude oil inventories fell by 3.1 million barrels last week, which was in line with analysts’ expectations. The oil keeps its upward trend as Omicron risks to demand decrease while inventories are also declining, causing a weak deficit. The US Department of Energy will release its report on crude oil inventories today.

The number of tankers carrying gas from the US to Europe has increased by a third. This suggests that Europe does not have enough reserves to pass the heating season.

Main market quotes:

S&P 500 (F) (US500) 4,786.35 −4.84 (−0.10%)

Dow Jones (US30) 36,398.21 +95.83 (+0.26%)

DAX (DE40) 15,963.70 +128.45 (+0.81%)

FTSE 100 (UK100) 7,372.10 −1.24 (−0.02%)

USD Index 96.16 +0.07 (+0.07%)

Important events for today:
  • – US Pending Home Sales (m/m) at 17:00 (GMT+2);
  • – US Crude Oil Inventories (w/w) at 17:30 (GMT+2).

by JustForex


This article reflects a personal opinion and should not be interpreted as an investment advice, and/or offer, and/or a persistent request for carrying out financial transactions, and/or a guarantee, and/or a forecast of future events.

EURUSD is “stuck” hesitating. Overview for 28.12.2021

Article By RoboForex.com

EURUSD is barely moving on Tuesday; market volatility moved to the other assets.

The major currency pair is looking neutral on Tuesday. The current quote for the instrument is 1.1324.

There is an opinion that the current situation with low liquidity and volatility may continue throughout the week. Investors are calmly waiting for New Year and don’t seem to respond to any news or event until January. The economic calendar has been almost empty for both yesterday and today.

Nevertheless, there will be some interesting numbers to pay attention to this week. For example, on Wednesday the US will report on the Goods Trade Balance and the Wholesale Inventories for November, on Thursday – the weekly report on the Unemployment Claims. On the same day, the European Central Bank is scheduled to release its Monetary Policy Meeting Accounts. However, none of these events is likely to shake the market.

Both bulls and bears won’t make any serious decisions until the market offers something really important, such as the latest statistics on the US labour market to be published early in January.

Article By RoboForex.com

Attention!
Forecasts presented in this section only reflect the author’s private opinion and should not be considered as guidance for trading. RoboForex LP bears no responsibility for trading results based on trading recommendations described in these analytical reviews.

Japanese Candlesticks Analysis 28.12.2021 (EURUSD, USDJPY, EURGBP)

Article By RoboForex.com

EURUSD, “Euro vs US Dollar”

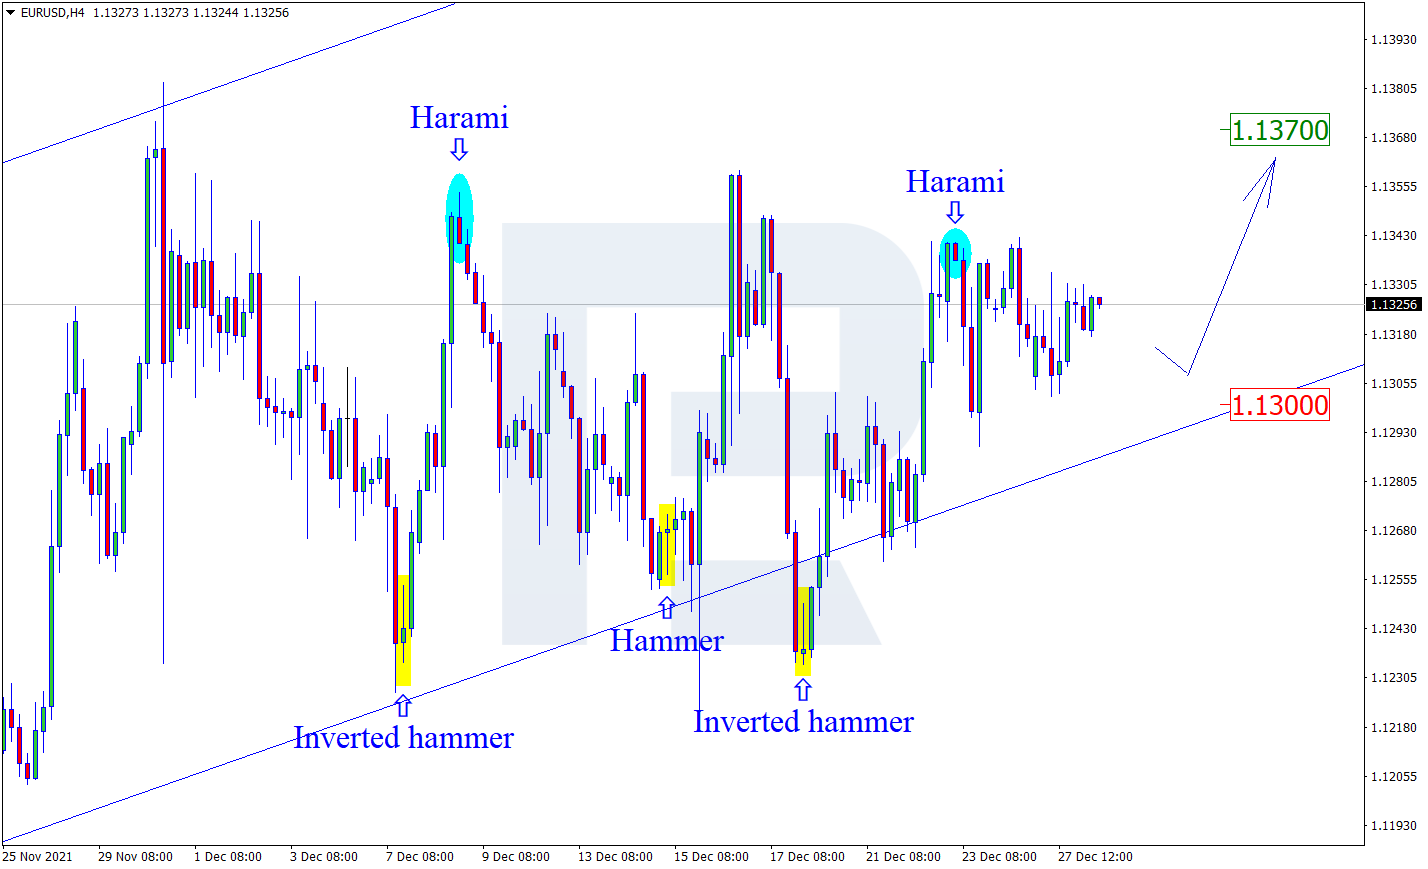
As we can see in the H4 chart, the asset has formed a Harami reversal pattern close to the resistance level. At the moment, EURUSD may reverse and form a new descending impulse. In this case, the downside correctional target may be at 1.1300. However, an alternative scenario implies that the price may grow to reach 1.1370 and continue its ascending tendency without testing the support area.

EURUSD
Risk Warning: the result of previous trading operations do not guarantee the same results in the future

USDJPY, “US Dollar vs Japanese Yen”

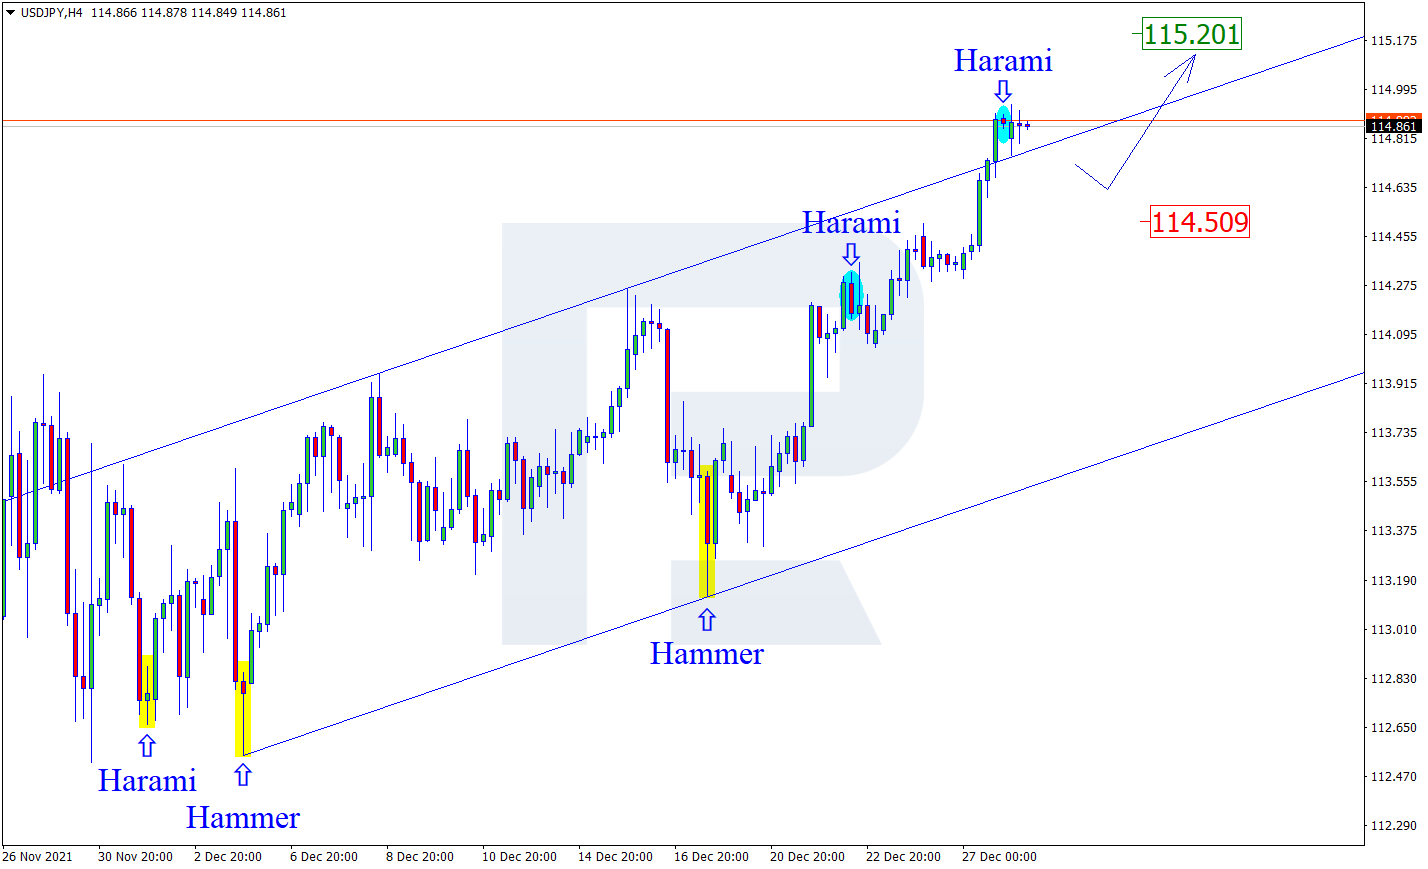
As we can see in the H4 chart, USDJPY has formed several reversal patterns, for example, Harami, not far from the resistance area. At the moment, USDJPY may reverse and start a new correctional wave to the downside towards the support level. In this case, the downside target may be at 114.50. At the same time, an opposite scenario implies that the price may continue growing to reach 115.20 without correcting towards the support level.

USDJPY
Risk Warning: the result of previous trading operations do not guarantee the same results in the future

EURGBP, “Euro vs Great Britain Pound”

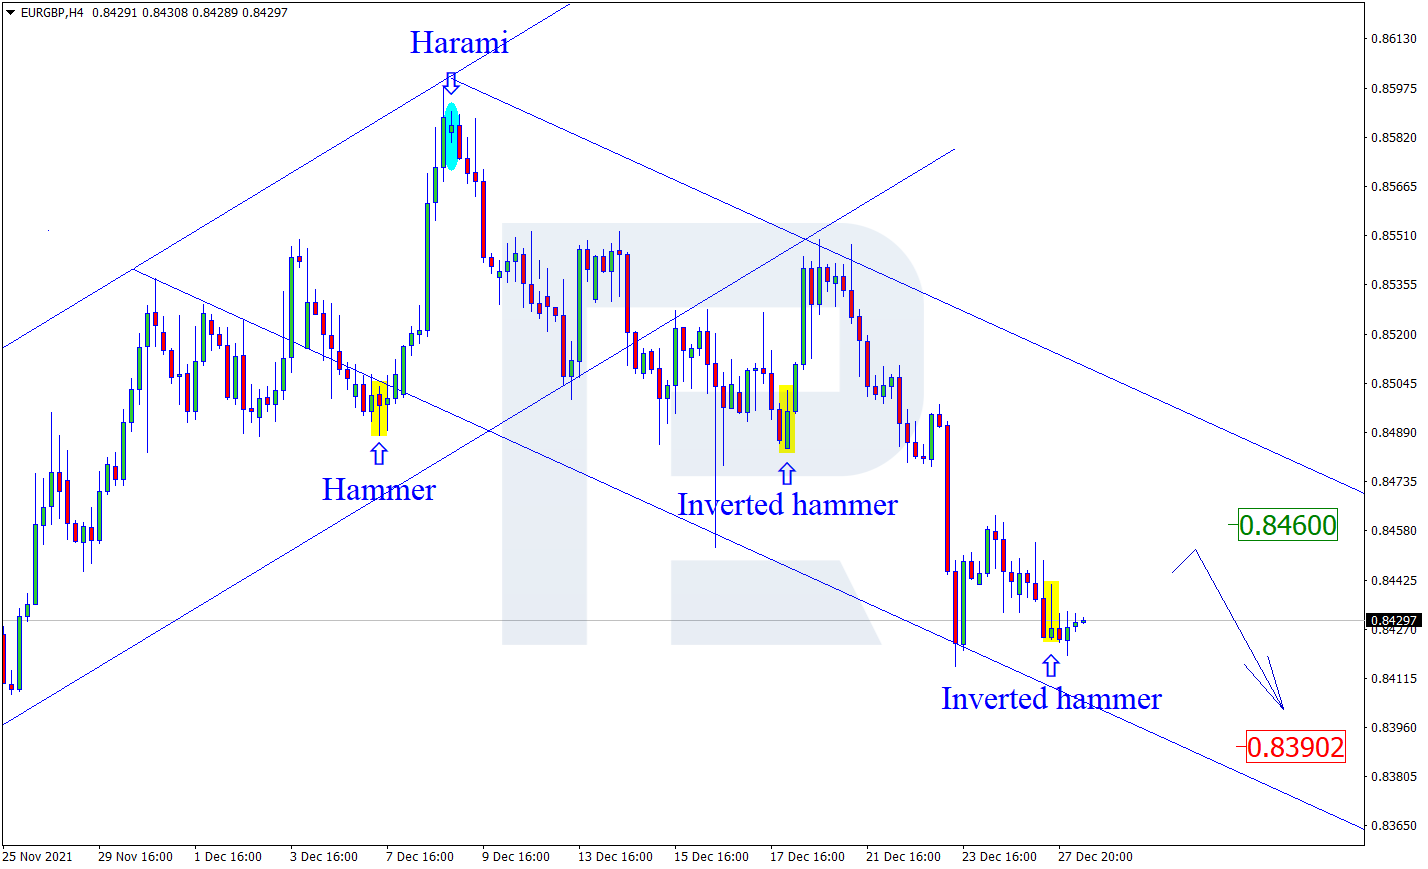
As we can see in the H4 chart, after forming an Inverted Hammer reversal pattern near the support level, EURGBP is reversing and may start another growth towards the next resistance area. In this case, the upside target may be at 0.8460. Later, the market may test the area, rebound from it, and resume the descending tendency. Still, there might be an alternative scenario, according to which the asset may fall to reach 0.8390 without any corrections.

EURGBP

Article By RoboForex.com

Attention!
Forecasts presented in this section only reflect the author’s private opinion and should not be considered as guidance for trading. RoboForex LP bears no responsibility for trading results based on trading recommendations described in these analytical reviews.

The Analytical Overview of the Main Currency Pairs on 2021.12.28

by JustForex

The EUR/USD currency pair

Technical indicators of the currency pair:
  • Prev Open: 1.1319
  • Prev Close: 1.1326
  • % chg. over the last day: +0.06%

Many analytical houses are beginning to revise their growth forecasts downward due to the spread of the Omicron. On the one hand, the Omicron strain is less dangerous. On the other hand, it is transmitted much faster, and many European countries are forced to impose full or partial lockdowns to curb the new wave of disease in the run-up to the New Year holidays. Therefore, investors should not expect strong Q4 2021 reports.

Trading recommendations
  • Support levels: 1.1293, 1.1230, 1.1168
  • Resistance levels: 1.1342, 1.1360, 1.1436, 1.1535, 1.1613, 1.1667, 1.1717

From a technical point of view, the EUR/USD on the hour time frame is still bearish. Price is traded in the corridor. The MACD indicator has become inactive; the volatility is below average due to the holidays. It is better to consider sell deals after a false breakout of the 1.1342 resistance level. Buy trades can be considered on the lower time frames from the support level of 1.1293, but only with additional confirmation.

Alternative scenario: if the price breaks out through the 1.1360 resistance level and fixes above, the mid-term uptrend will likely resume.

EUR/USD
There is no news feed for today.

The GBP/USD currency pair

Technical indicators of the currency pair:
  • Prev Open: 1.3392
  • Prev Close: 1.3442
  • % chg. over the last day: +0.37%

Today is a bank holiday in the UK, so volatility on the GBP/USD currency pair is expected to be low. In the medium term, an increase in the Fed balance sheet and lower concerns about the Omicron strain will temporarily weaken the dollar index and a rise in the British currency. The British currency is also positively influenced by the growth of oil prices. Analysts believe that the British pound will be stable until the end of the QE program from the Fed, i.e., until March 2022.

Trading recommendations
  • Support levels: 1.3362, 1.3301, 1.3277, 1.3220
  • Resistance levels: 1.3434, 1.3507, 1.3575, 1.3685

On the hourly time frame, the trend on GBP/USD is still bullish. The MACD indicator is showing a divergence. Under such market conditions, traders should consider buy positions from the 1.3362 support level but only with additional confirmation in the form of a buyers’ initiative. Sell trades can be considered from the resistance level of 1.3434, but only with additional confirmation in the form of a false breakout.

Alternative scenario: if the price breaks down through the 1.3277 support level and consolidates below, the bearish scenario will likely resume.

GBP/USD
There is no news feed for today.

The USD/JPY currency pair

Technical indicators of the currency pair:
  • Prev Open: 114.36
  • Prev Close: 114.88
  • % chg. over the last day: +0.45%

Japan’s unemployment rate in November increased for the first time in six months to 2.8% from 2.7% in October. Analysts had forecast no change. Industrial production in Japan increased by 7.2% in November. Analysts had expected a less strong amount of 4.8%. Industrial output peaked last month on a rebound in activity in Japan’s auto sector due to easing problems in component supply chains. Auto production jumped by 43.1% in November.

Trading recommendations
  • Support levels: 114.50, 114.30, 113.95, 113.68, 113.30, 112.62, 112.30
  • Resistance levels: 115.15, 115.50

The global trend on the USD/JPY currency pair is bullish. The MACD indicator is signaling a divergence at several timeframes, which means that a slight correction should be expected. Buy positions should be considered from the 114.50 support level, but with additional confirmation in the form of a buyers’ initiative. There is no optimal entry point for sell positions now.

Alternative scenario: if the price fixes below 113.95, the uptrend will likely be broken.

USD/JPY
News feed for 2021.12.28:
  • – Japan Unemployment Rate (m/m) at 01:30 (GMT+2);
  • – Japan Industrial Production (m/m) at 01:50 (GMT+2).

The USD/CAD currency pair

Technical indicators of the currency pair:
  • Prev Open: 1.2807
  • Prev Close: 1.2786
  • % chg. over the last day: -0.16%

The Canadian dollar is a commodity currency, so it correlates strongly with oil prices and the dollar index. Yesterday, oil prices increased, while the dollar index was stable. The Canadian dollar is slowly strengthening. Today is a bank holiday in Canada, so volatility on the USD/CAD currency pair is expected to be low.

Trading recommendations
  • Support levels: 1.2783, 1.2721, 1.2677, 1.2638
  • Resistance levels: 1.2903, 1.2951

From a technical point of view, the USD/CAD currency pair trend is bullish. But the price has tested the priority change level for the third time; the sellers are trying to intercept the initiative. The MACD indicator is not active, but there is a divergence to buy. Under such market conditions, it is better to look for buy deals from the priority change level of 1.2783, but after an additional confirmation in the form of a false breakdown or a new initiative of buyers. Sell deals should be considered from the resistance level of 1.2903 or after breakdown and fixation below the priority change level.

Alternative scenario: if the price breaks down through the 1.2783 support level and fixes below, the downtrend will likely resume.

USD/CAD
There is no news feed for today.

by JustForex


This article reflects a personal opinion and should not be interpreted as an investment advice, and/or offer, and/or a persistent request for carrying out financial transactions, and/or a guarantee, and/or a forecast of future events.

COT Currency Speculators boost US Dollar Index bullish bets after 2 down weeks

By InvestMacro | COT | Data Tables | COT Leaders | Downloads | COT Newsletter

Here are the latest charts and statistics for the Commitment of Traders (COT) data published by the Commodities Futures Trading Commission (CFTC). The latest release was delayed by the CFTC due to the Christmas holiday.

The latest COT data is updated through Tuesday December 21st 2021 and shows a quick view of how large traders (for-profit speculators and commercial entities) were positioned in the futures markets. All currency positions are in direct relation to the US dollar where, for example, a bet for the euro is a bet that the euro will rise versus the dollar while a bet against the euro will be a bet that the euro will decline versus the dollar.

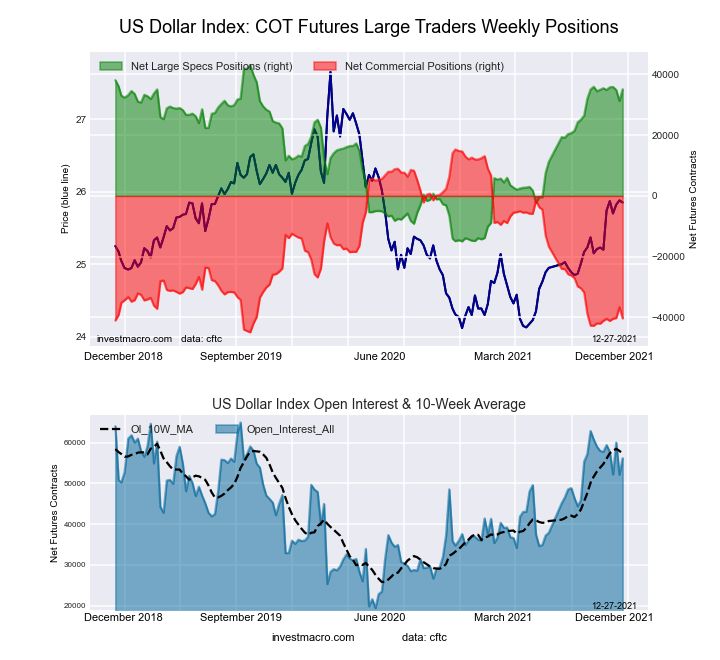
Highlighting the COT currency data was the bounce back in the US Dollar Index bullish positions after two straight down weeks. The speculative bets for the dollar index rose by the largest one-week total of the past eleven weeks and brought the overall bullish position back over the +35,000 level. Overall, the dollar index positioning has now been continually bullish since July 6th, a span of twenty-five straight weeks. The last twelve weeks have seen positions above +30,000 net contracts which is the first time that has happened since early 2019.

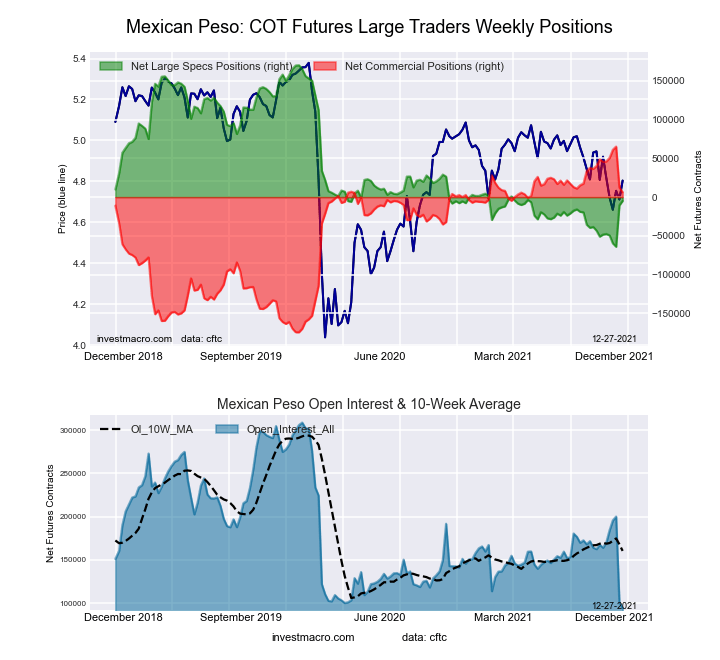
Joining the US Dollar Index (3,874 contracts) with positive changes last week were the yen (1,237 contracts), Mexican peso (5,881 contracts), Euro (1,717 contracts) and the Canadian dollar (3,251 contracts).

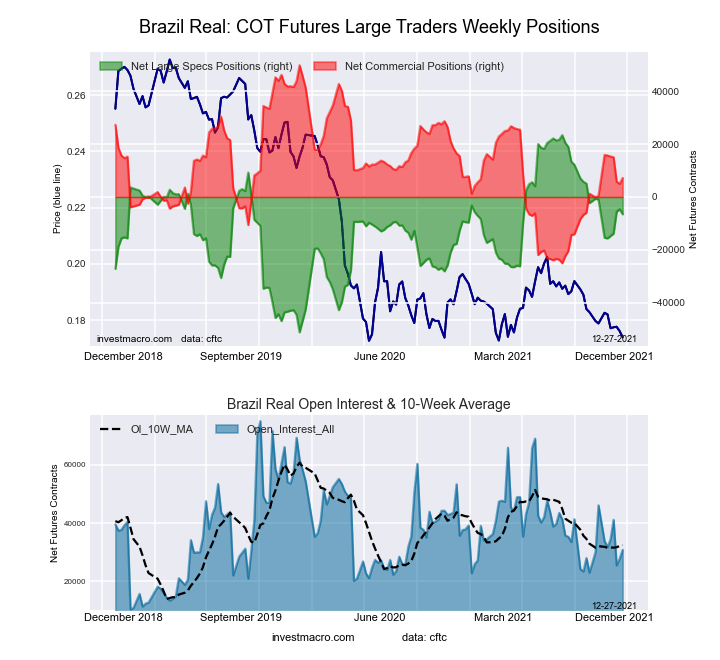
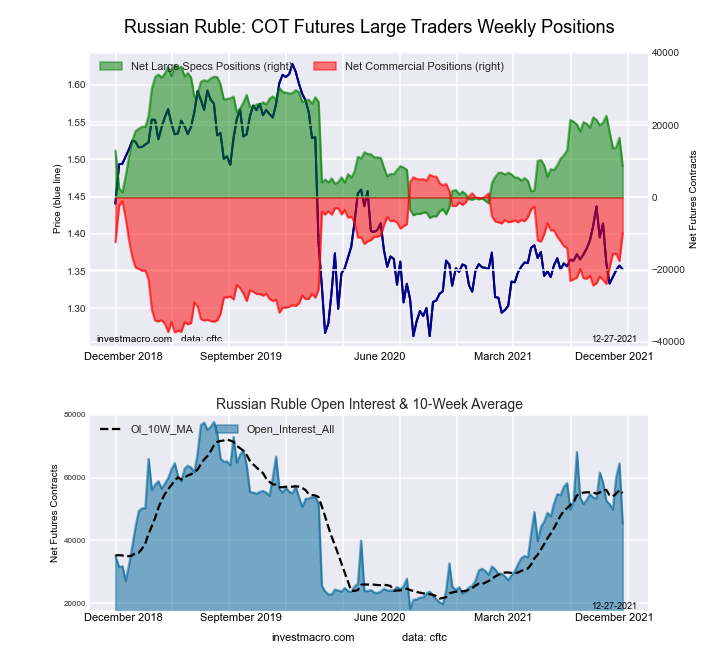
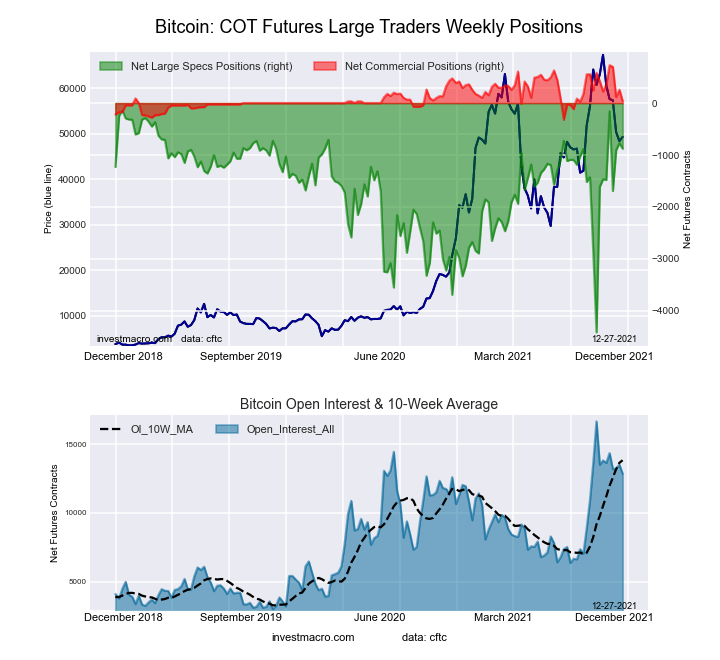
The currencies with declining bets last week were the Russian ruble (-7,903 contracts), Bitcoin (-106 contracts), Brazil real (-1,930 contracts), Swiss franc (-891 contracts), British pound sterling (-6,938 contracts), New Zealand dollar (-275 contracts) and the Australian dollar (-1,451 contracts).


Data Snapshot of Forex Market Traders | Columns Legend
Dec-21-2021OIOI-IndexSpec-NetSpec-IndexCom-NetCOM-IndexSmalls-NetSmalls-Index
USD Index56,1628135,11586-40,33185,21674
EUR672,23973-10,16232-15,6267125,78817
GBP207,74744-57,6863271,12472-13,43828
JPY183,74344-52,2863571,15972-18,8739
CHF40,92015-9,2275415,94549-6,71844
CAD145,56227-9,877477,440562,43735
AUD191,30976-80,354998,03392-17,6799
NZD41,35427-6,136618,86644-2,73021
MXN94,4690-4,792256,38275-1,59036
RUB45,372468,62134-9,877631,25669
BRL30,81128-6,547607,22843-68159
Bitcoin12,85272-8788339083932


US Dollar Index Futures:

US Dollar Index Forex Futures COT ChartThe US Dollar Index large speculator standing this week totaled a net position of 35,115 contracts in the data reported through Tuesday. This was a weekly lift of 3,874 contracts from the previous week which had a total of 31,241 net contracts.

This week’s current strength score (the trader positioning range over the past three years, measured from 0 to 100) shows the speculators are currently Bullish-Extreme with a score of 86.4 percent. The commercials are Bearish-Extreme with a score of 7.6 percent and the small traders (not shown in chart) are Bullish with a score of 73.6 percent.

US DOLLAR INDEX StatisticsSPECULATORSCOMMERCIALSSMALL TRADERS
– Percent of Open Interest Longs:82.33.512.3
– Percent of Open Interest Shorts:19.875.33.0
– Net Position:35,115-40,3315,216
– Gross Longs:46,2221,9416,886
– Gross Shorts:11,10742,2721,670
– Long to Short Ratio:4.2 to 10.0 to 14.1 to 1
NET POSITION TREND:
– Strength Index Score (3 Year Range Pct):86.47.673.6
– Strength Index Reading (3 Year Range):Bullish-ExtremeBearish-ExtremeBullish
NET POSITION MOVEMENT INDEX:
– 6-Week Change in Strength Index:-0.61.3-4.7


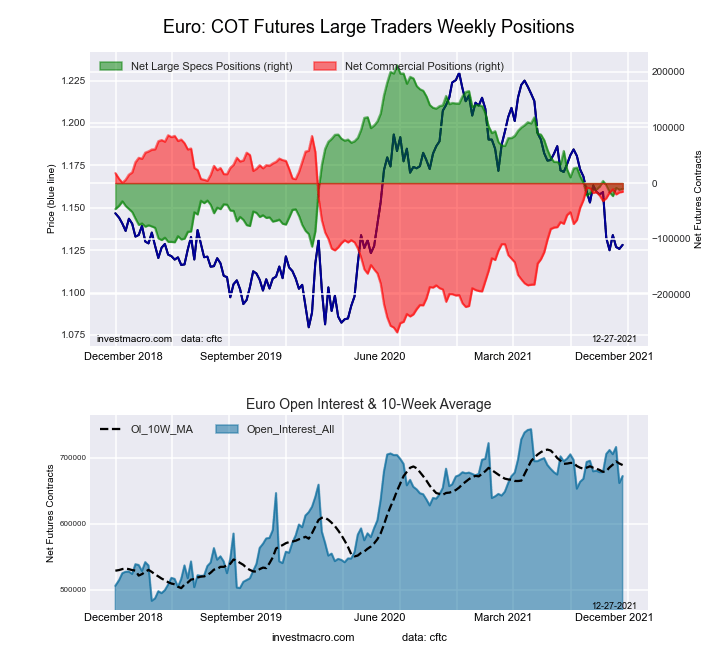
Euro Currency Futures:

Euro Currency Futures COT ChartThe Euro Currency large speculator standing this week totaled a net position of -10,162 contracts in the data reported through Tuesday. This was a weekly rise of 1,717 contracts from the previous week which had a total of -11,879 net contracts.

This week’s current strength score (the trader positioning range over the past three years, measured from 0 to 100) shows the speculators are currently Bearish with a score of 31.9 percent. The commercials are Bullish with a score of 71.3 percent and the small traders (not shown in chart) are Bearish-Extreme with a score of 17.1 percent.

EURO Currency StatisticsSPECULATORSCOMMERCIALSSMALL TRADERS
– Percent of Open Interest Longs:29.256.811.8
– Percent of Open Interest Shorts:30.859.17.9
– Net Position:-10,162-15,62625,788
– Gross Longs:196,595381,67079,101
– Gross Shorts:206,757397,29653,313
– Long to Short Ratio:1.0 to 11.0 to 11.5 to 1
NET POSITION TREND:
– Strength Index Score (3 Year Range Pct):31.971.317.1
– Strength Index Reading (3 Year Range):BearishBullishBearish-Extreme
NET POSITION MOVEMENT INDEX:
– 6-Week Change in Strength Index:-4.34.6-4.1


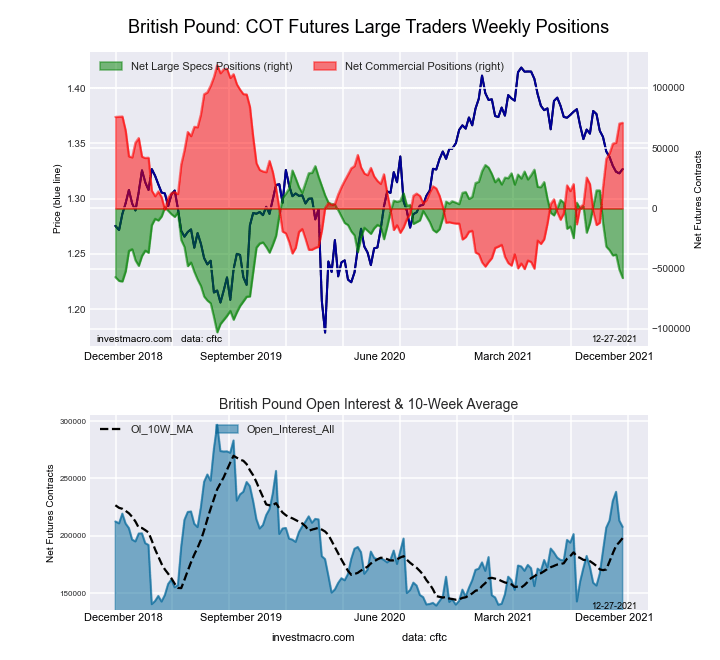
British Pound Sterling Futures:

British Pound Sterling Futures COT ChartThe British Pound Sterling large speculator standing this week totaled a net position of -57,686 contracts in the data reported through Tuesday. This was a weekly reduction of -6,938 contracts from the previous week which had a total of -50,748 net contracts.

This week’s current strength score (the trader positioning range over the past three years, measured from 0 to 100) shows the speculators are currently Bearish with a score of 32.4 percent. The commercials are Bullish with a score of 71.7 percent and the small traders (not shown in chart) are Bearish with a score of 27.8 percent.

BRITISH POUND StatisticsSPECULATORSCOMMERCIALSSMALL TRADERS
– Percent of Open Interest Longs:10.078.810.2
– Percent of Open Interest Shorts:37.844.516.7
– Net Position:-57,68671,124-13,438
– Gross Longs:20,824163,61921,240
– Gross Shorts:78,51092,49534,678
– Long to Short Ratio:0.3 to 11.8 to 10.6 to 1
NET POSITION TREND:
– Strength Index Score (3 Year Range Pct):32.471.727.8
– Strength Index Reading (3 Year Range):BearishBullishBearish
NET POSITION MOVEMENT INDEX:
– 6-Week Change in Strength Index:-32.931.7-16.5


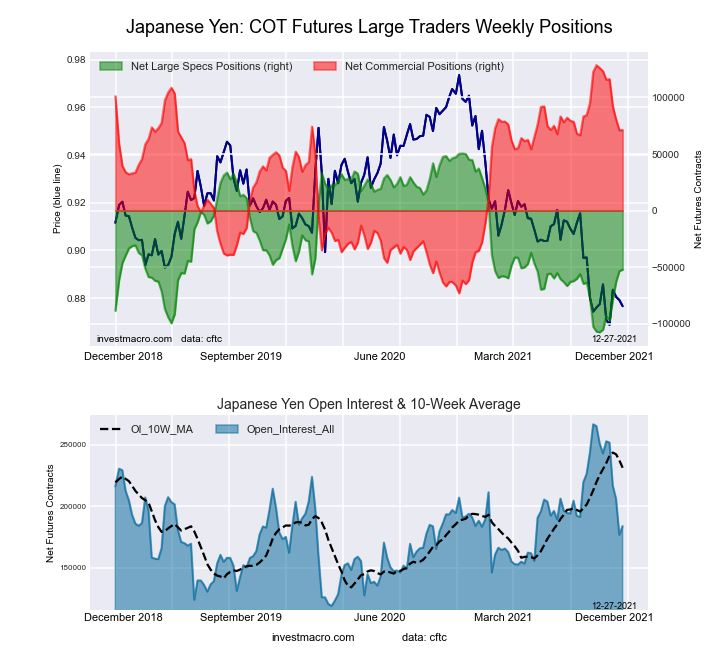
Japanese Yen Futures:

Japanese Yen Forex Futures COT ChartThe Japanese Yen large speculator standing this week totaled a net position of -52,286 contracts in the data reported through Tuesday. This was a weekly increase of 1,237 contracts from the previous week which had a total of -53,523 net contracts.

This week’s current strength score (the trader positioning range over the past three years, measured from 0 to 100) shows the speculators are currently Bearish with a score of 35.0 percent. The commercials are Bullish with a score of 71.5 percent and the small traders (not shown in chart) are Bearish-Extreme with a score of 9.0 percent.

JAPANESE YEN StatisticsSPECULATORSCOMMERCIALSSMALL TRADERS
– Percent of Open Interest Longs:12.177.49.2
– Percent of Open Interest Shorts:40.538.619.5
– Net Position:-52,28671,159-18,873
– Gross Longs:22,191142,16116,916
– Gross Shorts:74,47771,00235,789
– Long to Short Ratio:0.3 to 12.0 to 10.5 to 1
NET POSITION TREND:
– Strength Index Score (3 Year Range Pct):35.071.59.0
– Strength Index Reading (3 Year Range):BearishBullishBearish-Extreme
NET POSITION MOVEMENT INDEX:
– 6-Week Change in Strength Index:33.6-25.8-2.2


Swiss Franc Futures:

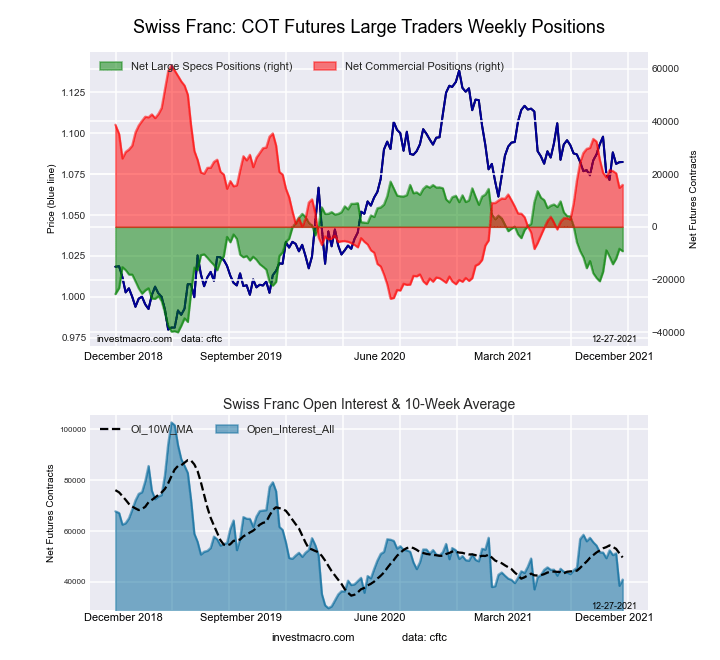
Swiss Franc Forex Futures COT ChartThe Swiss Franc large speculator standing this week totaled a net position of -9,227 contracts in the data reported through Tuesday. This was a weekly decrease of -891 contracts from the previous week which had a total of -8,336 net contracts.

This week’s current strength score (the trader positioning range over the past three years, measured from 0 to 100) shows the speculators are currently Bullish with a score of 53.8 percent. The commercials are Bearish with a score of 48.8 percent and the small traders (not shown in chart) are Bearish with a score of 43.6 percent.

SWISS FRANC StatisticsSPECULATORSCOMMERCIALSSMALL TRADERS
– Percent of Open Interest Longs:6.066.827.0
– Percent of Open Interest Shorts:28.627.943.4
– Net Position:-9,22715,945-6,718
– Gross Longs:2,46027,34411,046
– Gross Shorts:11,68711,39917,764
– Long to Short Ratio:0.2 to 12.4 to 10.6 to 1
NET POSITION TREND:
– Strength Index Score (3 Year Range Pct):53.848.843.6
– Strength Index Reading (3 Year Range):BullishBearishBearish
NET POSITION MOVEMENT INDEX:
– 6-Week Change in Strength Index:13.7-5.2-9.5


Canadian Dollar Futures:

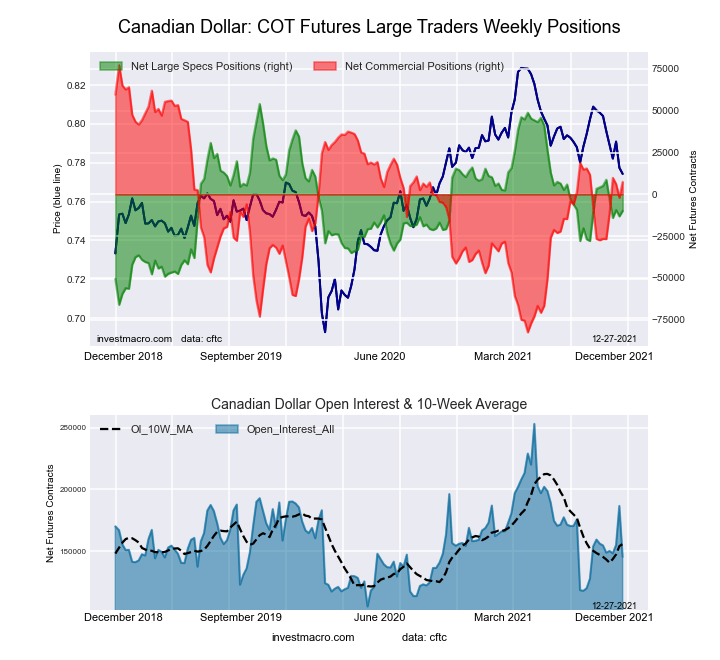
Canadian Dollar Forex Futures COT ChartThe Canadian Dollar large speculator standing this week totaled a net position of -9,877 contracts in the data reported through Tuesday. This was a weekly advance of 3,251 contracts from the previous week which had a total of -13,128 net contracts.

This week’s current strength score (the trader positioning range over the past three years, measured from 0 to 100) shows the speculators are currently Bearish with a score of 46.8 percent. The commercials are Bullish with a score of 56.3 percent and the small traders (not shown in chart) are Bearish with a score of 34.6 percent.

CANADIAN DOLLAR StatisticsSPECULATORSCOMMERCIALSSMALL TRADERS
– Percent of Open Interest Longs:31.645.720.2
– Percent of Open Interest Shorts:38.340.618.6
– Net Position:-9,8777,4402,437
– Gross Longs:45,92566,48329,450
– Gross Shorts:55,80259,04327,013
– Long to Short Ratio:0.8 to 11.1 to 11.1 to 1
NET POSITION TREND:
– Strength Index Score (3 Year Range Pct):46.856.334.6
– Strength Index Reading (3 Year Range):BearishBullishBearish
NET POSITION MOVEMENT INDEX:
– 6-Week Change in Strength Index:-12.521.3-38.0


Australian Dollar Futures:

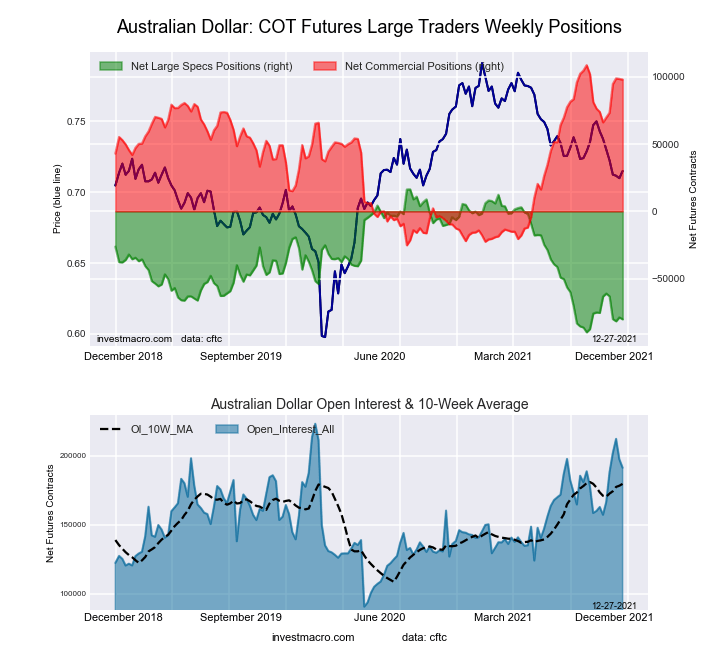
Australian Dollar Forex Futures COT ChartThe Australian Dollar large speculator standing this week totaled a net position of -80,354 contracts in the data reported through Tuesday. This was a weekly lowering of -1,451 contracts from the previous week which had a total of -78,903 net contracts.

This week’s current strength score (the trader positioning range over the past three years, measured from 0 to 100) shows the speculators are currently Bearish-Extreme with a score of 9.1 percent. The commercials are Bullish-Extreme with a score of 92.0 percent and the small traders (not shown in chart) are Bearish-Extreme with a score of 9.3 percent.

AUSTRALIAN DOLLAR StatisticsSPECULATORSCOMMERCIALSSMALL TRADERS
– Percent of Open Interest Longs:12.077.88.4
– Percent of Open Interest Shorts:54.026.617.6
– Net Position:-80,35498,033-17,679
– Gross Longs:22,958148,85916,070
– Gross Shorts:103,31250,82633,749
– Long to Short Ratio:0.2 to 12.9 to 10.5 to 1
NET POSITION TREND:
– Strength Index Score (3 Year Range Pct):9.192.09.3
– Strength Index Reading (3 Year Range):Bearish-ExtremeBullish-ExtremeBearish-Extreme
NET POSITION MOVEMENT INDEX:
– 6-Week Change in Strength Index:-15.923.8-36.4


New Zealand Dollar Futures:

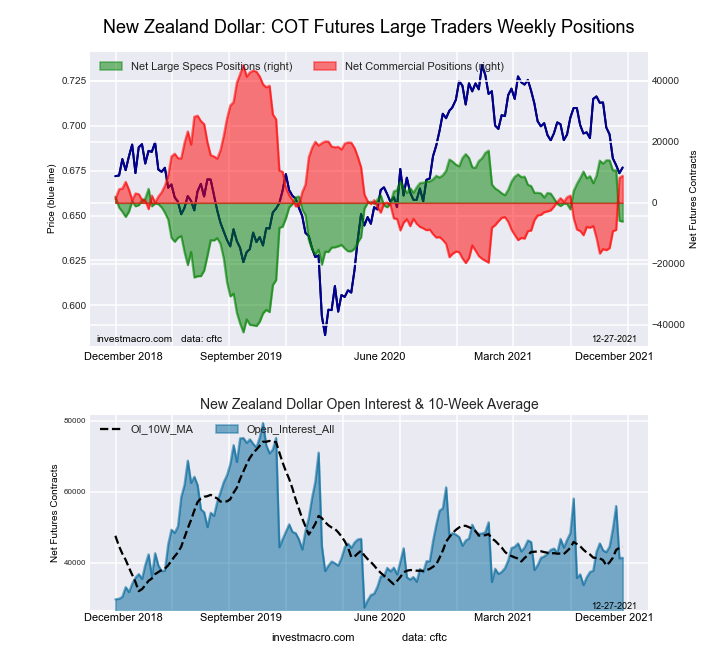
New Zealand Dollar Forex Futures COT ChartThe New Zealand Dollar large speculator standing this week totaled a net position of -6,136 contracts in the data reported through Tuesday. This was a weekly lowering of -275 contracts from the previous week which had a total of -5,861 net contracts.

This week’s current strength score (the trader positioning range over the past three years, measured from 0 to 100) shows the speculators are currently Bullish with a score of 61.0 percent. The commercials are Bearish with a score of 44.1 percent and the small traders (not shown in chart) are Bearish with a score of 20.6 percent.

NEW ZEALAND DOLLAR StatisticsSPECULATORSCOMMERCIALSSMALL TRADERS
– Percent of Open Interest Longs:26.764.96.8
– Percent of Open Interest Shorts:41.643.413.4
– Net Position:-6,1368,866-2,730
– Gross Longs:11,05026,8192,809
– Gross Shorts:17,18617,9535,539
– Long to Short Ratio:0.6 to 11.5 to 10.5 to 1
NET POSITION TREND:
– Strength Index Score (3 Year Range Pct):61.044.120.6
– Strength Index Reading (3 Year Range):BullishBearishBearish
NET POSITION MOVEMENT INDEX:
– 6-Week Change in Strength Index:-31.937.0-57.1


Mexican Peso Futures:

Mexican Peso Futures COT ChartThe Mexican Peso large speculator standing this week totaled a net position of -4,792 contracts in the data reported through Tuesday. This was a weekly rise of 5,881 contracts from the previous week which had a total of -10,673 net contracts.

This week’s current strength score (the trader positioning range over the past three years, measured from 0 to 100) shows the speculators are currently Bearish with a score of 25.3 percent. The commercials are Bullish with a score of 75.5 percent and the small traders (not shown in chart) are Bearish with a score of 36.3 percent.

MEXICAN PESO StatisticsSPECULATORSCOMMERCIALSSMALL TRADERS
– Percent of Open Interest Longs:31.863.83.8
– Percent of Open Interest Shorts:36.957.15.5
– Net Position:-4,7926,382-1,590
– Gross Longs:30,02160,3003,563
– Gross Shorts:34,81353,9185,153
– Long to Short Ratio:0.9 to 11.1 to 10.7 to 1
NET POSITION TREND:
– Strength Index Score (3 Year Range Pct):25.375.536.3
– Strength Index Reading (3 Year Range):BearishBullishBearish
NET POSITION MOVEMENT INDEX:
– 6-Week Change in Strength Index:18.6-16.4-18.3


Brazilian Real Futures:

Brazil Real Futures COT ChartThe Brazilian Real large speculator standing this week totaled a net position of -6,547 contracts in the data reported through Tuesday. This was a weekly decrease of -1,930 contracts from the previous week which had a total of -4,617 net contracts.

This week’s current strength score (the trader positioning range over the past three years, measured from 0 to 100) shows the speculators are currently Bullish with a score of 59.9 percent. The commercials are Bearish with a score of 43.1 percent and the small traders (not shown in chart) are Bullish with a score of 58.6 percent.

BRAZIL REAL StatisticsSPECULATORSCOMMERCIALSSMALL TRADERS
– Percent of Open Interest Longs:33.259.17.3
– Percent of Open Interest Shorts:54.435.69.5
– Net Position:-6,5477,228-681
– Gross Longs:10,21718,1962,241
– Gross Shorts:16,76410,9682,922
– Long to Short Ratio:0.6 to 11.7 to 10.8 to 1
NET POSITION TREND:
– Strength Index Score (3 Year Range Pct):59.943.158.6
– Strength Index Reading (3 Year Range):BullishBearishBullish
NET POSITION MOVEMENT INDEX:
– 6-Week Change in Strength Index:11.9-11.6-2.3


Russian Ruble Futures:

Russian Ruble Futures COT ChartThe Russian Ruble large speculator standing this week totaled a net position of 8,621 contracts in the data reported through Tuesday. This was a weekly decrease of -7,903 contracts from the previous week which had a total of 16,524 net contracts.

This week’s current strength score (the trader positioning range over the past three years, measured from 0 to 100) shows the speculators are currently Bearish with a score of 33.8 percent. The commercials are Bullish with a score of 62.9 percent and the small traders (not shown in chart) are Bullish with a score of 68.7 percent.

RUSSIAN RUBLE StatisticsSPECULATORSCOMMERCIALSSMALL TRADERS
– Percent of Open Interest Longs:41.753.35.0
– Percent of Open Interest Shorts:22.775.12.2
– Net Position:8,621-9,8771,256
– Gross Longs:18,94224,1772,253
– Gross Shorts:10,32134,054997
– Long to Short Ratio:1.8 to 10.7 to 12.3 to 1
NET POSITION TREND:
– Strength Index Score (3 Year Range Pct):33.862.968.7
– Strength Index Reading (3 Year Range):BearishBullishBullish
NET POSITION MOVEMENT INDEX:
– 6-Week Change in Strength Index:-28.629.6-22.7


Bitcoin Futures:

Bitcoin Crypto Futures COT ChartThe Bitcoin large speculator standing this week totaled a net position of -878 contracts in the data reported through Tuesday. This was a weekly lowering of -106 contracts from the previous week which had a total of -772 net contracts.

This week’s current strength score (the trader positioning range over the past three years, measured from 0 to 100) shows the speculators are currently Bullish-Extreme with a score of 82.8 percent. The commercials are Bearish with a score of 34.3 percent and the small traders (not shown in chart) are Bearish with a score of 32.0 percent.

BITCOIN StatisticsSPECULATORSCOMMERCIALSSMALL TRADERS
– Percent of Open Interest Longs:66.93.213.7
– Percent of Open Interest Shorts:73.72.97.1
– Net Position:-87839839
– Gross Longs:8,5944081,755
– Gross Shorts:9,472369916
– Long to Short Ratio:0.9 to 11.1 to 11.9 to 1
NET POSITION TREND:
– Strength Index Score (3 Year Range Pct):82.834.332.0
– Strength Index Reading (3 Year Range):Bullish-ExtremeBearishBearish
NET POSITION MOVEMENT INDEX:
– 6-Week Change in Strength Index:13.8-17.5-9.2


Article By InvestMacroReceive our weekly COT Reports by Email

*COT Report: The COT data, released weekly to the public each Friday, is updated through the most recent Tuesday (data is 3 days old) and shows a quick view of how large speculators or non-commercials (for-profit traders) were positioned in the futures markets.

The CFTC categorizes trader positions according to commercial hedgers (traders who use futures contracts for hedging as part of the business), non-commercials (large traders who speculate to realize trading profits) and nonreportable traders (usually small traders/speculators) as well as their open interest (contracts open in the market at time of reporting).See CFTC criteria here.


Ichimoku Cloud Analysis 27.12.2021 (NZDUSD, BRENT, USDCHF)

Article By RoboForex.com

NZDUSD, “New Zealand Dollar vs US Dollar”

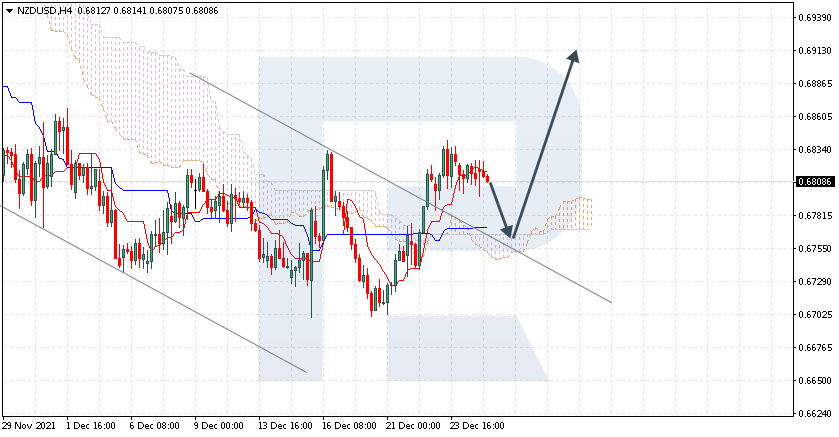
NZDUSD is trading at 0.6808; the instrument is moving above Ichimoku Cloud, thus indicating an ascending tendency. The markets could indicate that the price may test the cloud’s upside border at 0.6765 and then resume moving upwards to reach 0.6915. Another signal in favour of a further uptrend will be a rebound from the descending channel’s upside border. However, the bullish scenario may no longer be valid if the price breaks the cloud’s downside border and fixes below 0.6720. In this case, the pair may continue falling towards 0.6635. To confirm further growth, the asset must break the resistance level and fix above 0.6845; so far, bulls haven’t been able to break this area.

NZDUSD
Risk Warning: the result of previous trading operations do not guarantee the same results in the future

BRENT

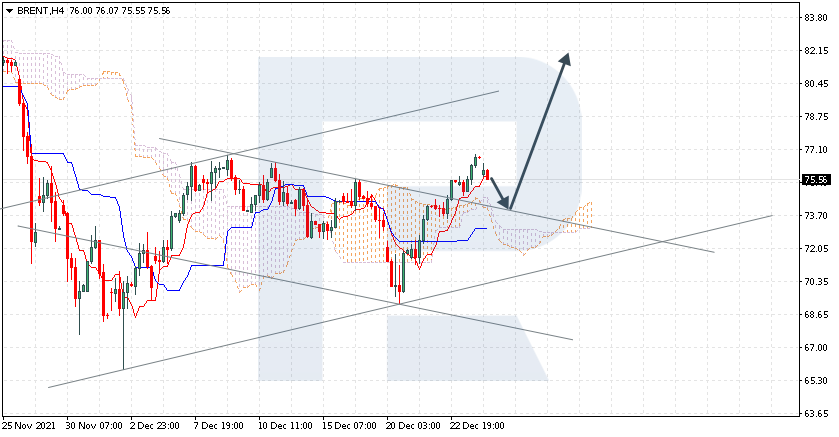
Brent is trading at 75.56; the instrument is moving above Ichimoku Cloud, thus indicating an ascending tendency. The markets could indicate that the price may test the cloud’s upside border at 73.70 and then resume moving upwards to reach 82.15. Another signal in favour of a further uptrend will be a rebound from the descending channel’s upside border. However, the bullish scenario may no longer be valid if the price breaks the cloud’s downside border and fixes below 70.35. In this case, the pair may continue falling towards 67.65.

BRENT
Risk Warning: the result of previous trading operations do not guarantee the same results in the future

USDCHF, “US Dollar vs Swiss Franc”

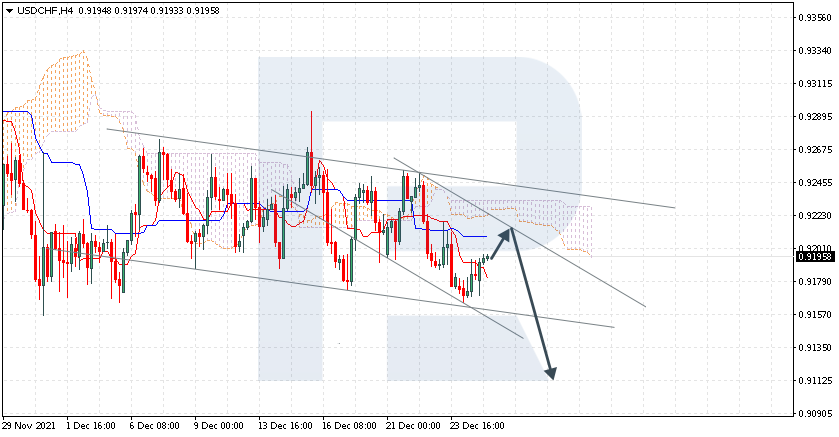
USDCHF is trading at 0.9195; the instrument is moving below Ichimoku Cloud, thus indicating a descending tendency. The markets could indicate that the price may test Tenkan-Sen and Kijun-Sen at 0.9205 and then resume moving downwards to reach 0.9115. Another signal in favour of a further downtrend will be a rebound from the descending channel’s upside border. However, the bearish scenario may no longer be valid if the price breaks the cloud’s upside border and fixes above 0.9250. In this case, the pair may continue growing towards 0.9340. To confirm further decline, the asset must break the descending channel’s downside border and fix below 0.9140; in this case, the asset may continue falling and cover the distance equal to the descending channel’s width.

USDCHF

Article By RoboForex.com

Attention!
Forecasts presented in this section only reflect the author’s private opinion and should not be considered as guidance for trading. RoboForex LP bears no responsibility for trading results based on trading recommendations described in these analytical reviews.

Fibonacci Retracements Analysis 27.12.2021 (GOLD, USDCHF)

Article By RoboForex.com

XAUUSD, “Gold vs US Dollar”

In the H4 chart, after finishing the correctional downtrend, XAUUSD is trying to form the second wave to the upside. Convergence on MACD is another signal that the correction is over. In this case, the next upside targets may be 61.8% and 76.0% fibo at 1908.00 and 1969.50 respectively. The key support is at 1721.65.

GOLD_H4
Risk Warning: the result of previous trading operations do not guarantee the same results in the future

As we can see in the H1 chart, the first rising wave after convergence on MACD has reached 50.0% fibo and may later continue towards 61.8% and 76.0% fibo at 1829.35 and 1847.30 respectively. The key upside target is the current high at 1877.09, while the support is at 1752.50.

GOLD_H1
Risk Warning: the result of previous trading operations do not guarantee the same results in the future

USDCHF, “US Dollar vs Swiss Franc”

As we can see in the H4 chart, the asset is forming a wide sideways channel. After testing 61.8% fibo several times, the price has failed to reach 76.0% fibo at 0.9154. The pair’s future movement depends on a breakout of either support or resistance at 0.9085 and 0.9374 respectively.

USDCHF_H4
Risk Warning: the result of previous trading operations do not guarantee the same results in the future

In the H1 chart, after growing and reaching 61.8% fibo, USDCHF is falling towards the low at 0.9157. At the same time, there is convergence on MACD, which may hint at a reversal and a new growth to reach 76.0% fibo at 0.9322.

USDCHDF_H1

Article By RoboForex.com

Attention!
Forecasts presented in this section only reflect the author’s private opinion and should not be considered as guidance for trading. RoboForex LP bears no responsibility for trading results based on trading recommendations described in these analytical reviews.

Intraday Market Analysis – USD Looks To Rebound

By Orbex

USDJPY breaks higher

USDJPY

The US dollar inched higher after November’s core PCE jumped to 4.7%. A break above the supply area near 114.20 indicates that the bulls have gained the upper hand.

As sellers rush to the exit, the pair may enjoy solid support above the former resistance at 114.05. An overbought RSI has temporarily limited the initial breakout range.

After a short accumulation phase, the bulls may have an unobstructed path towards the psychological level of 115.00. That is a major hurdle right under the previous peak.

USDCAD retreats to daily support

USDCAD

The Canadian dollar bounces back as GDP growth gained traction in October. The US dollar is struggling for support after its tentative break above the August high at 1.2950.

A retreat below 1.2900 has led traders to dump leveraged positions. The pair is testing the daily support at 1.2760 which lies along the 30-day moving average. And this makes it an area of interest for the bulls to attempt a rebound.

1.2920 is a fresh resistance ahead. A deeper correction may send the greenback to 1.2650 near December’s lows.

US 100 completes V-shaped recovery


US 100

The Nasdaq 100 continues to recover as improved economic data outweigh covid concerns.

The index has met solid buying interest near 15600. This used to be a supply zone from last September. Since then it has recouped losses from the recent liquidation.

The RSI’s overbought situation may cause a brief pullback while short-term traders take profit. 16170 is the closest support and 15850 is another layer of defense. On the upside, a break above 16460 could extend the rally to the all-time high at 16770 and beyond.


Orbex-LogoArticle by Orbex

Orbex is a fully licensed broker that was established in 2011. Founded with a mission to serve its traders responsibly and provides traders with access to the world’s largest and most liquid financial markets. www.orbex.com

The Analytical Overview of the Main Currency Pairs on 2021.12.27

by JustForex

The EUR/USD currency pair

Technical indicators of the currency pair:
  • Prev Open: 1.1325
  • Prev Close: 1.1305
  • % chg. over the last day: -0.17%

Today is a bank holiday in most European countries, so the volatility in the market is expected to be low in the first half of the day. In the medium term, an increase in the Fed balance sheet and reduced concerns about the Omicron strain will temporarily weaken the dollar index and increase the European currency.

Trading recommendations
  • Support levels: 1.1293, 1.1230, 1.1168
  • Resistance levels: 1.1342, 1.1360, 1.1436, 1.1535, 1.1613, 1.1667, 1.1717

From a technical point of view, the EUR/USD on the hour time frame is still bearish. The MACD indicator has become inactive. The volatility is below average due to the holidays. It is better to consider sell deals after a false breakdown of the 1.1342 resistance level. Buy trades can be considered on the lower time frames from the support level of 1.1293, but only with additional confirmation.

Alternative scenario: if the price breaks out through the 1.1360 resistance level and fixes above, the mid-term uptrend will likely resume.

EUR/USD
There is no news feed for today.

The GBP/USD currency pair

Technical indicators of the currency pair:
  • Prev Open: 1.3404
  • Prev Close: 1.3379
  • % chg. over the last day: -0.18%

Today and tomorrow is a bank holiday in the UK, so volatility on the GBP/USD currency pair is expected to be low these days. In the medium term, an increase in the Fed balance sheet and reduced concerns about the Omicron strain will temporarily weaken the dollar index and increase the British currency.

Trading recommendations
  • Support levels: 1.3362, 1.3301, 1.3277, 1.3220
  • Resistance levels: 1.3434, 1.3507, 1.3575, 1.3685

On the hourly time frame, the trend on GBP/USD is still bullish. The MACD indicator has become inactive. Under such market conditions, traders should consider buy positions from the 1.3362 support level but only with additional confirmation in the form of a buyers’ initiative. Sell trades can be considered from the resistance level of 1.3434, but only with additional confirmation in the form of a false breakout.

Alternative scenario: if the price breaks down through the 1.3277 support level and consolidates below, the bearish scenario will likely resume.

GBP/USD
There is no news feed for today.

The USD/JPY currency pair

Technical indicators of the currency pair:
  • Prev Open: 114.37
  • Prev Close: 114.32
  • % chg. over the last day: -0.04%

Japan’s retail sales rose faster than expected in November thanks to a decline in COVID-19 cases this month, which prompted buyers to increase spending on goods and services. Japan’s government on Friday approved a record $940 billion budget for the fiscal year 2022.

Trading recommendations
  • Support levels: 114.30, 114.12, 113.95, 113.68, 113.30, 112.62, 112.30
  • Resistance levels: 115.15, 115.50

The global trend on the USD/JPY currency pair has changed to bullish. The MACD indicator is signaling a divergence, which means that a slight correction should be expected. Buy positions should be considered from the 114.12 support level, but with additional confirmation in the form of a buyers’ initiative. There is no optimal entry point for sell positions now.

Alternative scenario: if the price fixes below 113.68, the uptrend will likely be broken.

USD/JPY
News feed for 2021.12.27:
  • – Japan Retail Sales (m/m) at 01:50 (GMT+2).

The USD/CAD currency pair

Technical indicators of the currency pair:
  • Prev Open: 1.2806
  • Prev Close: 1.2802
  • % chg. over the last day: -0.03%

The Canadian dollar is a commodity currency that correlates strongly with oil prices and the dollar index. Oil prices are increasing slowly, while the dollar index was stable on Friday. The Canadian dollar is slowly strengthening. Today and tomorrow, it’s a bank holiday in Canada, so volatility on the USD/CAD currency pair is expected to be low these days.

Trading recommendations
  • Support levels: 1.2783, 1.2721, 1.2677, 1.2638
  • Resistance levels: 1.2903, 1.2951

From a technical point of view, the USD/CAD currency pair is bullish. The MACD indicator is not active, but there is a divergence to buy. Under such market conditions, it is better to look for buy deals from the priority change level of 1.2783. Sell deals should be considered from the resistance level of 1.2903, but with additional confirmation in the form of a sellers’ initiative.

Alternative scenario: if the price breaks down through the 1.2783 support level and fixes below, the downtrend will likely resume.

USD/CAD
There is no news feed for today.

by JustForex


This article reflects a personal opinion and should not be interpreted as an investment advice, and/or offer, and/or a persistent request for carrying out financial transactions, and/or a guarantee, and/or a forecast of future events.

The US Federal Reserve’s balance sheet hits a new record. Airlines around the world cancel flights out of rising Omicron rates

by JustForex

The US Federal Reserve’s balance sheet has reached a new record of $8.8 trillion. But it should be noted that the Fed’s bond buying pace is declining now. Meanwhile, the Fed’s total assets are 38% of the US GDP compared to 82% for the ECB and 133% for the Bank of England. The Fed’s balance sheet growth will continue until March 2022, which will have a temporary negative impact on the dollar index, but at the same time, will be a positive factor for the growth of major US stock indices.

The US stock market ended pre-Christmas trading higher on Friday. By the end of the trading week, Dow Jones (US30) gained 0.55% (+0.42% for the week), S&P 500 (US500) added 0.62% (+1.58% for the week), NASDAQ Technology Index (US100) increased by 0.85%, and became a growth leader at the end of the week (+4.10%) among US indices.

European stock indices were mostly on the rise on Friday. The British FTSE 100 (UK100) decreased by 0.02% (+1.41% for the week), German DAX (DE40) gained 1.04% (+1.00% for the week), Spanish IBEX 35 (ES35) jumped by 1.24% (+2.86% for the week), and French CAC 40 (FR40) decreased by 0.28% but added +4.46% on the week’s result among major European indices. Today is the bank holiday in most European countries, so low volatility is expected on the market.

Turkish President Tayyip Erdogan said Friday that the government had destroyed the “currency bubble” after the central bank took measures last week to protect Turkish lira deposits from volatility. Erdogan also said Turkey’s economy would enter a very different environment in the summer thanks to a “new economic model” of low interest rates.

Russian Foreign Minister Lavrov threatened Europe with a big war because of Ukraine. “The course of dragging Kyiv into NATO with the prospect of the appearance of shock missile systems near our borders creates unacceptable threats to Russia’s security, provoking serious military risks for all parties involved, up to a large-scale conflict in Europe,” the minister warned.

In recent weeks, Oil has heavily depended on the news related to the Omicron coronavirus strain. It is now difficult to predict exactly how European authorities intend to respond to the upsurge of the disease and how severe the restrictions will be during the Christmas vacations. Today black gold prices are decreasing after airlines around the world canceled a total of about 5,900 flights starting from Dec. 24 because of the spread of COVID-19.

Gazprom has not booked any pumping capacity through the Yamal pipeline for a week now. As the company explained the day before, now it does not use this route because several customers, particularly from France and Germany, have already fully used all their annual contracted volumes and no longer put up requests for gas supplies.

Asian markets mostly traded in positive territory on Friday. Japan’s Nikkei 225 (JP225) decreased by 0.06% (+1.61% for the week), Hong Kong’s Hang Seng (HK50) added 0.13% (+0.62% for the week), and Australia’s S&P/ASX 200 (AU200) increased by 0.44% (+1.59% for the week). Japan’s retail sales rose faster than expected in November thanks to a decline in COVID-19 cases this month, which prompted buyers to increase spending on goods and services. On Friday, Japan’s government approved a record $940 billion budget for the fiscal year 2022. The Bank of Japan’s monetary policy is now aimed at actively stimulating the economy. China Evergrande’s chairman promised to deliver thousands of apartments in December. China’s real estate index increased by 2.5% on this news.

At the commodities market, palladium (+8.89%), wheat (+5.19%), fuel oil (+4.96%), soybeans (+4.45%), WTI oil (+4.3%), platinum (+4.29%), Brent oil (+3.18%), copper (+2.56%) and corn (+2.28%) futures showed the biggest gains for the last week. Lumber (-3.37%) and orange juice (-1.54%) futures showed the biggest drop.

Main market quotes:

S&P 500 (F) (US500) 4,725.79 +29.23 (+0.62%)

Dow Jones (US30) 35,950.56 +196.67 (+0.55%)

DAX (DE40) 15,756.31 +162.84 (+1.04%)

FTSE 100 (UK100) 7,372.10 −1.24 (−0.017%)

USD Index 96.06 +0.04 (+0.04%)

Important events for today:
  • – Japan Retail Sales (m/m) at 01:50 (GMT+2).

by JustForex


This article reflects a personal opinion and should not be interpreted as an investment advice, and/or offer, and/or a persistent request for carrying out financial transactions, and/or a guarantee, and/or a forecast of future events.