
By InvestMacro | COT | Data Tables | COT Leaders | Downloads | COT Newsletter
Here are the latest charts and statistics for the Commitment of Traders (COT) data published by the Commodities Futures Trading Commission (CFTC).
The latest COT data is updated through Tuesday December 14th 2021 and shows a quick view of how large traders (for-profit speculators and commercial entities) were positioned in the futures markets. All currency positions are in direct relation to the US dollar where, for example, a bet for the euro is a bet that the euro will rise versus the dollar while a bet against the euro will be a bet that the euro will decline versus the dollar.
Highlighting this week’s COT currency data was a giant surge in bets in favor of the Mexican peso. Speculative positions jumped by over +53,000 contracts this week, marking the largest one-week increase since a gain of +54,788 contracts back on May 9th of 2017, a span of two-hundred and forty weeks. The largest one-week rise in peso contracts was +58,504 contracts on March 27th of 2012. Overall, peso positioning went from a total speculative standing of -64,126 contracts last week to a total of -10,673 contracts this week. Helping the cause of the peso this week was the fifth straight interest rate rise by the Mexican central bank that pushed its interest rate higher by 50 basis points.
Joining the Mexican peso (53,453 contracts) with positive changes this week were the Japanese yen (9,558 contracts), Brazil real (1,007 contracts), Swiss franc (3,717 contracts), Australian dollar (2,889 contracts), Russian ruble (2,725 contracts) and Bitcoin (136 contracts).
The currencies with declining speculator bets were the US Dollar Index (-3,624 contracts), Euro (-3,580 contracts), British pound sterling (-12,471 contracts), New Zealand dollar (-16,569 contracts) and the Canadian dollar (-3,770 contracts).
| Dec-14-2021 | OI | OI-Index | Spec-Net | Spec-Index | Com-Net | COM-Index | Smalls-Net | Smalls-Index |
|---|---|---|---|---|---|---|---|---|
| USD Index | 52,098 | 72 | 31,241 | 80 | -36,615 | 14 | 5,374 | 75 |
| EUR | 661,711 | 69 | -11,879 | 31 | -16,589 | 71 | 28,468 | 22 |
| GBP | 213,210 | 47 | -50,748 | 37 | 70,440 | 71 | -19,692 | 15 |
| JPY | 176,584 | 39 | -53,523 | 34 | 71,060 | 71 | -17,537 | 12 |
| CHF | 38,467 | 12 | -8,336 | 55 | 14,808 | 47 | -6,472 | 44 |
| CAD | 186,638 | 55 | -13,128 | 44 | -2,059 | 50 | 15,187 | 60 |
| AUD | 197,405 | 81 | -78,903 | 10 | 98,423 | 92 | -19,520 | 5 |
| NZD | 41,223 | 27 | -5,861 | 61 | 8,174 | 43 | -2,313 | 25 |
| MXN | 101,049 | 0 | -10,673 | 23 | 12,423 | 78 | -1,750 | 36 |
| RUB | 64,500 | 78 | 16,524 | 53 | -17,603 | 45 | 1,079 | 64 |
| BRL | 27,706 | 23 | -4,617 | 62 | 4,992 | 40 | -375 | 62 |
| Bitcoin | 13,518 | 77 | -772 | 85 | 257 | 0 | 515 | 25 |
US Dollar Index Futures:
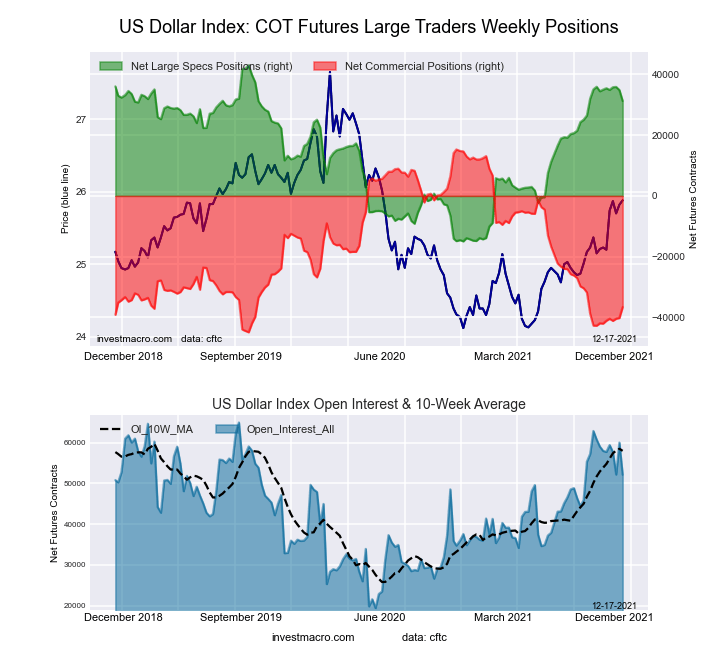 The US Dollar Index large speculator standing this week totaled a net position of 31,241 contracts in the data reported through Tuesday. This was a weekly decrease of -3,624 contracts from the previous week which had a total of 34,865 net contracts.
This week’s current strength score (the trader positioning range over the past three years, measured from 0 to 100) shows the speculators are currently Bullish with a score of 79.7 percent. The commercials are Bearish-Extreme with a score of 13.8 percent and the small traders (not shown in chart) are Bullish with a score of 75.3 percent.
| US DOLLAR INDEX Statistics | SPECULATORS | COMMERCIALS | SMALL TRADERS |
| – Percent of Open Interest Longs: | 81.1 | 3.2 | 13.6 |
| – Percent of Open Interest Shorts: | 21.2 | 73.5 | 3.3 |
| – Net Position: | 31,241 | -36,615 | 5,374 |
| – Gross Longs: | 42,263 | 1,693 | 7,071 |
| – Gross Shorts: | 11,022 | 38,308 | 1,697 |
| – Long to Short Ratio: | 3.8 to 1 | 0.0 to 1 | 4.2 to 1 |
| NET POSITION TREND: | |||
| – Strength Index Score (3 Year Range Pct): | 79.7 | 13.8 | 75.3 |
| – Strength Index Reading (3 Year Range): | Bullish | Bearish-Extreme | Bullish |
| NET POSITION MOVEMENT INDEX: | |||
| – 6-Week Change in Strength Index: | -6.5 | 9.0 | -18.6 |
Euro Currency Futures:
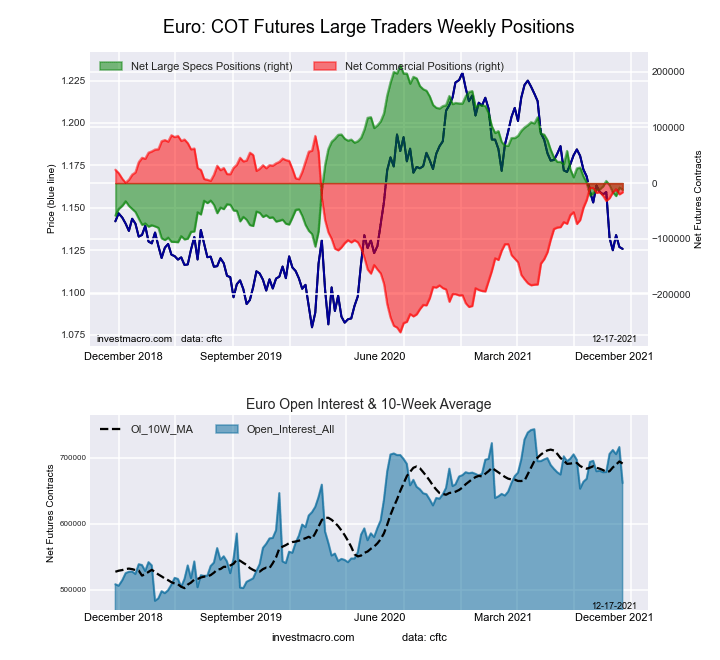 The Euro Currency large speculator standing this week totaled a net position of -11,879 contracts in the data reported through Tuesday. This was a weekly decline of -3,580 contracts from the previous week which had a total of -8,299 net contracts.
This week’s current strength score (the trader positioning range over the past three years, measured from 0 to 100) shows the speculators are currently Bearish with a score of 31.4 percent. The commercials are Bullish with a score of 71.0 percent and the small traders (not shown in chart) are Bearish with a score of 21.6 percent.
| EURO Currency Statistics | SPECULATORS | COMMERCIALS | SMALL TRADERS |
| – Percent of Open Interest Longs: | 28.6 | 57.1 | 12.1 |
| – Percent of Open Interest Shorts: | 30.4 | 59.6 | 7.8 |
| – Net Position: | -11,879 | -16,589 | 28,468 |
| – Gross Longs: | 189,530 | 378,079 | 80,169 |
| – Gross Shorts: | 201,409 | 394,668 | 51,701 |
| – Long to Short Ratio: | 0.9 to 1 | 1.0 to 1 | 1.6 to 1 |
| NET POSITION TREND: | |||
| – Strength Index Score (3 Year Range Pct): | 31.4 | 71.0 | 21.6 |
| – Strength Index Reading (3 Year Range): | Bearish | Bullish | Bearish |
| NET POSITION MOVEMENT INDEX: | |||
| – 6-Week Change in Strength Index: | -1.8 | 1.7 | -0.7 |
British Pound Sterling Futures:
 The British Pound Sterling large speculator standing this week totaled a net position of -50,748 contracts in the data reported through Tuesday. This was a weekly decline of -12,471 contracts from the previous week which had a total of -38,277 net contracts.
This week’s current strength score (the trader positioning range over the past three years, measured from 0 to 100) shows the speculators are currently Bearish with a score of 37.4 percent. The commercials are Bullish with a score of 71.3 percent and the small traders (not shown in chart) are Bearish-Extreme with a score of 14.8 percent.
| BRITISH POUND Statistics | SPECULATORS | COMMERCIALS | SMALL TRADERS |
| – Percent of Open Interest Longs: | 13.8 | 76.1 | 9.2 |
| – Percent of Open Interest Shorts: | 37.6 | 43.1 | 18.4 |
| – Net Position: | -50,748 | 70,440 | -19,692 |
| – Gross Longs: | 29,497 | 162,359 | 19,535 |
| – Gross Shorts: | 80,245 | 91,919 | 39,227 |
| – Long to Short Ratio: | 0.4 to 1 | 1.8 to 1 | 0.5 to 1 |
| NET POSITION TREND: | |||
| – Strength Index Score (3 Year Range Pct): | 37.4 | 71.3 | 14.8 |
| – Strength Index Reading (3 Year Range): | Bearish | Bullish | Bearish-Extreme |
| NET POSITION MOVEMENT INDEX: | |||
| – 6-Week Change in Strength Index: | -47.4 | 48.6 | -33.9 |
Japanese Yen Futures:
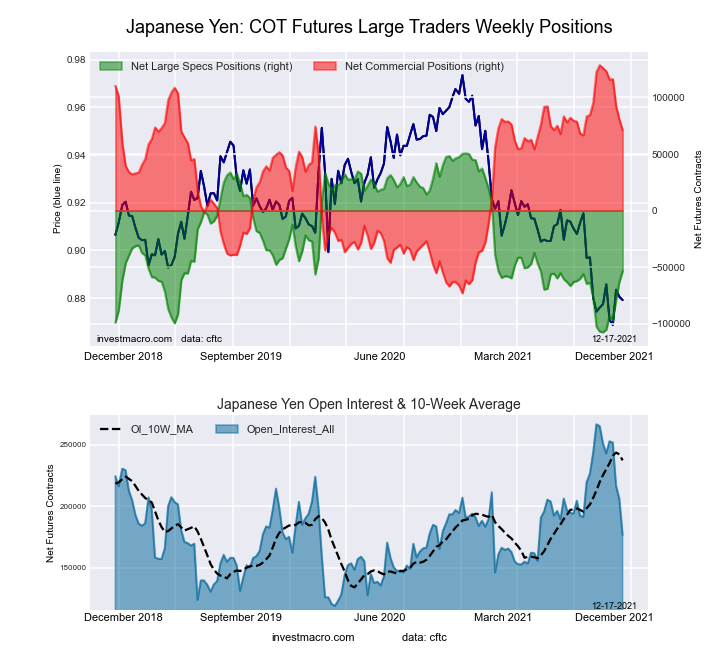 The Japanese Yen large speculator standing this week totaled a net position of -53,523 contracts in the data reported through Tuesday. This was a weekly boost of 9,558 contracts from the previous week which had a total of -63,081 net contracts.
This week’s current strength score (the trader positioning range over the past three years, measured from 0 to 100) shows the speculators are currently Bearish with a score of 34.2 percent. The commercials are Bullish with a score of 71.5 percent and the small traders (not shown in chart) are Bearish-Extreme with a score of 11.9 percent.
| JAPANESE YEN Statistics | SPECULATORS | COMMERCIALS | SMALL TRADERS |
| – Percent of Open Interest Longs: | 11.5 | 77.5 | 9.8 |
| – Percent of Open Interest Shorts: | 41.8 | 37.3 | 19.7 |
| – Net Position: | -53,523 | 71,060 | -17,537 |
| – Gross Longs: | 20,231 | 136,938 | 17,308 |
| – Gross Shorts: | 73,754 | 65,878 | 34,845 |
| – Long to Short Ratio: | 0.3 to 1 | 2.1 to 1 | 0.5 to 1 |
| NET POSITION TREND: | |||
| – Strength Index Score (3 Year Range Pct): | 34.2 | 71.5 | 11.9 |
| – Strength Index Reading (3 Year Range): | Bearish | Bullish | Bearish-Extreme |
| NET POSITION MOVEMENT INDEX: | |||
| – 6-Week Change in Strength Index: | 34.2 | -27.2 | 1.8 |
Swiss Franc Futures:
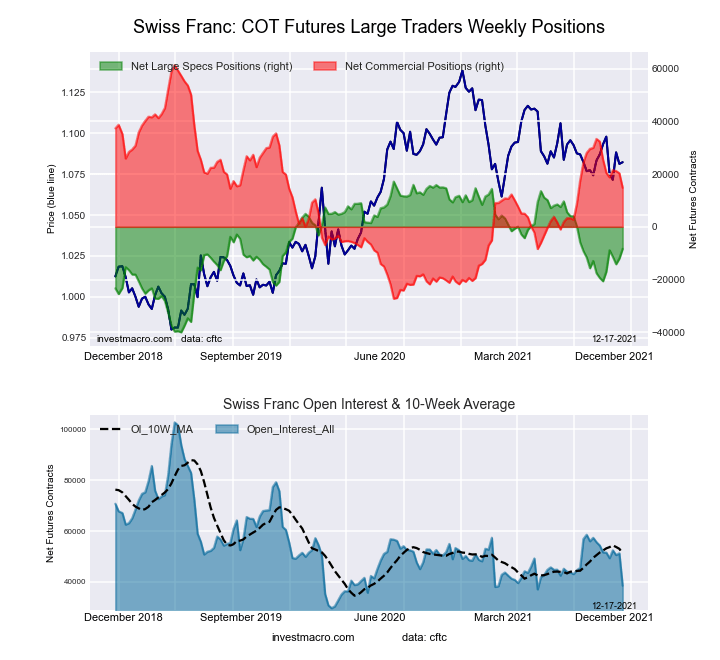 The Swiss Franc large speculator standing this week totaled a net position of -8,336 contracts in the data reported through Tuesday. This was a weekly rise of 3,717 contracts from the previous week which had a total of -12,053 net contracts.
This week’s current strength score (the trader positioning range over the past three years, measured from 0 to 100) shows the speculators are currently Bullish with a score of 55.4 percent. The commercials are Bearish with a score of 47.5 percent and the small traders (not shown in chart) are Bearish with a score of 44.3 percent.
| SWISS FRANC Statistics | SPECULATORS | COMMERCIALS | SMALL TRADERS |
| – Percent of Open Interest Longs: | 3.5 | 67.0 | 29.4 |
| – Percent of Open Interest Shorts: | 25.2 | 28.5 | 46.2 |
| – Net Position: | -8,336 | 14,808 | -6,472 |
| – Gross Longs: | 1,344 | 25,786 | 11,302 |
| – Gross Shorts: | 9,680 | 10,978 | 17,774 |
| – Long to Short Ratio: | 0.1 to 1 | 2.3 to 1 | 0.6 to 1 |
| NET POSITION TREND: | |||
| – Strength Index Score (3 Year Range Pct): | 55.4 | 47.5 | 44.3 |
| – Strength Index Reading (3 Year Range): | Bullish | Bearish | Bearish |
| NET POSITION MOVEMENT INDEX: | |||
| – 6-Week Change in Strength Index: | 21.5 | -12.1 | -4.8 |
Canadian Dollar Futures:
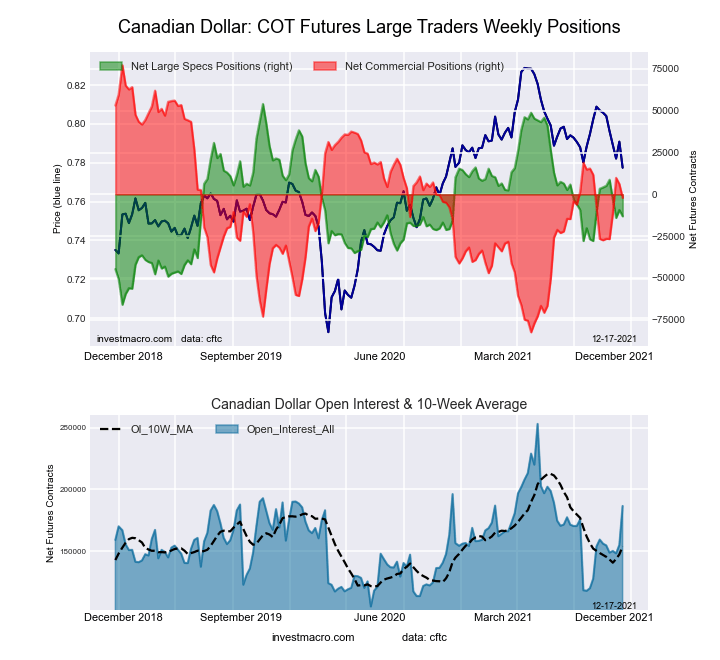 The Canadian Dollar large speculator standing this week totaled a net position of -13,128 contracts in the data reported through Tuesday. This was a weekly fall of -3,770 contracts from the previous week which had a total of -9,358 net contracts.
This week’s current strength score (the trader positioning range over the past three years, measured from 0 to 100) shows the speculators are currently Bearish with a score of 44.1 percent. The commercials are Bullish with a score of 50.4 percent and the small traders (not shown in chart) are Bullish with a score of 60.0 percent.
| CANADIAN DOLLAR Statistics | SPECULATORS | COMMERCIALS | SMALL TRADERS |
| – Percent of Open Interest Longs: | 20.5 | 39.9 | 22.7 |
| – Percent of Open Interest Shorts: | 27.5 | 41.0 | 14.6 |
| – Net Position: | -13,128 | -2,059 | 15,187 |
| – Gross Longs: | 38,230 | 74,451 | 42,399 |
| – Gross Shorts: | 51,358 | 76,510 | 27,212 |
| – Long to Short Ratio: | 0.7 to 1 | 1.0 to 1 | 1.6 to 1 |
| NET POSITION TREND: | |||
| – Strength Index Score (3 Year Range Pct): | 44.1 | 50.4 | 60.0 |
| – Strength Index Reading (3 Year Range): | Bearish | Bullish | Bullish |
| NET POSITION MOVEMENT INDEX: | |||
| – 6-Week Change in Strength Index: | -14.4 | 15.9 | -16.1 |
Australian Dollar Futures:
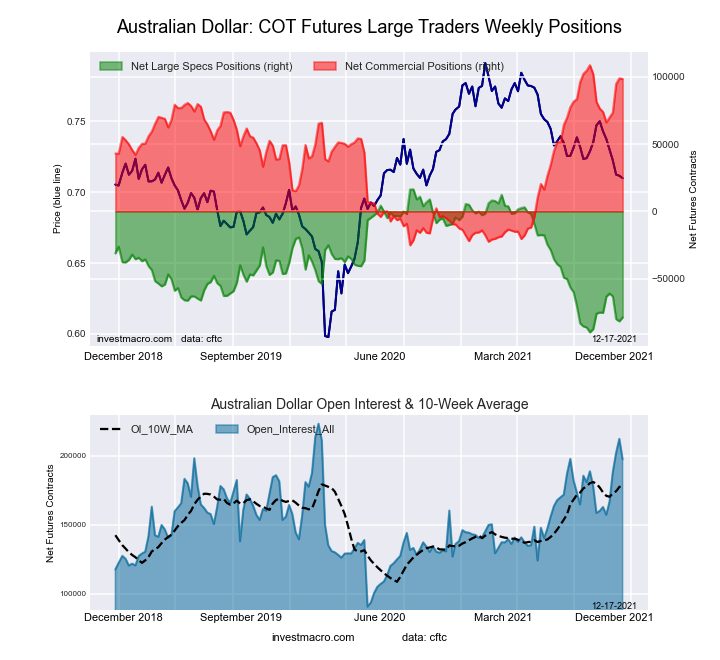 The Australian Dollar large speculator standing this week totaled a net position of -78,903 contracts in the data reported through Tuesday. This was a weekly advance of 2,889 contracts from the previous week which had a total of -81,792 net contracts.
This week’s current strength score (the trader positioning range over the past three years, measured from 0 to 100) shows the speculators are currently Bearish-Extreme with a score of 10.4 percent. The commercials are Bullish-Extreme with a score of 92.3 percent and the small traders (not shown in chart) are Bearish-Extreme with a score of 4.8 percent.
| AUSTRALIAN DOLLAR Statistics | SPECULATORS | COMMERCIALS | SMALL TRADERS |
| – Percent of Open Interest Longs: | 14.8 | 74.8 | 8.5 |
| – Percent of Open Interest Shorts: | 54.8 | 24.9 | 18.4 |
| – Net Position: | -78,903 | 98,423 | -19,520 |
| – Gross Longs: | 29,254 | 147,601 | 16,807 |
| – Gross Shorts: | 108,157 | 49,178 | 36,327 |
| – Long to Short Ratio: | 0.3 to 1 | 3.0 to 1 | 0.5 to 1 |
| NET POSITION TREND: | |||
| – Strength Index Score (3 Year Range Pct): | 10.4 | 92.3 | 4.8 |
| – Strength Index Reading (3 Year Range): | Bearish-Extreme | Bullish-Extreme | Bearish-Extreme |
| NET POSITION MOVEMENT INDEX: | |||
| – 6-Week Change in Strength Index: | -3.2 | 18.3 | -51.3 |
New Zealand Dollar Futures:
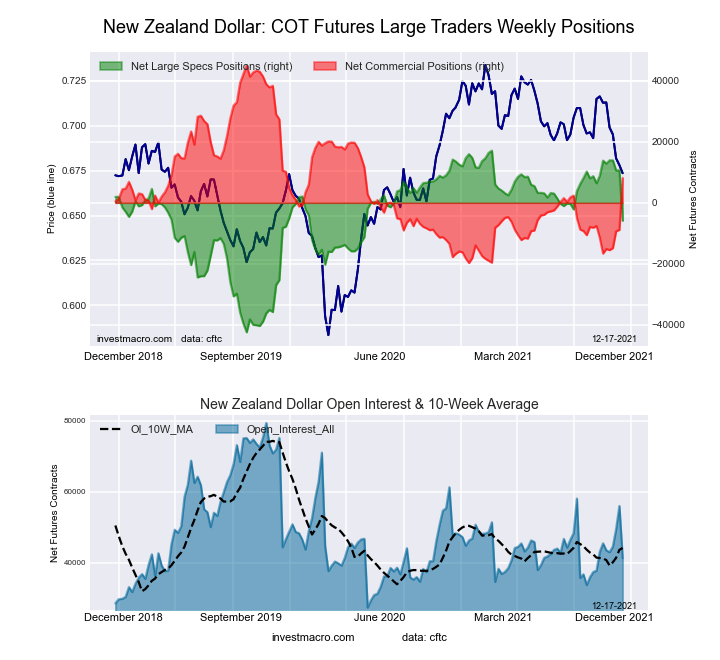 The New Zealand Dollar large speculator standing this week totaled a net position of -5,861 contracts in the data reported through Tuesday. This was a weekly fall of -16,569 contracts from the previous week which had a total of 10,708 net contracts.
This week’s current strength score (the trader positioning range over the past three years, measured from 0 to 100) shows the speculators are currently Bullish with a score of 61.4 percent. The commercials are Bearish with a score of 43.0 percent and the small traders (not shown in chart) are Bearish with a score of 25.4 percent.
| NEW ZEALAND DOLLAR Statistics | SPECULATORS | COMMERCIALS | SMALL TRADERS |
| – Percent of Open Interest Longs: | 32.8 | 58.2 | 7.5 |
| – Percent of Open Interest Shorts: | 47.1 | 38.4 | 13.1 |
| – Net Position: | -5,861 | 8,174 | -2,313 |
| – Gross Longs: | 13,539 | 23,994 | 3,081 |
| – Gross Shorts: | 19,400 | 15,820 | 5,394 |
| – Long to Short Ratio: | 0.7 to 1 | 1.5 to 1 | 0.6 to 1 |
| NET POSITION TREND: | |||
| – Strength Index Score (3 Year Range Pct): | 61.4 | 43.0 | 25.4 |
| – Strength Index Reading (3 Year Range): | Bullish | Bearish | Bearish |
| NET POSITION MOVEMENT INDEX: | |||
| – 6-Week Change in Strength Index: | -33.1 | 38.2 | -58.1 |
Mexican Peso Futures:
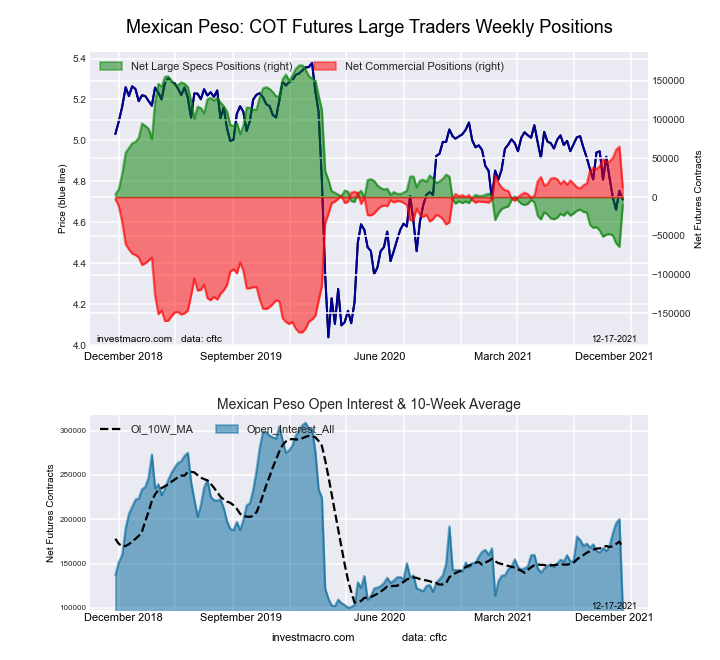 The Mexican Peso large speculator standing this week totaled a net position of -10,673 contracts in the data reported through Tuesday. This was a weekly gain of 53,453 contracts from the previous week which had a total of -64,126 net contracts.
This week’s current strength score (the trader positioning range over the past three years, measured from 0 to 100) shows the speculators are currently Bearish with a score of 22.8 percent. The commercials are Bullish with a score of 78.0 percent and the small traders (not shown in chart) are Bearish with a score of 35.6 percent.
| MEXICAN PESO Statistics | SPECULATORS | COMMERCIALS | SMALL TRADERS |
| – Percent of Open Interest Longs: | 34.4 | 60.9 | 3.8 |
| – Percent of Open Interest Shorts: | 44.9 | 48.6 | 5.5 |
| – Net Position: | -10,673 | 12,423 | -1,750 |
| – Gross Longs: | 34,748 | 61,580 | 3,829 |
| – Gross Shorts: | 45,421 | 49,157 | 5,579 |
| – Long to Short Ratio: | 0.8 to 1 | 1.3 to 1 | 0.7 to 1 |
| NET POSITION TREND: | |||
| – Strength Index Score (3 Year Range Pct): | 22.8 | 78.0 | 35.6 |
| – Strength Index Reading (3 Year Range): | Bearish | Bullish | Bearish |
| NET POSITION MOVEMENT INDEX: | |||
| – 6-Week Change in Strength Index: | 17.2 | -15.2 | -16.8 |
Brazilian Real Futures:
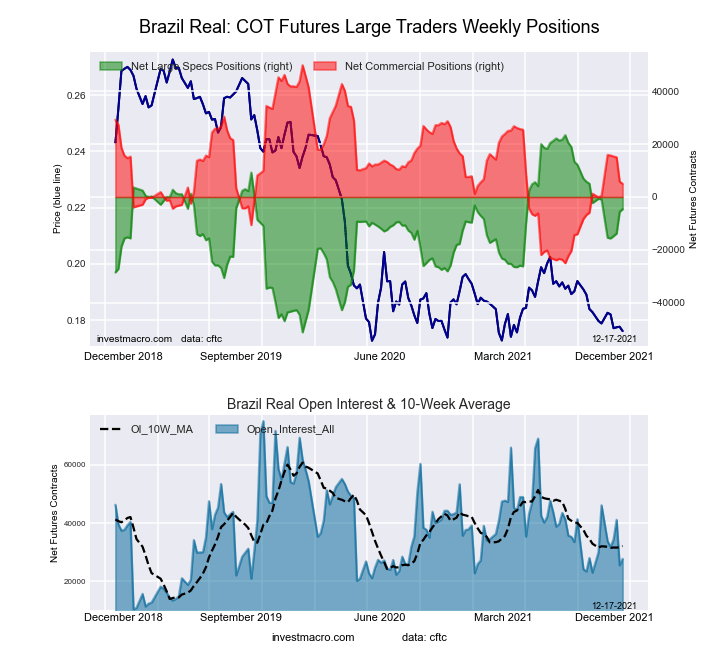 The Brazilian Real large speculator standing this week totaled a net position of -4,617 contracts in the data reported through Tuesday. This was a weekly boost of 1,007 contracts from the previous week which had a total of -5,624 net contracts.
This week’s current strength score (the trader positioning range over the past three years, measured from 0 to 100) shows the speculators are currently Bullish with a score of 62.4 percent. The commercials are Bearish with a score of 40.1 percent and the small traders (not shown in chart) are Bullish with a score of 62.3 percent.
| BRAZIL REAL Statistics | SPECULATORS | COMMERCIALS | SMALL TRADERS |
| – Percent of Open Interest Longs: | 37.9 | 52.5 | 9.1 |
| – Percent of Open Interest Shorts: | 54.5 | 34.5 | 10.4 |
| – Net Position: | -4,617 | 4,992 | -375 |
| – Gross Longs: | 10,491 | 14,537 | 2,519 |
| – Gross Shorts: | 15,108 | 9,545 | 2,894 |
| – Long to Short Ratio: | 0.7 to 1 | 1.5 to 1 | 0.9 to 1 |
| NET POSITION TREND: | |||
| – Strength Index Score (3 Year Range Pct): | 62.4 | 40.1 | 62.3 |
| – Strength Index Reading (3 Year Range): | Bullish | Bearish | Bullish |
| NET POSITION MOVEMENT INDEX: | |||
| – 6-Week Change in Strength Index: | 12.9 | -12.5 | -3.5 |
Russian Ruble Futures:
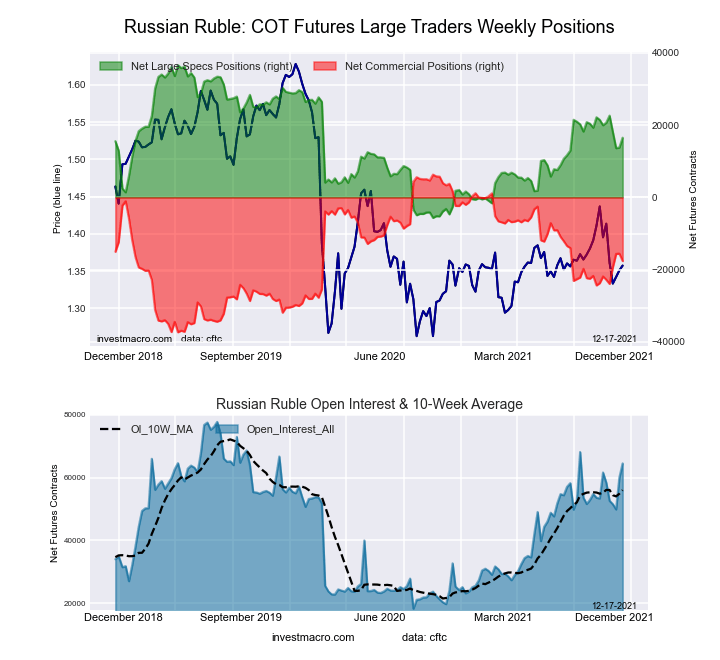 The Russian Ruble large speculator standing this week totaled a net position of 16,524 contracts in the data reported through Tuesday. This was a weekly boost of 2,725 contracts from the previous week which had a total of 13,799 net contracts.
This week’s current strength score (the trader positioning range over the past three years, measured from 0 to 100) shows the speculators are currently Bullish with a score of 52.5 percent. The commercials are Bearish with a score of 45.2 percent and the small traders (not shown in chart) are Bullish with a score of 63.9 percent.
| RUSSIAN RUBLE Statistics | SPECULATORS | COMMERCIALS | SMALL TRADERS |
| – Percent of Open Interest Longs: | 33.5 | 55.2 | 3.5 |
| – Percent of Open Interest Shorts: | 7.9 | 82.5 | 1.8 |
| – Net Position: | 16,524 | -17,603 | 1,079 |
| – Gross Longs: | 21,623 | 35,635 | 2,230 |
| – Gross Shorts: | 5,099 | 53,238 | 1,151 |
| – Long to Short Ratio: | 4.2 to 1 | 0.7 to 1 | 1.9 to 1 |
| NET POSITION TREND: | |||
| – Strength Index Score (3 Year Range Pct): | 52.5 | 45.2 | 63.9 |
| – Strength Index Reading (3 Year Range): | Bullish | Bearish | Bullish |
| NET POSITION MOVEMENT INDEX: | |||
| – 6-Week Change in Strength Index: | -8.2 | 9.8 | -22.3 |
Bitcoin Futures:
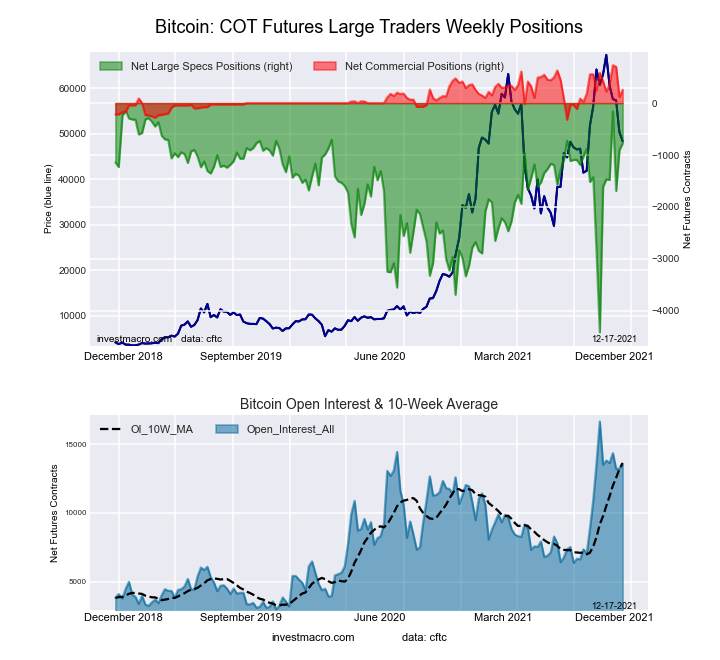 The Bitcoin large speculator standing this week totaled a net position of -772 contracts in the data reported through Tuesday. This was a weekly increase of 136 contracts from the previous week which had a total of -908 net contracts.
This week’s current strength score (the trader positioning range over the past three years, measured from 0 to 100) shows the speculators are currently Bullish-Extreme with a score of 85.2 percent. The commercials are Bullish with a score of 55.0 percent and the small traders (not shown in chart) are Bearish with a score of 24.6 percent.
| BITCOIN Statistics | SPECULATORS | COMMERCIALS | SMALL TRADERS |
| – Percent of Open Interest Longs: | 72.5 | 3.1 | 11.6 |
| – Percent of Open Interest Shorts: | 78.2 | 1.2 | 7.8 |
| – Net Position: | -772 | 257 | 515 |
| – Gross Longs: | 9,795 | 421 | 1,565 |
| – Gross Shorts: | 10,567 | 164 | 1,050 |
| – Long to Short Ratio: | 0.9 to 1 | 2.6 to 1 | 1.5 to 1 |
| NET POSITION TREND: | |||
| – Strength Index Score (3 Year Range Pct): | 85.2 | 55.0 | 24.6 |
| – Strength Index Reading (3 Year Range): | Bullish-Extreme | Bullish | Bearish |
| NET POSITION MOVEMENT INDEX: | |||
| – 6-Week Change in Strength Index: | 19.7 | -15.6 | -15.4 |
Article By InvestMacro – Receive our weekly COT Reports by Email
*COT Report: The COT data, released weekly to the public each Friday, is updated through the most recent Tuesday (data is 3 days old) and shows a quick view of how large speculators or non-commercials (for-profit traders) were positioned in the futures markets.
The CFTC categorizes trader positions according to commercial hedgers (traders who use futures contracts for hedging as part of the business), non-commercials (large traders who speculate to realize trading profits) and nonreportable traders (usually small traders/speculators) as well as their open interest (contracts open in the market at time of reporting).See CFTC criteria here.


