by JustForex
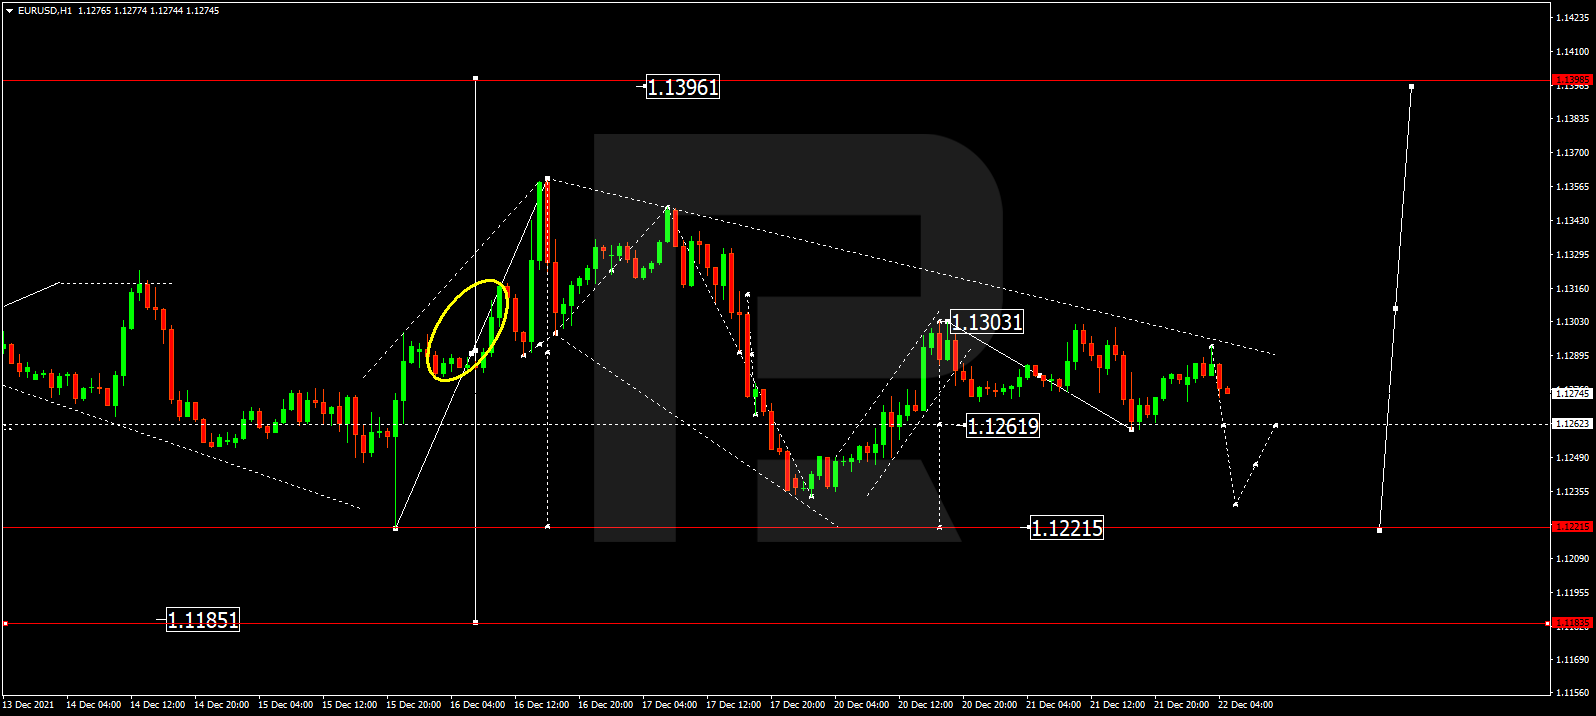
The EUR/USD currency pair
- Prev Open: 1.1285
- Prev Close: 1.1327
- % chg. over the last day: +0.37%
The dollar index is declining amid Pfizer’s approval of a new COVID-19 drug. Investors are shifting their funds to riskier assets, which causes the stock market to rise and, consequently, the dollar index to fall. In turn, a decline in the dollar index contributes to the strength of the European currency, even despite a sharp increase in the number of COVID-19 cases in the Eurozone.
- Support levels: 1.1323, 1.1293, 1.1230, 1.1168
- Resistance levels: 1.1360, 1.1436, 1.1535, 1.1613, 1.1667, 1.1717
From a technical point of view, the EUR/USD on the hour time frame is still bearish. The MACD indicator has become positive, the pressure of buyers is increasing. It is better to consider sell deals from the priority change level. Buy trades can be considered on the lower time frames from the support level of 1.1293, but only with additional confirmation.
Alternative scenario: if the price breaks out through the 1.1360 resistance level and fixes above, the mid-term uptrend will likely resume.

- – US Initial Jobless Claims (w/w) at 15:30 (GMT+2);
- – US Core Durable Goods Orders (m/m) at 15:30 (GMT+2);
- – US PCE price index (m/m) at 15:30 (GMT+2);
- – US Michigan Consumer Sentiment (m/m) at 17:00 (GMT+2);
- – US New Home Sales (m/m) at 17:00 (GMT+2);
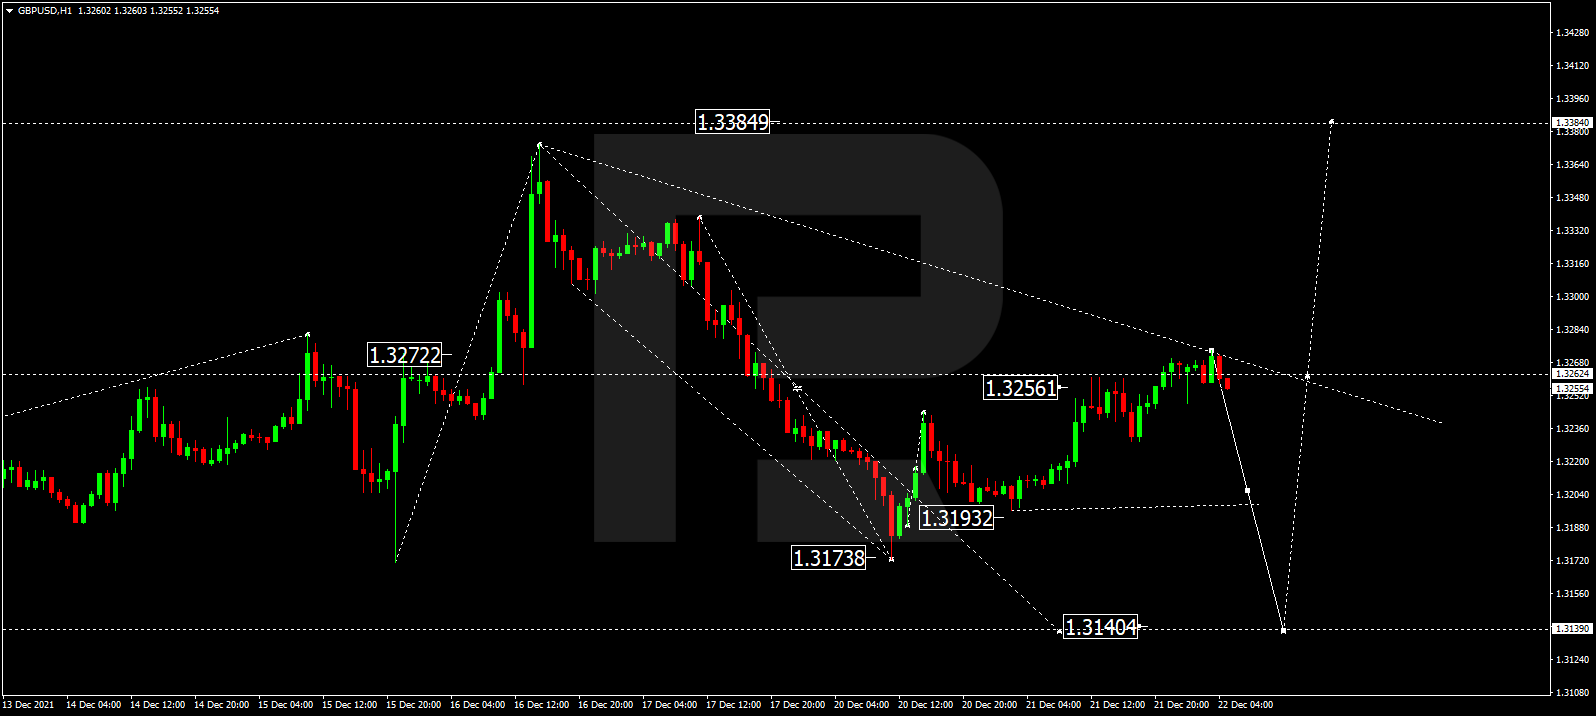
The GBP/USD currency pair
- Prev Open: 1.3254
- Prev Close: 1.3349
- % chg. over the last day: +0.71%
The UK may impose additional restrictions to contain the spread of the Omicron strain. In the past 24 hours, 106,122 new infections have been reported. In the run-up to Christmas, this situation could negatively impact the British pound. It should be noted that investors’ expectations are always priced in before the official data is released. The UK GDP increased by 1.1% in Q3; 1.3% growth was expected.
- Support levels: 1.3301, 1.3272, 1.3220
- Resistance levels: 1.3365, 1.3434, 1.3507, 1.3575, 1.3685
On the hourly time frame, the trend on GBP/USD is still bullish. The weakness of the dollar index has allowed the British currency to strengthen significantly. The MACD indicator is in the positive zone with no signs of reversal, buyers’ pressure has increased. Under such market conditions, traders should consider buy positions from the 1.3272 support level but only with additional confirmation in the form of a buyers’ initiative. Sell trades can be considered from the resistance level of 1.3365, but only with additional confirmation in the form of a sellers’ initiative.
Alternative scenario: if the price breaks down through the 1.3212 support level and consolidates below, the bearish scenario will likely resume.

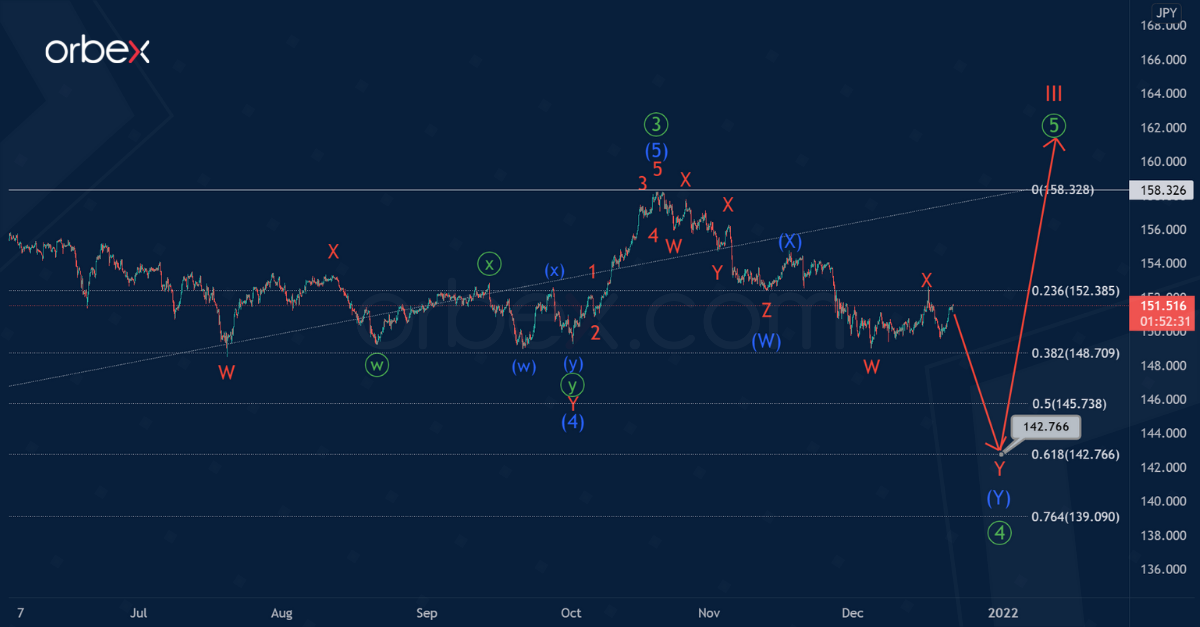
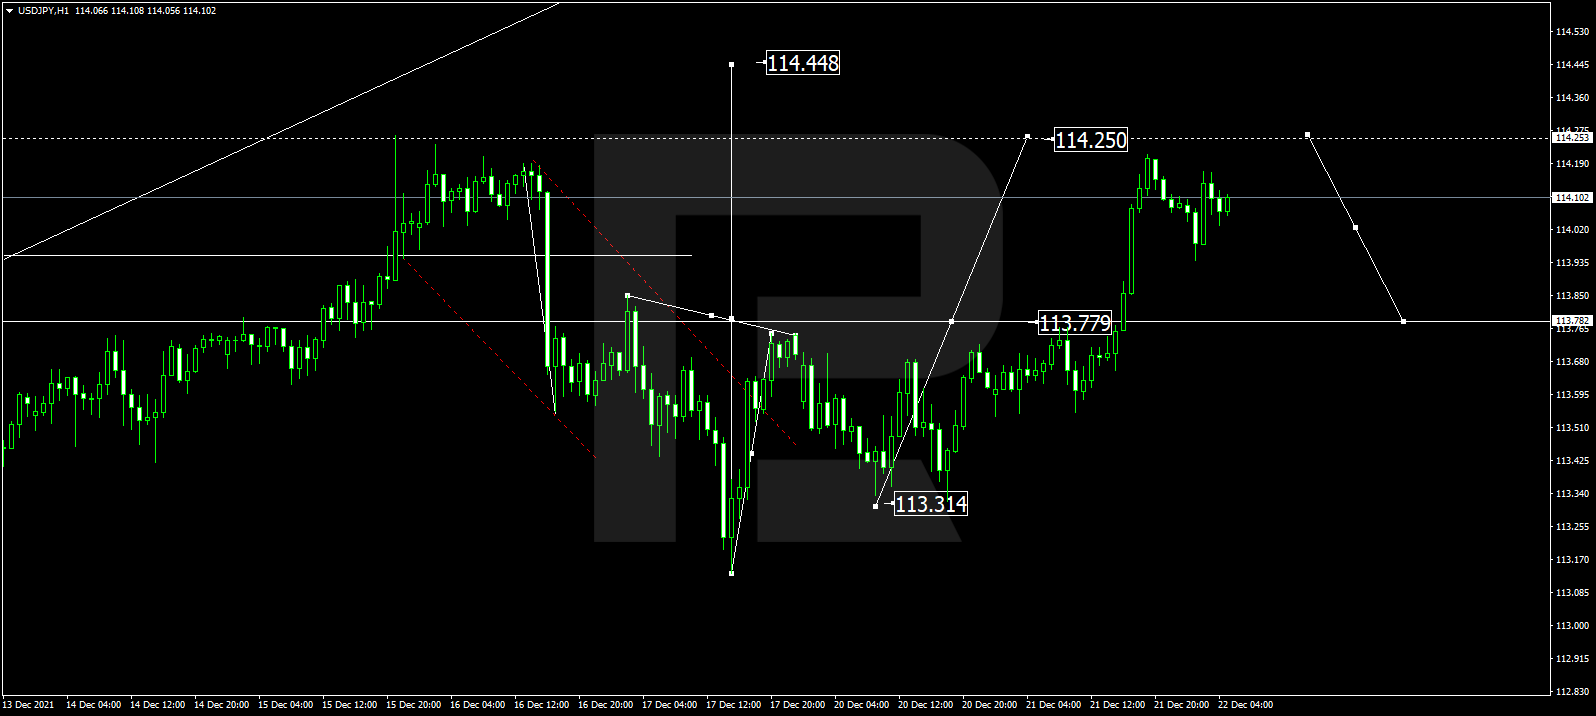
The USD/JPY currency pair
- Prev Open: 114.05
- Prev Close: 114.08
- % chg. over the last day: +0.03%
On Friday, Japan’s government will present its annual budget with $943 billion in spending for the fiscal year beginning next April, further adding to its heaviest debt burden. Major budget spending will be on combating COVID-19 for social security to support the rapidly aging population and the largest military spending in Japanese history to deal with threats from China. This situation will contribute to the weakening of the Japanese currency.
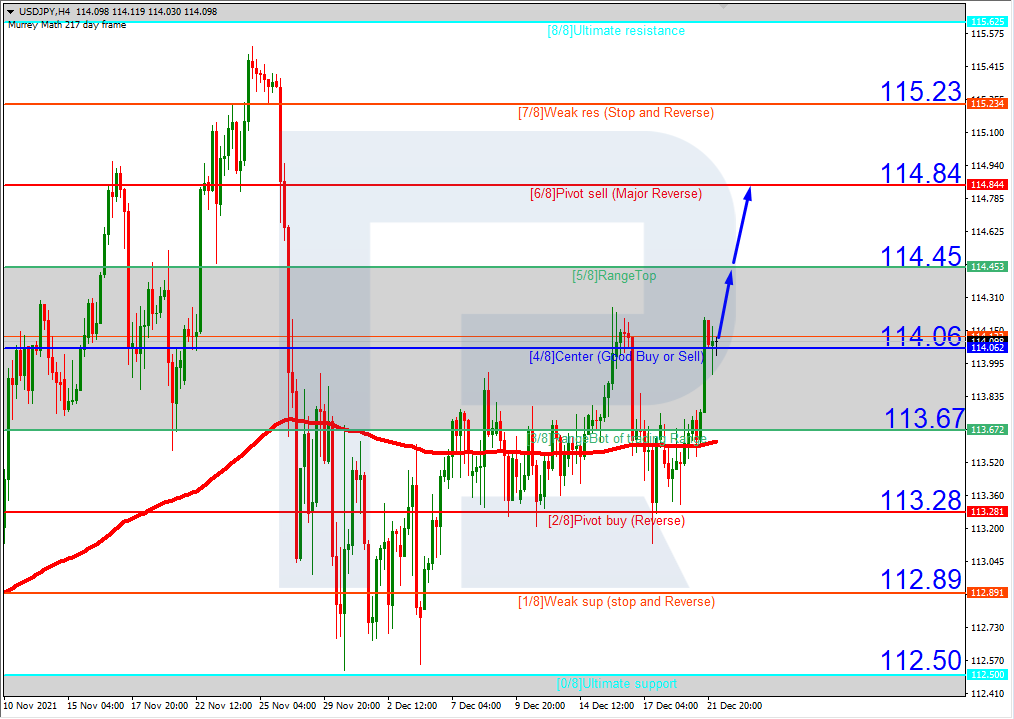
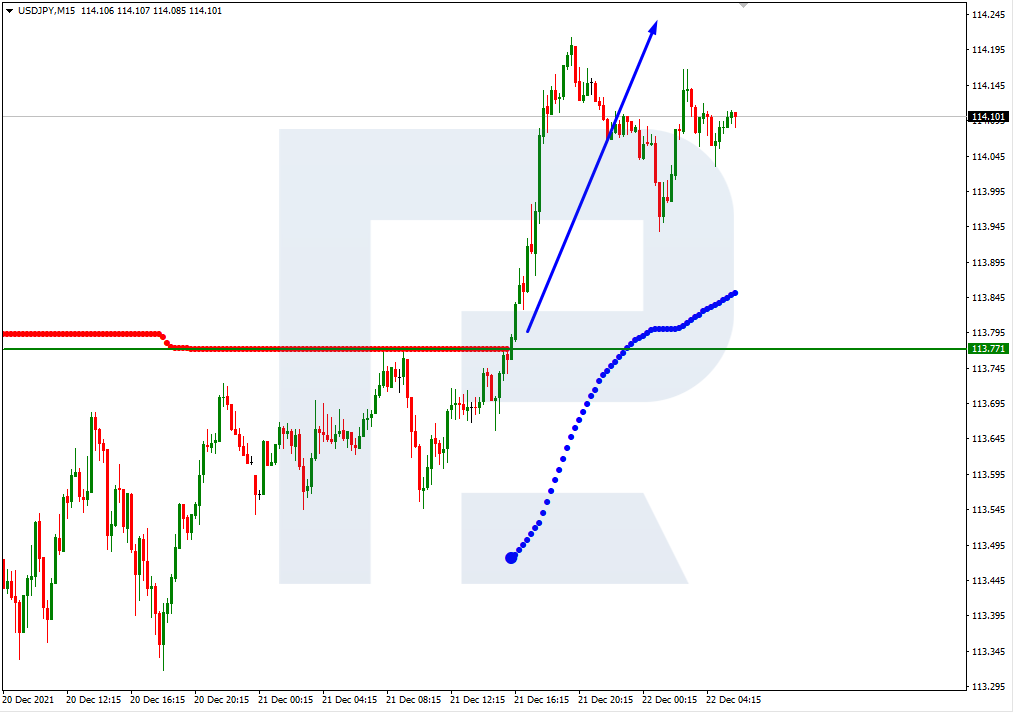
- Support levels: 113.95, 113.76, 113.30, 112.62, 112.30
- Resistance levels: 114.30, 115.15, 115.50
The global trend on the USD/JPY currency pair is bearish. The price failed to consolidate above the priority change level yesterday, so this level was shifted slightly higher after the price returned to the wide balance. Buy positions should be considered from the 113.76 support level, but with additional confirmation in the form of a buyers’ initiative or after the price breaks out the priority change level. Sell positions should be considered if the price makes a false breakout of 114.30 level, and returns back to the wide corridor with the 113.30-114.30 price range.
Alternative scenario: if the price rises above 114.30, the uptrend will likely resume.

- – Japan BoJ Governor Kuroda Speaks, at 03:00 (GMT+2).
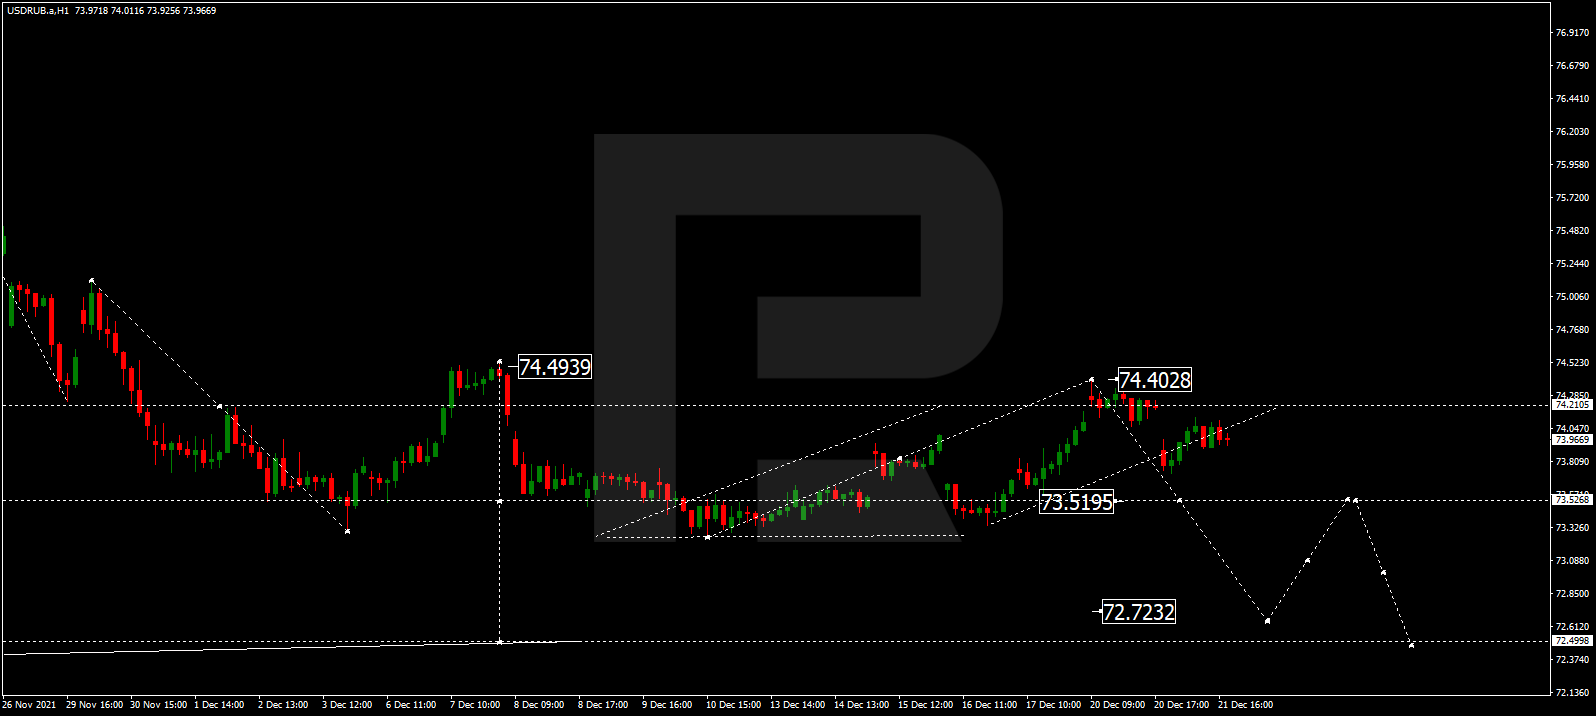
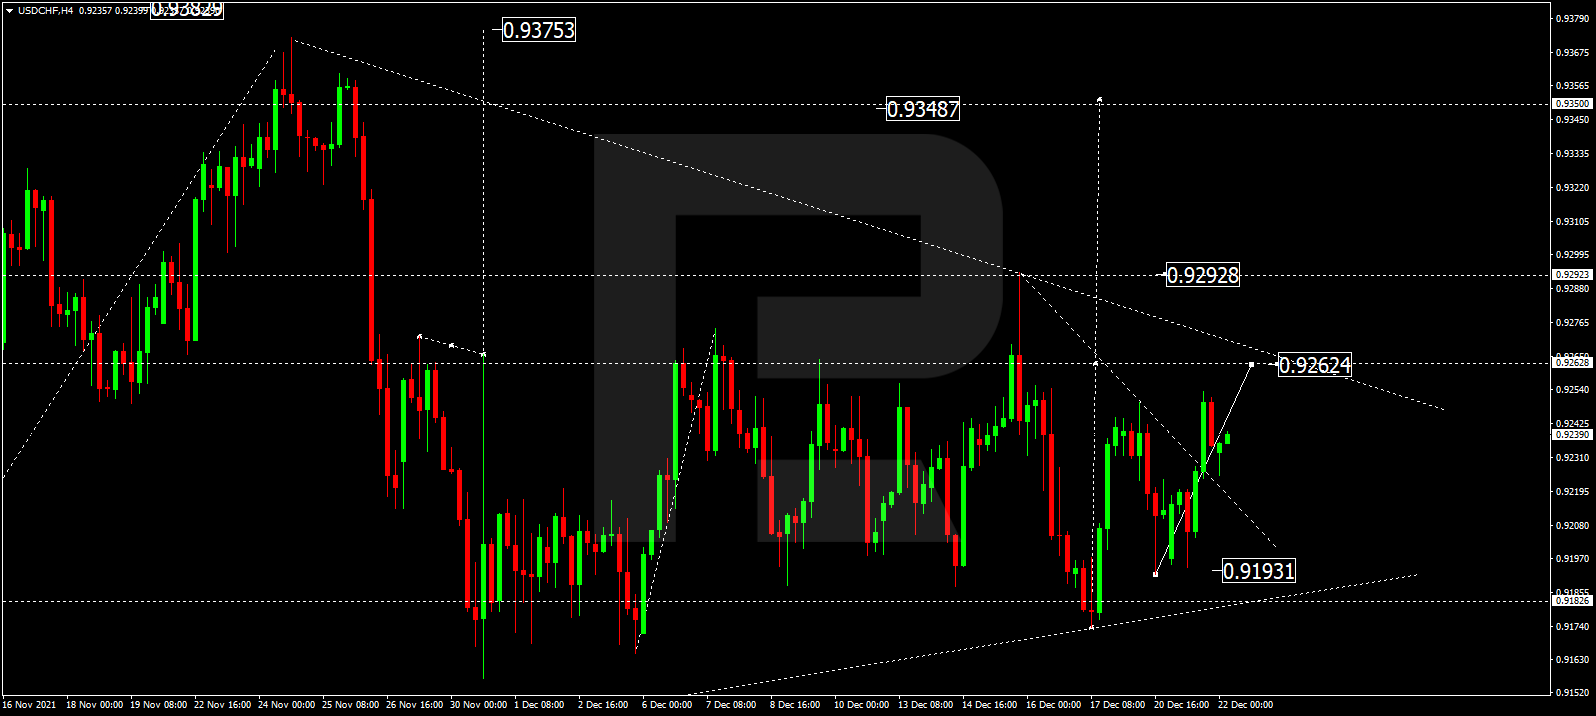
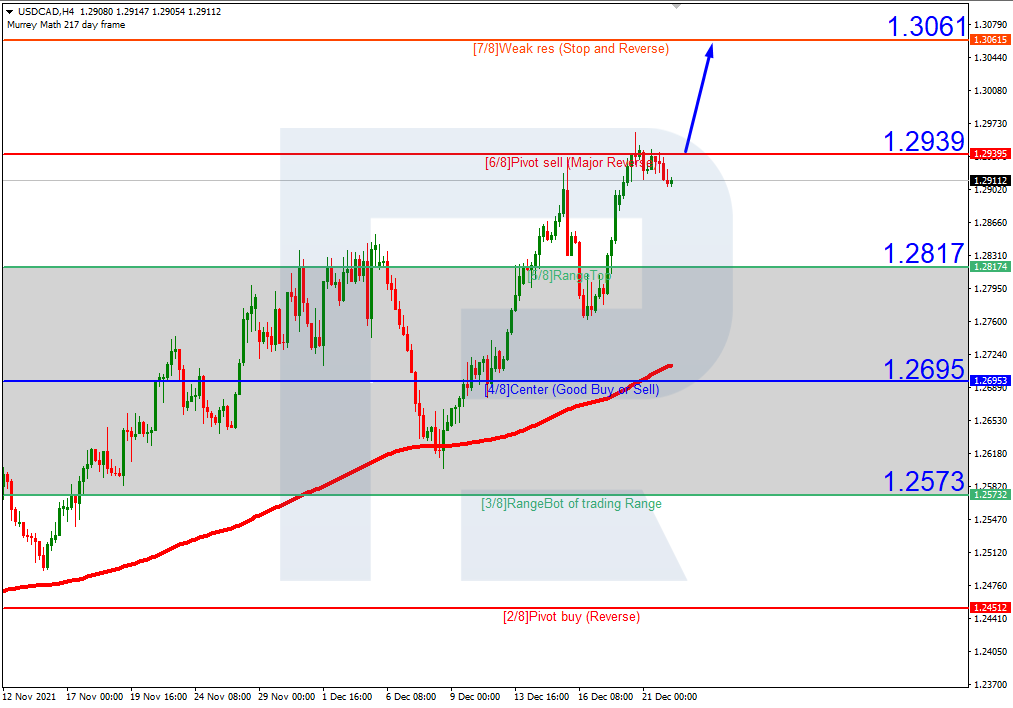
The USD/CAD currency pair
- Prev Open: 1.2911
- Prev Close: 1.2839
- % chg. over the last day: -0.56%
The US oil inventories decreased by 4.7 million barrels over the week. Analysts were expecting a decline of 2.8 million barrels. This was the second major drop. A supply shortage almost always pushes prices higher. The Canadian dollar is a commodity currency, which correlates strongly with oil prices. A rise in oil prices leads to a strengthening of the Canadian currency.
- Support levels: 1.2828, 1.2721, 1.2677, 1.2638
- Resistance levels: 1.2903, 1.2951
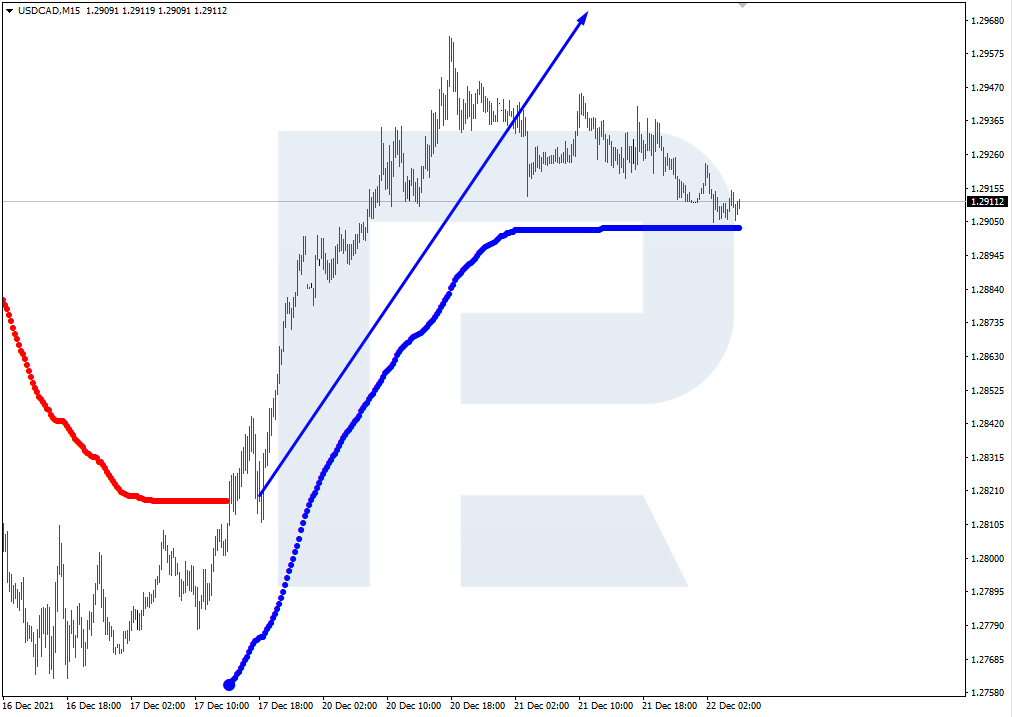
From a technical point of view, the USD/CAD currency pair trend is bullish. The MACD indicator became negative, the sellers’ pressure has increased. Under such market conditions, it is better to look for buy deals from the support levels near the moving average on the lower time frames. Sell deals should be considered from the resistance level of 1.2903, but with additional confirmation in the form of a sellers’ initiative.
Alternative scenario: if the price breaks down through the 1.2783 support level and fixes below, the downtrend will likely resume.

- – Canada GDP (q/q) at 15:30 (GMT+2).
by JustForex
This article reflects a personal opinion and should not be interpreted as an investment advice, and/or offer, and/or a persistent request for carrying out financial transactions, and/or a guarantee, and/or a forecast of future events.