By InvestMacro | COT | Data Tables | COT Leaders | Downloads | COT Newsletter
Here are the latest charts and statistics for the Commitment of Traders (COT) data published by the Commodities Futures Trading Commission (CFTC).
The latest COT data is updated through Tuesday March 1st and shows a quick view of how large traders (for-profit speculators and commercial entities) were positioned in the futures markets. All currency positions are in direct relation to the US dollar where, for example, a bet for the euro is a bet that the euro will rise versus the dollar while a bet against the euro will be a bet that the euro will decline versus the dollar.
Highlighting the COT currency data is the jump in bullish bets in the Brazilian Real currency futures contracts. Real speculators increased their bullish bets for a fourth straight week this week and by a total of +63,801 contracts over this four-week time-frame. This bullishness has taken the Real speculator level from -13,353 net positions on February 1st to +50,448 net positions this week. The current overall speculator standing has now climbed to the most bullish level on record, according to the CFTC data that goes back to the mid-1990’s and eclipsing the previous high set in 2017. The BRLUSD currency pair price has been in an uptrend since the beginning of the year and has reached the highest levels since June just below the 0.2000 exchange rate.
The currencies with higher speculator bets this week were the Brazil real (26,003 contracts), Mexican peso (25,553 contracts), Euro (5,633 contracts), British pound sterling (5,472 contracts), Canadian dollar (4,887 contracts), Australian dollar (5,744 contracts) and Bitcoin (363 contracts).
The currencies with lower speculator bets were the US Dollar Index (-1,310 contracts), Japanese yen (-5,545 contracts), Swiss franc (-4,261 contracts), New Zealand dollar (-2,621 contracts) and the Russian ruble (-9,843 contracts).
| Mar-01-2022 | OI | OI-Index | Spec-Net | Spec-Index | Com-Net | COM-Index | Smalls-Net | Smalls-Index |
|---|
| USD Index | 56,651 | 82 | 34,774 | 86 | -39,391 | 9 | 4,617 | 67 |
| EUR | 719,975 | 91 | 64,939 | 55 | -95,105 | 49 | 30,166 | 24 |
| GBP | 211,869 | 46 | -337 | 74 | 14,129 | 38 | -13,792 | 27 |
| JPY | 208,629 | 61 | -68,732 | 25 | 79,535 | 76 | -10,803 | 27 |
| CHF | 47,273 | 24 | -15,248 | 43 | 20,862 | 54 | -5,614 | 47 |
| CAD | 143,507 | 26 | 14,140 | 61 | -21,586 | 42 | 7,446 | 45 |
| AUD | 189,667 | 75 | -78,336 | 12 | 87,737 | 84 | -9,401 | 30 |
| NZD | 50,389 | 44 | -14,172 | 47 | 16,090 | 55 | -1,918 | 30 |
| MXN | 154,664 | 28 | 42,378 | 45 | -45,811 | 54 | 3,433 | 58 |
| RUB | 24,753 | 11 | 9,674 | 36 | -9,068 | 65 | -606 | 18 |
| BRL | 94,577 | 100 | 24,445 | 74 | -27,081 | 25 | 2,636 | 97 |
| Bitcoin | 9,980 | 51 | 80 | 99 | -517 | 0 | 437 | 23 |
US Dollar Index Futures:
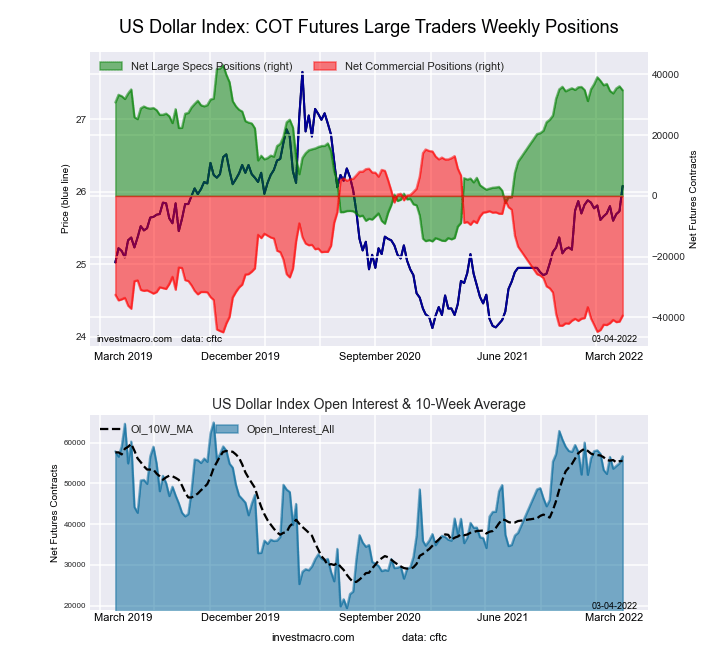 The US Dollar Index large speculator standing this week equaled a net position of 34,774 contracts in the data reported through Tuesday. This was a weekly fall of -1,310 contracts from the previous week which had a total of 36,084 net contracts.
This week’s current strength score (the trader positioning range over the past three years, measured from 0 to 100) shows the speculators are currently Bullish-Extreme with a score of 85.8 percent. The commercials are Bearish-Extreme with a score of 9.1 percent and the small traders (not shown in chart) are Bullish with a score of 67.0 percent.
| US DOLLAR INDEX Statistics | SPECULATORS | COMMERCIALS | SMALL TRADERS |
| – Percent of Open Interest Longs: | 77.2 | 8.5 | 10.5 |
| – Percent of Open Interest Shorts: | 15.9 | 78.1 | 2.3 |
| – Net Position: | 34,774 | -39,391 | 4,617 |
| – Gross Longs: | 43,761 | 4,831 | 5,942 |
| – Gross Shorts: | 8,987 | 44,222 | 1,325 |
| – Long to Short Ratio: | 4.9 to 1 | 0.1 to 1 | 4.5 to 1 |
| NET POSITION TREND: | | | |
| – Strength Index Score (3 Year Range Pct): | 85.8 | 9.1 | 67.0 |
| – Strength Index Reading (3 Year Range): | Bullish-Extreme | Bearish-Extreme | Bullish |
| NET POSITION MOVEMENT INDEX: | | | |
| – 6-Week Change in Strength Index: | -2.9 | 5.0 | -14.7 |
Euro Currency Futures:
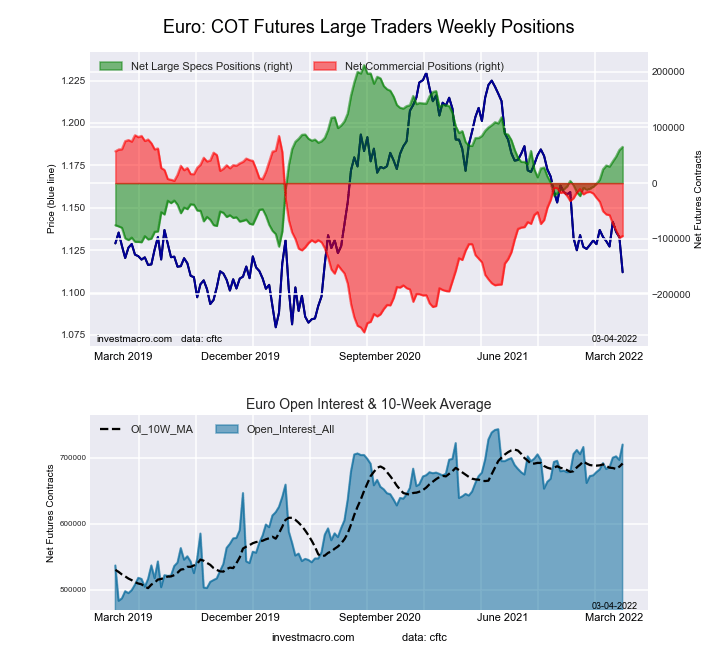 The Euro Currency large speculator standing this week equaled a net position of 64,939 contracts in the data reported through Tuesday. This was a weekly boost of 5,633 contracts from the previous week which had a total of 59,306 net contracts.
This week’s current strength score (the trader positioning range over the past three years, measured from 0 to 100) shows the speculators are currently Bullish with a score of 54.9 percent. The commercials are Bearish with a score of 48.8 percent and the small traders (not shown in chart) are Bearish with a score of 24.4 percent.
| EURO Currency Statistics | SPECULATORS | COMMERCIALS | SMALL TRADERS |
| – Percent of Open Interest Longs: | 31.7 | 54.2 | 11.7 |
| – Percent of Open Interest Shorts: | 22.7 | 67.4 | 7.5 |
| – Net Position: | 64,939 | -95,105 | 30,166 |
| – Gross Longs: | 228,385 | 390,260 | 84,321 |
| – Gross Shorts: | 163,446 | 485,365 | 54,155 |
| – Long to Short Ratio: | 1.4 to 1 | 0.8 to 1 | 1.6 to 1 |
| NET POSITION TREND: | | | |
| – Strength Index Score (3 Year Range Pct): | 54.9 | 48.8 | 24.4 |
| – Strength Index Reading (3 Year Range): | Bullish | Bearish | Bearish |
| NET POSITION MOVEMENT INDEX: | | | |
| – 6-Week Change in Strength Index: | 12.4 | -12.6 | 7.1 |
British Pound Sterling Futures:
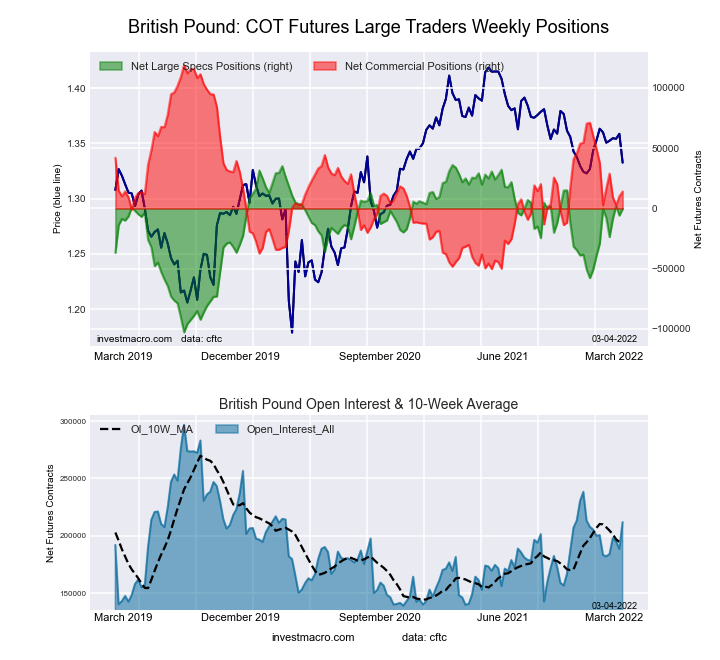 The British Pound Sterling large speculator standing this week equaled a net position of -337 contracts in the data reported through Tuesday. This was a weekly lift of 5,472 contracts from the previous week which had a total of -5,809 net contracts.
This week’s current strength score (the trader positioning range over the past three years, measured from 0 to 100) shows the speculators are currently Bullish with a score of 73.8 percent. The commercials are Bearish with a score of 38.0 percent and the small traders (not shown in chart) are Bearish with a score of 27.1 percent.
| BRITISH POUND Statistics | SPECULATORS | COMMERCIALS | SMALL TRADERS |
| – Percent of Open Interest Longs: | 22.5 | 62.1 | 10.6 |
| – Percent of Open Interest Shorts: | 22.7 | 55.4 | 17.2 |
| – Net Position: | -337 | 14,129 | -13,792 |
| – Gross Longs: | 47,679 | 131,583 | 22,551 |
| – Gross Shorts: | 48,016 | 117,454 | 36,343 |
| – Long to Short Ratio: | 1.0 to 1 | 1.1 to 1 | 0.6 to 1 |
| NET POSITION TREND: | | | |
| – Strength Index Score (3 Year Range Pct): | 73.8 | 38.0 | 27.1 |
| – Strength Index Reading (3 Year Range): | Bullish | Bearish | Bearish |
| NET POSITION MOVEMENT INDEX: | | | |
| – 6-Week Change in Strength Index: | -0.1 | 6.7 | -23.2 |
Japanese Yen Futures:
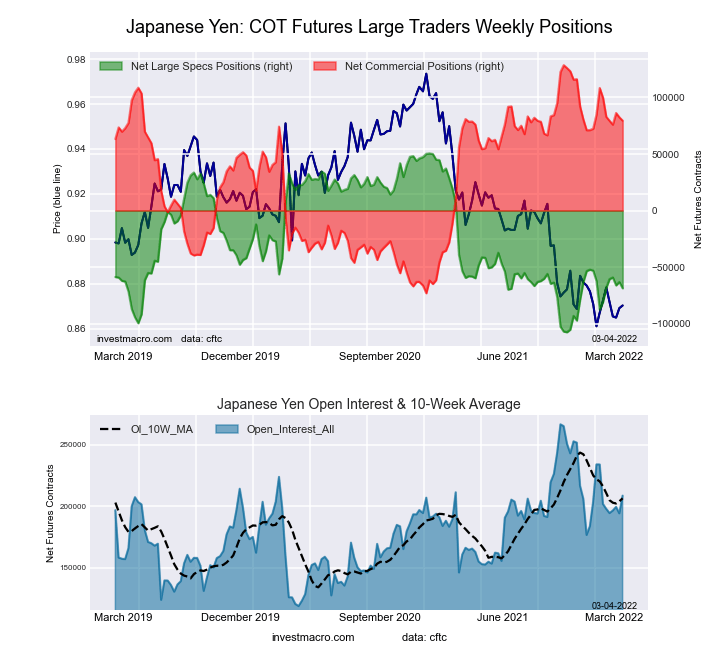 The Japanese Yen large speculator standing this week equaled a net position of -68,732 contracts in the data reported through Tuesday. This was a weekly decrease of -5,545 contracts from the previous week which had a total of -63,187 net contracts.
This week’s current strength score (the trader positioning range over the past three years, measured from 0 to 100) shows the speculators are currently Bearish with a score of 24.6 percent. The commercials are Bullish with a score of 75.7 percent and the small traders (not shown in chart) are Bearish with a score of 26.5 percent.
| JAPANESE YEN Statistics | SPECULATORS | COMMERCIALS | SMALL TRADERS |
| – Percent of Open Interest Longs: | 7.0 | 80.3 | 10.7 |
| – Percent of Open Interest Shorts: | 40.0 | 42.2 | 15.9 |
| – Net Position: | -68,732 | 79,535 | -10,803 |
| – Gross Longs: | 14,665 | 167,605 | 22,407 |
| – Gross Shorts: | 83,397 | 88,070 | 33,210 |
| – Long to Short Ratio: | 0.2 to 1 | 1.9 to 1 | 0.7 to 1 |
| NET POSITION TREND: | | | |
| – Strength Index Score (3 Year Range Pct): | 24.6 | 75.7 | 26.5 |
| – Strength Index Reading (3 Year Range): | Bearish | Bullish | Bearish |
| NET POSITION MOVEMENT INDEX: | | | |
| – 6-Week Change in Strength Index: | 7.7 | -10.0 | 17.5 |
Swiss Franc Futures:
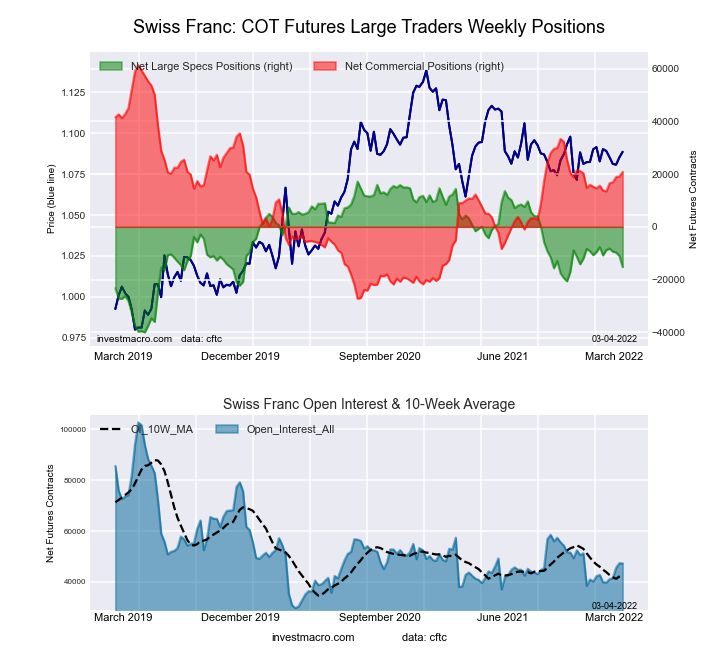 The Swiss Franc large speculator standing this week equaled a net position of -15,248 contracts in the data reported through Tuesday. This was a weekly reduction of -4,261 contracts from the previous week which had a total of -10,987 net contracts.
This week’s current strength score (the trader positioning range over the past three years, measured from 0 to 100) shows the speculators are currently Bearish with a score of 43.3 percent. The commercials are Bullish with a score of 54.3 percent and the small traders (not shown in chart) are Bearish with a score of 46.8 percent.
| SWISS FRANC Statistics | SPECULATORS | COMMERCIALS | SMALL TRADERS |
| – Percent of Open Interest Longs: | 3.5 | 74.1 | 21.4 |
| – Percent of Open Interest Shorts: | 35.7 | 30.0 | 33.3 |
| – Net Position: | -15,248 | 20,862 | -5,614 |
| – Gross Longs: | 1,651 | 35,045 | 10,127 |
| – Gross Shorts: | 16,899 | 14,183 | 15,741 |
| – Long to Short Ratio: | 0.1 to 1 | 2.5 to 1 | 0.6 to 1 |
| NET POSITION TREND: | | | |
| – Strength Index Score (3 Year Range Pct): | 43.3 | 54.3 | 46.8 |
| – Strength Index Reading (3 Year Range): | Bearish | Bullish | Bearish |
| NET POSITION MOVEMENT INDEX: | | | |
| – 6-Week Change in Strength Index: | -7.8 | 8.0 | -7.7 |
Canadian Dollar Futures:
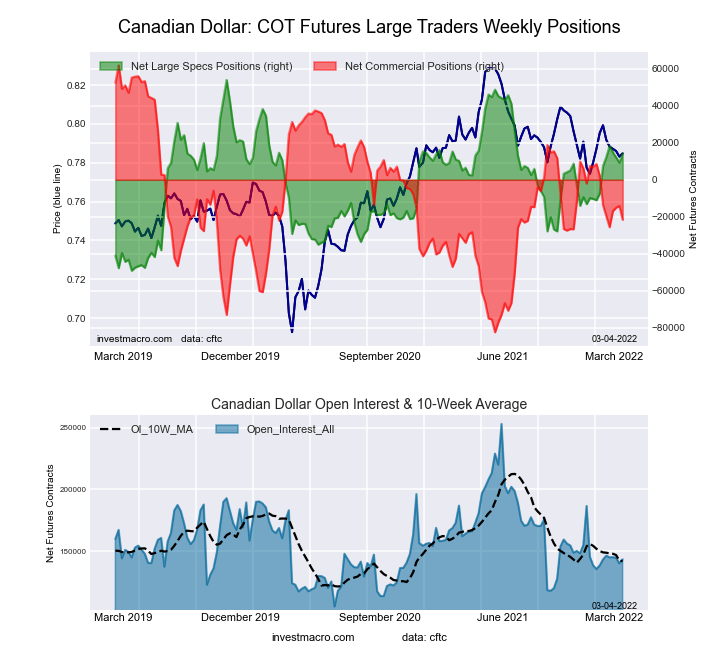 The Canadian Dollar large speculator standing this week equaled a net position of 14,140 contracts in the data reported through Tuesday. This was a weekly increase of 4,887 contracts from the previous week which had a total of 9,253 net contracts.
This week’s current strength score (the trader positioning range over the past three years, measured from 0 to 100) shows the speculators are currently Bullish with a score of 61.4 percent. The commercials are Bearish with a score of 42.2 percent and the small traders (not shown in chart) are Bearish with a score of 44.6 percent.
| CANADIAN DOLLAR Statistics | SPECULATORS | COMMERCIALS | SMALL TRADERS |
| – Percent of Open Interest Longs: | 35.5 | 40.1 | 21.5 |
| – Percent of Open Interest Shorts: | 25.6 | 55.2 | 16.3 |
| – Net Position: | 14,140 | -21,586 | 7,446 |
| – Gross Longs: | 50,881 | 57,576 | 30,817 |
| – Gross Shorts: | 36,741 | 79,162 | 23,371 |
| – Long to Short Ratio: | 1.4 to 1 | 0.7 to 1 | 1.3 to 1 |
| NET POSITION TREND: | | | |
| – Strength Index Score (3 Year Range Pct): | 61.4 | 42.2 | 44.6 |
| – Strength Index Reading (3 Year Range): | Bullish | Bearish | Bearish |
| NET POSITION MOVEMENT INDEX: | | | |
| – 6-Week Change in Strength Index: | 6.4 | -5.4 | 2.4 |
Australian Dollar Futures:
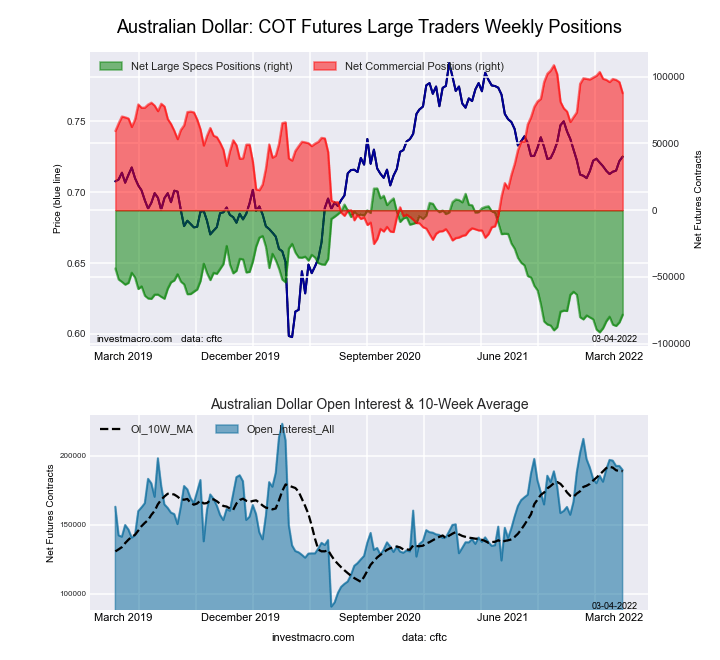 The Australian Dollar large speculator standing this week equaled a net position of -78,336 contracts in the data reported through Tuesday. This was a weekly advance of 5,744 contracts from the previous week which had a total of -84,080 net contracts.
This week’s current strength score (the trader positioning range over the past three years, measured from 0 to 100) shows the speculators are currently Bearish-Extreme with a score of 12.2 percent. The commercials are Bullish-Extreme with a score of 84.4 percent and the small traders (not shown in chart) are Bearish with a score of 29.5 percent.
| AUSTRALIAN DOLLAR Statistics | SPECULATORS | COMMERCIALS | SMALL TRADERS |
| – Percent of Open Interest Longs: | 6.7 | 80.1 | 10.5 |
| – Percent of Open Interest Shorts: | 48.0 | 33.8 | 15.4 |
| – Net Position: | -78,336 | 87,737 | -9,401 |
| – Gross Longs: | 12,720 | 151,922 | 19,865 |
| – Gross Shorts: | 91,056 | 64,185 | 29,266 |
| – Long to Short Ratio: | 0.1 to 1 | 2.4 to 1 | 0.7 to 1 |
| NET POSITION TREND: | | | |
| – Strength Index Score (3 Year Range Pct): | 12.2 | 84.4 | 29.5 |
| – Strength Index Reading (3 Year Range): | Bearish-Extreme | Bullish-Extreme | Bearish |
| NET POSITION MOVEMENT INDEX: | | | |
| – 6-Week Change in Strength Index: | 9.4 | -8.0 | 1.6 |
New Zealand Dollar Futures:
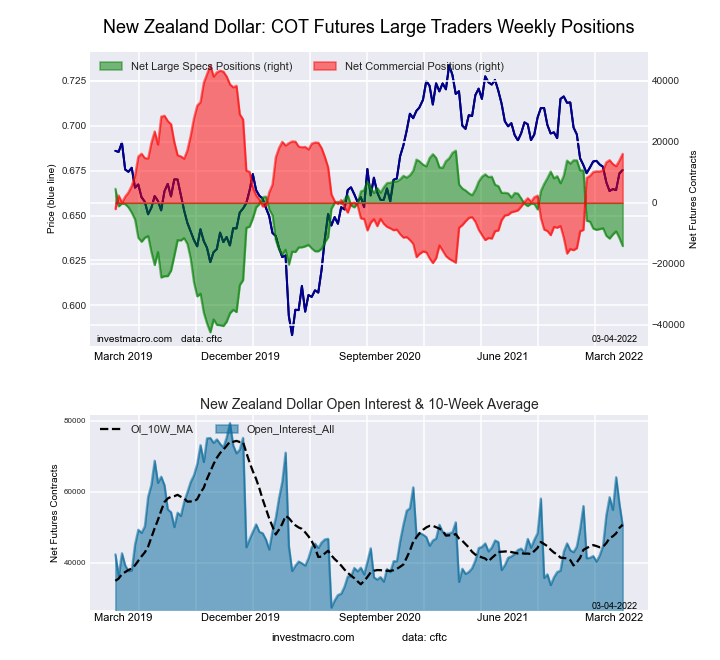 The New Zealand Dollar large speculator standing this week equaled a net position of -14,172 contracts in the data reported through Tuesday. This was a weekly reduction of -2,621 contracts from the previous week which had a total of -11,551 net contracts.
This week’s current strength score (the trader positioning range over the past three years, measured from 0 to 100) shows the speculators are currently Bearish with a score of 47.5 percent. The commercials are Bullish with a score of 55.2 percent and the small traders (not shown in chart) are Bearish with a score of 29.9 percent.
| NEW ZEALAND DOLLAR Statistics | SPECULATORS | COMMERCIALS | SMALL TRADERS |
| – Percent of Open Interest Longs: | 20.8 | 72.1 | 5.3 |
| – Percent of Open Interest Shorts: | 48.9 | 40.2 | 9.1 |
| – Net Position: | -14,172 | 16,090 | -1,918 |
| – Gross Longs: | 10,485 | 36,326 | 2,665 |
| – Gross Shorts: | 24,657 | 20,236 | 4,583 |
| – Long to Short Ratio: | 0.4 to 1 | 1.8 to 1 | 0.6 to 1 |
| NET POSITION TREND: | | | |
| – Strength Index Score (3 Year Range Pct): | 47.5 | 55.2 | 29.9 |
| – Strength Index Reading (3 Year Range): | Bearish | Bullish | Bearish |
| NET POSITION MOVEMENT INDEX: | | | |
| – 6-Week Change in Strength Index: | -9.8 | 8.4 | 4.3 |
Mexican Peso Futures:
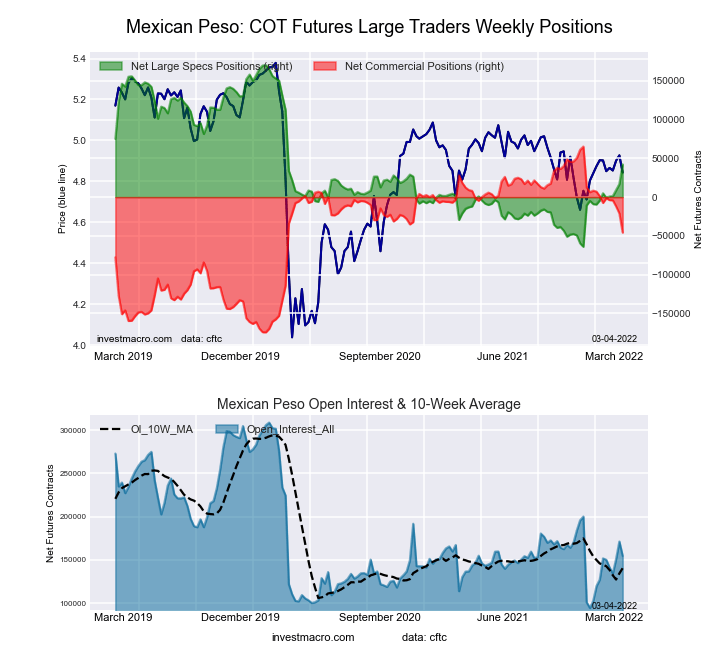 The Mexican Peso large speculator standing this week equaled a net position of 42,378 contracts in the data reported through Tuesday. This was a weekly advance of 25,553 contracts from the previous week which had a total of 16,825 net contracts.
This week’s current strength score (the trader positioning range over the past three years, measured from 0 to 100) shows the speculators are currently Bearish with a score of 45.4 percent. The commercials are Bullish with a score of 53.7 percent and the small traders (not shown in chart) are Bullish with a score of 57.6 percent.
| MEXICAN PESO Statistics | SPECULATORS | COMMERCIALS | SMALL TRADERS |
| – Percent of Open Interest Longs: | 48.5 | 46.9 | 4.1 |
| – Percent of Open Interest Shorts: | 21.1 | 76.5 | 1.9 |
| – Net Position: | 42,378 | -45,811 | 3,433 |
| – Gross Longs: | 74,971 | 72,497 | 6,306 |
| – Gross Shorts: | 32,593 | 118,308 | 2,873 |
| – Long to Short Ratio: | 2.3 to 1 | 0.6 to 1 | 2.2 to 1 |
| NET POSITION TREND: | | | |
| – Strength Index Score (3 Year Range Pct): | 45.4 | 53.7 | 57.6 |
| – Strength Index Reading (3 Year Range): | Bearish | Bullish | Bullish |
| NET POSITION MOVEMENT INDEX: | | | |
| – 6-Week Change in Strength Index: | 16.0 | -16.0 | 3.7 |
Brazilian Real Futures:
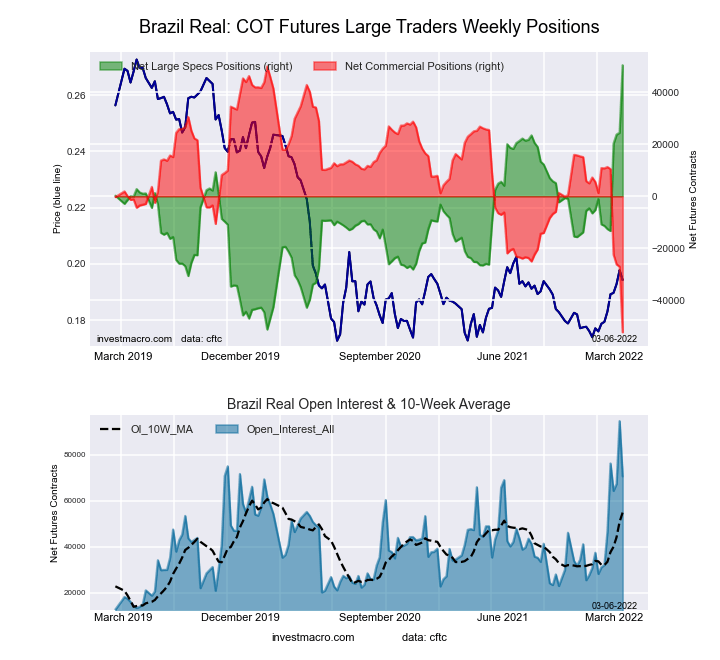
The Brazilian Real large speculator standing this week equaled a net position of 24,445 contracts in the data reported through Tuesday. This was a weekly boost of 685 contracts from the previous week which had a total of 23,760 net contracts.
This week’s current strength score (the trader positioning range over the past three years, measured from 0 to 100) shows the speculators are currently Bullish with a score of 74.4 percent. The commercials are Bearish with a score of 24.7 percent and the small traders (not shown in chart) are Bullish-Extreme with a score of 97.0 percent.
| BRAZIL REAL Statistics | SPECULATORS | COMMERCIALS | SMALL TRADERS |
| – Percent of Open Interest Longs: | 55.0 | 40.2 | 4.8 |
| – Percent of Open Interest Shorts: | 29.1 | 68.9 | 2.0 |
| – Net Position: | 24,445 | -27,081 | 2,636 |
| – Gross Longs: | 51,990 | 38,039 | 4,541 |
| – Gross Shorts: | 27,545 | 65,120 | 1,905 |
| – Long to Short Ratio: | 1.9 to 1 | 0.6 to 1 | 2.4 to 1 |
| NET POSITION TREND: | | | |
| – Strength Index Score (3 Year Range Pct): | 74.4 | 24.7 | 97.0 |
| – Strength Index Reading (3 Year Range): | Bullish | Bearish | Bullish-Extreme |
| NET POSITION MOVEMENT INDEX: | | | |
| – 6-Week Change in Strength Index: | 34.7 | -37.1 | 31.8 |
Russian Ruble Futures:
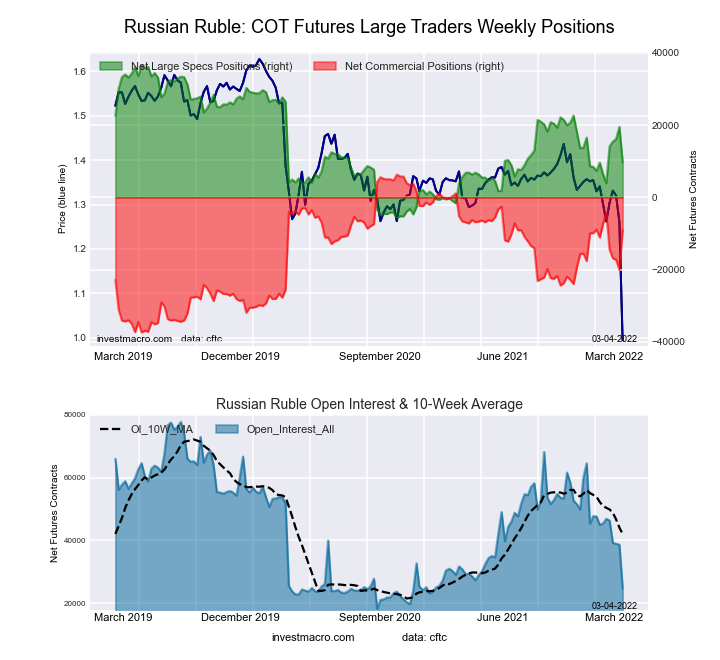 The Russian Ruble large speculator standing this week equaled a net position of 9,674 contracts in the data reported through Tuesday. This was a weekly reduction of -9,843 contracts from the previous week which had a total of 19,517 net contracts.
This week’s current strength score (the trader positioning range over the past three years, measured from 0 to 100) shows the speculators are currently Bearish with a score of 36.3 percent. The commercials are Bullish with a score of 64.8 percent and the small traders (not shown in chart) are Bearish-Extreme with a score of 18.1 percent.
| RUSSIAN RUBLE Statistics | SPECULATORS | COMMERCIALS | SMALL TRADERS |
| – Percent of Open Interest Longs: | 44.6 | 51.9 | 3.5 |
| – Percent of Open Interest Shorts: | 5.6 | 88.5 | 5.9 |
| – Net Position: | 9,674 | -9,068 | -606 |
| – Gross Longs: | 11,050 | 12,848 | 855 |
| – Gross Shorts: | 1,376 | 21,916 | 1,461 |
| – Long to Short Ratio: | 8.0 to 1 | 0.6 to 1 | 0.6 to 1 |
| NET POSITION TREND: | | | |
| – Strength Index Score (3 Year Range Pct): | 36.3 | 64.8 | 18.1 |
| – Strength Index Reading (3 Year Range): | Bearish | Bullish | Bearish-Extreme |
| NET POSITION MOVEMENT INDEX: | | | |
| – 6-Week Change in Strength Index: | 7.7 | -4.2 | -39.0 |
Bitcoin Futures:
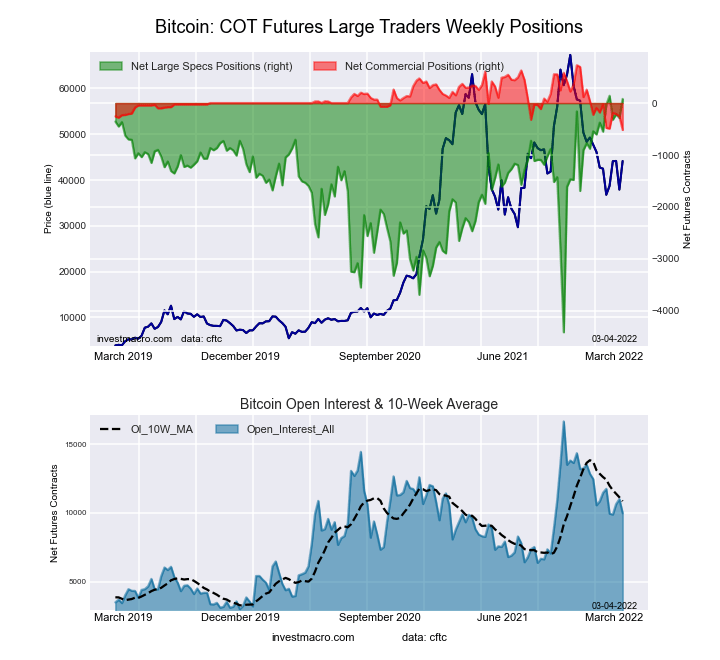 The Bitcoin large speculator standing this week equaled a net position of 80 contracts in the data reported through Tuesday. This was a weekly rise of 363 contracts from the previous week which had a total of -283 net contracts.
This week’s current strength score (the trader positioning range over the past three years, measured from 0 to 100) shows the speculators are currently Bullish-Extreme with a score of 98.7 percent. The commercials are Bearish-Extreme with a score of 0.0 percent and the small traders (not shown in chart) are Bearish with a score of 22.9 percent.
| BITCOIN Statistics | SPECULATORS | COMMERCIALS | SMALL TRADERS |
| – Percent of Open Interest Longs: | 80.0 | 3.2 | 12.0 |
| – Percent of Open Interest Shorts: | 79.2 | 8.4 | 7.6 |
| – Net Position: | 80 | -517 | 437 |
| – Gross Longs: | 7,981 | 321 | 1,198 |
| – Gross Shorts: | 7,901 | 838 | 761 |
| – Long to Short Ratio: | 1.0 to 1 | 0.4 to 1 | 1.6 to 1 |
| NET POSITION TREND: | | | |
| – Strength Index Score (3 Year Range Pct): | 98.7 | 0.0 | 22.9 |
| – Strength Index Reading (3 Year Range): | Bullish-Extreme | Bearish-Extreme | Bearish |
| NET POSITION MOVEMENT INDEX: | | | |
| – 6-Week Change in Strength Index: | 13.8 | -39.7 | -3.0 |
Article By InvestMacro – Receive our weekly COT Reports by Email
*COT Report: The COT data, released weekly to the public each Friday, is updated through the most recent Tuesday (data is 3 days old) and shows a quick view of how large speculators or non-commercials (for-profit traders) were positioned in the futures markets.
The CFTC categorizes trader positions according to commercial hedgers (traders who use futures contracts for hedging as part of the business), non-commercials (large traders who speculate to realize trading profits) and nonreportable traders (usually small traders/speculators) as well as their open interest (contracts open in the market at time of reporting).See CFTC criteria here.


