The structure of USDCHF hints that at the end of November, the actionary wave y of the cycle degree ended. This was followed by a cycle intervening wave x.
The intervening wave x takes the form of a primary triple Ⓦ-Ⓧ-Ⓨ-Ⓧ-Ⓩ zigzag. Currently, there is a decrease in the price in the final wave Ⓩ, which takes the form of an intermediate double (W)-(X)-(Y) zigzag.
In the near future, the intermediate wave (Y) could end at the level of 0.904, as shown on the chart. At that level, wave x will be at 76.4% of wave y.
After the end of wave x, bulls can update the previous high of 0.937, marked by the intervening wave y.
According to an alternative scenario, the formation of the cycle intervening wave x is fully complete. Now we are seeing a price increase and the development of a cycle wave z.
The intervening wave Ⓧ took the form of a triple zigzag (W)-(X)-(Y)-(X)-(Z). The final actionary wave Ⓨ can likely be a double (W)-(X)-(Y) zigzag.
The intermediate wave (Y) could end at the 0.952 area. At that level, cycle waves z and y will be equal.
Orbex is a fully licensed broker that was established in 2011. Founded with a mission to serve its traders responsibly and provides traders with access to the world’s largest and most liquid financial markets. www.orbex.com
The Japanese yen softened after weaker-than-expected GDP in Q4. Despite choppiness in recent price action, confidence in the greenback remains high.
A failed attempt at the supply zone (115.80) suggests a lack of momentum, but a swift bounce off 114.65 reveals strong enough buying interest.
A bullish breakout would lead to the double top at 116.35. Its breach could end the two-month-long consolidation and trigger an extended rally towards January 2017’s highs around 118.00. 115.40 is fresh support.
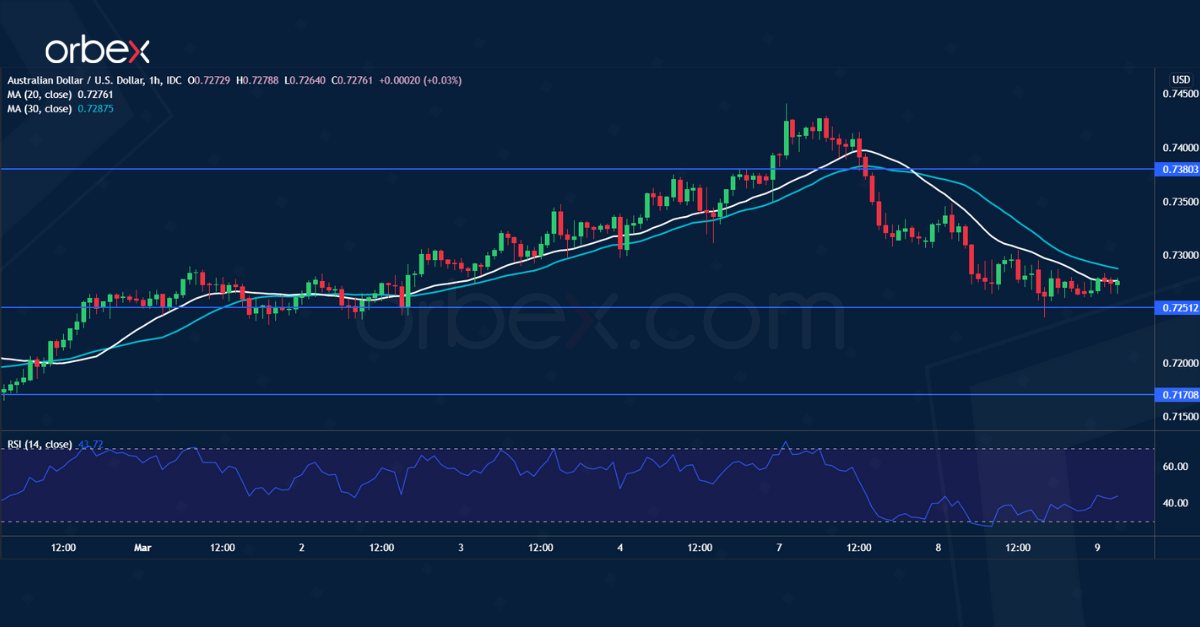
AUDUSD seeks support
The Australian dollar stalls as commodity prices consolidate. The rally above 0.7310, a major supply area, has weakened selling pressure and put the pair on a bullish reversal course.
The Aussie’s parabolic ascent and an overbought RSI prompted short-term buyers to take profit. As the RSI swings back into the oversold zone, the bulls may see the current fallback as an opportunity to stake in.
0.7380 is a fresh resistance and 0.7250 is the immediate support. Further below 0.7170 is a critical level to keep the rebound valid.
UK 100 sees limited bounce
The FTSE 100 struggles as the UK plans to ban Russian energy imports.
On the daily chart, a break below the demand zone (6850) wiped out 11-months worth of gains and signaled a strong bearish bias. The RSI’s oversold situation may cause a temporary rebound, but a bearish MA cross could attract more selling interest.
The liquidation is yet to end as medium-term buyers scramble for the exit. 7200 is a fresh resistance and 7450 is a major supply zone. A drop below 6800 may lead to 6500.
Orbex is a fully licensed broker that was established in 2011. Founded with a mission to serve its traders responsibly and provides traders with access to the world’s largest and most liquid financial markets. www.orbex.com
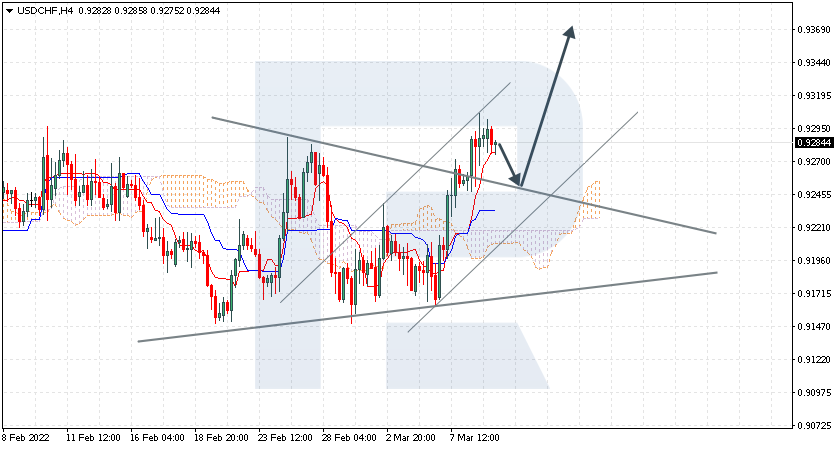
USDCHF is trading at 0.9284; the instrument is moving above Ichimoku Cloud, thus indicating an ascending tendency. The markets could indicate that the price may test Tenkan-Sen and Kijun-Sen at 0.9255 and then resume moving upwards to reach 0.9370. Another signal in favour of a further uptrend will be a rebound from the upside border of the Triangle pattern. However, the bullish scenario may no longer be valid if the price breaks the cloud’s downside border and fixes below 0.9165. In this case, the pair may continue falling towards 0.9075.
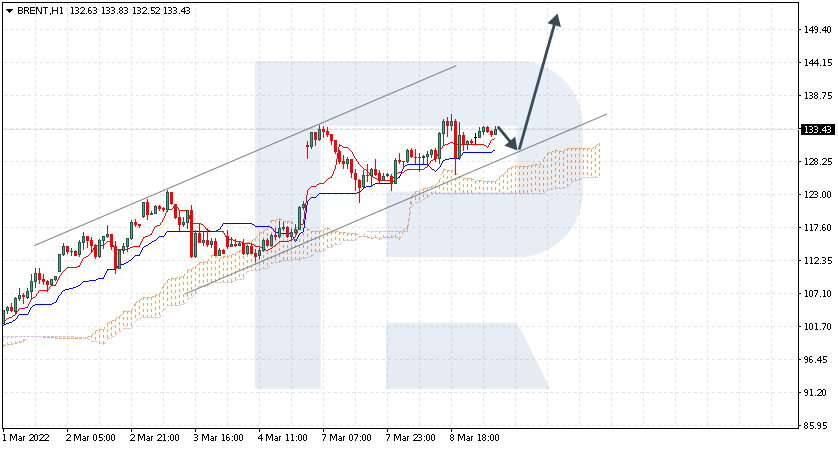
BRENT
Brent is trading at 133.43; the instrument is moving above Ichimoku Cloud, thus indicating an ascending tendency. The markets could indicate that the price may test Tenkan-Sen and Kijun-Sen at 130.55 and then resume moving upwards to reach 150.05. Another signal in favour of a further uptrend will be a rebound from the rising channel’s downside border. However, the bullish scenario may no longer be valid if the price breaks the cloud’s downside border and fixes below 120.00. In this case, the pair may continue falling towards 110.55.
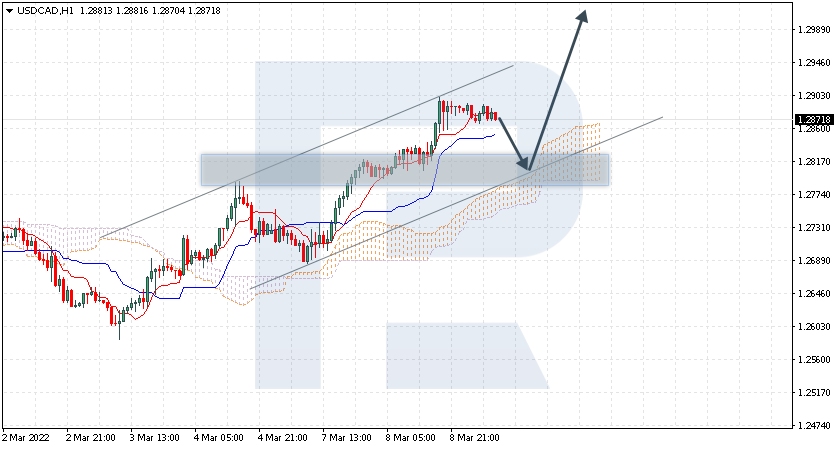
USDCAD
USDCAD is trading at 1.2871; the instrument is moving above Ichimoku Cloud, thus indicating an ascending tendency. The markets could indicate that the price may test the cloud’s upside border at 1.2815 and then resume moving upwards to reach 1.3035. Another signal in favour of a further uptrend will be a rebound from the rising channel’s downside border. However, the bullish scenario may no longer be valid if the price breaks the cloud’s downside border and fixes below 1.2735. In this case, the pair may continue falling towards 1.2645.
Attention! Forecasts presented in this section only reflect the author’s private opinion and should not be considered as guidance for trading. RoboForex LP bears no responsibility for trading results based on trading recommendations described in these analytical reviews.
The European currency has stopped falling as European countries want to issue new EU bonds. Europe is approaching stagflation. This is when economic growth starts to slow down when inflation is high. The sanctions imposed on Russia due to the invasion of Ukraine are also hitting the European economy hard, and it is currently not possible to entirely replace gas and oil supplies from Russia.
Trading recommendations
Support levels: 1.0893, 1.0823, 1.0633
Resistance levels: 1.1001, 1.1061, 1.1213
From the technical point of view, the trend on the EUR/USD currency pair on the hourly time frame is bearish. The MACD indicator has become positive. The price has taken the sideways structure. Under such market conditions, it is better to look for sell deals on the intraday time frames from the resistance level of 1.1001. Buy deals should be considered from the support level of 1.0893, but only with short targets, as there are no fundamental reasons for the euro to strengthen now.
Alternative scenario: if the price breaks out through the 1.1061 resistance level and fixes above, the mid-term uptrend will likely resume.
News feed for 2022.03.09:
– US JOLTS Job Openings (m/m) at 17:00 (GMT+2).
The GBP/USD currency pair
Technical indicators of the currency pair:
Prev Open: 1.3105
Prev Close: 1.3099
% chg. over the last day: -0.05%
The British pound is now trading at its lowest level since December 2020. Despite Brexit, the UK economy is still strongly integrated into the European Union economy, so rising energy prices and sanctions against Russia have a negative impact on the British national currency. But on the other hand, thanks to the same Brexit and the fact that the Bank of England is tightening monetary policy, the UK will suffer the least from stagflation.
Trading recommendations
Support levels: 1.3091
Resistance levels: 1.3175, 1.3274, 1.3315, 1.3418
On the hourly time frame, the trend on the GBP/USD currency pair is bearish. Volatility is high, sellers’ pressure has stopped, the price started trading in a sideways range. The MACD indicator is showing a divergence towards buying. Under such market conditions, buy trades should be considered from the 1.3091 daily support level, but better with confirmation. The resistance level of 1.3175 is good for sell deals, but only with additional confirmation in the form of sellers’ initiative.
Alternative scenario: if the price breaks out through the 1.3315 resistance level and fixes above, the mid-term uptrend will likely resume.
There is no news feed for today.
The USD/JPY currency pair
Technical indicators of the currency pair:
Prev Open: 115.32
Prev Close: 115.67
% chg. over the last day: +0.30%
Japan’s GDP increased by 1.1% in the last quarter, against expectations of 1.3% growth. The Japanese yen and the US dollar are safe-haven currencies. Since there are currently no prospects for ending the war in Ukraine, investors are buying the yen as a protective asset against inflationary risks. At the same time, it should be remembered that the policy of the Japanese central bank is now aimed at making the Japanese yen cheaper (USD/JPY growth), and the US Federal Reserve will begin to tighten monetary policy this month. As a result, the USD/JPY currency pair is now trading in a wide price range with growth elements.
Trading recommendations
Support levels: 115.13, 114.71, 114.41
Resistance levels: 115.79, 116.32
The medium-term trend on the USD/JPY currency pair is bullish, but the structure is flatter, as the price has no single dynamics and the price is trading in a wide corridor. The MACD indicator has become positive, with long positions prevailing inside the day. But there are first signs of divergence. Under such market conditions, it is best to look for buy deals on the lower time frames from the support level of 115.13, but with additional confirmation. Sell deals should be considered from the resistance level of 115.79, but it is better to wait for the reaction of sellers.
Alternative scenario: if the price fixes below 115.13, the uptrend will likely be broken.
News feed for 2022.03.09:
– Japan GDP (q/q) at 01:50 (GMT+2).
The USD/CAD currency pair
Technical indicators of the currency pair:
Prev Open: 1.2819
Prev Close: 1.2889
% chg. over the last day: +0.55%
The situation on the USD/CAD currency pair remains the same. The Canadian dollar is a commodity currency, so it is highly dependent not only on the monetary policy of the Bank of Canada but also on the dynamics of oil prices and the dollar index. Investors buy the dollar index as a defensive asset in the war. Moreover, this month the Fed will begin tightening its monetary policy, providing additional support to the US currency. The growth of the dollar index leads to the growth of USD/CAD. However, it should be noted that the Bank of Canada has already begun to raise interest rates, and this, along with rising energy prices, will also help the Canadian currency.
Trading recommendations
Support levels: 1.2820, 1.2726, 1.2653, 1.2555, 1.2517
Resistance levels: 1.2890
In terms of technical analysis, the USD/CAD currency pair trend is bullish. The price is trading above the moving average lines, with long positions prevailing inside the day. The MACD indicator is in the positive zone, but the first signs of divergence are shown, which means the growth potential is limited. It is worth trading only with short targets because both oil and the dollar index are inclined to grow now. Under such market conditions, it is better to look for buy deals on the lower time frames from the support level of 1.2820, but it is better with additional confirmation. For sell deals, it is better to consider the resistance level of 1.2890.
Alternative scenario: if the price breaks through and consolidates below 1.2726, the downtrend will likely resume.
This article reflects a personal opinion and should not be interpreted as an investment advice, and/or offer, and/or a persistent request for carrying out financial transactions, and/or a guarantee, and/or a forecast of future events.
Calling all beginner Forex traders! We’ve put together a comprehensive webinar dedicated to teaching you how to trade the financial markets!
Next Monday, March 14th at 6 pm GMT, our seasoned market expert David Kindley will be going live on Zoom to cover all the basic forex calculations you need to begin your online trading journey.
Sign up now for a chance to learn:
How to calculate margins when trading
How to include leverages into your trades
How to calculate pips and points
How to set pending orders
The webinar is free to attend, but seats are limited.
Book your spot today to start trading responsibly!
Orbex is a fully licensed broker that was established in 2011. Founded with a mission to serve its traders responsibly and provides traders with access to the world’s largest and most liquid financial markets. www.orbex.com
The structure of the DXY index suggests the development of a large triple w-x-y-x-z zigzag of the cycle degree.
At the level of 94.593, the construction of the cycle intervening wave x possibly ended. This is a triple zigzag marked with sub-waves Ⓦ-Ⓧ-Ⓨ-Ⓧ-Ⓩ of the primary degree.
At the time of writing, a cycle actionary wave z is under construction. The internal structure of the wave z assumes a double Ⓦ-Ⓧ-Ⓨ zigzag. The first two parts of the double zigzag look fully complete. The primary wave Ⓨ is still under development, and it takes the form of a double zigzag (W)-(X)-(Y) of the intermediate degree.
The bulls could continue to push the price to the level of 100.276. At that level, wave z will be at 76.4% of the previous actionary wave y.
In the second scenario, the cycle actionary wave y is a primary triple zigzag.
Following wave y, prices are likely to lower and will begin to build a cycle intervening wave x.
It is possible that the price will fall to the 95.664 area, as indicated on the chart. At that level, wave x will be at 38.2% of wave y.
Orbex is a fully licensed broker that was established in 2011. Founded with a mission to serve its traders responsibly and provides traders with access to the world’s largest and most liquid financial markets. www.orbex.com
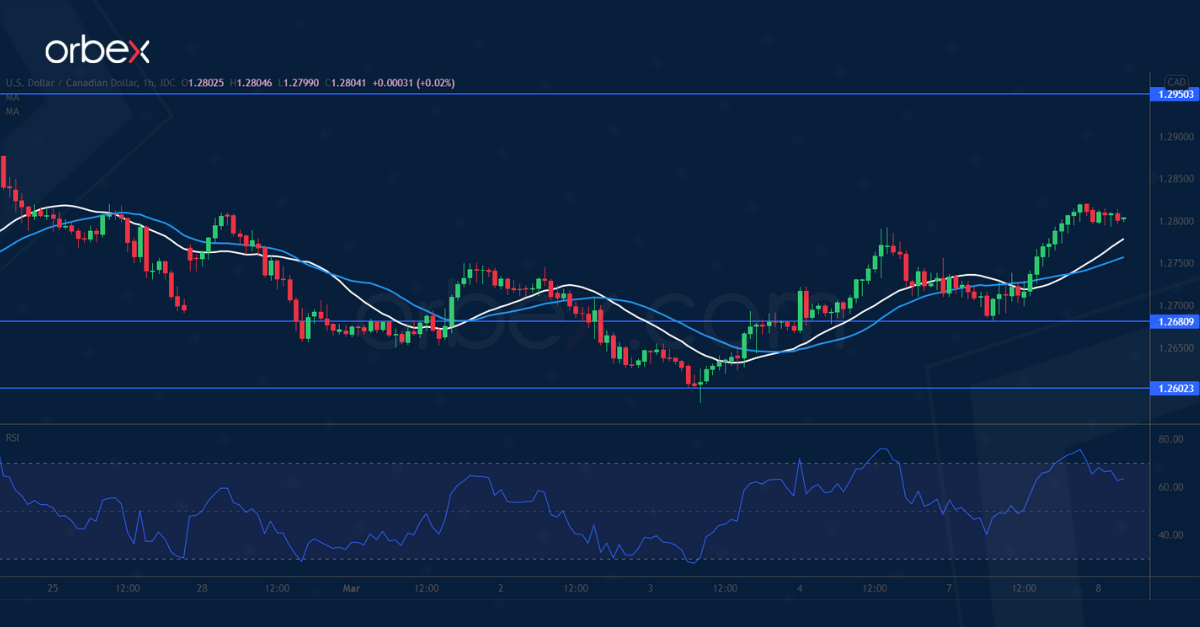
The US dollar bounces back as traders pile into safer currencies at the expense of commodity assets.
The previous rally above the supply zone at 1.2800 has prompted sellers to cover. Then a follow-up pullback saw support over 1.2600, a sign of accumulation and traders’ strong interest in keeping the greenback afloat.
A breakout above 1.2810 could pave the way for an extended rise to last December’s high at 1.2950, even though the RSI’s situation may briefly hold the bulls back. 1.2680 is a fresh support in case of a pullback.
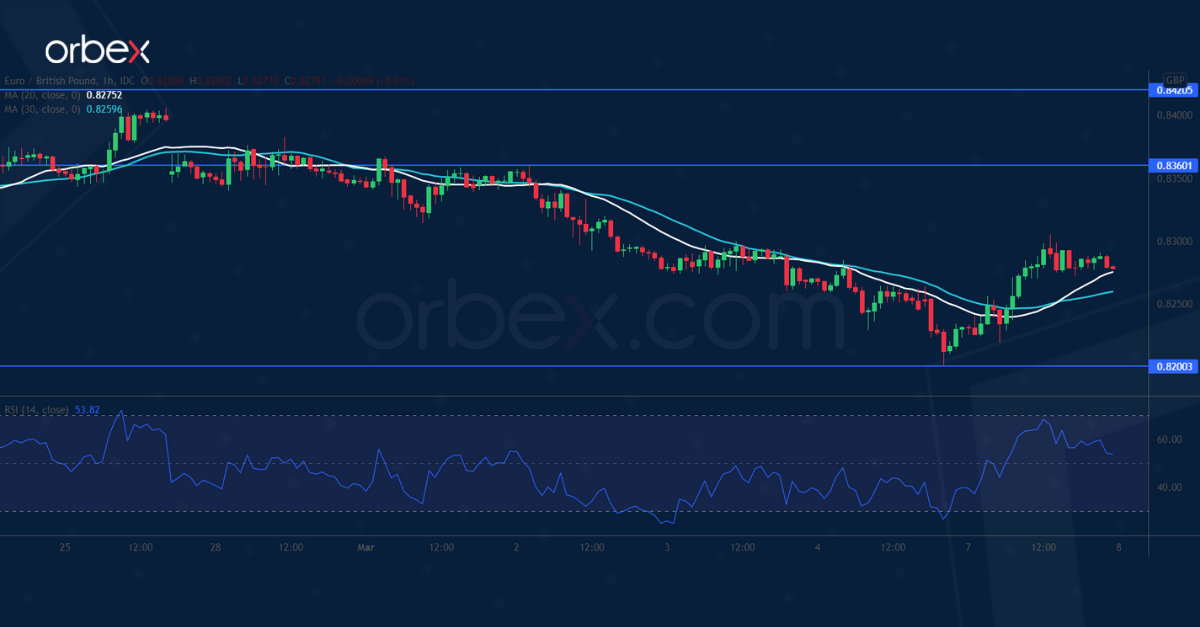
EURGBP bounces back
The euro recoups losses as shorts cover ahead of the ECB meeting. The pair’s fall below the major floor (0.8280) on the daily chart further weighs on sentiment.
The lack of support suggests that traders’ are wary of catching a falling knife. The RSI’s double-dip into the oversold area has led to profit-taking, driving the price up.
However, the rally could turn out to be a dead cat bounce if the bears fade the rebound in the supply zone around 0.8360. 0.8200 is a fresh support when momentum comes back again.
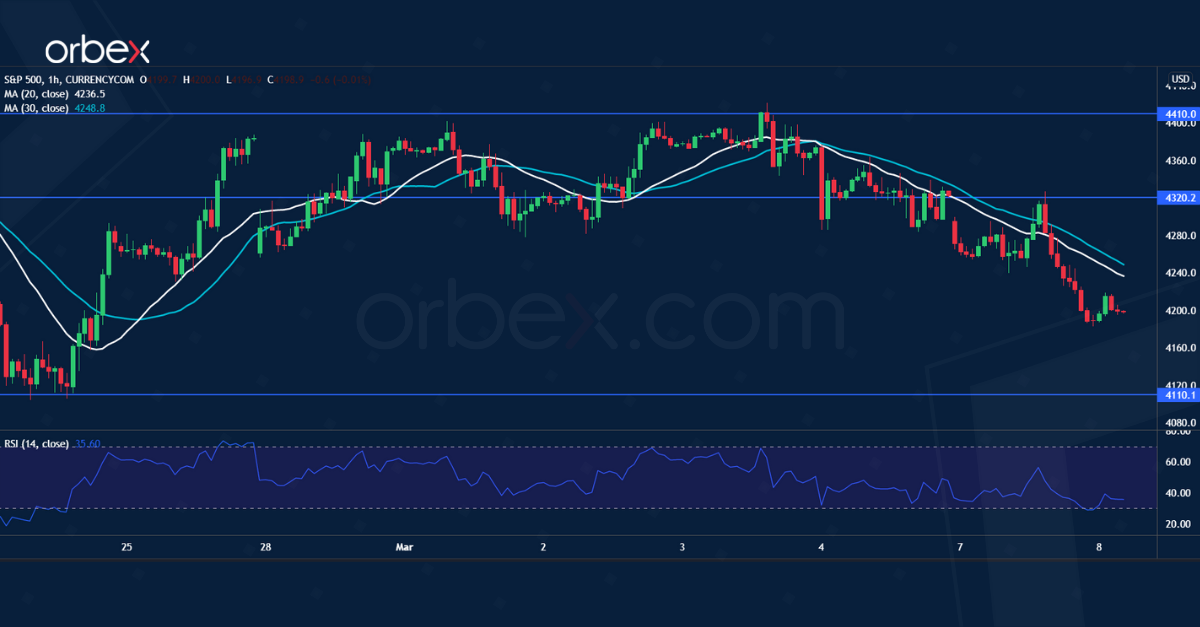
SPX 500 struggles to rebound
The S&P 500 extended losses as investors are wary of a global economic downturn.
On the daily chart, a brief rebound has met stiff selling pressure on the 30-day moving average (4410). In fact, this indicates that the bearish mood still dominates after the index fell through 4250. Buyers have failed to hold above 4230, leaving the market vulnerable to another round of sell-off.
4110 is the next stop and a bearish breakout could lead to the psychological level of 4000. 4320 is now the closest resistance ahead.
Orbex is a fully licensed broker that was established in 2011. Founded with a mission to serve its traders responsibly and provides traders with access to the world’s largest and most liquid financial markets. www.orbex.com
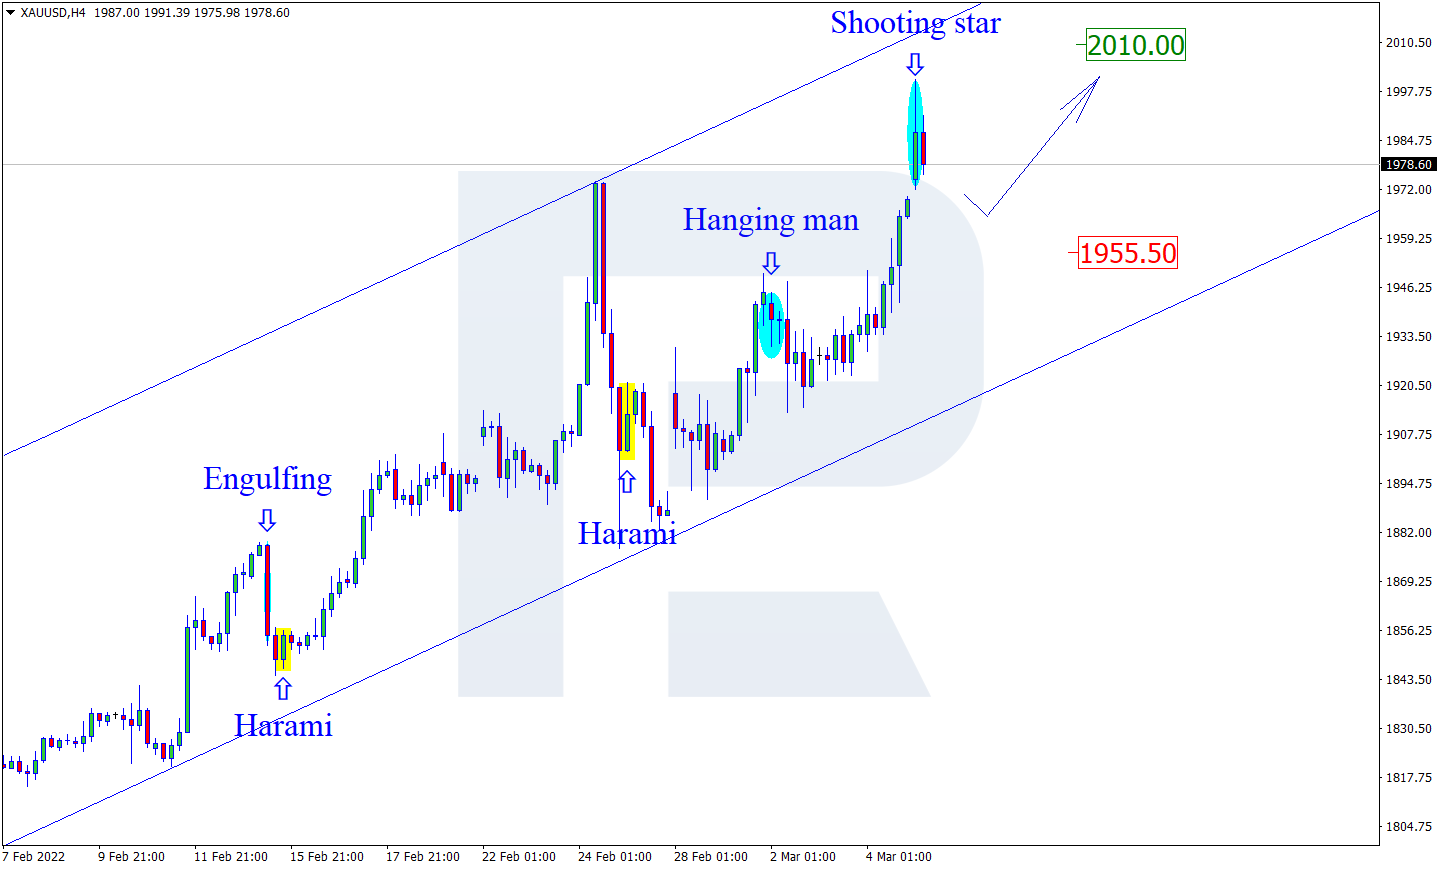
As we can see in the H4 chart, XAUUSD has formed a Shooting Star pattern not far from the resistance level. At the moment, the asset is reversing in the form a new descending impulse. In this case, the downside correctional target may be the support area at 1955.50. At the same time, an opposite scenario implies that the price may grow to reach 2010.00 and continue the ascending tendency without any corrections.
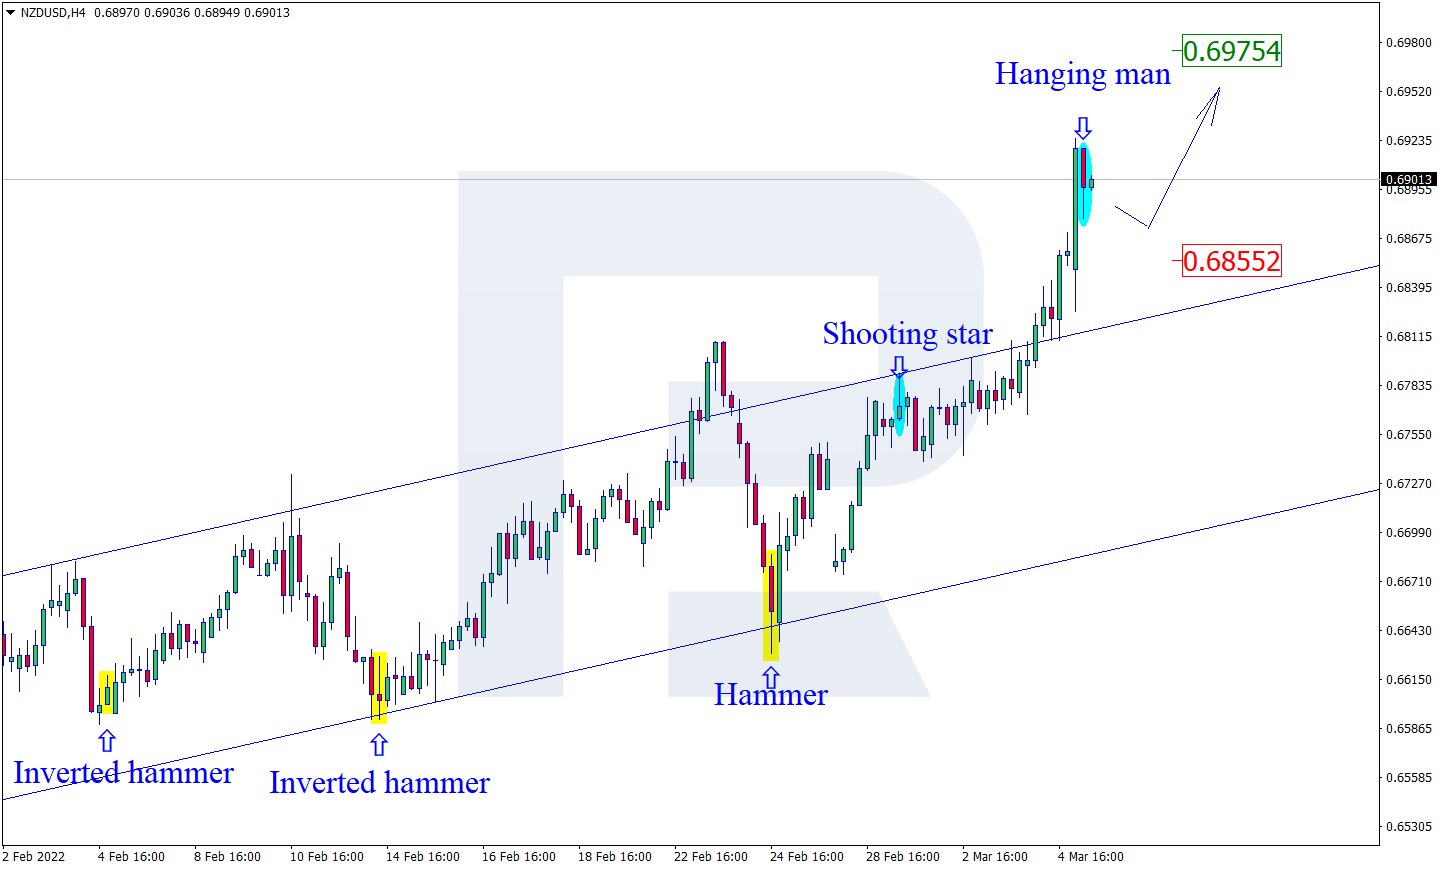
NZDUSD, “New Zealand vs US Dollar”
As we can see in the H4 chart, NZDUSD has formed a Hanging Man reversal pattern close to the resistance area. At the moment, the asset is reversing and may form a new correctional impulse towards the support level. In this case, the downside target is at 0.6855. After that, the asset may rebound from this level and resume moving upwards. However, an alternative scenario implies that the price may grow to reach 0.6975 without any corrections.
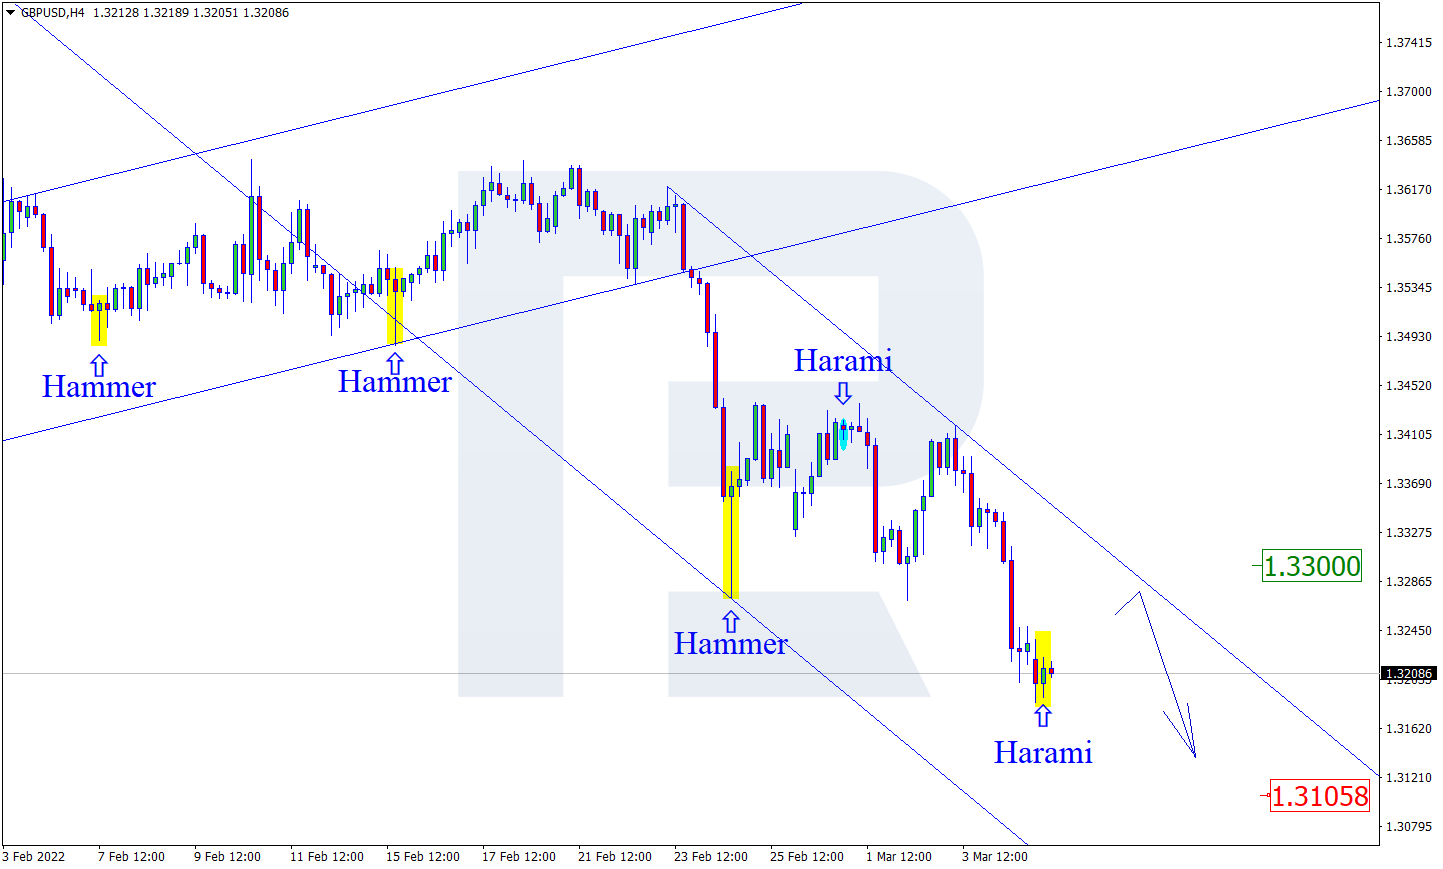
GBPUSD, “Great Britain Pound vs US Dollar”
As we can see in the H4 chart, GBPUSD has formed a Harami reversal pattern near the support area. At the moment, the pair is reversing in the form of a new ascending impulse. In this case, the upside target may be at 1.3300. After testing the resistance level, the market may rebound from it and resume trading downwards. Still, there might be an alternative scenario, according to which the asset may fall to reach 1.3105 and continue the downtrend without any corrections.
Attention! Forecasts presented in this section only reflect the author’s private opinion and should not be considered as guidance for trading. RoboForex LP bears no responsibility for trading results based on trading recommendations described in these analytical reviews.
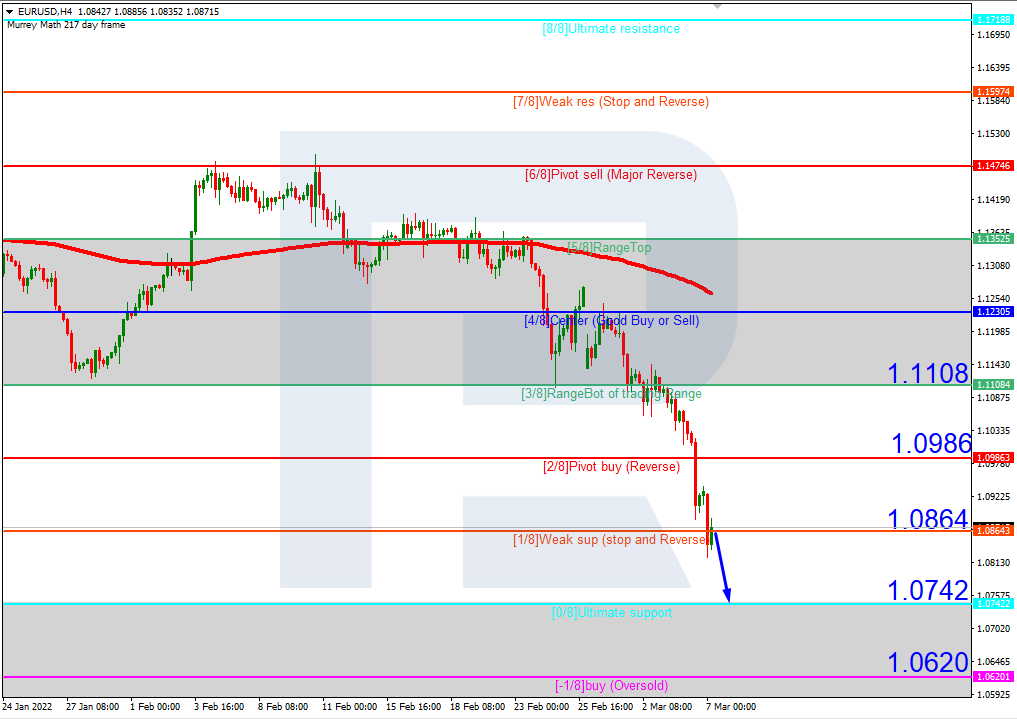
In the H4 chart, EURUSD is trading below the 200-day Moving Average to indicate a possible descending tendency. In this case, the price is expected to continue falling to reach the support at 0/8. Still, this scenario may no longer be valid if the price breaks 2/8 to the upside. After that, the instrument may reverse and correct towards the resistance at 3/8.
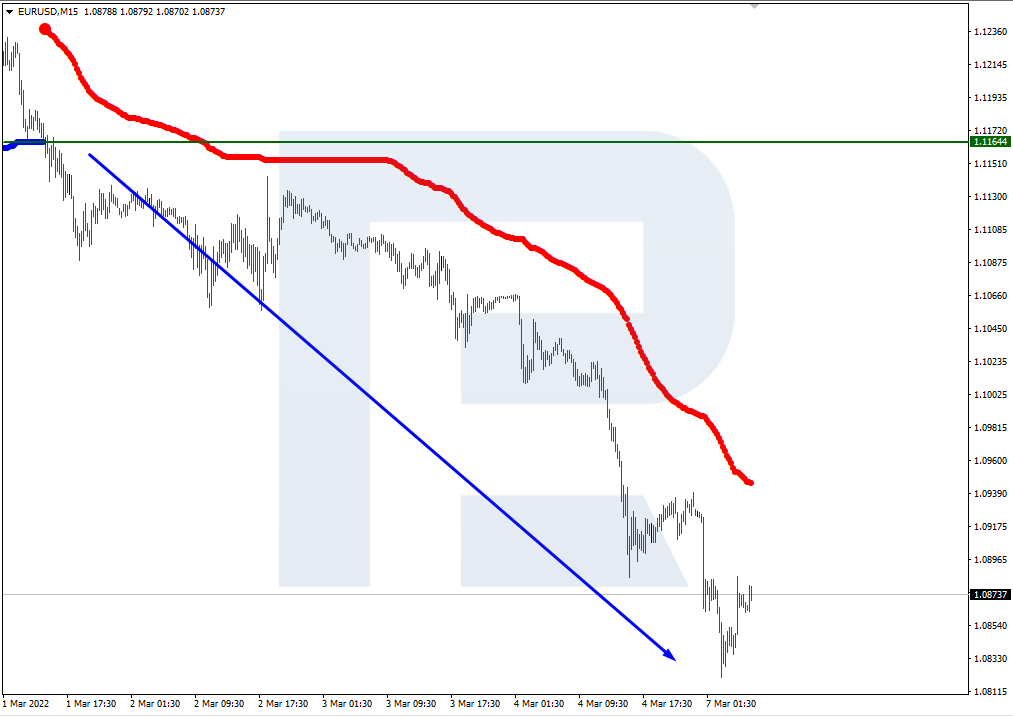
As we can see in the M15 chart, the pair has broken the downside line of the VoltyChannel indicator and, as a result, continue trading downwards.
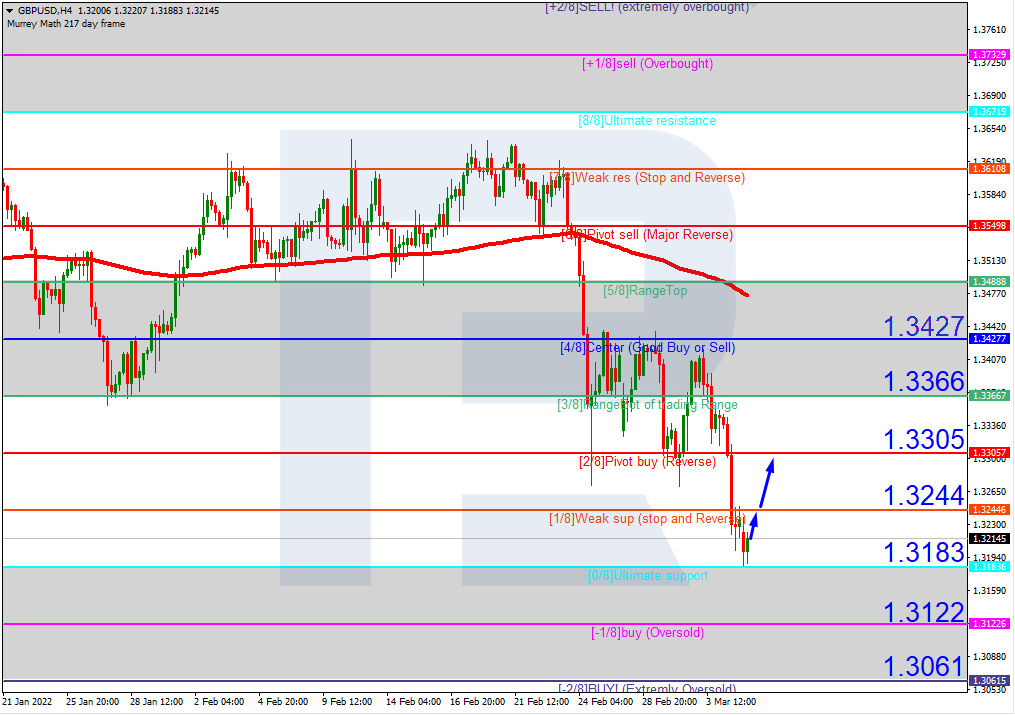
GBPUSD, “Great Britain Pound vs US Dollar”
In the H4 chart, GBPUSD has reached the “oversold area”; right now, it is moving close to 0/8. In this case, the price is expected to break 1/8 and then grow to reach the resistance at 2/8. However, this scenario may no longer be valid if the price breaks the support at 0/8 to the downside. After that, the instrument may continue falling towards -2/8.
As we can see in the M15 chart, the upside line of the VoltyChannel indicator is pretty far away from the price, that’s why the pair may continue trading upwards only after breaking 1/8 in the H4 chart.
Attention! Forecasts presented in this section only reflect the author’s private opinion and should not be considered as guidance for trading. RoboForex LP bears no responsibility for trading results based on trading recommendations described in these analytical reviews.
From a fundamental point of view, the European currency now has no triggers for growth as investors buy the US dollar as a protective asset. At the same time, the ECB is unlikely to tighten monetary policy due to new inflationary risks caused by Russia’s invasion of Ukraine.
Trading recommendations
Support levels: 1.0823, 1.0633
Resistance levels: 1.0921, 1.1001, 1.1061, 1.1213
From the technical point of view, the trend on the EUR/USD currency pair on the hourly time frame is bearish. The MACD indicator is in the negative area, but there are still signs of divergence to the buying side on several timeframes. The price has reached the support level of the higher time frame. Under such market conditions, it is best to look for sell trades on intraday time frames from the resistance level of 1.0921. Buy trades should be considered from the support level of 1.0823, but only after additional confirmation in the form of a buyers’ initiative.
Alternative scenario: if the price breaks out through the 1.1061 resistance level and fixes above, the mid-term uptrend will likely resume.
News feed for 2022.03.08:
– German Industrial Production (m/m) at 09:00 (GMT+2);
– Eurozone GDP (q/q) at 12:00 (GMT+2).
The GBP/USD currency pair
Technical indicators of the currency pair:
Prev Open: 1.3220
Prev Close: 1.3103
% chg. over the last day: -0.89%
The British pound is also now under pressure due to the growth of the dollar index. Yield spreads on the UK and US government bonds are currently declining, putting pressure on the British pound.
Trading recommendations
Support levels: 1.3091
Resistance levels: 1.3175, 1.3274, 1.3315, 1.3418
On the hourly time frame, the trend on the GBP/USD currency pair is bearish. Volatility is high, sellers’ pressure is still there, but the MACD indicator shows a divergence towards long deals. Under such market conditions, buy trades should be looked for from a daily support level of 1.3091, but preferably with additional confirmation. The resistance level of 1.3175 is good for sell deals, but only with additional confirmation in the form of sellers’ initiative.
Alternative scenario: if the price breaks out through the 1.3315 resistance level and fixes above, the mid-term uptrend will likely resume.
There is no news feed for today.
The USD/JPY currency pair
Technical indicators of the currency pair:
Prev Open: 114.91
Prev Close: 115.28
% chg. over the last day: -0.32%
The Japanese yen and the US dollar are safe-haven currencies. Since there are currently no prospects for ending the war in Ukraine, investors are buying the yen as a protective asset against inflationary risks. At the same time, it should be remembered that the policy of the Japanese central bank is now aimed at making the Japanese yen cheaper (USD/JPY growth), and the US Federal Reserve will begin to tighten monetary policy this month. As a result, the USD/JPY currency pair is trading in a wide price range.
Trading recommendations
Support levels: 115.13, 114.71, 114.41
Resistance levels: 115.69, 116.32
The medium-term trend on the USD/JPY currency pair is bullish, but the structure is flatter, as the price has no single dynamics and the price is trading in a wide corridor. The MACD indicator has become positive, and long positions prevail inside the day. Under such market conditions, it is best to look for buy deals on the lower time frames from the support level of 115.13, but with additional confirmation. Sell deals should be considered from the resistance level of 115.69, but it is better to wait for the reaction of sellers.
Alternative scenario: if the price fixes below 114.71, the uptrend will likely be broken.
There is no news feed for today.
The USD/CAD currency pair
Technical indicators of the currency pair:
Prev Open: 1.2725
Prev Close: 1.2819
% chg. over the last day: +0.74%
The situation on the USD/CAD currency pair remains the same. The Canadian dollar is a commodity currency, so it is highly dependent not only on the monetary policy of the Bank of Canada but also on the dynamics of oil prices and the dollar index. The fundamental picture now is that both the dollar index and oil prices will grow. Investors buy the dollar index as a defensive asset during the war. This month, the Fed will begin to tighten monetary policy, providing additional support to the US currency. Oil prices could rise further as investors continue to hold on to oil contracts for fear of disruption from Russia and as the US considers imposing a ban on oil and gas supplies from Russia.
Trading recommendations
Support levels: 1.2726, 1.2653, 1.2555, 1.2517
Resistance levels: 1.2820, 1.2877
In terms of technical analysis, the USD/CAD currency pair trend is bullish. The price is trading above the moving average lines, the MACD indicator is in the positive zone, but there are the first signs of divergence, which means the growth potential is limited. It is worth trading only with short targets because both oil and the dollar index are inclined to grow now. Under such market conditions, it is better to look for buy deals on the lower time frames from the support level of 1.2726, but it is better with additional confirmation. For sell deals, it is better to consider the resistance level of 1.2876.
Alternative scenario: if the price breaks through and consolidates below 1.2653, the downtrend will most likely resume.
This article reflects a personal opinion and should not be interpreted as an investment advice, and/or offer, and/or a persistent request for carrying out financial transactions, and/or a guarantee, and/or a forecast of future events.